Article

Synergies vs. Clustering Only of Depressive Symptoms in Diabetes and Co-Occurring Conditions: Symmetric Indicators with Asymmetric, Bidirectional Influences in MIMIC Models

by
Richard B. Francoeur
School of Social Work, Adelphi University, 1 South Avenue, Garden City, NY 11530, USA
Symmetry 2022, 14(11), 2275; https://doi.org/10.3390/sym14112275
Submission received: 23 August 2022 / Revised: 22 September 2022 / Accepted: 3 October 2022 / Published: 30 October 2022
(This article belongs to the Special Issue Mathematical Models and Methods in Various Sciences)

Abstract

:
I extend multiple indicators multiple causes (MIMIC) models to unveil unbiased, asymmetric, bidirectional influences using indicators of the same items within variable-defined subgroups. The strategy discerns (1) item-variation in interaction (and derivative) terms that capture synergies and cluster together (formative or causal indicators) from (2) item-variation in duplicate terms when items lack synergy and cluster together only (reflective or effect indicators). An item may reveal either or both influences. These symmetric indicators yield estimates of (1) the unique variation and synergy of each formative indicator within the structural model portion of the MIMIC model (based on moderated regression) and (2) the remaining shared variation in the reflective indicator within the measurement model portion (based on confirmatory factor analysis). I reveal two patterns of comorbidity in disease subgroups of a specific co-occurring condition across a community sample of older adults and in age and gender subsamples. First, as structural model indicators, depressive symptoms may display different synergies as they cluster within a disease subgroup of diabetes and a specific co-occurring condition. As measurement model indicators, depressive symptoms capture non-synergistic clustering within the disease subgroup. Second, diabetes may mediate the co-occurring condition when depressive symptoms lack synergies but cluster within the disease subgroup. Researchers should distinguish both comorbidity patterns, which have different implications. I offer insights for adaptive modeling, conceptualizing and screening symptom clusters, metabolomics, and economic or social monitoring.

1. Introduction

1.1. Limitations of Research on Symptom Clusters and the Call for the Current Study

The statistical methods of factor analysis and cluster analysis continue to dominate research on symptom clusters in disease conditions, especially oncology. These methods and the underlying course of research development that stems from them assume that groups of symptoms that occur together are nonreactive. Untested and largely unquestioned, this assumption does not take into account the extent to which these clusters may be confounded by symptom interactions that reveal synergies when symptoms either react with each other or occur within particular disease contexts or diagnoses [1]. The resulting clusters may consist of a number of symptoms, but it may be difficult to discern which of these symptoms have greater utility as targets for screening and intervention. A few studies have detected symptom interactions when particular symptoms react with each other, but they have not gone so far as to capture synergies of the individual symptoms when they occur more narrowly within particular disease subgroups, or investigate how in revealing these synergies, symptoms also form nonreactive (non-synergistic) clusters with each other [2,3,4,5]. The lack of adjustment for nonreactive clusters may result in the biased detection of synergies. It is also important to resolve these issues now, as they are likely to affect panels of items measured in biomarker and metabolomics studies in the near future.
The current study is novel because it models nonreactive clusters and interactions of symptoms simultaneously, and the synergies revealed can unveil a nexus for targeted screening and intervention for specific symptoms within disease subgroups. The development of the regression-based multiple indicators multiple causes (MIMIC) model to discern synergistic interactions, which may form reactive clusters, from nonreactive clusters, holds promise for symptom, biomarker, and metabolomics research. Next, I will review how the MIMIC model’s specifications have gradually evolved such that they now permit the MIMIC model to meet this purpose.

1.2. The Evolution of Regression-Based MIMIC Modeling in Symptom Clusters Research

MIMIC models that specify all possible pathways across the multiple causes and the multiple indicators are not identified (i.e., they do not have a unique and valid solution). In 2016, Francoeur [6] advanced the use of highly overlapping instrumental variables to obtain an identified model that converges to a solution of unique and valid parameter estimates when the exogenous indicators (the structural model of the left side of MIMIC model) are different from the endogenous indicators (the measurement model of the right side of MIMIC model). In this approach, I created instrumental variables for the four “non-traditional” items of the twenty-item CES-D depression inventory. These non-traditional items were included during the original development of the CES-D inventory in order to optimize its sensitivity and specificity in identifying cases of depression later confirmed in diagnostic interviews. Francoeur specified the instrumental variables to serve as formative indicators (e.g., “people disliked me” in participants with clinically significant depression represented by an overall CES-D score of 16 or higher), and each instrumental variable was completely subsumed within and predictive of its parallel reflective indicator (e.g., “people disliked me” in all participants regardless of the overall CES-D score). Of course, despite the perfect overlap in the parallel indicators when participants experienced clinically significant depression, the variables did not overlap in participants with residual depressive symptoms. On the other hand, the model specified the sixteen traditional items of the twenty CES-D items only as reflective indicators. The formative indicators that predicted these sixteen reflective indicators of depressive symptoms were substantively different variables than those that captured socio-demographic and disease group factors (and not the same variables saved under different names).
Thus, these models were not bidirectional, perfectly predicted models (i.e., the coefficients of determination values, R2, were much lower than one). While we consider these MIMIC models now as identified with unique parameter estimates, they continue to incorporate an indeterminate latent trait or latent construct. An important disadvantage of this indeterminacy concerns the limited transferability of findings for evidence-based practice and the potential for drawing inferences based on ecological fallacies. We can only assume the estimates to hold across the sample or disease subgroup; they are less appropriate for screening whether individual participants within the sample or disease subgroup may be at risk for specific depressive symptoms.
Only recently, in 2021, Francoeur [7] discovered that the same variables (differing in name only) of all twenty CES-D items could be specified as both formative and reflective indicators to obtain identified, strictly bidirectional, and perfectly predictive models (i.e., a coefficient of determination, or R2, equal to one). This perfect fit converted the indeterminacy of the latent trait or latent construct into a determinate weighted index (additive composite) of the formative indicators. This breakthrough not only held in modeling effects across the full sample of participants but also when additional variables were added to the structural model portion of the MIMIC model. These identified, perfectly predicted models (i.e., with an R2 equal to one) consistently occurred after adding one-way variables to the structural model portion of the MIMIC model (to capture two separate disease groups) and their single two-way interaction term (to target the disease subgroup when participants experienced both disease conditions). These disease group and subgroup predictors did not extend further to interact with all twenty CES-D formative indicators. Rather, the MIMIC model specified all twenty one-way CES-D items symmetrically as both formative and reflective indicators, overcoming the need to identify the model by creating instrumental variables subsumed within the non-traditional items.
The bidirectionality of the MIMIC model based on the CES-D items, specified symmetrically as formative and reflective indicators, also served to condition confounding from other unspecified variables, as they are forced to operate through (i.e., be mediated by) the formative indicators of the CES-D items as predictors of the weighted index (additive composite). In disease subgroups with diabetes and heart failure, this new approach with formative indicators confirmed the utility of counterpart MIMIC models with instrumental variables that specified several known confounders (based on the 2016 specification approach in Francoeur [6]), even as there appeared to be limited bias retained from unspecified confounders. From a conceptual and modeling perspective, all unspecified variables and their confounders must occur upstream from, and influence, the formative indicators, as the formative indicators are the closest causal factors of the weighted index, which is an additive composite derived from them. Finally, the determinate nature of the weighted index (additive composite), adjusted for confounding biases, avoids the possibility of drawing conclusions based on ecological fallacies and is more appropriate for the identification of individual participants who may be at risk.
Despite the appropriateness of the regression-based MIMIC model with the same formative and reflective indicators to screen and assess risk in individual participants [7], the transferability of findings still faces limitations because the two disease conditions only interact together (there is only this one interaction term) to capture the disease subgroup when both conditions occur in the same participants. More to the point, this two-way interaction did not extend further to detect synergies in the three-way interactions involving both disease conditions and each of the twenty CES-D formative indicators (along with the additional derivative two-way interaction terms involving only one of the disease conditions and the CES-D formative indicator). A more useful MIMIC model for screening and risk assessment would incorporate these additional formative and reflective indicator terms to detect whether each depressive symptom has a positive synergistic effect within the disease subgroup where both disease conditions occur in the same participants. Multiple, statistically significant, three-way formative indicator terms, each with their own specific synergistic effect, would reveal formative symptom clustering of specific depressive symptoms, while multiple, statistically significant, three-way reflective indicators would reveal non-synergistic clustering of depressive symptoms. Thus, the current study operationalizes a formative indicator symptom cluster to depend on the existence of multiple, statistically significant, three-way formative indicators within a disease subgroup. It revises the concept of a formative indicator symptom cluster in [7], which was based on a pattern of multiple, statistically significant one-way formative indicators. Furthermore, this approach opens up opportunities for analysts to discern two distinct patterns of comorbidity: (1) co-occurring disease conditions that interact together and with specific depressive symptoms to reveal synergies vs. (2) situations lacking synergies in which one disease condition mediates the impact of another disease condition on depressive symptoms. The current study will pursue this objective.
These types of findings would finally begin to answer the call made by Jordanka Kirkova several years ago to distinguish between symptom interactions, which may reveal symptom clusters that involve synergies, and the correlative, non-reactive symptom clusters that have been the preoccupation of symptom cluster research [5]. There is a critical need to demonstrate the viability of regression-based MIMIC models that incorporate these many interaction terms as formative indicators, along with parallel and symmetric multiplicative terms as reflective indicators. These types of findings would also allow analysts to distinguish patterns of disease comorbidity that involve synergy vs. mediation alone in order to inform screening/treatment guidelines and clinical practice in new ways.

1.3. Using MIMIC Symmetry/Asymmetry to Screen Depression in Diabetes Comorbidities

A significant amount of evidence across studies attests that co-occurring depression in diabetes increases risks for vascular diseases and events including atherosclerosis, cardiovascular disease, heart failure, myocardial infarction, and stroke (see [8] for a review). Diabetes, smoking, hypertension, and other metabolic conditions constitute cardiovascular risk factors that precipitate and sustain cerebral small vessel disease and vascular inflammation, which are factors that lead to reduced cerebral blood flow, blood–brain barrier damage, and endothelial dysfunction. In one possible mechanism of “vascular” depression, these latter factors, along with cerebral small vessel disease, lead separately to white and grey matter lesions, which, along with insufficient social activity and stress/adverse life events, promote depression [9]. Although several guidelines now exist for screening and treatment of depression in diabetes, the lack of uniform standards, assessment tools, and interventions across populations is a major limitation in the transferability of these guidelines to clinical practice. [8]. There remains a critical need to improve screening with more targeted epidemiological evidence as to which depressive symptoms in diabetes have magnified effects (synergies) and which simply cluster together (without synergy) in less heterogeneous populations (such as by gender or age group) and in the context of specific comorbid conditions.
One promising approach to derive the knowledge needed to improve screening involves exploiting duplicate symmetric specifications of depressive symptoms by conducting asymmetric and complementary analyses of their unique and shared sources of variation. As reported in the above review of the regression-based MIMIC model in symptom cluster research, I recently reported a new approach [7] for specifying MIMIC models of panel or survey items, including symptoms, biomarkers, or metabolites, as both formative (causal) and reflective (effect) indicators to derive an additive composite or weighted index across all items. The MIMIC model adjusts for confounding by unknown and unspecified factors that correlate with the formative indicators, in order to obtain unbiased estimates of reflective indicators for items that cluster. These clusters may occur either across a group (e.g., a disease condition) or within more targeted and synergistic subgroups (e.g., co-occurring disease conditions). The approach deciphers and adjusts for background confounding by estimating bidirectional causal pathways of each panel or survey item as part of the process of deriving an additive composite or weighted index across all of the items. However, the main-effects specification of the panel or survey items as one-way terms does not target depressive symptoms within specific disease subgroups, which limits its utility for improving the transferability of guidelines for targeted screening and treatment of depression in individuals with diabetes and specific co-occurring conditions.
The current article extends this approach by exploiting symmetry in an interactive or multiplicative model specification in order to obtain asymmetric estimates from the same data. I use the same CES-D depression symptoms, overall and within a disease subgroup, both in the measurement model portion of the MIMIC model, estimated using confirmatory factor analysis, and in the structural model portion, estimated using moderated regression (refer to the following schematic and notes in Figure 1).
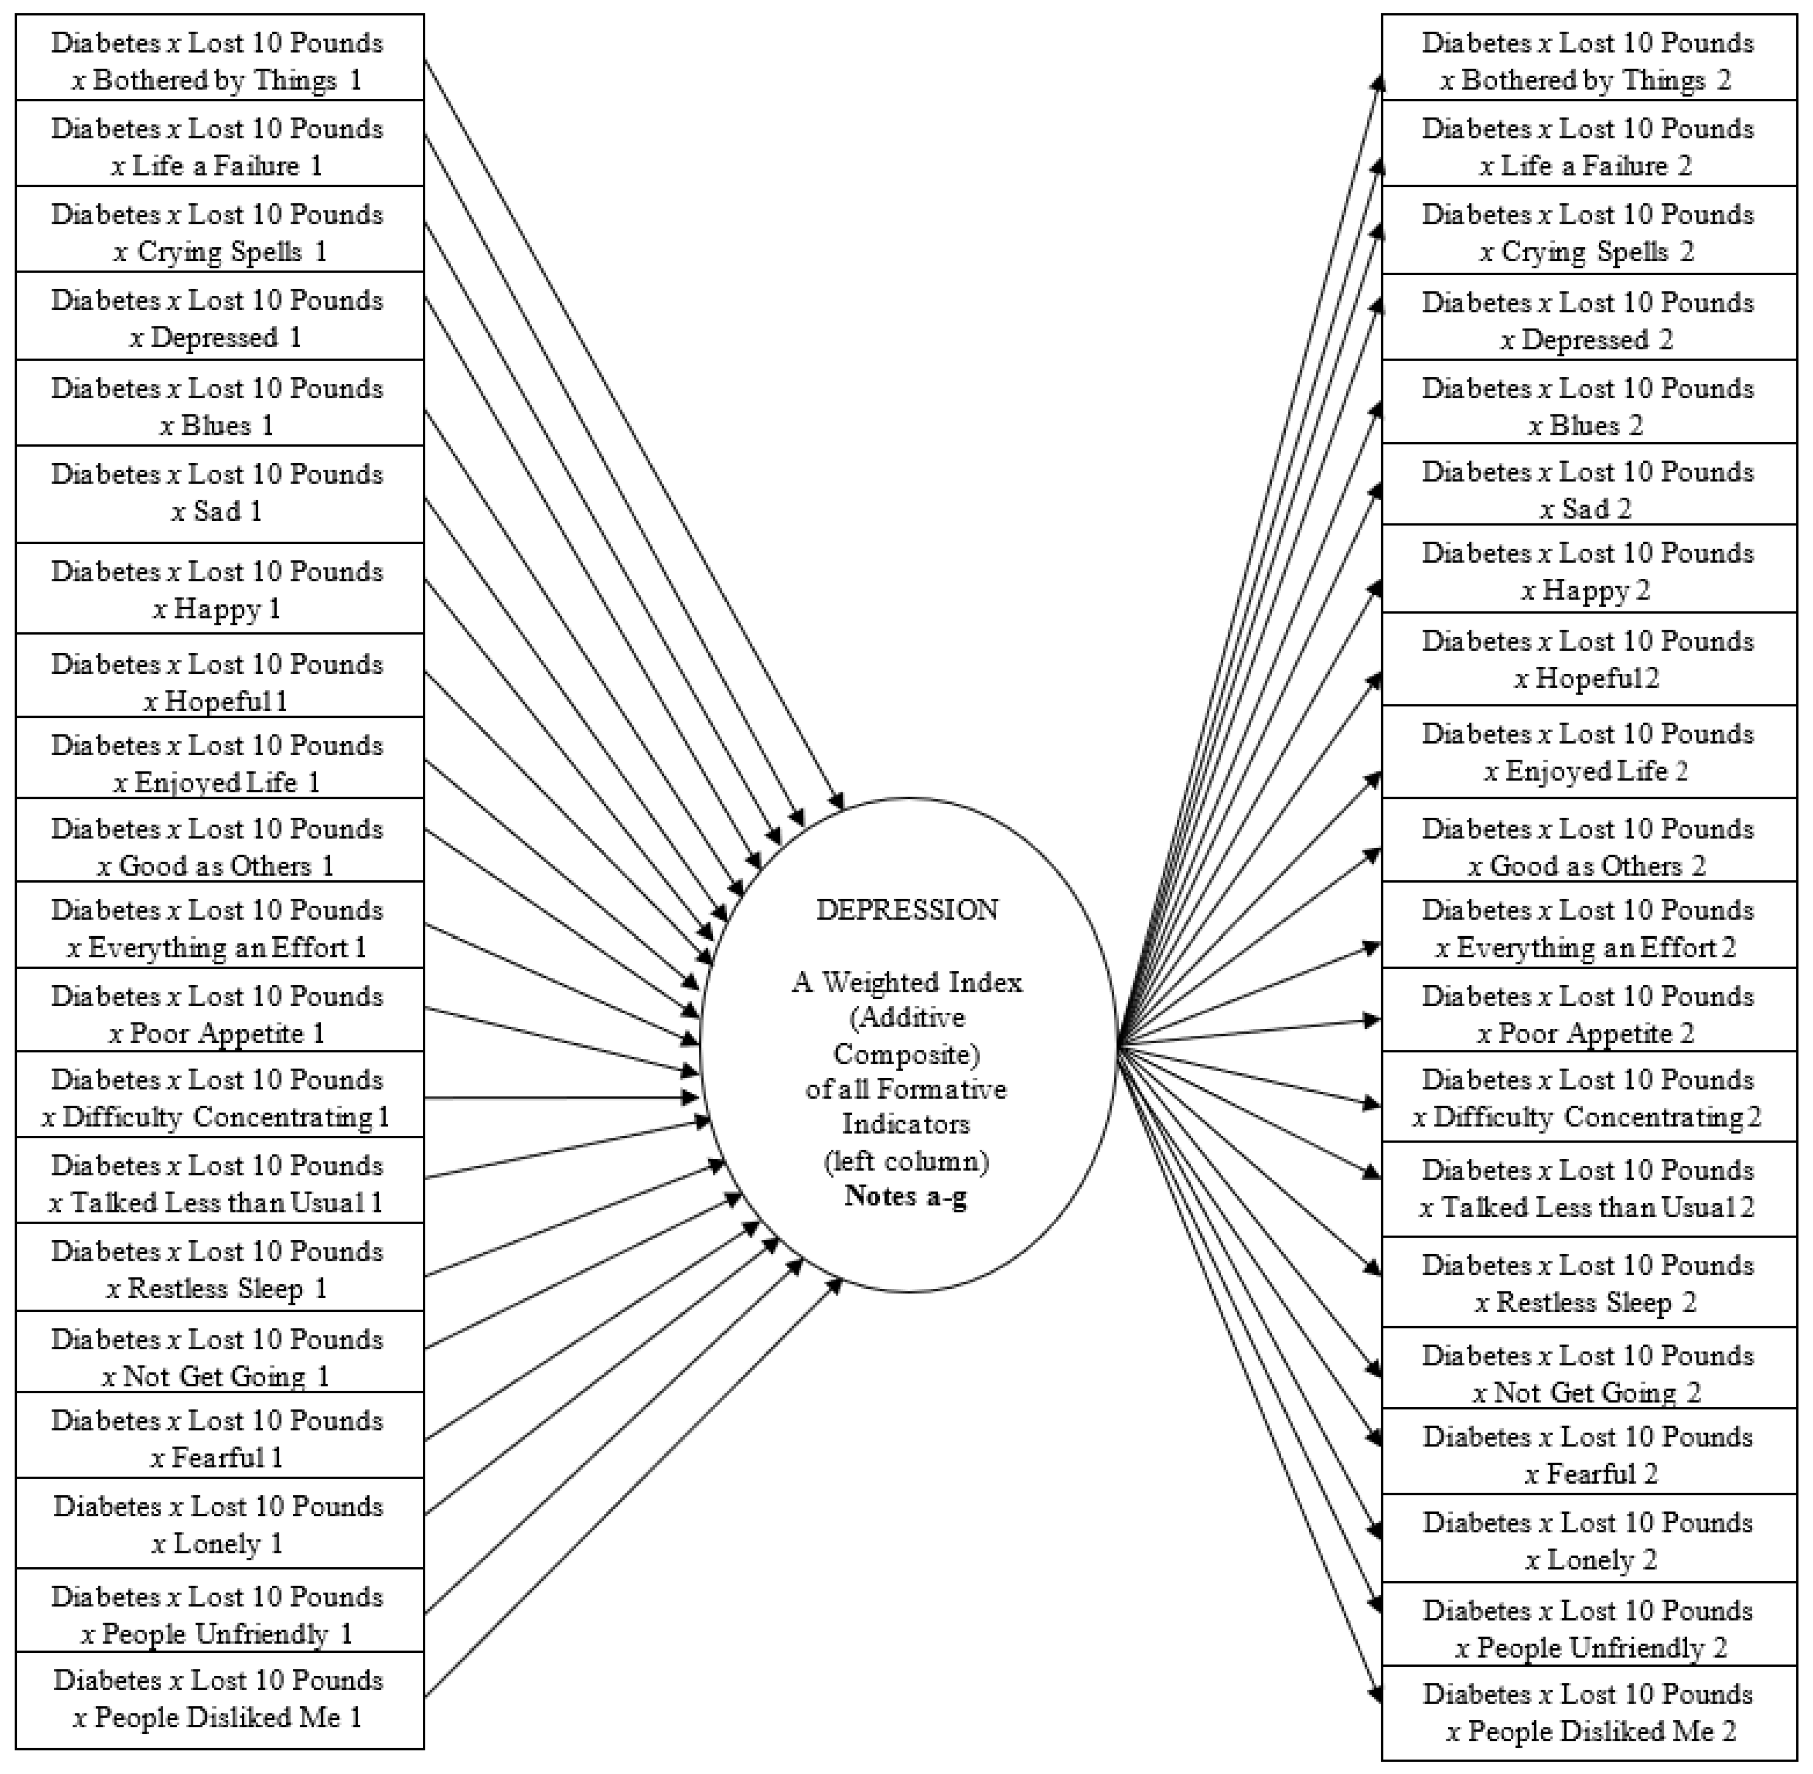
  • The dichotomous predictors (Diabetes, Lost 10 Pounds) represent the presence/absence of the condition. The CES-D indicators are ordinal with five categories. The same variables are components of the three-way interaction terms in the far-left column (estimated using moderated regression) and the symmetric multiplicative terms in the far-right column (estimated using confirmatory factor analysis). The MIMIC model also specifies the derivative one-way terms of these component variables in the structural portion of the model (estimated using moderated regression), and all two-way combinations among them, as both interaction and multiplicative terms, but the figure excludes them to simplify the presentation.
  • Each three-way interaction term reveals the additional effect of synergy when all three components co-occur (i.e., the specific depressive symptom in participants with diabetes who lost ten pounds over the past three months).
  • The symmetric multiplicative term reveals the correlation of those three co-occurring components (in b) to the nonreactive clustering across the depressive symptoms, either targeted only within this overall disease subgroup (even when participants report no depression symptoms), or assessed more broadly across the sample. [In the latter, although the figure excludes the one- and two-way terms to simplify the presentation, the two-way interaction term representing the disease group (Diabetes x Lost Ten Pounds) predicts each one-way non-multiplicative depressive symptom across the sample (later reported in the first footnote of each table)].
  • Synergies and clustering occur after adjusting for endorsement attributed to the overall level of the weighted index (additive composite) of Depression.
  • If we drop the component terms representing the two disease conditions, and the interactions and multiplicative terms involving them, estimates will be for participants across the entire panel sample rather than within the targeted disease subgroup (later reported as the first entry in the initial table).
  • The residual term of the structural model is equal to zero since the weighted index (additive composite) of Depression is perfectly predicted and determinate (non-stochastic). I also exclude arrows to reflect the measurement error terms from each of the CES-D items in order to simplify the presentation.
  • See Figure S1 (in Supplementary Materials) for the appropriate portion of the syntax to run this regression-based MIMIC model in the Mplus software program.
We can view the structural model as providing a different type of estimation of the same specified measurement model, one that captures synergistic effects by formative indicators of an additive composite (weighted index) of overall depression, as opposed to the clustering by its reflective indicators that the measurement model captures. When targeting disease subgroups, the extension incorporates two types of variables. First, it incorporates multiple three-way interaction terms involving the two disease groups and each panel item (along with all derivative two-way interaction terms and one-way non-interaction terms) into the formative indicators. Second, it incorporates the same multiplicative items (saved as different variable names) as reflective indicators. These two types of variables distinguish synergies from nonreactive clusters of depression items in distinct subgroups of diabetes with co-occurring conditions.
I derive the additive composite, or weighted index, of overall depression from the structural and measurement model portions of the MIMIC model by exploiting duplicate and symmetric specifications of the same depression items subjected to separate and asymmetric statistical analyses of their unique and shared variation within the diabetes subgroups. The additive composite (weighted index) incorporates non-normal and asymmetric variation (1) within the distributions of specified predictors (i.e., the determinate portion) and (2) from heterogeneity, multicollinearity, and outliers that would otherwise sequester within the residual term, biasing slope coefficients and their standard errors estimated in the regression model (i.e., the indeterminate or fuzzy measure portion) [7]. This extension of the regression-based MIMIC model is more flexible than ordinary regression in two important respects. First, it incorporates without bias the asymmetrical variation in the outcome, expressed as a weighted index of the predictors. Second, the additive composite (weighted index) incorporates not only a determinate portion, based on unique variation contributed by each predictor, but also an indeterminate portion from fuzzy measurement of heterogeneity, multicollinearity, and outliers that would otherwise lurk within the residual term and bias findings.
The regression-based MIMIC model of formative and reflective indicators of the same symptoms and a weighted composite involves symmetry in specifying the model (in which the same symptoms serve as both formative and reflective indicators). This symmetry in modeling is possible because it incorporates asymmetry into the distribution of the weighted composite, which provides the flexibility to meet the regression assumption that the residual term is normally distributed [10]. An advantage is that the approach does not involve a priori knowledge and fitting of asymmetric distributions to model the data. Asymmetry within and across the data distributions from skewness and kurtosis, influential outliers, heteroscedasticity, and multicollinearity shapes the appropriate and necessary asymmetry incorporated into the weighted composite.
Because the same set of variables serve as predictors within the structural model and outcomes within the measurement model, this bidirectional model adjusts even unspecified confounders, and the latent trait of the MIMIC model is perfectly predicted (i.e., the R2 statistic equals 1) without measurement error captured by a residual term [7]. Thus, this symmetrical model transforms the latent trait to an observed additive composite or weighted index, which affords special properties for improving statistical classifications that have repercussions for unveiling co-occurrences. Some participants may have individual causal indicators captured by the formative indicators while others may have multiple effect indicators of the same survey or panel items captured by the reflective indicators. In particular, this bidirectional model can discern synergies—not just merely clusters—of measurement items within a subgroup, and it permits the analyst to assess clusters across the sample as well as within the subgroup. The analyst can also use this bidirectional model to mediate items experienced in one disease group that also occur in a second disease group (see Appendix A, note 1).
Thus, the multiple advantages of this new approach capitalizing on symmetries in model specification and asymmetries in the data provide a new opportunity to explore the extent to which symptom clusters may actually constitute two types of phenomena. Symptom interactions are formative indicator symptom clusters that incorporate synergy from one or more symptoms within a disease subgroup or with each other. They do not merely co-occur together, as is the case for reflective indicator symptom clusters (see Appendix A, note 2). Research on symptom clusters, however, uncritically assumes and models only reflective indicators to capture symptom clusters [1]. A new direction for research on formative indicator symptom clusters may yield original insights for prevention or intervention.

2. Materials and Methods

2.1. The Sample, Variables, and Estimator

The study uses survey findings from the New Haven, Connecticut subsample of community-residing older adults, one of the sites comprising the Established Populations for the Epidemiological Study of the Elderly (EPESE; unweighted n = 2812). The participants or their proxies (two percent of the New Haven subsample) provided written consent prior to data collection. Francoeur [6] reported characteristics of the sample, measures, and survey methodology. The de-identified, publicly available data were exempt from review by the Adelphi University institutional review board [11].
The Diabetes variable comprises participants with diabetes who do not experience diabetes complications. Diabetes is a component of disease subgroup interactions, and the only term tested as a mediator of another disease group. Other components of disease subgroup interactions, or disease groups mediated by diabetes, include hypertension (with or without medications, suspected), heart attack, heart failure, silent cerebrovascular disease, stroke, post-stroke cognitive impairment, vascular cognitive impairment, the loss of ten pounds, emaciation, excess weight, alcohol consumption, and smoking. As markers of earlier stages of progressive cerebrovascular disease, hypertension and silent cerebrovascular disease excluded participants who also presented with more advanced cerebrovascular disease (stroke, post-stroke cognitive impairment, vascular cognitive impairment). Participants were classified with stroke or post-stroke cognitive impairment when they also experience vascular cognitive impairment (i.e., these three categories are mutually exclusive). In addition to running analyses across the entire sample, I conducted follow-up analyses in four subpopulations (age 65–74, age 75 or older, female, and male).
I used the MLR estimator (maximum likelihood parameter estimates with standard errors that are robust to non-normality and non-independence in complex random samples) in the Mplus software program for structural equations modeling created by Bengt O. Muthén (Los Angeles, CA, USA; Version 5.2.1) in order to execute the MIMIC models [12] (see Appendix B, note 1). I accessed the software through a private license by Adelphi University, Garden City, NY, USA. MLR is the only estimator in Mplus that can accommodate a combined sample of non-independent data from the New Haven community while preserving the generalizability to that community. The combined sample consists of a census (and not sample) of older adults living in public housing for the elderly, a census of older adults living in private housing for the elderly, and a systematic, clustered random sample of older adults living in their own homes. The census data lack independence because older adults in the same public or private housing are likely to know and influence each other, while the sample data lack independence due to the clustered random sampling procedure used to collect the data.
MLR involves maximum likelihood estimation when outcomes are continuous and/or ordinal. For ordinal outcomes, MLR provides ordinal logistic regression estimates as the default and ordinal probit regression estimates as another option (see Appendix B, note 2). MLR is also the only Mplus estimator that accounts for the clustered sampling of non-independent observations in the current study. When clustered sampling is not an issue, observations are independent, and all outcomes are ordinal, other estimators become options as well. For instance, analysts may select the weighted least square mean and variance-adjusted (WLSMV) estimator, which provides ordinal probit regression estimates, although it is less efficient than MLR [12]. There is no analytical solution for maximum likelihood estimators such as MLR, and so Mplus optimizes the fitting function using iterative techniques from numerical analysis, applying a quasi-Newton technique in most situations [12]. The number of iterations, which can vary greatly across MIMIC models, determines the time complexity [13].
Finally, the R2 fit index is available for MIMIC models with ordinal measurement items, such as the four-category CES-D items in the current study; none of the twenty CES-D items contributed highly attenuated levels of variation to the perfect fit (R2 = 1) of the additive composite (weighted index).

2.2. Specifying, Targeting, and Reporting the MIMIC Models

The MIMIC models executed in this study include predictors for up to two disease groups (e.g., Diabetes, Lost 10 Pounds), their subgroup (e.g., Diabetes x Lost 10 Pounds), the twenty CES-D depression symptoms, and all two-way and three-way interaction terms involving the disease group or subgroup with the twenty CES-D depression items. This specification incorporates the full set of terms in a moderated regression framework for the structural model portion of the MIMIC model. The symmetric specification of terms involving symptoms duplicates them as one-, two-, and three-way terms in the measurement portion of the MIMIC model. The specified MIMIC models in the current study have up to eighty-three predictors in the structural model, eighty of which are formative indicators, which match the eighty reflective indicators in the measurement model. The remaining three predictors correspond to Diabetes, the other disease condition, and their two-way interaction. In contrast, the more restrictive MIMIC models in the previous main-effects study of these data [7] only have up to twenty-seven predictors in the structural model, twenty of which are formative indicators, which match the twenty reflective indicators in the measurement model. The remaining seven predictors are for the three disease conditions, including Diabetes and Heart Failure, their two-way interactions, and their single three-way interaction. I included these disease condition interactions to adjust for the confounding of unspecified factors related to them; they also did not interact with depressive symptoms, unlike in the current study.
For presentation purposes, Figure 1 only reveals the highest-order three-way interaction (or multiplicative) terms representing the formative (or reflective) indicators within the disease subgroup (e.g., Diabetes x Lost 10 Pounds x Blues). Thus, Figure 1 excludes all lower-order one- and two-way derivative terms. This decision is justified because I report only the highest-order three-way slopes or lambda values from these analyses. Figure S1 provides the appropriate portion of the Mplus syntax for Figure 1.
These interaction terms in the regression-based structural model are moderator effects that capture synergies when Diabetes (a dummy variable), a comorbid condition (a dummy variable), and a specific depression symptom (an ordinal variable that serves as one of the formative indicators) all occur together. The portion of the interaction between Diabetes and the comorbid condition comprises a disease subgroup of participants with diabetes, while the additional portion of the interaction reveals the specific depression symptom moderated (magnified) within the disease subgroup. To reduce potential for type I error and of findings that are not substantively significant, I only report MIMIC models when at least one three-way formative indicator has a slope greater than 1.5.
When none of the three-way interactions have a statistically significant slope greater than a value of 1.5, there is little or no evidence of synergistic effects by any of the formative indicators. I then switch from seeking moderated evidence of co-occurring symptoms with synergistic effects within disease subgroups to searching for mediated evidence of co-occurring symptoms that merely cluster together within disease subgroups. I exclude the three-way terms from the MIMIC model, both as formative indicators and mirror-image reflective indicators. Diabetes and the comorbid condition remain specified as two separate one-way terms (i.e., not as an interacting disease subgroup), and these one-way terms interact with each of the formative indicators in separate two-way terms, resulting in a two-way model. As a comparison model, I then re-run the model as a trimmed version that excludes the specific two-way interactions involving diabetes with each of the formative indicators (but not the two-way interactions of the other comorbid condition with each of the formative indicators). I run the original and comparison models to test whether diabetes mediates the effect of the comorbid condition on any of the formative indicators or on the additive composite of depression. In mediation, the positive and statistically significant slopes of formative indicators or the additive composite of depression fall considerably (i.e., become attenuated) when comparing the later, trimmed two-way model to the initial (non-trimmed) two-way MIMIC model. In the mediated model, co-occurring diabetes does not act synergistically; it does not moderate (magnify) the effect of the other disease group on the formative indicators or the additive composite of depression, but rather serves to mediate it, as a co-occurring condition of the other disease group. Nevertheless, when there are no moderator effects detected in the overall sample, mediation may be a signal that synergy occurs only within subpopulations of the data. Thus, I re-run the moderated MIMIC models in the subpopulations of males, females, those aged 65–75, and those aged over 75.
In Figure 1, the twenty CES-D formative indicators and their separate interactions by the disease group or subgroup predictor(s) predict the weighted index (additive composite) of Depression. These formative indicators and their interactions also serve to capture unspecified confounding factors and adjust the weighted index to account for them.
In each MIMIC model, there are separate reflective indicators (1) targeted within disease groups (Diabetes, Lost 10 Pounds) and their subgroup (Diabetes x Lost 10 Pounds) and (2) across the overall sample. The moderator regression of the structural model portion not only tests the moderator effect of the depressive symptoms within disease groups and subgroups [1] but also specifies direct effects from the predictor(s) of the disease group or subgroup to the reflective indicators across the overall sample [2]. I do not include the latter type of pathways in Figure 1 but list them in the footnotes of each of the tables in the Results section.
In Figure 1, the left column of specified predictors include the specified disease subgroup terms (i.e., Diabetes, Lost 10 Pounds, Diabetes x Lost 10 Pounds) followed by the formative indicators. The latter also include interactions of the formative indicators and the two disease group terms. Because R2 = 1 in this MIMIC model, the residual term in the structural (regression-based) model portion to the left of the additive composite equals zero and drops out of the model. If the formative indicators are unspecified, this residual term would be a non-zero distribution and correlate with the disease subgroup terms, sequestering confounding variation in the form of influential outliers, heteroscedasticity, and multicollinearity. However, with the formative indicators included in Figure 1, I incorporate the confounding variation into the slopes of the formative indicators, which shifts the slopes of the disease subgroup terms. It is also important to note that the model bases the additive composite (weighted index) not only on the predictive terms across the formative indicators but also those across the disease subgroup. Thus, the model now properly incorporates the confounding variation from the residual term (in the regression for the structural model without formative indicators) into the full set of predictive terms and therefore into the generated weighted composite, which fully captures the unique variation across the predictors. The formative indicator predictor now captures the total variation (R2 = 1), including variation previously in the residual term (i.e., in the MIMIC model that does not specify the formative indicators, where R2 < 1). Thus, the formative indicator predictors simultaneously (1) mediate all confounding factors and (2) constitute formative symptoms and symptom interactions (see [7]).

2.3. Asymmetry and Symptom Clusters

The weighted composite in Figure 1 also captures the shared variation across the predictors, captured by the measurement (confirmatory factor analysis-based) model to the right of the additive composite. The reflective indicators to the right of the additive composite are the same depression symptoms, also targeted multiplicatively within the disease subgroups (they are not technically interactions as they do not produce synergies), which were specified as formative indicators to the left of the additive composite (but with different variable names). In this respect, the MIMIC model has translational and reflective (mirror image) forms of symmetry, described below. However, the moderated regression in the structural model requires specification of the disease subgroup variables (Diabetes, Lost 10 Pounds, and Diabetes x Lost 10 Pounds) at the top of the left column (prior to the formative indicators, not shown in Figure 1). They do not appear separately as well in the right column, which consists only of reflective indicators. In this respect, the model is asymmetric. Nevertheless, each of the disease subgroup variables predict not only the additive composite but also each of the one-way (non-multiplicative) reflective indicators on the right side of the model (not shown), which together reveal the symptom cluster across the overall sample predicted by the disease subgroup. Each of the disease group variables also predict each of the multiplicative reflective indicators on the right side of the model. In the latter, the reflective indicators of interactions by the disease subgroup with each depressive symptom capture another symptom cluster within the disease subgroup, a more targeted clustering newly afforded by this special symmetric/asymmetric MIMIC model.
This extended modeling of the shared variation within the disease subgroup by confirmatory factor analysis in the measurement model is possible for two reasons. First, the full set of specified predictors (the disease group/subgroup terms and the formative indicators) is not fully symmetric with the reflective indicators. Even though the formative indicators are symmetric in variation with their parallel reflective indicators, the MIMIC model specifies the disease group/subgroup terms only within the regression portion and not the measurement portion of the model. Second, the reflective indicators now capture the shared variation in the left side of the model sequestered within the predictor variables that capture the disease groups and subgroup (Diabetes, Lost 10 Pounds, and Diabetes x Lost 10 Pounds). The lack of absolute symmetry in specification between the left and right side of the MIMIC model allows for differences in assigning (1) unique variation to each predictor in the regression portion and (2) shared variation across reflective indicators that constitute symptom clusters in the confirmatory factor analysis portion. This asymmetry allows not only for the prediction of sample-wide symptom clusters by the disease subgroup but also for their presence within each disease subgroup in a more targeted manner, sharpening sample-wide symptom clusters to consist only of symptoms within the disease subgroup that are statistically significant in their clustering within it.
Two or more statistically significant formative indicators indicate symptom combinations that indicate a greater risk or propensity for experiencing a higher level of the additive composite and even its statistically significant reflective indicators that comprise a symptom cluster. Thus, the statistically significant formative indicators may even capture co-occurrences of dissimilar symptoms that may interact earlier together as part of a causal process, resulting in synergies that may be a nexus for intervention. This causal process unfolds to generate or precipitate the reflective symptom cluster of similar symptoms that result as an effect of the causal process (see Appendix B, note 3). These dissimilar symptoms may interact and produce synergies that do not occur among reflective indicators of more similar symptoms that comprise a symptom cluster (see Appendix B, note 4).
The regression-based ordinal logit MIMIC model with the same items as both formative and reflective indicators automatically incorporates the skewness and non-symmetrical variation in the endogenous (y) distributions reflected through multicollinearity, outliers, and heteroscedasticity. Because the R2 value of one reflects an additive composite or weighted index (and not a latent trait), it entirely accounts for this skewness and nonsymmetrical variation. The regression-based ordinal logit MIMIC model avoids the need to select a statistical distribution in advance of modeling, but rather, it uses the symmetrical and non-symmetrical properties of the data to generate the optimal distribution.
For any given depression symptom within a disease subgroup (e.g., in Figure 1), the three-way formative indicators interaction term serves to partial out the irrelevant variance within the disease subgroup by excluding those subgroup participants that do not endorse the depressive symptom. Compared to the more restrictive main-effects model, these three-way interactions are additional formative indicators that may even influence the additive composite or weighted index of overall depression. The cluster of the mirror-image multiplicative reflective indicators may also influence the additive composite or weighted index. This more finely tuned specification, which generates a more accurate additive composite or weighted index, means that the disease subgroup is more likely to predict a statistically significant cluster of these additional reflective indicators, which accounts for the remaining shared variation previously captured by the statistically significant additive composite or weighted index of overall depression.
The current study investigates these extended MIMIC models in different disease subgroups to assess whether synergistic formative symptom clusters may be common, which would suggest they play an important role.

2.4. Asymmetric, Complementary Variation in Symmetrically Specified MIMIC Models

The same variables are specified in the two partitions of the MIMIC model (i.e., the multiple regression versus confirmatory factor analysis), which informs the notion of symmetry within the study. However, the two partitions incorporate different portions of the distributions (unique vs. shared) within each variable; therefore, the model and modeling are asymmetric. We can think of symmetry in the model specification of variables and their overall data distribution, but of asymmetry in the portions of their distributions (e.g., unique vs. shared) which are analyzed in separate model partitions by different statistical procedures (e.g., regression vs. confirmatory factor analysis). Thus, symmetry in statistics and data science is not limited only to describing the shape of a data distribution but can refer to a duplicate model specification of the same variables, analyzed conjointly and simultaneously, yet asymmetrically, by different statistical procedures which capture different parts of the overall symmetric data distribution for each duplicated variable (see Appendix B, note 5).
The R2 statistic or coefficient of determination is a scale-invariant statistic that gives the proportion of variation in the target variable (the determinate weighted composite) explained by the structural (regression) portion of the MIMIC model. The fact that it estimates perfectly (equal to one with zero as the standard error) converts what would be an indeterminate latent construct into the determinate portion of a weighted index (additive composite). This leaves the remaining indeterminate portion of the weighted composite for the reflective indicators to capture in the measurement (confirmatory factor analysis) portion of the MIMIC model. This novel, careful partializing of the determinate from indeterminate components of the weighted index between the structural (regression) and measurement (confirmatory factor analysis) portions of the MIMIC model preserves the symmetric relation between the formative and reflective indicators of the same CES-D depression item at the level of the individual observations [8]. In other words, it does not hold only across the data, as in covariance-based approaches to MIMIC estimation. This regression-based MIMIC model is also novel in that it incorporates both classical and fuzzy measurement through duplicate specifications of the same measurement items as formative and reflective indicators.
These symmetric relations from the perspective of the same corresponding specified variables represent asymmetric partializing of variation (i.e., unique vs. shared) and are therefore determinate in nature. The reflective indicators in the endogenous portion of the MIMIC model capture heteroscedasticity, multicollinearity, and outliers that would otherwise be sequestered in the residual term if the exogenous portion of the MIMIC model had been run as a multivariate regression (i.e., predicting the multiple reflective indicators in the absence of specifying the weighted index (additive composite)). This clever strategy avoids the correlated variation that specified predictors would otherwise share with variation sequestered in the residual term, resulting in a bias in the estimated slope coefficients and their standard errors. Finally, the preservation of the symmetric relationship via achieving a perfect-fitting model (R2 = 1) does not mean it is only necessary to model half of the MIMIC model, in contrast to other approaches for modeling symmetry. It is necessary to model the entire model when there are symmetric relations involving the exogenous and endogenous portions of a regression-based MIMIC model.

2.5. Properties and Superiority of MIMIC Models for Internal and External Validity

The novel MIMIC framework in this study incorporates the traditional specification of moderated regression in modeling the formative indicators within the structural model, in which I first specify all one-way terms, all possible two-way interactions based on them, and finally, the three-way interaction terms of diabetes, the co-occurring condition, and specific depressive symptoms. A positive and statistically significant slope for at least two three-way interaction terms reveals a formative indicator symptom cluster by the multiple symptoms. Each symptom within the formative indicator symptom cluster contributes a synergy unique to that symptom within the disease subgroup. Thus, even though these symptoms cluster together within the same participants, the symptoms differ from each other in terms of the synergies they each contribute.
In modeling the reflective indicators in the measurement model portion, the MIMIC model also includes a parallel, duplicate specification of the one-way terms and the two- and three-way multiplicative terms. I use the term “multiplicative” rather than “interaction”, as the terms only target the reflective indicators to capture their non-synergistic influence within the disease groups, and more narrowly still, within the disease subgroup. In each MIMIC model, I fix the measurement loading (λ) of the reflective indicator for the CES-D item Depressed to one in order to set the metric of the measurement model.
I estimate the formative indicators of the structural model and the reflective indicators of the measurement model simultaneously in a single execution of the MIMIC model. Although it is common for analysts to take advantage of high leverage points (unusual values of independent variables that demonstrate disproportionate “pull” or leverage on the estimated regression slope) to obtain estimates for these models, the validity of these estimates depends on the validity of the specified model in the first place. Unbiased leveraging from MIMIC models depends on the derivation of a perfectly predicted, determinate, weighted index or additive composite, in contrast to an imperfectly predicted and indeterminate latent construct or latent trait. The determinacy of the weighted index or additive composite is necessary to partition competing sources of variation into one-way formative indicators and their formative indicator interactions (to capture synergies) versus symmetrical reflective indicators and their reflective indicator multiplicative terms (to capture the remaining variation from clustering). I published this type of bidirectional MIMIC model of the same variables (saved under different variable names) as formative and reflective indicators only recently [7] (see Appendix B, note 6).
With ordinal items, the structural model involves the use of ordinal logistic regression when estimated using a maximum likelihood procedure, as in the current study. When conducting the confirmatory factor analysis of the measurement model separately from the moderated regression of the structural model, the ordinal logit estimates from the structural model do not influence the generation of the latent variables behind the manifest indicators of the confirmatory factor analysis. Such influence would have allowed the reflective indicators to apply at the level of individual participants (see Appendix B, note 1). Because the confirmatory factor analysis generates an indeterminate latent construct and not a determinate index, the results from the measurement model at the aggregate level may not be valid at the level of individual observations and are less appropriate for screening individuals who may be at risk, which may result in ecological fallacies. Thus, the two procedures are no longer consistent at the level of individual observations and the index captured by the structural model is not equivalent to the latent construct captured by the measurement model. The extent to which this may occur may depend on the properties of the specific data.
Furthermore, in the absence of estimating the measurement model simultaneously, the index can only be unweighted and thus is biased: it does not properly allow for the shared variation in the unbiased weighted index that the measurement would have assigned. The unweighted index is a sum score of the items that has less ecological validity than the unbiased weighted index because the unbiased weighted index is also influenced in its generation by the shared variation captured by the simultaneous confirmatory factor analysis (for a related discussion, see [14]). This bias is usually likely to be an issue regardless of the properties of the specific data (i.e., except only when the weighted index happens to be equivalent to the unweighted index). A unidirectional ordinal logistic regression that did not incorporate the opposite causal pathway (the measurement model) in a bidirectional regression-based MIMIC model would require the analyst to specify a priori an unweighted index of the CES-D depression inventory, because we cannot obtain a weighted index in the absence of the measurement portion of the MIMIC model. Because it is arbitrary, the unweighted index would likely bias the formative indicator estimates. Finally, the derived unweighted index would not be determinate, but rather an indeterminate latent trait, because the R-square value would not equal one. The indeterminate construct or latent trait is a fuzzy measure that does not hold strictly at the level of individual observations, only for the disease group or subgroup at large. Thus, findings would be less transferable to screen individuals at risk, which would result in ecological fallacies that would work against the sensitivity and specificity of screening efforts.
It is best to retain the information from influential outliers and model them properly as symmetrical formative indicators in a regression-based MIMIC model (see Appendix B, note 7). Using a maximum likelihood estimation procedure and ordinal logistic regression in the structural model, the formative indicators predict the weighted index, which is ordinal as it loads onto ordinal logistic latent variables behind the manifest items in the confirmatory factor analysis of the measurement model. Of course, the formative indicators would not necessarily capture all of the outliers in the confirmatory factor analysis. This possibility may be more likely to occur in a less flexibly specified model without interaction or multiplicative terms, such as the main-effects bidirectional MIMIC in [7], in which the same outlier observations might occur in both the structural and measurement portions of the MIMIC model.
The structural model regression procedure can predict unique variation from outliers in formative indicators of individual items or their interactions that would otherwise bias measurement model estimates when performing confirmatory factor analysis separately. Ordinal regression procedures incorporate greater flexibility than regression procedures with continuous outcomes in achieving nonbiased estimates [15,16,17,18]. Ordinal regression procedures exploit the additional modeling flexibility inherent in ordinal measurement of reflective indicators, and the weighted index they reflect in order to engender skewness and influential outliers from shared variation into the weighted index, which the parallel reflective indicators can capture. Otherwise, this shared variation would contribute multicollinearity in the structural model because the measurement model does not capture it. Given the exogenous/endogenous distinction of the structural vs. measurement portions of the regression-based MIMIC model, multicollinearity (overlapping intercorrelations across the predictors and combinations of predictors) naturally occurs in the regression-based structural portion, even in the case of perfect-fit (R2 = 1) results. However, the generated weighted index reflects this multicollinearity, which allows reflective indicators in the measurement portion to capture it in its entirety.
Confirmatory factor analysis conducted separately, outside of the regression-based MIMIC model, analyzes a summative correlation matrix with standard deviations, or an equivalent covariance matrix. However, outliers, even a single outlier, can bias correlation estimates [19,20]. In these situations, analysts should reveal and drop influential outlier observations that contribute most to multivariate skewness and kurtosis in order to improve the validity and trustworthiness of the clustering detected by the confirmatory factor analysis. However, analysts achieve this at the expense of limiting its generalizability across the sample [21], which may compromise the utility of the confirmatory factor analysis to screen individuals at risk or monitor them during treatment. (See Appendix B, note 8). The regression-based MIMIC model is a better approach because it retains influential outlier observations that would otherwise afflict the set of reflective indicators in a separate confirmatory factor analysis (measurement model) and models them instead as influences and synergies within a symmetric, parallel, and simultaneous set of formative indicators (structural model). This more inclusive modeling is important when testing many symptoms that constitute a panel or inventory, because even minor biases in estimating indicators of individual symptoms may compound with those of other symptoms and have repercussions throughout the estimated model. Ultimately, formative symptoms/symptom clusters detected within diabetes and specific co-occurring conditions can direct clinicians to target the screening, monitoring, and intervention of similar individuals and the same or a similar nexus of key depressive symptoms, resulting in a better translation of guidelines into clinical practice.

3. Results

Table 1 and its footnotes report statistically significant findings of formative and reflective depressive symptom indicators within disease subgroups, across the full and representative New Haven EPESE sample of older adults, and Table 2 and Table 3 report the findings within gender and age subgroups. The first analysis across the full sample in Table 1 does not target a particular disease group or subgroup. Although it reveals all formative and reflective indicators to be less than one, all of the formative indicators are statistically significant (as are the reflective indicators), in contrast to only some of the formative indicators within each disease group or subgroup, either across the sample or by gender or age group.
All of the remaining analyses in Table 1, Table 2 and Table 3 target a particular disease group or subgroup. To prevent the effect of chance and type I error, the tables only report findings when at least one formative indicator slope that reveals symptom synergies within the disease group or subgroup exceeds 1.5. Based on this restriction, the disease subgroups that remain robust across the heterogeneous full sample make sense: Diabetes x Hypertension with Medication is a common reflection of the metabolic syndrome, and the disease subgroup Diabetes x Lost Ten Pounds reflects weight loss as a biomarker of advancing or progressing diabetes. In both disease subgroups, Table 1 reports (1) three-way formative indicators in which the disease subgroups interact together and with each of several CES-D symptoms (i.e., formative symptom clustering) as well as (2) three-way reflective indicators across all CES-D symptoms (i.e., reflective symptom clustering).
Although diabetes also interacts with other disease subgroups in the full sample, Table 1 does not report them because none of the slopes exceeds 1.5. These disease subgroups include cancer; heart attack; hypertension with medication; hypertension without medication; suspected hypertension; hypertension either suspected or without medication; and silent cerebrovascular disease. However, these and other diabetes interactions with disease groups reveal significant slopes that exceed 1.5 within Table 2 and Table 3 that report findings within more targeted participant subpopulations by gender (females, males) and age (age 65 to 74, and age 75 and older), respectively. Thus, the significant yet restricted interactions across the full sample may be due to their significance within one of more of these subpopulations.
I report all findings of the mediated effects in the full sample (Table A1) and the subpopulations (Table A2 and Table A3) in Appendix C. However, the decision to report the mediated findings in an appendix does not mean that the findings within participant subpopulations are less important than the moderated findings, and I address them in the main text as results and later in the discussion.
Some analyses reveal that diabetes does not moderate, but rather mediates, heart disease, advanced cerebrovascular conditions, and cancer, which suggests that we can attribute overall depression in these situations to the co-occurrence of diabetes in participants with both conditions. In Table A1, diabetes mediates stroke, the combination disease group of stroke or post-stroke cognitive impairment, and vascular cognitive impairment. On the other hand, along with the mediation by diabetes of vascular cognitive impairment, the more targeted subgroup of vascular cognitive impairment without diabetes interacts with several formative indicator symptoms. Table A1 also reveals that diabetes mediates emaciated condition and alcohol consumption. Table A2 reveals that diabetes mediates heart attack in males. Finally, Table A3 reveals that diabetes mediates (1) stroke in the age 65–74 subgroup and separately in the age 75 and older subgroup and (2) the combination disease group of stroke or post-stroke cognitive impairment in the age 65–74 subgroup and separately in the age 75 and older subgroup. Diabetes also mediates (1) vascular cognitive impairment in the age 75 and older subgroup and (2) cancer in the age 75 and older subgroup.
The main bodies of Table 1, Table 2 and Table 3 list only the measurement loadings of the highest-order multiplicative reflective indicators within the disease group or subgroup, which reflect the clustering of depressive symptoms within the disease group or subgroup. However, the MIMIC model specification also estimates the measurement loadings for the derivative lower-order multiplicative reflective indicators and the non-multiplicative reflective indicator. With regard to the non-multiplicative reflective indicators, discussed previously in the Materials and Methods section, the MIMIC model specification reveals not only the clustering of depressive symptoms across the full sample (or gender or age subsamples) but also whether the disease group or subgroup significantly predicts these loadings across the full sample. Recall that there are separate prediction pathways from (1) the predictor terms representing each disease group and (2) the interactive disease subgroup, which lead to the non-multiplicative reflective indicators, not shown in Figure 1. I list these loadings across the full sample or gender or age subsamples in the first footnotes of Table 1, Table 2 and Table 3.

4. Discussion

4.1. Interpreting Findings to Improve Screening

Across the full sample or within the gender or age subgroups, diabetes tends to moderate depressive symptoms in two groups. The first group involves cardiovascular disease (heart attack in females and in those over the age of 74; heart failure in females and in those over the age of 74; excess weight in males and in those aged 65–74; and smoking in males, in females, and in those aged 65–74). The second group involves less progressed cerebrovascular disease (hypertension with medication, hypertension in males, hypertension in each age group, hypertension with no medication in each age group, and silent cerebrovascular disease in males and in those aged 65–74). At the same time, diabetes tends to mediate depressive symptoms in other cardiovascular disease subgroups (heart attack in males, alcohol consumption) and in more progressed cerebrovascular conditions (stroke/post-stroke cognitive impairment and in each age group, vascular cognitive impairment and in those over the age of 74).
The presence of synergies of depressive symptoms in diabetes subgroups in less progressed cerebrovascular disease suggests the potential for prevention and to slow progression may be more effective in earlier stages of cerebrovascular disease. Broadly speaking, diabetes mediation of more progressed cerebrovascular conditions suggests that while relief of depressive symptoms is an important goal, it could have less of an impact on disease progression across these participants in the presence of diabetes. However, this may not be true for individual participants and in cerebrovascular disease groups when diabetes does not also occur (stroke with no diabetes (over the age of 74) and vascular cognitive impairment with no diabetes). For instance, compared to the overall group of vascular cognitive impairment, the greater magnitude of slopes for depressive symptoms in vascular cognitive impairment with no diabetes provides support for distinctive phenomenology from vascular depression, a condition in which treatment of depressive symptoms may improve vascular cognitive impairment or slow the deterioration from it.
The literature provides growing support for diverse interactions of diabetes with a wide range of comorbid medical conditions and risk factors. For instance, “increasing evidence supports the view of myocardial infarction as a systemic disease with multiple layers of inter-organ communication between the heart and the immune system, glucose and fat metabolism, and other organs… These systemic interactions are also involved in the impact of comorbidities and co-medications on the acute and chronic outcome of myocardial infarction.” [22] (p. 2350). Recently, Francoeur [7] unveiled several multimorbidities related to depressive symptoms from co-occurring diabetes and heart failure involving other related metabolic and vascular conditions, and the current study also reveals diabetes with separate comorbidities involving heart failure, hypertension, excess weight, or progressive cerebrovascular conditions. The current study detects diabetes interactions with smoking [23,24] and alcohol consumption [25], both addressed in public health campaigns. The current study also suggests that individuals with diabetes who have cancer may have synergies that lead to different symptom clusters than those with cancer alone. Indeed, excess insulin and insulin-like growth factor (IGF-1) not only are features of diabetes and the metabolic syndrome [26] but also promote cancer [27]. The failure to take synergies from comorbid disease conditions such as diabetes and metabolic syndromes into account could be a reason for the lack of evidence that a common biological mechanism links cancer symptoms [28].
Depressive symptoms of glycemic dysregulation occur earlier than the activation of glucose counter-regulatory systems [29]. This consistency implies that the search for significant formative indicators (and their synergies) is useful to consolidate the CES-D depression inventory in order to target only the individual symptoms within disease subgroups that may have the potential to benefit from earlier and more effective diabetes therapy and prevention. Over time, clinicians have linked anger and sadness to circulating blood glucose (hyperglycemia) and nervousness to inadequate circulating blood glucose (hypoglycemia) [30]. This helps explain significant formative indicators of Sad, Depressed, and/or Fearful:
  • In the full sample (Table 1): Diabetes x Hypertension with Medication; Diabetes x Lost Ten Pounds; Stroke/Post-Stroke Cognitive Impairment mediated by Diabetes; Vascular Cognitive Impairment mediated by Diabetes; and Alcohol Consumption mediated by Diabetes;
  • By gender (Table 2): Diabetes x Silent Cerebrovascular Disease (Males); Diabetes x Excess Weight (Males); Diabetes x Heart Failure (Females); Diabetes x Smoking (Females); and Heart Attack mediated by Diabetes (Males);
  • By age group (Table 3): Diabetes x Hypertension (Over Age 74); Diabetes x Hypertension with No Medication (Over Age 74); Diabetes x Silent Cerebrovascular Disease (Ages 65–74); Diabetes x Heart Attack (Over Age 74); Diabetes x Excess Weight (Ages 65–74); Diabetes x Heart Failure (Over Age 74); Diabetes x Smoking (Ages 65–74); Diabetes x Lost Ten Pounds (Ages 65–74); Stroke mediated by Diabetes (Ages 65–74); and Stroke or Post-Stroke Cognitive Impairment (Ages 65–74).
These disease subgroups with significant formative indicators that capture dysphoric mood or nervousness (Depressed, Blues, Sad, Crying, and/or Fearful) may enable earlier and more effective targeting of therapy and prevention.
However, dysphoric mood may be hidden (resulting in masked depression), the item Fearful may be insufficient to target all types of nervousness, and an item that directly captures anger is not included in the CES-D depression inventory. Medications such as hypoglycemic agents and/or anti-depressants may attenuate (or aggravate) these depressive symptoms [8]. Therefore, clinicians should consider several other disease subgroups with significant formative indicators that capture items related to dysphoric mood of low positive affect (Happy, Hopeful, Enjoyed Life), other items that may overlap with nervousness (e.g., Bothered by Things), and items of interpersonal difficulties which are indirectly associated with anger experienced by the participant (e.g., People Disliked Me, People Unfriendly). The current study suggests that these other disease subgroups should include:
  • Within the full sample (Table A1): Emaciated mediated by Diabetes;
  • By gender (Table 2): Diabetes x Hypertension (Males); Diabetes x Heart Attack (Females); and Diabetes x Smoking (Males);
  • By age group (Table 3): Diabetes x Hypertension (Ages 65–74); Diabetes x Hypertension with No Medication (Ages 65–74); Stroke with No Diabetes (Over Age 74); Vascular Cognitive Impairment (Over Age 74); and Vascular Cognitive Impairment (Over Age 74) mediated by Diabetes.

4.2. Modeling and Measurement Insights

The current study extends the duplicate, one-way disease groups and two-way disease subgroups specified only as part of the structural model in this special MIMIC model [7] to interact with each of the formative indicators of depressive symptoms as well. These extensions provide well-honed, finely specified, yet flexible targeting of the shared synergies across participants within each depression item, which allows different levels of synergy across the various CES-D depression items. The inclusion of these multiple interaction terms accounts for some, or even much, of the multicollinearity, outliers, and heteroscedasticity that the model would otherwise attribute to reflective indicators that capture shared effects. The finer specification within the structural model of multiple interaction terms involving the disease groups and subgroups across the CES-D depression items serve to incorporate additional non-overlapping variation that the model would otherwise capture as overlapping variation in the measurement model.
At the same time, the finer specification within the measurement model of multiple multiplicative terms involving the disease groups and subgroups across the CES-D depression items serve to condition slope bias and inflated standard errors away from the structural model by capturing shared and influential variation across depressive symptoms. This shared and influential variation across depressive symptoms includes impacts from outliers, heteroscedasticity, and the multicollinearity of “non-essential ill conditioning” that inflate standard errors of interaction terms [31].
Finally, the one-way formative indicators for a given depressive symptom in [7] and in the current study MIMIC model may serve to capture what would otherwise be uncontrolled confounding. This would leave the multiple one-, two-, and three-way formative indicators for the depressive symptom in the current approach to provide greater flexibility so that the three-way formative indicator is more likely to capture only the synergistic effect of the depressive symptom within the disease subgroup. The lower-order one- and two-way terms would be able to capture confounding factors associated with it. In addition to contextual factors of confounding, these lower-order terms also condition for synergies that occur across each disease condition when they occur separately so that they do not confound the specific synergies that result within the disease subgroup (i.e., when both disease conditions co-occur within the same participants).
Together, these factors help explain why multiple formative indicator interaction terms are statistically significant, whereas only a few of the one-way formative indicators were significant in [7], which did not model multiple interactions across the depressive symptoms. These divergences result even as multiple reflective indicator multiplicative terms occur in both studies.
The model remains symmetrical because counterpart, duplicate multiplicative terms are also added as reflective indicators. The MIMIC model with the same items as formative and reflective indicators captures only the unique variation within each formative indicator (regardless of their number and interactive complexity), leaving the multicollinearity, heteroscedasticity, and influential outliers to be captured by the reflective indicators in the confirmatory factor analysis portion of the MIMIC model. The formative indicators capture the unique variation in each item (with the co-occurring portion of the variation between items that the residual term would have sequestered, captured instead by the reflective indicators of the confirmatory factor analysis). This unique variation in each item interacts in the moderated regression specification (i.e., redundant variation between items cannot interact) and results in the synergy that is captured by the formative indicators.
Collectively, extended MIMIC analyses conducted within several disease groups and in subpopulations by gender or age show that the formative three-way interaction indicators are often statistically significant, which suggests an important role of synergistic formative symptom clusters. The formative indicator interaction terms imply that the items co-occur within the same participants in order for them to interact. Thus, even the unique variation of the formative indicators may constitute targeted symptom clusters of co-occurring, interactive formative indicators with synergistic effects. This interpretation supersedes the tentative observation by Francoeur [7] that symptom clusters may tend to be reflective in nature, based on the findings that many of the one-way formative indicators in that study were not statistically significant. Testing the moderator MIMIC to detect disease subgroup synergies that magnify the influence of formative indicators within the disease subgroup also results in the inclusion of the influence of the competing reflective indicators within the disease subgroup, and thus to a more accurate weighted index of depression. In turn, this more accurate weighted index of depression allows us to capture variation that is more accurate within each of the twenty CES-D reflective indicators predicted by the disease subgroup, which may lead to improved validity in identifying the specific symptoms that constitute the reflective symptom cluster.
The retained, non-adjusted biases from heteroscedasticity, influential outliers, and multicollinearity from unspecified confounders, mediated through the formative (causal) indicators, all contribute variation that results in the perfect model fit. The fact that the R2 equals one means that the latent trait is equivalent to an additive composite or weighted index where the residual term (σ) for the latent trait equals zero. The zero value means that the formative indicators portion of the MIMIC model is not a formative measurement model (i.e., there is no measurement error). Thus, the only measurement model that contributes to the MIMIC model consists of the reflective (effect) indicators.
The lack of a formative measurement model means we cannot attribute synergies involving formative indicators across disease groups or within disease subgroups entirely to the specified scale or panel item because they may also be artifacts of unspecified, uncontrolled confounding (see Appendix D, note 1). Even so, the MIMIC model partials out “nonessential” multicollinearity, shared variation across the highest-order interaction term and its lower-order component terms that collectively contribute to the interaction effect. The sequestering of the variation constituting nonessential multicollinearity from the formative to the reflective indicators conditions away this source of confounding that would otherwise weaken or undermine altogether the valid detection of multiple statistically significant two-way interactions within a disease subgroup that were specified as formative indicators. Finally, although multiple significant formative indicators do not reflect a measurement model per se, they do reveal clustering of symptoms within the same group or subgroup of participants, each with its unique synergistic effect. Simplified modeling is an advantage of the overall clustering of the same items in both the structural and measurement model portions of the bidirectional MIMIC model. It allows for the adjustment for unspecified confounders, influential outliers, heteroscedasticity, and multicollinearity across observations, regardless of whether a separate exploratory factor analysis or cluster analysis (which do not distinguish synergistic from non-synergistic clusters) reveals the items to constitute a single cluster or separate clusters. Even so, studies of Monte Carlo-generated and real data are needed to confirm just how well adjustment occurs in these four dimensions of data distortion.
Curiously, despite the statistical significance of several formative indicators for Diabetes x Heart Failure in the age 75 and older subgroup (Table 3), no reflective indicators are statistically significant, in contrast to the reflective indicators in all of the other reported disease subgroups. I also detected this unique pattern previously in the overall disease group of heart failure [7]. This unique pattern could mean that CES-D items may be direct medical symptoms of these two co-occurring conditions rather than symptoms of depression in this context of medical illness. The absence of the ability to distinguish when a panel item is a medical symptom of physical illness from when it is a symptom of depression could introduce artifacts of unspecified, uncontrolled confounding. In turn, this uncontrolled confounding may lead to significant formative indicators (and formative indicator symptom clusters), but not reflective indicators (nor reflective indicator symptom clusters), in this disease subgroup (see Appendix D, note 2).
To estimate the reflective measurement model, the MIMIC model employs confirmatory factor analysis. Confirmatory factor analysis, in the absence of a MIMIC model that includes a structural model with formative indicators, assumes that the reflective indicators of the measurement model capture a unidimensional latent trait. However, because the additive composite in the MIMIC model incorporates all of the variation from the formative indicators (R2 = 1) and is therefore multidimensional, the confirmatory factor analysis is no longer constrained by the assumption that the observed reflective indicators are unidimensional (i.e., they may capture more than one latent trait). The regression-based structural portion of the MIMIC model encompasses multidimensionality among the predictors and within the additive composite, which allows the measurement model of reflective indicators to escape the confirmatory factor analysis restriction of unidimensionality in order to capture the shared variation that is multidimensional across the reflective indicators and heterogeneous observations [7,18]. We should note that multidimensional indices created in randomized control trials do not capture the outlier effects, and therefore do not necessarily generalize to real world settings [32]. However, when the formative and reflective indicators reflect the same measurement items, we may adjust the MIMIC model that generates a multidimensional, additive composite to avoid these biases, because this MIMIC model sequesters the shared variation from influential outliers, heteroscedasticity, and multicollinearity across the formative indicators of the structural model into the measurement model (where reflective indicators capture the variation). Using data values for a given participant, the analyst calculates the multidimensional index as well as the statistically significant formative and reflective indicators in a nonbiased translation to clinical practice.

4.3. Extensions and Applications

There exists the possibility of simplifying these regression-based MIMIC models to collapse three-way and even more complex interactions of disease groups (i.e., a context of disease multimorbidity rather than comorbidity) into a single multiplicative variable representing the disease subgroup. This single variable would replace the individual disease group variables and their interactions as predictors in a subsequent MIMIC model. For instance, we may specify three disease groups (diabetes, heart attack, heart failure), the three two-way interaction terms they form, and the one three-way interaction term involving all of them, as formative and reflective items of a MIMIC model to estimate a weighted index for this disease subgroup. MIMIC estimates (R2 = 1) for the formative indicators are not biased by variation that would otherwise be sequestered in the residual term of a common regression model (i.e., the variation which would otherwise be sequestered in the residual term is picked up and modeled by the reflective indicators). To calculate the single variable representing the disease subgroup, the analyst multiplies the estimated structural equation slope for the highest-order, three-way disease group predictor by the value of this highest-order, three-way interaction term for each participant. The analyst saves the variable under two different variable names for use in a subsequent MIMIC model to estimate a weighted index for depression.
The analyst specifies the variable (saved under one variable name) within the regression-based structural model (i.e., left column in Figure 1) and the variable (saved under the other variable name) within the confirmatory factor analysis-based measurement model (i.e., right column in Figure 1). The analyst then specifies the formative and reflective indicators of the twenty CES-D depression items in both parts of the MIMIC model, followed by the two-way (interaction) terms of the new disease subgroup variable across the formative indicators (in the structural equation model of the multiple causes). Equivalently, the analyst specifies the two-way (multiplicative subgroup) terms of the new disease subgroup variable across the reflective indicators (in the measurement model of the multiple indicators). Thus, the approach collapses what would be a four-way model, with many additional interaction and subgroup terms, into a two-way model.
Finally, the MIMIC model in which the same items serve as both formative and reflective indicators is not limited to predicting only the weighted index (additive composite). Indeed, the analyst can capitalize on the MIMIC model’s advantages of symmetrical specification of variables, asymmetric analysis of variation, and perfect (non-stochastic) model fit (R2 = 1) to predict the weighted index (additive composite), and by extension, a subsequent outcome (y) of interest. It is intriguing that even an ordinary multiple or moderated regression model can be recast as a MIMIC model that retains all predictors as formative indicators (multiple causes); incorporates equivalent, renamed variables as reflective indicators (multiple indicators); and replaces the outcome (y) variable with the weighted index (additive composite) derived in the MIMIC estimation. Assuming an estimable MIMIC model, while the reflective indicators may not detect substantively meaningful clustering when they replace multiple or moderated regression, they do serve to condition for outliers, heteroscedasticity, and multicollinearity that would otherwise attenuate estimates of the formative indicator slopes (the multiple causes that replace the regression predictors) and inflate their standard errors. The analyst can compare the slopes and standard errors from the mediated pathway in the MIMIC model with those from the direct pathway in the original regression model to discern the extent of bias conditioning. Whether we start with a MIMIC or regression model, the reflective indicators and weighted index (additive composite) then serve as mediators in a pathway predicting the original outcome (y) of interest. The analyst pursues this comparison regardless of whether the intent is to predict an outcome (y) of interest besides the weighted index (additive composite) in a MIMIC model, or to condition bias from a multiple or moderated regression by recasting it as a MIMIC model.
In this process, the first set of analyses identifies whether the relationship between a formative indicator of interest and the weighted index (additive composite) is statistically significant (either across the sample or within a participant group or subgroup):
z = b1/s.e.(b1)
where z is the z-statistic score, b1 is the regression-based slope of the relationship between each formative indicator term and the weighted index (additive composite) of the MIMIC model, and s.e.(b1) is the standard error of b1. Then, the relationship between the weighted index (additive composite) and the original outcome (y) of interest is tested:
z = b2/s.e.(b2)
where b2 is the regression-based slope of the relationship between the weighted index (additive composite) and the original outcome (y) of interest. The analyst then calculates the statistical significance of the path analytic relationship to y, across the sample or within the group or subgroup:
z = b1 b2/s.e.(b1) s.e.(b2)
This first set of analyses shows whether the weighted index (additive composite) is statistically significant as a predictor of the original outcome (y) of interest across the sample or within the group or subgroup (Equation (2)). It also estimates the regression slope of each formative indicator (used in Equation (1)). The product of this latter regression slope and its corresponding formative indicator values is a sub-index (sub-composite) of the weighted index (additive composite). Equation (3) shows whether the sub-index significantly predicts the original outcome (y) of interest. The determinate values across observations of the weighted index, and the determinate values of the outcomes further downstream, mean that the separate sub-indexes that comprise the overall weighted index can be used as determinate predictors of these subsequent determinate outcomes (i.e., the indirect, mediated effect in Equation (3) has ecological validity at the level of individual observations).
Even when the time complexity of the initial MIMIC model is more pronounced (necessary to estimate Equation (1)), the time complexity of the subsequent regression is not an issue for estimation of the original outcome (y) of interest necessary to estimate Equations (2) and (3). Thus, time complexity is only a potential factor initially, but after obtaining estimates from the MIMIC model, a single original outcome (y), or even multiple original outcomes further downstream, can easily be predicted using ordinary multiple regression, which avoids the need to grapple repeatedly with time complexity for each new outcome.
The second set of analyses replaces the formative and reflective indicators, and the weighted index (additive composite), with all of the sub-indices derived in the first set of analyses. The sub-indices then directly predict the original outcome (y) of interest in a multiple or moderated regression in which the non-constant, non-zero residual term reflects the imperfect fit (R2 < 1). This second set of analyses shows which of the separate sub-indices representing individual survey or panel items are positive or negative and statistically significant as predictors of y across the sample or within the group or subgroup. Again, time complexity should not be an issue in estimating the multiple or moderated regression.
There are other possibilities for more expansive MIMIC modeling. Future research should lead to findings that are more accurate for informing screening based on applying this novel MIMIC model to data that include measurements of different classes of hypoglycemic agents, which may have different effects on depressive symptoms, and measurements of antidepressants, which may have different effects on macrovascular complications (and on related depressive symptoms) [8]. More broadly, the burden of collecting time series and other longitudinal data in epidemiological investigations makes cross-sectional studies of metabolites, biomarkers, and symptoms more attractive. Improvements in statistical modeling, such as the simultaneous specification of panel items as formative (causal) and reflective (effect) indicators of a MIMIC model, will make the most of cross-sectional data. For instance, future investigations should determine whether a cross-sectional MIMIC model could provide similar insights to those from a dynamic time series in understanding metabolites and pathophysiology of chronic heart failure, as well as yield insights to achieve improved accuracy of early diagnoses (see Appendix D, note 3). The collection of less data in a shorter amount of time is an advantage of the cross-sectional approach if it can achieve high diagnostic accuracy. This is especially desirable if the time saved may lead to the earliest possible diagnosis that takes better advantage of timely opportunities for treatment and secondary prevention (i.e., detecting and treating disease or injury as soon as possible to halt or slow its progress).
The MIMIC model is a promising approach to identify integrated (not isolated) individual processes (e.g., within the proteome), and even to conduct whole-system level analysis. It allows us to determine which specific ‘omics perspectives involving cells, tissues, and organs—and more definitively, which of the observed items from a panel within any given ‘omics focus—are most active as potential clinical targets. Linkages of metabolomics and epidemiology could involve specifications of higher-order multi-omics weighted indices in which different types and levels of data (e.g., genomic, epi-genomic, transcriptomic, metabolomic, proteomic) load onto their own separate first-order weighted index. The first-order weighted indices then all load onto the overall second-order weighted index that controls for the total level of these known reaction networks, which could provide a proxy indication of the overall metabolic reaction rate of the system. A depressive symptom has a different meaning when it occurs as a residual depressive symptom with no clinical significance compared to when it occurs as part of clinically significant depression. Similarly, the meaning of a metabolite-specific effect is likely to differ when the functioning and metabolic reaction rate of the overall system is within a healthy range versus when it is functioning poorly [33].
Finally, there is a more established tradition and greater interest in using and improving statistical indices by investigators engaged in economic and social monitoring [34]. They too would seek to target statistical indicators within subgroups for more accurate estimates and prediction. Curiously, we might suspect they are predisposed in the opposite way from those engaged in symptom research and psychometric studies, by favoring the unique variation of formative (causal) indicators that collectively constitute a weighted index without adjusting simultaneously for biases from reflective (effect) indicators of those same items. If true, the bidirectional regression-based MIMIC model would be a useful advancement in these fields as well but for different reasons.

Supplementary Materials

The following supporting information can be downloaded at: https://www.mdpi.com/article/10.3390/sym14112275/s1, Figure S1: Appropriate Portion of the Mplus Syntax for Figure 1.

Funding

This research received no external funding.

Data Availability Statement

I used deidentified, publicly available survey data from the New Haven, Connecticut subsample of community-residing older adults from the Established Populations for the Epidemiological Study of the Elderly (EPESE; unweighted n = 2812; www.icpsr.umich.edu/NACDA/studies/9915, accessed on 17 August 2022). See [5].

Conflicts of Interest

The author declares no conflict of interest.

Appendix A (Introduction)

1.
“When the (additive composite or weighted index) is controlled, only variation unique to each observed indicator remains. Predictor effects to the observed indicators have ‘local independence’ in that the observed items are conditionally independent of each other because the (additive composite or weighted index) accounts for the shared variation across the observed indicators. The addition of the structural model to CFA [confirmatory factor analysis] permits more valid modeling than CFA alone when symptoms, biomarkers, or metabolites may not all stem from a single biological pathway and confounding influences are more likely” [7] (pp. 1–2). “The simultaneous control for the level of the total panel allows estimation of more valid specific effects for individual metabolites, biomarkers, or symptoms” [7] (p. 6).
  A symmetric regression-based MIMIC model with duplicate items in the structural and measurement portions “…enables CFA either to be conducted across the sample or to be targeted within an overall group or interacting subgroup, while providing extensive and comprehensive control of confounding factors” [7] (p. 3). “[I]t can provide more extensive and comprehensive control of confounders than trying to specify each of them directly. Each unspecified confounder operates through its effect on each of the specified formative indicators that predict the (additive composite or weighted index)” [7] (p. 6).
  This symmetric MIMIC model adjusts formative indicators for confounding factors while modeling unique variation by the item that predicts the weighted index/additive composite. “[S]ymptoms that predict different portions of nonshared variation… may or may not also co-occur (leading, if they do, to multicollinearity and heteroscedasticity from the data for the particular observations concerned), but are dissimilar in their effects (i.e., they are not also based on common variation detected through factor analysis). The formative indicators approach is unique in modeling these multiple influences” [7], (p. 27).
  “Formative indicators tap the extent to which specific individual symptoms differ in their relationships to other symptoms. The formative indicators factor away biases from uncontrolled confounding factors, which could include differences in symptom expression in only some of the symptom items, or in smaller clusters with fewer symptoms, within the disease group or subgroup of interest. This strategy leaves the reflective indicators and the latent trait to tap the common or shared symptom expression across the full range of symptoms in the disease group or subgroup. It sidesteps the controversial issue as to whether symptoms should contribute variation to more than one symptom cluster because the formative indicators automatically factor out the influence of uncontrolled confounding factors, which may otherwise lead to heterogeneity in the effects of individual symptoms or across smaller subsets of symptoms” [7], (p. 27).
  See Francoeur [7] for a mathematical derivation of the regression-based MIMIC model.
2.
There is a qualification to make when the MIMIC model with duplicate items does not specify interactions of the disease group or subgroup across the formative indicators. In these specifications, “… the statistical significance of two formative indicators does not mean that they constitute a symptom cluster within the same disease group or subgroup, only that these two formative indicators are significant in the sample at large” [3] (p. 30). However, the significance of interactions of the disease group or subgroup across the symptoms implies that they constitute a symptom cluster within the same disease group or subgroup, one with differential synergistic effects across the formative indicators.

Appendix B (Materials and Methods)

1.
“The non-normality (skewness, kurtosis) captured in the structural (regression) portion of the MIMIC model engenders non-normality in the estimated ordinal probit latent variables “behind” each of the observed or manifest reflective indicators in the endogenous CFA portion. This non-normality would be absent in a pure CFA model with ordinal probit variables generated as normal. The non-normality improves detection of interaction terms (e.g., reflecting disease subgroups of coexisting conditions), which tap non-normal variation [5,6,7,8,9]” [7] (p. 28).
2.
As described later in the main text, the current study involves ordinal logit, and not ordinal probit, latent variables generated by the maximum likelihood procedure (MLR) to estimate the MIMIC model parameters. MLR estimation is appropriate for non-independent data comprising a census of observations from participants living in either public or private residences for the elderly. MLR estimation is also appropriate for clustered random sampling, and therefore for non-independent data from participants living in their own homes. The ordinal logit estimates are for the latent variables “behind” the observed or manifest reflective indicators. The structural regression portion of the MIMIC model taps skewness and kurtosis that influence and shape the generated distributions of these latent variables in the measurement model portion, which incorporate this non-normality. These logit estimates also result in a logit distribution for the weighted index.
3.
“Just because a latent trait can be postulated and estimated using confirmatory factor analysis (CFA) does not necessarily mean the derived latent trait is the most valid estimate of the true latent trait. A true latent trait should have the property that allows it to be modeled by dissimilar variation across formative symptoms that do not in themselves constitute a symptom cluster of reflective indicators” [7] (pp. 32–33).
4.
Rather, they “… provide additional, exogenous modeling information to reveal statistically significant reflective symptoms and symptom clusters by identifying this more plausible latent trait equivalent to the additive composite of the formative indicators. By capturing all of the variation across these formative indicators (i.e., R2 = 1), this modeling provides determinacy of latent factor scores at the level of the individual observations because they are equivalent to the additive composite (weighted index) scores, in contrast to the indeterminacy of factor scores for individual observations from CFA outside of this MIMIC framework” [7] (p. 22).
5.
Depending on the vantage point of observation, we can perceive the MIMIC model with identical formative and reflective indicators to have translation or reflection symmetries [35]. Disregarding the directional arrows of causation for the moment, we can perceive the two objects of the exogenous and endogenous portions of the MIMIC model to reflect translation symmetry because we can simply slide the name of each formative indicator to the right side where it becomes the reflective indicator for the same item. Rather than focusing on the two separate objects, the incorporation of the directional arrows within each object either to or from the weighted composite would reveal the existence of reflection symmetry across a hypothetical vertical line that bisects the weighted composite circle in the MIMIC model. Flipping over either half of the MIMIC model about the line (180 degrees) reveals a reflection or mirror image of the other half. However, as with objects in a mirror, this reflection of the name for each formative indicator (or data it incorporates) reads backwards for its corresponding reflective indicator, in contrast to the sliding of the name (or data) from left to right in translation symmetry. The MIMIC model does not share this feature of reflection symmetry because the name and data appear in a forward direction in the formative and reflective indicators. Despite the properties of translation and reflection symmetries, the use of moderated regression in the formative indicators (to assess independent variation in each predictor) and confirmatory factor analysis in the reflective indicators (to assess shared variation across predictors) reveal these two procedures to be asymmetric. They are also mutually exclusive and complementary in the portion of the overall variation that they model within and across the same survey or panel items.
  In the structure of the MIMIC model, there is reflection symmetry between the variables reflected as formative indicators and their respective reflective indicators. However, the use of different statistical analysis methods results in an asymmetric assessment of the total variation within each item (i.e., unique versus shared), specified as a formative versus a corresponding reflective indicator. What becomes a “mirror image” based on rotation about the line through the center of the weighted composite is the direction of the arrow of causation when rotating a formative indicator to become a reflective indicator (or vice versa). The item represented by the indicator remains identical to the formative and reflective indicators, but its causal direction changes from causing to reflecting the effect of the weighted composite. Thus, the symmetry (mirror-image quality) depends only on the change in direction of the arrow of causation. The item itself remains unchanged. The reflective indicator is not the mirror image of the formative indicator; it is a duplicated image, rather than symmetrical one, and therefore it only represents a symmetrical relation. In set theory, a = b means b = a, or in the CES-D depression inventory, two different variable names (e.g., sad = sad2 means sad2 = sad) reflect the same item (see [36]). The symmetrical relation is necessary to identify duplicate variables because a (or sad) is endogenous (estimated by the MIMIC model) and b (or sad2) is exogenous (information from outside the MIMIC model [3]. In addition, ordinal regression predicts b (or sad2) as a categorical outcome variable in the measurement (confirmatory factor analysis) portion of the MIMIC model while a (or sad) operates as a continuous (strictly speaking, as a “countably” continuous) variable predictor in the structural (regression) portion of the MIMIC model, although estimates would result even if the outcome variable was continuous.
6.
Outside of this bidirectional MIMIC model, a process of leveraging would assume an indeterminate latent construct or latent trait rather than a determinate weighted index or additive composite, and it would involve separate, and not simultaneous, use of moderated regression and confirmatory factor analysis in order to reveal synergies and clustering. Because these two sources of variation would not compete with each other, the variation they each capture would not be distinct and mutually exclusive but rather overlapping, which may inflate standard errors and bias estimates and inferences. Although clustering may still occur across symptoms in the measurement model, biases may afflict the clustering in terms of not only the accuracy and magnitude of symptom loadings on the latent trait or construct, but also because it inappropriately includes or excludes certain symptoms (i.e., a biased reflective symptom cluster). This clustering bias in the reflective indicators of the measurement model signals the likelihood of counteracting bias in the formative indicators of the structural model. Furthermore, the structural model may not detect actual symptom interactions due to their inflated standard errors (i.e., a biased formative symptom cluster). In contrast to leveraging performed in the context of an imperfectly estimated indeterminate latent trait/construct in a restrictive unidirectional model, the determinacy of a perfectly estimated weighted index/additive composite in a more valid and flexible bidirectional model avoids the possibility of committing ecological fallacies in deriving predicted values for individual observations, such as when screening individuals at risk.
7.
Outliers may become problematic when conducting a confirmatory factor analysis separately and outside the framework of a regression-based MIMIC model. Using boxplots and scatterplots to identify influential univariate and bivariate outliers, analysts may condition the correlation matrix used in confirmatory factor analysis, which would provide valid estimates of the reflective symptom cluster but not of the formative symptom cluster. However, the purpose of screening is to identify influential observations representing people at risk for symptoms of a condition or as a response to an intervention. Removing influential observations altogether is undesirable compared to modeling their synergies as formative indicators and formative symptom clusters. There also may be multiple influential outliers across the variables in a correlation matrix such that their removal would lead the results of a confirmatory factor analysis to be artifacts and no longer representative of the sample.
8.
Time complexity may be problematic in some models that require many iterations and a very long time to converge to a final solution, assuming it even exists. In these situations, the analyst may try a different type of estimator when this is appropriate (e.g., when data are independent and not derived from cluster random sampling, a weighted least squares estimator, such as WLSMV, may be used with binary or ordinal data instead of a maximum likelihood estimator such as MLR).
  As a confirmatory procedure, the regression-based MIMIC model includes a weighted index/additive composite that may reveal (1) a single formative indicators symptom cluster based on multiple symptoms with synergistic effects within a disease subgroup and (2) a single reflective indicator symptom cluster of multiple symptoms without synergistic effects that cluster together within the disease subgroup. The structural model estimated using moderated regression analysis and the measurement model estimated using confirmatory factor analysis do not replace the need for exploratory procedures involving just the one-way items and not their multiplicative indicators, such as exploratory factor analysis, exploratory principal components factor analysis, or cluster analysis. These exploratory procedures may reveal whether overall clustering actually consists of more than one separate and distinct subcluster of reflective indicators. They can inform whether a bidirectional MIMIC model may target a separate and distinct subcluster of reflective indicators to explore the extent to which it actually comprises a separate formative indicator (i.e., synergistic) symptom subcluster and a separate reflective-indicator (i.e., non-synergistic) symptom subcluster. This approach may be valuable for providing a direction to collapsing bidirectional MIMIC models to comprise only a subcluster of fewer symptoms in situations where time complexity is problematic and the iterations do not converge to yield final valid estimates for the MIMIC model parameters.
  When variables are ordinal and non-normally distributed, a correlation matrix based on Spearman rank-order correlation coefficients is appropriate for analysis in covariance-based MIMIC models. However, we should not expect these models to yield unique solutions in bidirectional MIMIC models, whether or not they include complex specifications of multiple two- and three-way interaction terms in the structural model portion and parallel multiplicative terms in the symmetrical measurement model portion. The fact that the corresponding formative and reflective indicators derive from the same items leads them to be perfectly correlated as off-diagonal elements of the correlation matrix, which means that the matrix is singular (non-invertible) and does not yield valid estimates. In contrast to regression-based MIMIC modeling, covariance-based MIMIC modeling does not employ moderated regression and confirmatory factor analysis as separate exogenous and endogenous procedures with different assumptions that accommodate asymmetric modeling of unique versus shared variation within the same symptom or item. Because all variables are endogenous (y) outcomes in a correlational framework, the structural model portion does not condition or influence the estimates derived from the measurement model portion of the covariance-based MIMIC model. Although analysts may screen out influential outliers prior to calculating correlation coefficients, the covariance-based MIMIC model may not adjust for outliers due to the lack of influence of the structural model on the measurement model. Furthermore, because the modeling does not occur at the level of individual participants, but rather on correlation matrix relationships across the sample or disease groups, ecological fallacies may be a threat for the purpose of screening individuals.

Appendix C (Results)

Table A1. Symmetric, bidirectional MIMIC models of CES-D depression items across older adults: chronic conditions mediated by diabetes 1.
Chronic Conditions & Subgroups(A) Formative Indicators
(Synergies)
(B) Reflective Indicators
(Clustering Only)
CES-D Depression ItemsbS.E.z 2,3λS.E. z 2,3
1. Stroke (n = 115)
Stroke56.35319.5182.887
x Talked Less than Usual0.2690.0992.709
2. Stroke (n = 115) Mediated by Diabetes (n = 371)
Stroke7.3021.7854.092
Diabetes12.4141.14810.815
Stroke x Enjoyed Life0.3980.1992.006
Stroke x Talked Less than Usual0.7640.1864.115
Diabetes x Everything an Effort0.1550.0781.991
Diabetes x Restless Sleep0.2180.0693.142
3. Stroke or Post-Stroke Cognitive Impairment
(PSCI, n = 139)
Stroke or Post Stroke Cognitive Impairment69.55916.6524.177
x Difficulty Concentrating0.3020.1072.830
x Talked Less than Usual0.2130.0932.282
4. Stroke or Post-Stroke Cognitive Impairment
(PSCI, n = 139) Mediated by Diabetes (n = 371)
Stroke or Post-Stroke Cognitive Impairment6.8971.4204.859
Diabetes11.4340.91412.516
Stroke or PSCI x Sad0.6370.2832.248
Stroke or PSCI x Enjoyed Life0.4080.1882.166
Stroke or PSCI x Talked Less than Usual0.6550.1733.792
Diabetes x Restless Sleep0.2480.0683.628
5. Vascular Cognitive Impairment (VCI, n = 42)
Vascular Cognitive Impairment (VCI)61.42024.6502.4920.7210.3102.323
x Bothered by Things 1.2410.4013.0920.4050.0785.157
x Life a Failure 0.5160.1373.775
x Crying Spells 0.7380.2722.716
x Depressed 0.6960.1853.751
x Blues 0.7700.2792.758
x Sad0.7880.3832.0560.4020.1552.587
x Happy1.5400.5602.7490.5680.2222.556
x Hopeful0.4570.1213.7700.4290.2042.106
x Enjoyed Life 0.6440.2722.371
x Good as Others 0.9370.3682.548
x Everything an Effort 0.4310.1393.110
x Poor Appetite0.7150.3422.0930.4630.1283.629
x Difficulty Concentrating
x Talked Less than Usual1.7110.5623.0450.5080.1503.390
x Restless Sleep 0.3220.1162.771
x Not Get Going1.0670.4572.3330.3680.1232.985
x Fearful 0.7020.1644.272
x Lonely 0.5110.2552.003
x People Unfriendly1.6030.6122.6190.5590.1992.813
x People Disliked Me
6. Vascular Cognitive Impairment (VCI, n = 42)
Mediated by Diabetes (n = 371)
Vascular Cognitive Impairment (VCI)0.259 1.487 0.174
Diabetes14.9271.23012.133
VCI x Crying Spells1.4520.4663.118
VCI x Sad0.7340.3412.150
VCI x Happy1.2450.7191.732
VCI x Hopeful0.8240.4191.966
7. Vascular Cognitive Impairment without Diabetes
(n = 29)
Vascular Cognitive Impairment without Diabetes16.262 3.216 5.056
x Bothered by Things
x Life a Failure 0.3380.0398.568
x Crying Spells 0.5600.1863.007
x Depressed
x Blues7.7271.7674.3740.7070.2253.147
x Sad 0.6310.2872.197
x Happy4.7921.3443.5670.4640.2072.236
x Hopeful 0.5050.2212.285
x Enjoyed Life 0.4340.1472.948
x Good as Others
x Everything an Effort 0.7560.3442.200
x Poor Appetite2.9030.9113.1850.4670.1463.201
x Difficulty Concentrating 0.5260.1284.110
x Talked Less than Usual3.8160.8544.4670.3770.0854.463
x Restless Sleep2.7290.9572.8510.4710.1373.444
x Not Get Going 0.4370.1094.006
x Fearful5.9361.4404.1210.4650.1483.132
x Lonely 0.5950.1464.073
x People Unfriendly2.0220.7762.6060.4280.1692.529
x People Disliked Me
8. Emaciated (n = 89)
Emaciated22.244 1.990 11.175
9. Emaciated Mediated by Diabetes (n = 371)
Emaciated3.9941.0713.730
Diabetes11.6161.06310.929
Emaciated x Hopeful0.5370.1812.974
Emaciated x People Disliked Me0.7310.3502.091
Diabetes x Restless Sleep0.2380.0773.099
10. Alcohol Consumption (n = 272)
Alcohol Consumption62.67021.8992.862
x Bothered by Things0.2480.1112.2340.4280.0984.379
x Life a Failure 0.5000.0736.867
x Crying Spells 0.4440.1283.475
x Depressed 0.9840.1655.969
x Blues 0.6450.0729.002
x Sad 0.7790.1236.331
x Happy 0.6090.1185.144
x Hopeful 0.3620.0705.170
x Enjoyed Life0.2370.0842.8290.5530.0935.967
x Good as Others 0.3240.1222.654
x Everything an Effort 0.4390.0765.781
x Poor Appetite 0.4080.0824.971
x Difficulty Concentrating 0.5380.0915.923
x Talked Less than Usual 0.4350.0835.272
x Restless Sleep0.1330.0671.9770.3930.0964.095
x Not Get Going 0.3590.1083.314
x Fearful0.2320.1032.2410.5060.1204.224
x Lonely 0.5450.0816.687
x People Unfriendly 0.3430.1372.512
x People Disliked Me 0.2690.0932.889
11. Alcohol Consumption (n = 272)
Mediated by Diabetes (n = 371)
Alcohol Consumption6.4210.8637.437
Diabetes9.8551.1728.412
Alcohol Consumption x Bothered by Things0.4010.1842.183
Alcohol Consumption x Hopeful0.3860.0934.170
Alcohol Consumption x Restless Sleep0.3170.1282.474
Alcohol Consumption x Fearful0.6030.2482.435
Diabetes x Difficulty Concentrating0.2340.1152.025
Diabetes x Restless Sleep0.2770.0932.982
1 I fixed the measurement loading (λ) of the CES-D item Depressed to one in order to set the metric of the measurement model. 2 Two-tailed test significance results are as follows: (1) z = 1.960 (p = 0.05); (2) z = 2.326 (p = 0.025); (3) z = 2.576 (p = 0.01); (4) z = 3.291 (p = 0.005). 3 All reflective indicators (forty in the MIMIC run mediated by diabetes) remain acceptable and statistically significant in their loadings. With a few exceptions that report non-mediated MIMIC models for purposes of comparison, the table reports only the statistically significant formative indicators.
Table A2. Symmetric, bidirectional MIMIC models of CES-D depression items in males and females: chronic conditions mediated by diabetes 1.
Chronic Conditions & Subgroups(A) Formative Indicators
(Synergies)
(B) Reflective Indicators
(Clustering Only)
CES-D Depression ItemsBS.E.z 2,3λS.E. z 2,3
1. Heart Attack (Males, n = 202)
Heart Attack (Males)16.8461.9348.712
x Enjoyed Life0.1290.0632.051
x Fearful0.2760.0982.805
2. Heart Attack (Males, n = 202)
Mediated by Diabetes (Males, n = 131)
Heart Attack (Males)10.5461.9305.464
Diabetes (Males)0.8020.7621.052
Heart Attack x Enjoyed Life0.2110.0882.405
Heart Attack x Fearful0.4860.1433.390
Diabetes x Good as Others0.6040.2782.176
Diabetes x Difficulty Concentrating0.4820.1972.449
Diabetes x Not Get Going0.5640.1863.030
1 I fixed the measurement loading (λ) of the CES-D item Depressed to one in order to set the metric of the measurement model. 2 Two-tailed test significance results are as follows: (1) z = 1.960 (p = 0.05); (2) z = 2.326 (p = 0.025); (3) z = 2.576 (p = 0.01); (4) z = 3.291 (p = 0.005). 3 All reflective indicators (forty in the MIMIC run mediated by diabetes) remain acceptable and statistically significant in their loadings. The table reports only the statistically significant formative indicators.
Table A3. Symmetric, bidirectional MIMIC models of CES-D depression items by age group (65–74 and over 74): comorbid conditions mediated by diabetes 1.
Chronic Conditions & Subgroups(A) Formative Indicators
(Synergies)
(B) Reflective Indicators
(Clustering Only)
CES-D Depression ItemsBS.E.z 2,3λS.E. z 2,3
1. Stroke (Ages 65–74, n = 72)
Stroke (Ages 65–74)15.9862.1967.281
x Enjoyed Life0.3340.1422.351
x Everything an Effort0.3840.1612.387
x Poor Appetite0.2350.0773.065
x Difficulty Concentrating0.4080.1622.526
x Talked Less than Usual0.8190.1804.551
2. Stroke (Ages 65–74, n = 72)
Mediated by Diabetes
(Ages 65–74, n = 131)
Stroke (Ages 65–74)6.8731.9523.521
Diabetes (Ages 65–74)11.7000.84213.898
Stroke x Depressed0.3670.1023.602
Stroke x Everything an Effort1.2310.4912.508
Stroke x Difficulty Concentrating1.5580.7252.150
Stroke x Talked Less than Usual1.8290.7272.516
Stroke x Not Get Going1.9170.8642.220
Stroke x Fearful1.0010.3682.722
Stroke x People Unfriendly0.7780.2722.864
Diabetes x Restless Sleep0.2970.1352.199
Diabetes x Lonely0.3160.1591.984
Diabetes x People Unfriendly0.3920.0924.250
3. Stroke (Over Age 74, n = 43)
Stroke (Over Age 74)15.7901.30812.073
x Sad0.6780.3322.044
x Poor Appetite0.3540.1682.108
x Difficulty Concentrating1.1500.4512.549
x Talked Less than Usual0.7630.3392.254
x People Unfriendly0.6460.2472.620
4. Stroke (Over Age 74, n = 43)
Mediated by Diabetes
(Over Age 74, n = 194)
Stroke (Over Age 74)4.9423.2031.543
Diabetes (Over Age 74)12.2601.00212.232
Stroke x Talked Less than Usual1.8420.9172.008
Diabetes x Poor Appetite0.2770.1122.478
5. Stroke or Post-Stroke Cognitive Impairment (PSCI)
(Ages 65–74, n = 81)
Stroke or Post-Stroke Cognitive Impairment
(PSCI, Ages 65–74)16.0162.0687.744
x Depressed0.3090.1202.576
x Enjoyed Life0.2910.0903.239
x Talked Less than Usual0.5690.1663.425
6. Stroke or Post-Stroke Cognitive Impairment
(PSCI, Ages 65–74, n = 81) Mediated by Diabetes
(Ages 65–74, n = 177)
Stroke or Post-Stroke Cognitive Impairment
(PSCI, Ages 65–74)6.7902.0043.389
Diabetes (Ages 65–74)10.6111.9125.549
Stroke or PSCI x Depressed0.5550.2382.332
Stroke or PSCI x Difficulty Concentrating0.9040.4152.177
Stroke or PSCI x Talked Less than Usual1.3020.4862.680
Stroke or PSCI x Fearful1.1800.5502.145
Diabetes x Restless Sleep0.3350.1452.310
Diabetes x Lonely0.3580.1811.980
Diabetes x People Unfriendly0.4630.1104.205
7. Stroke or Post-Stroke Cognitive Impairment
(PSCI, Over Age 74, n = 58)
Stroke or Post-Stroke Cognitive Impairment (Over Age 74)16.864 1.420 11.874
x Difficulty Concentrating0.6030.2692.244
8. Stroke or Post-Stroke Cognitive Impairment
(PSCI, Over Age 74, n = 58) Mediated by Diabetes
(Over Age 74, n = 194)
Stroke or Post-Stroke Cognitive Impairment (Over Age 74)7.525 3.157 2.383
Diabetes (Over Age 74)12.2651.2469.847
Diabetes x Good as Others0.1470.0712.056
Diabetes x Poor Appetite0.3050.1382.218
Diabetes x Restless Sleep0.2300.1072.148
9. Vascular Cognitive Impairment (Over Age 74, n = 29)
Vascular Cognitive Impairment (Over Age 74)10.3102.3224.440
x Bothered by Things 0.4490.0895.018
x Life a Failure2.0930.6883.0420.3760.0953.976
x Crying Spells 0.4880.0756.494
x Depressed 0.4920.0796.189
x Blues 0.4630.0805.803
x Sad 0.5080.1144.466
x Happy3.1701.0033.1600.4210.0775.480
x Hopeful 0.5150.0796.547
x Enjoyed Life 0.4310.0884.891
x Good as Others 0.3910.0814.817
x Everything an Effort1.9000.5113.7180.5680.1463.895
x Poor Appetite 0.4820.0945.103
x Difficulty Concentrating1.0500.4222.4890.4730.0657.293
x Talked Less than Usual5.4221.5283.5480.3620.0615.895
x Restless Sleep 0.5040.0628.156
x Not Get Going2.0960.6953.0150.4680.0667.126
x Fearful 0.4650.0776.044
x Lonely 0.4460.0994.483
x People Unfriendly5.5371.5753.5160.3600.1163.104
x People Disliked Me 0.2930.0893.296
10. Vascular Cognitive Impairment (VCI, Over Age 74
n = 29) Mediated by Diabetes (Over Age 74, n = 194)
Vascular Cognitive Impairment (Over Age 74)–2.1511.611–1.335
Diabetes (Over Age 74)13.1111.4628.969
VCI x Life a Failure5.4032.1422.522
VCI x Happy3.0321.4342.115
VCI x Everything an Effort3.3940.9683.508
VCI x Difficulty Concentrating1.8060.7792.319
VCI x Talked Less than Usual8.7182.4413.571
VCI x Not Get Going1.0570.4132.559
VCI x People Unfriendly6.8401.7273.961
Diabetes x Poor Appetite0.1570.0612.586
11. Cancer (Over Age 74, n = 182)
Cancer (Over Age 74)16.2631.33212.209
x Bothered by Things0.0900.0461.958
x Hopeful0.1380.0582.399
12. Cancer (Over Age 74, n = 182)
Mediated by Diabetes (Over Age 74, n = 194)
Cancer (Over Age 74)7.5251.5544.841
Diabetes (Over Age 74)6.4431.4154.554
Cancer x Talked Less than Usual0.2930.1481.981
Cancer x Lonely0.2210.0922.398
Diabetes x Difficulty Concentrating0.2760.1391.989
1 I fixed the measurement loading (λ) of the CES-D item Depressed to one in order to set the metric of the measurement model. 2 Two-tailed test significance results are as follows: (1) z = 1.960 (p = 0.05); (2) z = 2.326 (p = 0.025); (3) z = 2.576 (p = 0.01); (4) z = 3.291 (p = 0.005). 3 All reflective indicators (forty in the MIMIC run mediated by diabetes) remain acceptable and statistically significant in their loadings. With the exception of Vascular Cognitive Impairment (Over Age 74), which report non-mediated MIMIC models for purposes of comparison, the table reports only the statistically significant formative indicators.

Appendix D (Discussion)

1.
“The formative (causal) indicator effect consists of both the confounding effects associated with the formative (causal) indicator, along with the unbiased effects of the formative (causal) indicator itself. This adaptive conditioning and modeling with formative (causal) indicators leads to expected unbiased reflective (effect) indicators” [7] (p. 26).
2.
Using the same EPESE disease group and depressive symptom data, Francoeur [7] conducted MIMIC analyses involving main-effects (i.e., one-way) formative indicators and their parallel one-way reflective indicators. Across analyses, the number of positive, one-way, statistically significant formative indicators was limited, leading to the overall observation that symptom clusters tended to be a feature of reflective indicators. However, this observation could be an artifact of the lack of inclusion of multiple formative indicator interactions and their mirror-image multiplicative reflective indicators in these models.
  This suspicion arises because the lack of significance of formative indicators in [3] occurred despite the fact that the slope for overall depression was often prominent and statistically significant, for instance, in the MIMIC model involving the main-effect terms for Diabetes and Heart Failure. However, in the extended specification within older women tested in the current study (Figure 1), the slope of the additive composite or weighted index of overall depression deteriorated drastically and became negative (b = −16.076, s.e. = 1.906, z = −8.435) while formative indicator interactions of several depression symptoms within this disease subgroup became positive and statistically significant (see Table 1). Thus, formative indicator interaction terms may become statistically significant by accounting for variation previously captured by overall depression. It does this through the inclusion of multiple interactions that target the formative indicators further so that they retain only the disease subgroup participants that endorse each of the formative indicators of depressive symptoms.
3.
In this section, I target the comorbid disease context of diabetes and heart failure in order to illustrate how we may use this MIMIC model to analyze cross-sectional, heterogeneous data more efficiently and with greater utility in the absence of longitudinal data. Branched-chain amino acids (BCAAs) are important concerns in diabetes and in heart failure, and may be more prevalent as metabolites when these disease conditions occur together. They may be associated with depression symptoms in the MIMIC models of (1) Diabetes x Heart Failure; (2) Diabetes x Lost 10 Pounds; and (3) the related diabetes co-morbid conditions reported in Table 1, Table 2 and Table 3 and Table A1, Table A2 and Table A3. This requires some explanation.
  A review of cardiovascular metabolomics [37] reveals consistent observations of branched-chain amino acids (BCAAs) and related metabolites (such as their catabolic intermediates and other amino acids phenylalanine and tyrosine) in rats and humans to occur as part of insulin resistance and diabetes. It reports that “… supplementation of a high-fat diet with BCAA promoted insulin resistance in rats, independent of weight gain, suggesting a causal effect of BCAA in mediating this process [38], whereas BCAA in a genetic rat model of obesity improved insulin sensitivity [39]. Because of this observation, several additional studies using metabolomics platforms in different human cohorts, have not only confirmed the association of BCAA with insulin resistance [40,41,42,43] but have also shown that BCAA predicts the development of diabetes mellitus [44] and predict improvement in insulin sensitivity and weight loss [45,46]. The mechanisms underlying the association of BCAA with obesity-related metabolic disorders remain unclear” [37] (p. 1252).
  Newgard and colleagues [38] discovered that “… the clustering of glutamate and C3 and C5 acylcarnitines with BCAAs defined a signature comprising metabolites generated during BCAA catabolism, suggesting fundamental alteration of BCAA metabolism in insulin-resistant states” [47] (p. 44). One could test this cluster further by specifying these metabolites as main effects and interactions within the regression portion of a MIMIC model targeted to insulin-resistant subgroups in order to determine whether the components of the cluster are synergistic. The main effects would comprise formative (causal) indicators to adjust for unspecified confounders in order to condition bias from the parallel reflective (effect) indicators.
  Heart failure also implicates the involvement of BCAAs. In one recent study, mass spectrometry revealed twenty-three cardiac metabolites in an untargeted metabolomics study of rats with chronic heart failure induced by myocardial infarction [48]. Follow-up analyses of these metabolites revealed that certain BCAAs in serum, especially leucine and valine, were superior in distinguishing rats with chronic heart failure from rats that received a sham operation, in which these BCAAs accounted for more than three quarters of the area under the receiver operating characteristic curve. Targeted metabolomics confirmed that the BCAA metabolic pathway with related proteins and genes was impaired in rats with chronic heart failure, and time series evidence of dynamic changes in these BCAAs within three weeks after surgery were highly accurate (93.75%) in classifying rats with chronic heart failure. While other chronic heart failure studies have also reported increases in the levels of circulating BCAAs [49,50], there are also reports of decreased or unchanged levels of circulating BCAAs [51,52,53]. The study authors attribute these inconsistencies to dynamic changes in the levels of circulating BCAAs that analysts cannot capture at a single time point. When relying on a single time point, pernicious confounding related to baseline health status, lifestyle, or socioeconomic factors may undermine findings [54]. Substantively meaningful yet also uncontrolled confounding factors and interactions such as diet, the gut microbiome, and physical activity may in turn mediate these more basic confounding factors and interactions.
  However, this explanation may be premature. A somewhat crude main-effects model perhaps not well adjusted for confounders across the full sample of rats is the basis for this time series study. There could be different dynamic changes across subgroups of rats while also adjusting for confounders, depending on their cross-sectional curvilinear and interactive effects. Because the precipitation of circulating BCAAs may occur at different rates across the sample of rats with chronic heart failure, a cross-sectional sample at a single point in time may become increasingly heterogeneous in regard to the levels of circulating BCAAs within the three-week period. However, it may then become more consistent again (reflecting increases in circulating BCAAs in most of the rats) toward the end of that period. As long as the researcher does not select the cross-sectional sample too soon, before the dynamic changes have had a chance to occur in some reasonable portion of the sample (resulting in sample heterogeneity), there should be evidence of increasing levels of circulating BCAAs. However, the researcher may detect the evidence as curvilinear and/or interaction effects among the circulating BCAAs and not as linear or main effects, which serves to reflect that these dynamic effects are occurring within the targeted subgroup(s) of the sample. Still, as increasingly more of the rats with chronic heart failure come to experience a dynamic increase in circulating BCAAs, evidence for this dynamic increase may nonetheless be detected as linear or main effects in this cruder main-effects model (even as curvilinear and interactive effects are occurring).
  An analyst may use epidemiological data to specify and test the three BCAAs (leucine, isoleucine, and valine) both as formative (causal) indicators in the structural regression portion of a cross-sectional MIMIC model and as reflective (effect) indicators in the confirmatory factor analysis portion. Furthermore, the analyst could extend the main-effects regression portion into a curvilinear and moderated regression. In this extended specification, the three BCAAs (leucine, isoleucine, and valine), along with their curvilinear effects (if based on ordinal but not binary data) and four two- and three-way interactions, could be specified as exogenous effects in the MIMIC model (with the latent trait capturing the overall level of these three circulating BCAAs). This extended specification would model the diagnostic accuracy of these circulating BCAAs more precisely and with less bias. It would provide an analysis of the BCAAs across the full sample. Another option retains the three BCAAs as formative (causal) and reflective (effect) indicators while specifying exogenous terms to target a specific diagnostic subgroup (for instance, terms for diabetes, heart failure, and their interaction).
  In either type of specification, greater precision is possible because the three main-effect terms reveal their additive impacts, any curvilinear terms reveal more targeted additive impacts at more pronounced levels, and the interaction term(s) reveal multiplicative or synergistic impacts between all combinations of the main-effect terms. The inclusion of curvilinear and interaction terms may further reduce bias because they also enable more targeted conditioning for confounding influences within more targeted subgroups of BCAAs or diagnoses. Finally, the researcher may incorporate other metabolites with lower diagnostic accuracy (such as ejection fraction or brain natriuretic peptide) in the time series study [48], and as suggested by others (e.g., ketone metabolism [55,56,57]), into the panel of metabolites and biomarkers or within the regression portion of the MIMIC model. Their incorporation would be included as curvilinear terms and as components of interaction terms with BCAAs and with each other. Greater attention to testing these more targeted, exogenous effects in MIMIC models would allow for more comprehensive testing of diagnostic accuracy within subgroups by also considering curvilinear terms and/or the additional synergistic effects that emerge when metabolites and biomarkers co-occur in the same individuals.

References

  1. Kirkova, J.; Walsh, D. Cancer symptom clusters–A dynamic construct. Support Care Cancer 2007, 15, 1011–1013. [Google Scholar] [CrossRef] [PubMed]
  2. Francoeur, R.B. The relationship of cancer symptom clusters to depressive affect in the initial phase of palliative radiation. J. Pain Symptom. Manag. 2005, 29, 130–155. [Google Scholar] [CrossRef] [PubMed]
  3. Francoeur, R.B. Using an innovative multiple regression procedure in a cancer population (Part I): Detecting and probing relationships of common interacting symptoms (pain, fatigue/weakness, sleep problems) as a strategy to discover influential symptom pairs and clusters. OncoTargets Ther. 2015, 8, 45–56. [Google Scholar] [CrossRef] [PubMed] [Green Version]
  4. Francoeur, R.B. Using an innovative multiple regression procedure in a cancer population (Part II): Fever, depressive affect, and mobility problems clarify an influential symptom pair (pain-fatigue/weakness) and cluster (pain-fatigue/weakness-sleep problems). OncoTargets Ther. 2015, 8, 57–72. [Google Scholar] [CrossRef] [PubMed] [Green Version]
  5. Reyes-Gibby, C.C.; Lu, A.A.; Anderson, K.O.; Mendoza, T.R.; Cleeland, C.S. Pain, depression, and fatigue in community-dwelling adults with and without a history of cancer. J. Pain Symptom. Manag. 2006, 32, 118–128. [Google Scholar] [CrossRef] [PubMed]
  6. Francoeur, R.B. Symptom profiles of subsyndromal depression in disease clusters of diabetes, excess weight, and progressive cerebrovascular conditions: A promising new type of finding from a reliable innovation to estimate exhaustively specified multiple indicators-multiple causes (MIMIC) models. Diabetes Metab. Syndr. Obes. Targets Ther. 2016, 9, 391–416. [Google Scholar] [CrossRef] [Green Version]
  7. Francoeur, R.B. Multimorbidity from diabetes, heart failure, and related conditions: Assessing a panel of depressive symptoms as both formative and reflective indicators of a latent trait. Mathematics 2021, 9, 2715. [Google Scholar] [CrossRef]
  8. Zhu, M.; Li, Y.; Luo, B.; Cui, J.; Liu, Y.; Liu, Y. Comorbidity of type 2 diabetes mellitus and depression: Clinical evidence and rationale for the exacerbation of cardiovascular disease. Front. Cardiovasc. Med. 2022, 9, 861110. [Google Scholar] [CrossRef]
  9. Shin, M.; Sohn, M.K.; Lee, J.; Kim, D.Y.; Shin, Y.-I.; Oh, G.-J.; Lee, Y.-S.; Joo, M.C.; Lee, S.Y.; Song, M.-K.; et al. Post-stroke depression and cognitive aging: A multicenter, prospective cohort study. J. Pers. Med. 2022, 12, 389. [Google Scholar] [CrossRef] [PubMed]
  10. Kennedy, P. A Guide to Econometrics, 4th ed.; MIT Press: Cambridge, MA, USA, 1998; pp. 42–53. [Google Scholar]
  11. National Archive of Computerized Data on Aging. Established Populations for Epidemiologic Studies of the Elderly, 1981–1993: {East Boston, Massachusetts, Iowa and Washington Counties, Iowa, New Haven, Connecticut, and North Central North Carolina} (ICPSR 9915). 2021. Available online: http://www.icpsr.umich.edu/NACDA/studies/9915 (accessed on 1 June 2021).
  12. Muthén, L.K.; Muthén, B.O. Mplus User’s Guide, 5th ed.; Muthén and Muthén: Los Angeles, CA, USA, 1998–2007. [Google Scholar]
  13. How to Find the Time Complexity of an MLE Algorithm. 2020. Available online: https://stats.stackexchange.com/questions/497523/how-to-find-the-time-complexity-of-an-mle-based-algorithm (accessed on 4 August 2022).
  14. McNeish, D.; Wolf, M.G. Thinking twice about sum scores. Behav. Res. 2020, 52, 2287–2305. [Google Scholar] [CrossRef] [PubMed]
  15. Muthén, B. A structural probit model with latent variables. J. Am. Stat. Assoc. 1979, 74, 807–811. [Google Scholar]
  16. Muthén, B. Latent variable structural equation modeling with categorical data. J. Econom. 1983, 22, 48–65. [Google Scholar] [CrossRef]
  17. Muthén, B. A general structural equation model with dichotomous, ordered categorical, and continuous latent variable indicators. Psychometrika 1984, 49, 115–132. [Google Scholar] [CrossRef] [Green Version]
  18. Muthén, B. Latent variable modeling in heterogeneous populations. Presidential address to the Psychometric Society, July 1989. Psychometrika 1989, 54, 557–585. [Google Scholar] [CrossRef] [Green Version]
  19. Stevens, J.P. Outliers and influential data points in regression analysis. Psychol. Bull. 1984, 95, 334–344. [Google Scholar] [CrossRef]
  20. Zygmont, C.; Smith, M.R. Robust factor analysis in the presence of normality violations, missing data, and outliers: Empirical questions and possible solutions. Quant. Meth. Psych. 2014, 10, 40–55. [Google Scholar] [CrossRef] [Green Version]
  21. Gao, S.; Mokhtarian, P.L.; Johnston, R.A. Nonnormality of data in structural equation models. Transp. Res. J. 2008, 2082, 116–124. [Google Scholar] [CrossRef] [Green Version]
  22. Fischer, J.; Gödecke, A.; Kelm, M.; Heusch, G. Master switches in cardiac ischemia: The Collaborative Research Center (CRC) 1116 of the German Research Foundation. Eur. Heart J. 2022, 43, 2350–2351. [Google Scholar] [CrossRef] [PubMed]
  23. U.S. Department of Health and Human Services. The Health Consequences of Smoking-50 Years of Progress: A Report of the Surgeon General. Atlanta: U.S. Department of Health and Human Services, Centers for Disease Control and Prevention, National Center for Chronic Disease Prevention and Health Promotion, Office on Smoking and Health. 2014. Available online: https://www.ncbi.nlm.nih.gov/books/NBK179276/pdf/Bookshelf_NBK179276.pdf#page=592 (accessed on 4 August 2022).
  24. U.S. Department of Health and Human Services. A Report of the Surgeon General: How Tobacco Smoke Causes Disease: What It Means to You. Atlanta: U.S. Department of Health and Human Services, Centers for Disease Control and Prevention, National Center for Chronic Disease Prevention and Health Promotion, Office on Smoking and Health. 2010. Available online: https://www.cdc.gov/tobacco/data_statistics/sgr/2010/consumer_booklet/pdfs/consumer.pdf (accessed on 4 August 2022).
  25. American Diabetes Association. Medication & Treatments: Alcohol and Diabetes. 2022. Available online: https://www.diabetes.org/healthy-living/medication-treatments/alcohol-diabetes (accessed on 4 August 2022).
  26. Rajpathak, S.N.; Gunter, M.J.; Wylie-Rosett, J.; Ho, G.Y.; Kaplan, R.C.; Muzumdar, R.; Rohan, T.E.; Strickler, H.D. The role of insulin-like growth factor-I and its binding proteins in glucose homeostasis and type 2 diabetes. Diabetes Metab. Res. Rev. 2009, 25, 3–12. [Google Scholar] [CrossRef] [PubMed] [Green Version]
  27. Brahmkhatri, V.P.; Prasanna, C.; Atreya, H.S. Insulin-like growth factor system in cancer: Novel targeted therapies. Biomed. Res. Int. 2015, 2015, 538019. [Google Scholar] [CrossRef] [PubMed] [Green Version]
  28. Miaskowski, C.; Aouizerat, B.E. Is there a biological basis for the clustering of symptoms? Semin. Oncol. Nurs. 2007, 23, 99–105. [Google Scholar] [CrossRef]
  29. Schwartz, N.S.; Clutter, W.E.; Shah, S.D.; Cryer, P.E. Glycemic thresholds for activation of glucose counterregulatory systems are higher than the threshold for symptoms. J. Clin. Investig. 1987, 79, 777–781. [Google Scholar] [CrossRef] [PubMed] [Green Version]
  30. Gonder-Frederick, L.A.; Cox, D.J.; Bobbit, S.A.; Pennebaker, J.W. Mood changes associated with blood glucose fluctuations in insulin-dependent diabetes mellitus. Health Psychol. 1989, 8, 45–59. [Google Scholar] [CrossRef]
  31. Francoeur, R.B. Could sequential residual centering resolve low sensitivity in moderated regression? Simulations and cancer symptom clusters. Open J. Stat. 2013, 3, 24–44. [Google Scholar] [CrossRef] [Green Version]
  32. Landewé, R.B.M.; der Heijde, D. Use of multidimensional composite scores in rheumatology: Parsimony versus subtlety. Ann. Rheum. Dis. 2021, 80, 280–285. [Google Scholar] [CrossRef] [PubMed]
  33. Fearnley, L.G.; Inouye, M. Metabolomics in epidemiology: From metabolite concentrations to integrative reaction networks. Int. J. Epidemiol. 2016, 45, 1319–1328. [Google Scholar] [CrossRef] [PubMed] [Green Version]
  34. Special Issue “An Innovative Mathematical Universe of Instruments and Techniques Based on the Statistical Indices Method”. Mathematics, 2020. Available online: https://www.mdpi.com/journal/mathematics/special_issues/Statistical_Indices_Method(accessed on 16 September 2022).
  35. Katsampoxaki-Hodgetts, K. The Four Planes of Symmetry; University of Crete: Heraklion, Greek; Automattic, Inc.: San Francisco, CA, USA, 2012; Available online: https://englishformaths.files.wordpress.com/2012/09/the-four-planes-of-symmetry.ppt (accessed on 17 August 2022).
  36. Symmetry in Mathematics. Wikipedia. Available online: https://en.wikipedia.org/wiki/Symmetry_in_mathematics (accessed on 17 August 2022).
  37. McGarrah, R.W.; Crown, S.B.; Zhang, G.-F.; Shah, S.H.; Newgard, C.B. Cardiovascular metabolomics. Circ. Res. 2018, 122, 1238–1258. [Google Scholar] [CrossRef] [PubMed]
  38. Newgard, C.B.; An, J.; Bain, J.R.; Muehlbauer, M.J.; Stevens, R.D.; Lien, L.F.; Hagg, A.M.; Shah, S.H.; Arlotto, M.; Slentz, C.A.; et al. A branched-chain amino acid-related metabolic signature that differentiates obese and lean humans and contributes to insulin resistance. Cell Metab. 2009, 9, 311–326. [Google Scholar] [CrossRef] [PubMed] [Green Version]
  39. White, P.J.; Lapworth, A.L.; An, J.; Wang, L.; McGarrah, R.W.; Stevens, R.D.; Ilkayeva, O.; George, T.; Muehlbauer, M.J.; Bain, J.R.; et al. Branched-chain amino acid restriction in Zucker-fatty rats improves muscle insulin sensitivity by enhancing efficiency of fatty acid oxidation and acyl-glycine export. Mol. Metab. 2016, 5, 538–551. [Google Scholar] [CrossRef] [PubMed]
  40. Shaham, O.; Wei, R.; Wang, T.J.; Ricciardi, C.; Lewis, G.D.; Vasan, R.S.; Carr, S.A.; Thadhani, R.; Gerszten, R.E.; Mootha, V.K. Metabolic profiling of the human response to a glucose challenge reveals distinct axes of insulin sensitivity. Mol. Syst. Biol. 2008, 4, 214. [Google Scholar] [CrossRef]
  41. Huffman, K.M.; Shah, S.H.; Stevens, R.D.; Bain, J.R.; Muehlbauer, M.; Slentz, C.A.; Tanner, C.J.; Kuchibhatla, M.; Houmard, J.A.; Newgard, C.B.; et al. Relationships between circulating metabolic intermediates and insulin action in overweight to obese, inactive men and women. Diab. Care 2009, 32, 1678–1683. [Google Scholar] [CrossRef]
  42. Tai, E.S.; Tan, M.L.; Stevens, R.D.; Low, Y.L.; Muehlbauer, M.J.; Goh, D.L.; Ilkayeva, O.R.; Wenner, B.R.; Bain, J.R.; Lee, J.J.; et al. Insulin resistance is associated with a metabolic profile of altered protein metabolism in Chinese and Asian-Indian men. Diabetologia 2010, 53, 757–767. [Google Scholar] [CrossRef] [PubMed] [Green Version]
  43. Batch, B.C.; Shah, S.H.; Newgard, C.B.; Turer, C.B.; Haynes, C.; Bain, J.R.; Muehlbauer, M.; Patel, M.J.; Stevens, R.D.; Appel, L.J.; et al. Branched chain amino acids are novel biomarkers for discrimination of metabolic wellness. Metabolism 2013, 62, 961–969. [Google Scholar] [CrossRef] [PubMed] [Green Version]
  44. Wang, T.J.; Larson, M.G.; Vasan, R.S.; Cheng, S.; Rhee, E.P.; McCabe, E.; Lewis, G.D.; Fox, C.S.; Jacques, P.F.; Fernandez, C.; et al. Metabolite profiles and the risk of developing diabetes. Nat. Med. 2011, 17, 448–453. [Google Scholar] [CrossRef] [PubMed] [Green Version]
  45. Shah, S.H.; Crosslin, D.R.; Haynes, C.S.; Nelson, S.; Turer, C.B.; Stevens, R.D.; Muehlbauer, M.J.; Wenner, B.R.; Bain, J.R.; Laferrère, B.; et al. Branched-chain amino acid levels are associated with improvement in insulin resistance with weight loss. Diabetologia 2012, 55, 321–330. [Google Scholar] [CrossRef] [Green Version]
  46. Laferrère, B.; Reilly, D.; Arias, S.; Swerdlow, N.; Gorroochurn, P.; Bawa, B.; Bose, M.; Teixeira, J.; Stevens, R.D.; Wenner, B.R.; et al. Differential metabolic impact of gastric bypass surgery versus dietary intervention in obese diabetic subjects despite identical weight loss. Sci. Transl. Med. 2011, 3, 80re2. [Google Scholar] [CrossRef] [Green Version]
  47. Newgard, C.B. Metabolomics and metabolic diseases: Where do we stand? Cell Metab. 2017, 25, 42–56. [Google Scholar] [CrossRef] [Green Version]
  48. Li, R.; He, H.; Fang, S.; Hua, Y.; Yang, X.; Yuan, Y.; Liang, S.; Liu, P.; Tian, Y.; Xu, F.; et al. Time series characteristics of serum branched-chain amino acids for early diagnosis of chronic heart failure. J. Proteome Res. 2019, 18, 2121–2128. [Google Scholar] [CrossRef]
  49. Cheng, M.L.; Wang, C.H.; Shiao, M.S.; Liu, M.H.; Huang, Y.Y.; Huang, C.Y.; Mao, C.T.; Lin, J.F.; Ho, H.Y.; Yang, N.I. Metabolic disturbances identified in plasma are associated with outcomes in patients with heart failure: Diagnostic and prognostic value of metabolomics. J. Am. Coll. Cardiol. 2015, 65, 1509–1520. [Google Scholar] [CrossRef] [Green Version]
  50. Guo, N.; Yang, D.; Wang, X.; Dai, J.; Wang, M.; Lei, Y. Metabolomic study of chronic heart failure and effects of Chinese herbal decoction in rats. J. Chromatogr. A 2014, 1362, 89–101. [Google Scholar] [CrossRef]
  51. Wang, J.; Li, Z.; Chen, J.; Zhao, H.; Luo, L.; Chen, C.; Xu, X.; Zhang, W.; Gao, K.; Li, B.; et al. Metabolomic identification of diagnostic plasma biomarkers in humans with chronic heart failure. Mol. BioSyst. 2013, 9, 2618–2626. [Google Scholar] [CrossRef]
  52. Sun, H.; Olson, K.C.; Gao, C.; Prosdocimo, D.A.; Zhou, M.; Wang, Z.; Jeyaraj, D.; Youn, J.Y.; Ren, S.; Liu, Y.; et al. Catabolic defect of branched-chain amino acids promotes heart failure. Circulation 2016, 133, 2038–2049. [Google Scholar] [CrossRef]
  53. Tsuji, S.; Koyama, S.; Taniguchi, R.; Fujiwara, T.; Fujiwara, H.; Sato, Y. Nutritional status of outpatients with chronic stable heart failure based on serum amino acid concentration. J. Cardiol. 2018, 72, 458–465. [Google Scholar] [CrossRef] [Green Version]
  54. Iida, M.; Harada, S.; Takebavashi, T. Application of metabolomics to epidemiological studies of atherosclerosis and cardiovascular disease. J. Atheroscler. Thromb. 2019, 26, 747–757. [Google Scholar] [CrossRef] [Green Version]
  55. Aubert, G.; Martin, O.J.; Horton, J.L.; Lai, L.; Vega, R.B.; Leone, T.C.; Koves, T.; Gardell, S.J.; Kruger, M.; Hoppel, C.L.; et al. The failing heart relies on ketone bodies as fuel. Circulation 2016, 133, 698–705. [Google Scholar] [CrossRef] [Green Version]
  56. Bedi, K.C., Jr.; Snyder, N.W.; Brandimarto, J.; Aziz, M.; Mesaros, C.; Worth, A.J.; Wang, L.L.; Javaheri, A.; Blair, I.A.; Margulies, K.B.; et al. Evidence for intramyocardial disruption of lipid metabolism and increased myocardial ketone utilization in advanced human heart failure. Circulation 2016, 133, 707–716. [Google Scholar] [CrossRef] [Green Version]
  57. Lopaschuk, G.D.; Ussher, J.R. Evolving concepts of myocardial energy metabolism: More than just fats and carbohydrates. Circ. Res. 2016, 119, 1173–1176. [Google Scholar] [CrossRef]
Figure 1. MIMIC model with the same twenty CES-D symptoms as formative (causal) and reflective (effect) indicators of depression in participants with diabetes who lost ten pounds over the past three months.
Symmetry 14 02275 g001
Table 1. Symmetric, bidirectional MIMIC models of CES-D depression items: formative and reflective indicators of depression across older adults and within chronic conditions and subgroups 1.
Chronic Conditions & Subgroups(A) Formative Indicators
(Synergies)
(B) Reflective Indicators
(Clustering Only)
CES-D Depression ItemsbS.E.z 2λS.E. z 2
I. Synergies and Clustering across the New Haven EPESE Community Sample of Older Adults (n = 2812)
Bothered by Things0.2900.0338.7520.4340.04710.890
Life a Failure0.1350.0462.9340.4360.03911.049
Crying Spells0.1570.0364.3450.4910.03713.448
Depressed0.7240.0927.8821.0000.000NA
Blues0.2210.0474.6830.6460.0339.320
Sad0.6710.05911.3060.8030.06319.723
Happy0.3850.0409.6410.6160.06312.691
Hopeful0.2360.0298.0240.3840.0389.844
Enjoyed Life0.1850.0316.0680.5500.03910.021
Good as Others 0.1460.0314.6980.3010.03914.115
Everything an Effort0.2450.0279.0590.5270.0327.691
Poor Appetite0.1810.0335.4850.3840.03716.535
Difficulty Concentrating0.3190.0417.7980.4110.03510.300
Talked Less than Usual0.1970.0336.0080.3600.03211.661
Restless Sleep0.2440.0278.9730.4580.04211.097
Not Get Going0.2620.0426.2080.4900.04111.858
Fearful0.2430.0386.3920.4630.0479.808
Lonely0.3530.02912.1340.5900.05810.147
People Unfriendly0.1950.0365.3530.2740.0289.845
People Disliked Me0.2490.0475.3180.3170.0349.426
II. Synergies and Clustering in Chronic Conditions
1. Diabetes x Hypertension with Medication (n = 77)
x Bothered by Things 0.6780.2822.409
x Life a Failure2.2220.9102.4410.4530.1383.280
x Crying Spells 0.7110.2293.112
x Depressed
x Blues 0.6890.2592.663
x Sad1.1000.4832.2800.7620.3861.976
x Happy 0.6700.3202.097
x Hopeful 0.5580.1783.132
x Enjoyed Life 0.7140.2862.493
x Good as Others 0.5020.1872.684
x Everything an Effort 0.7190.2922.464
x Poor Appetite 0.5860.1923.054
x Difficulty Concentrating 0.7280.3112.340
x Talked Less than Usual 0.5990.2042.932
x Restless Sleep 0.5760.2362.437
x Not Get Going 0.4190.1762.384
x Fearful0.6470.2442.6510.4910.2132.301
x Lonely 0.6940.3142.209
x People Unfriendly 0.4850.2162.243
x People Disliked Me1.3730.6062.2660.3830.1362.811
2. Diabetes x Lost ten Pounds (n = 71)
x Bothered by Things 0.7000.1893.706
x Life a Failure 0.5700.2142.665
x Crying Spells 0.6610.2053.226
x Depressed 0.7020.1793.928
x Blues 0.6920.2173.194
x Sad1.8770.3225.8300.6920.1793.855
x Happy 0.4950.1034.789
x Hopeful 0.5440.1134.803
x Enjoyed Life 0.3900.0904.335
x Good as Others 0.5480.2262.4270.6100.1913.200
x Everything an Effort 0.5680.0866.615
x Poor Appetite 0.5780.1663.470
x Difficulty Concentrating0.4850.1802.7000.5560.1892.939
x Talked Less than Usual 0.3330.0853.925
x Restless Sleep0.9780.2893.3820.5430.1254.361
x Not Get Going1.1530.3922.9410.4240.0785.443
x Fearful 0.4790.0925.192
x Lonely 0.6290.1943.242
x People Unfriendly 0.3850.0874.408
x People Disliked Me 0.4980.1313.799
1 I fixed the measurement loading (λ) of the CES-D item Depressed to one in order to set the metric of the measurement model. I compared the MIMIC model that included hypertension with medication as an interaction component to the subsample that excluded more progressed cerebrovascular disease (stroke, post-stroke cognitive impairment, vascular cognitive impairment), which may distort findings. The following reveals each disease group or subgroup that predict clustering across the full sample, the statistically significant reflective indicators that contribute to this clustering, and their measurement loadings (λ): Diabetes x Hypertension with Medication: Bothered by Things (0.479), Crying Spells (0.555), Blues (0.705), Sad (0.850), Enjoyed Life (0.607), Poor Appetite (0.436), Talked Less than Usual (0.411), Fearful (0.516), Lonely (0.635), and People Unfriendly (0.319). Diabetes x Lost Ten Pounds: Bothered by Things (0.456), Life a Failure (0.475), Crying Spells (0.522), Depressed (1.000), Blues (0.671), Sad (0.823), Happy (0.636), Hopeful (0.403), Enjoyed Life (0.571), Good as Others (0.337), Everything an Effort (0.549), Poor Appetite (0.405), Difficulty Concentrating (0.433), Talked Less than Usual (0.382), Restless Sleep (0.477), Not Get Going (0.510), Fearful (0.503), Lonely (0.606), and People Disliked Me (0.346). 2 Two-tailed test significance results are as follows: (1) z = 1.960 (p = 0.05); (2) z = 2.326 (p = 0.025); (3) z = 2.576 (p = 0.01); (4) z = 3.291 (p = 0.005).
Table 2. Symmetric, bidirectional MIMIC models of CES-D depression items in males and females: formative and reflective indicators of overall depression within chronic conditions and subgroups 1.
Chronic Conditions & Subgroups(A) Formative Indicators
(Synergies)
(B) Reflective Indicators
(Clustering Only)
CES-D Depression ItemsbS.E.z 2λS.E. z 2
1. Diabetes x Hypertension
(Males, n = 36)
x Bothered by Things2.5360.8732.9060.6240.1264.956
x Life a Failure 0.7110.1903.746
x Crying Spells 0.5500.2192.517
x Depressed 0.7980.1166.886
x Blues 0.6330.1304.886
x Sad 0.6590.1016.534
x Happy 0.6400.1424.492
x Hopeful 0.5860.1025.753
x Enjoyed Life3.1260.8953.4920.6480.2133.043
x Good as Others 0.3840.0844.580
x Everything an Effort 0.7970.1614.951
x Poor Appetite 0.5230.1363.843
x Difficulty Concentrating 0.6490.1324.923
x Talked Less than Usual 0.6490.1574.130
x Restless Sleep 0.6510.1424.579
x Not Get Going 0.6440.1384.682
x Fearful 0.6010.1294.654
x Lonely 0.6620.1275.234
x People Unfriendly1.0230.3263.1390.4540.0974.661
x People Disliked Me 0.5120.0975.258
2. Diabetes x Silent Cerebrovascular Disease
(Males, n = 31)
x Bothered by Things 0.4350.1943.706
x Life a Failure 0.2830.0722.665
x Depressed1.1730.5022.3390.3710.1223.226
x Blues2.5640.6473.9610.1420.0523.928
x Sad 0.2630.0733.194
x Happy1.3600.4003.4000.4150.1613.855
x Hopeful 0.4150.1734.789
x Enjoyed Life 0.2040.1014.803
x Good as Others 0.1340.0384.335
x Everything an Effort 0.4420.1893.200
x Poor Appetite 0.2810.0766.615
x Difficulty Concentrating 0.4570.2123.470
x Talked Less than Usual 0.3650.1322.939
x Restless Sleep 0.3910.1623.925
x Not Get Going 0.3440.1074.361
x Fearful1.0920.4942.2110.3230.1125.443
x Lonely 0.4850.2355.192
x People Unfriendly1.3300.5552.3950.3540.1283.242
x People Disliked Me 0.4020.2294.408
3. Diabetes x Excess Weight
(Males, n = 70)
x Bothered by Things 0.7000.1903.695
x Life a Failure 0.7160.2642.709
x Crying Spells 0.5620.1563.609
x Depressed 0.8240.2263.650
x Blues2.0821.0292.0220.6590.1853.554
x Sad 0.7000.1754.006
x Happy 0.7270.2063.522
x Hopeful 0.5530.1483.725
x Enjoyed Life 0.6870.2622.620
x Good as Others 0.3860.0924.213
x Everything an Effort 0.6950.2083.343
x Poor Appetite 0.3170.1172.712
x Difficulty Concentrating 0.7050.1923.671
x Talked Less than Usual 0.6940.2113.29
x Restless Sleep 0.5170.1653.140
x Not Get Going 0.6760.1923.530
x Fearful 0.6100.2412.533
x Lonely0.9560.4162.2970.7300.2153.393
x People Unfriendly 0.5580.1374.075
x People Disliked Me 0.5840.1264.629
4. Diabetes x Heart Attack
(Females, n = 34)
x Bothered by Things 0.4950.1363.626
x Life a Failure 0.3600.1232.935
x Crying Spells 0.3320.1422.329
x Depressed 0.5870.1155.081
x Blues 0.4520.0984.604
x Sad 0.5200.1094.774
x Happy 0.5980.1055.699
x Hopeful2.0820.3346.2300.4790.0696.964
x Enjoyed Life 0.4380.1273.448
x Good as Others
x Everything an Effort 0.4890.0736.651
x Poor Appetite0.8630.4401.9640.4860.1084.517
x Difficulty Concentrating0.9340.3862.4190.4900.1204.089
x Talked Less than Usual 0.3760.1362.756
x Restless Sleep2.2610.6413.5260.4890.0706.945
x Not Get Going1.3650.5662.4130.5170.0776.742
x Fearful 0.5030.1044.856
x Lonely 0.4210.1313.221
x People Unfriendly10.8971.9075.7130.2450.0356.909
x People Disliked Me 0.3060.0605.073
5. Diabetes x Heart Failure
(Females, n = 39)
x Bothered by Things 0.4890.0746.609
x Life a Failure 0.3360.1152.926
x Crying Spells 0.4500.1104.087
x Depressed 0.5550.0906.189
x Blues1.3270.5662.3460.5010.0598.539
x Sad 0.5530.0787.072
x Happy1.3090.3663.5780.4680.1144.111
x Hopeful 0.4520.0855.330
x Enjoyed Life 0.4970.0855.851
x Good as Others 0.3320.0933.580
x Everything an Effort1.1860.4462.6590.4640.0588.059
x Poor Appetite 0.5090.0608.445
x Difficulty Concentrating0.9460.4731.9980.4740.0885.354
x Talked Less than Usual0.7620.2533.0120.3990.0498.132
x Restless Sleep 0.4090.0994.111
x Not Get Going 0.4240.1073.954
x Fearful 0.3600.0854.250
x Lonely 0.4960.0588.620
x People Unfriendly2.7171.3332.0390.2720.0495.493
x People Disliked Me 0.2300.0376.249
6. Diabetes x Cancer (Females, n = 35)
x Bothered by Things1.1540.3413.3800.4520.1882.409
x Life a Failure 0.3590.1193.021
x Crying Spells1.7630.4703.7500.5160.2192.360
x Depressed0.6300.2162.920
x Blues2.3920.5264.5490.4880.2471.975
x Sad
x Happy
x Hopeful
x Enjoyed Life1.1330.4232.682
x Good as Others 0.3260.1632.005
x Everything an Effort 0.5180.2252.305
x Poor Appetite 0.4870.2392.039
x Difficulty Concentrating
x Talked Less than Usual
x Restless Sleep
x Not Get Going 0.4100.1892.171
x Fearful 0.4390.2142.057
x Lonely 0.4540.1952.327
x People Unfriendly
x People Disliked Me1.7130.2646.4950.2840.0962.954
7. Diabetes x Smoking (Males, n = 31)
x Bothered by Things1.7060.8512.0040.3630.0993.674
x Life a Failure
x Crying Spells
x Depressed 0.4720.1642.874
x Blues 0.4260.1213.518
x Sad 0.4360.1253.478
x Happy 0.3620.1083.361
x Hopeful 0.4000.1223.292
x Enjoyed Life 0.2360.0484.912
x Good as Others
x Everything an Effort 0.4770.1413.388
x Poor Appetite 0.3110.0813.826
x Difficulty Concentrating1.6200.7152.2650.3250.1482.199
x Talked Less than Usual 0.3200.1602.008
x Restless Sleep 0.3420.1162.959
x Not Get Going 0.3430.0953.602
x Fearful 0.3100.1112.804
x Lonely 0.3880.1193.250
x People Unfriendly 0.3700.1063.500
x People Disliked Me
8. Diabetes x Smoking (Females, n = 39)
x Bothered by Things 0.6840.1833.742
x Life a Failure 0.4370.1243.510
x Crying Spells 0.4970.1283.892
x Depressed 0.6630.1783.728
x Blues 0.5890.1563.778
x Sad2.1860.6023.6310.5630.1493.771
x Happy 0.4000.1342.980
x Hopeful 0.4660.1193.905
x Enjoyed Life 0.4420.1283.442
x Good as Others 0.4330.1363.180
x Everything an Effort 0.4790.1134.228
x Poor Appetite 0.5650.1164.870
x Difficulty Concentrating1.7060.6482.6320.6170.2212.789
x Talked Less than Usual 0.4030.1343.003
x Restless Sleep 0.5100.1533.335
x Not Get Going1.5620.7082.2080.4080.1093.753
x Fearful1.7460.8082.1610.3270.1073.064
x Lonely1.6310.6642.4550.4490.1203.734
x People Unfriendly 0.3620.1352.677
x People Disliked Me4.1121.4832.7730.3020.1242.435
1 I fixed the measurement loading (λ) of the CES-D item Depressed to one in order to set the metric of the measurement model. I compared the MIMIC models that include hypertension or silent cerebrovascular disease as an interaction component to the subsample that excluded more progressed cerebrovascular disease (stroke, post-stroke cognitive impairment, and vascular cognitive impairment), which may distort findings. The following reveals each disease group or subgroup that predict clustering across the subsample of males or females, the statistically significant reflective indicators that contribute to this clustering, and their measurement loadings (λ): Diabetes x Hypertension (Males, n = 36): Bothered by Things (0.534), Life a Failure (0.580), Crying Spells (0.496), Depressed (1.000), Blues (0.739), Sad (0.961), Happy (0.948), Hopeful (0.567), Enjoyed Life (0.739), Good as Others (0.312), Everything an Effort (0.601), Difficulty Concentrating (0.524), Talked Less than Usual (0.516), Restless Sleep (0.601), Not Get Going (0.656), Fearful (0.621), Lonely (0.755), People Unfriendly (0.427), and People Disliked Me (0.472). Diabetes x Silent Cerebrovascular Disease (Males, n = 31): Bothered by Things (0.553), Depressed (1.000), Happy (0.961), Hopeful (0.601), Everything an Effort (0.598), Poor Appetite (0.507), Difficulty Concentrating (0.555), Talked Less than Usual (0.522), Restless Sleep (0.573), Not Get Going (0.656), Fearful (0.639), Lonely (0.783), People Unfriendly (0.445), and People Disliked Me (0.494). Diabetes x Excess Weight (Males, n = 70): Bothered by Things (0.530), Life a Failure (0.627), Crying Spells (0.534), Depressed (1.000), Blues (0.772), Sad (0.925), Happy (0.908), Hopeful (0.515), Enjoyed Life (0.747), Everything an Effort (0.599), Poor Appetite (0.456), Difficulty Concentrating (0.537), Talked Less than Usual (0.515), Restless Sleep (0.538), Not Get Going (0.661), Fearful (0.647), Lonely (0.784), People Unfriendly (0.438), and People Disliked Me (0.475). Diabetes x Heart Attack (Females, n =34): Bothered by Things (0.419), Life a Failure (0.427), Crying Spells (0.520), Depressed (1.000), Blues (0.644), Sad (0.755), Happy (0.529), Hopeful (0.346), Enjoyed Life (0.518), Good as Others (0.320), Everything an Effort (0.547), Poor Appetite (0.362), Difficulty Concentrating (0.387), Talked Less than Usual (0.338), Restless Sleep (0.427), Not Get Going (0.452), Fearful (0.432), Lonely (0.551), People Unfriendly (0.244), and People Disliked Me (0.299). Diabetes x Heart Failure (Females, n = 39): Bothered by Things (0.419), Life a Failure (0.420), Crying Spells (0.513), Depressed (1.000), Blues (0.635), Sad (0.755), Happy (0.523), Hopeful (0.348), Enjoyed Life (0.507), Good as Others (0.313), Everything an Effort (0.545), Poor Appetite (0.358), Difficulty Concentrating (0.392), Talked Less than Usual (0.332), Restless Sleep (0.428), Not Get Going (0.457), Fearful (0.427), Lonely (0.531), People Unfriendly (0.237), and People Disliked Me (0.291). Diabetes x Cancer (Females, n = 35): No depressive symptoms contribute to clustering across the subsample of females. Diabetes x Smoking (Males, n = 31): Bothered by Things (0.552), Depressed (1.000), Blues (0.743), Sad (0.970), Happy (0.985), Hopeful (0.600), Effort (0.619), Poor Appetite (0.535), Talked Less than Usual (0.527), Restless Sleep (0.603), Not Get Going (0.669), Fearful (0.637), and Lonely (0.779). Diabetes x Smoking (Females, n = 39): Bothered by Things (0.417), Life a Failure (0.419), Crying Spells (0.509), Depressed (1.000), Blues (0.630), Sad (0.747), Happy (0.516), Hopeful (0.349), Enjoyed Life (0.522), Good as Others (0.312), Everything an Effort (0.543), Poor Appetite (0.364), Difficulty Concentrating (0.378), Talked Less than Usual (0.333), Restless Sleep (0.429), Not Get Going (0.448), Fearful (0.424), Lonely (0.517), People Unfriendly (0.251), and People Disliked Me (0.299). 2 Two-tailed test significance results are as follows: (1) z = 1.960 (p = 0.05); (2) z = 2.326 (p = 0.025); (3) z = 2.576 (p = 0.01); (4) z = 3.291 (p = 0.005).
Table 3. Symmetric, bidirectional MIMIC models of CES-D depression items by age group (65–74 and Over 74): formative and reflective indicators of overall depression within chronic conditions and subgroups 1.
Chronic Conditions & Subgroups(A) Formative Indicators
(Synergies)
(B) Reflective Indicators
(Clustering Only)
CES-D Depression ItemsbS.E.z 2λS.E. z 2
I. Synergies and Clustering in Hypertension
1. Diabetes x Hypertension (Ages 65–74, n = 56)
x Bothered by Things2.0710.5503.7640.6420.1095.907
x Life a Failure 0.5000.1263.958
x Crying Spells 0.5580.1334.196
x Depressed 0.7370.1335.544
x Blues 0.6560.1185.558
x Sad 0.6760.1305.185
x Happy 0.5400.1503.599
x Hopeful 0.5230.0925.707
x Enjoyed Life 0.5650.1134.987
x Good as Others 0.3750.1233.039
x Everything an Effort 0.6950.1195.835
x Poor Appetite 0.6300.1145.530
x Difficulty Concentrating 0.5700.0787.281
x Talked Less than Usual1.3370.4233.1630.4630.0815.710
x Restless Sleep 0.4980.1263.967
x Not Get Going 0.4910.1253.933
x Fearful 0.4930.1243.982
x Lonely 0.6490.1314.936
x People Unfriendly 0.3250.1063.076
x People Disliked Me 0.2810.0813.474
2. Diabetes x Hypertension (Over Age 74, n = 55)
x Bothered by Things1.6260.5363.0320.5680.1334.278
x Life a Failure 0.4030.0785.147
x Crying Spells 0.5360.1733.095
x Depressed 0.7700.2243.445
x Blues 0.6680.1604.185
x Sad0.8490.3842.2100.7240.2083.472
x Happy 0.6880.1993.457
x Hopeful 0.6190.1524.082
x Enjoyed Life 0.6170.1733.570
x Good as Others 0.3670.1612.285
x Everything an Effort1.2800.4922.6020.6370.1384.629
x Poor Appetite 0.2980.0923.245
x Difficulty Concentrating 0.5340.1154.651
x Talked Less than Usual 0.7150.2243.201
x Restless Sleep 0.6650.2942.261
x Not Get Going 0.4140.1373.035
x Fearful2.2200.7532.9460.5440.2002.714
x Lonely 0.6270.1464.280
x People Unfriendly 0.5670.1743.259
x People Disliked Me 0.3880.0894.343
3. Diabetes x Hypertension with No Medication(Ages 65–74, n = 56)
x Bothered by Things2.0680.5513.7520.6470.1125.804
x Life a Failure 0.5030.1273.967
x Crying Spells 0.5670.1344.234
x Depressed 0.7470.1385.422
x Blues 0.6640.1225.425
x Sad 0.6840.1345.092
x Happy 0.5430.1523.569
x Hopeful 0.5240.0935.624
x Enjoyed Life 0.5680.1164.901
x Good as Others 0.3770.1802.101
x Everything an Effort 0.7040.1225.755
x Poor Appetite 0.6380.1165.480
x Difficulty Concentrating 0.5700.0797.184
x Talked Less than Usual1.3360.4233.1620.4640.0825.682
x Restless Sleep 0.4990.1273.929
x Not Get Going 0.4920.1263.906
x Fearful 0.4950.1253.944
x Lonely 0.6540.1364.822
x People Unfriendly 0.3250.1162.796
x People Disliked Me 0.2830.0793.581
4. Diabetes x Hypertension with No Medication(Over Age 74, n = 54)
x Bothered by Things1.6090.5542.9050.5710.1294.44
x Life a Failure 0.4050.0775.252
x Crying Spells 0.5370.1663.238
x Depressed 0.7680.2053.743
x Blues 0.6680.1504.448
x Sad 0.7260.1923.773
x Happy 0.6900.1863.715
x Hopeful 0.6220.1414.411
x Enjoyed Life 0.6180.1663.729
x Good as Others 0.3690.1522.435
x Everything an Effort1.2930.5242.4690.6370.1304.908
x Poor Appetite 0.3040.0903.385
x Difficulty Concentrating 0.5350.1075.002
x Talked Less than Usual 0.7150.2093.424
x Restless Sleep 0.6680.1624.128
x Not Get Going 0.4190.1393.018
x Fearful2.2070.7362.9990.5460.2022.701
x Lonely0.6420.3251.9770.6320.1404.523
x People Unfriendly 0.5670.1643.452
x People Disliked Me 0.3900.0864.523
5. Diabetes x Suspected Hypertension (Over Age 74, n = 8)
x Bothered by Things 0.8120.2133.816
x Life a Failure 0.6400.1394.611
x Crying Spells 0.7520.1574.781
x Depressed 1.0520.3403.098
x Blues 0.9670.2863.382
x Sad 0.9410.2883.269
x Happy 0.9480.2733.479
x Hopeful 0.7830.2233.506
x Enjoyed Life 0.9180.2553.601
x Good as Others 0.5790.1863.111
x Everything an Effort 0.9380.2643.561
x Poor Appetite 0.4560.1183.859
x Difficulty Concentrating 0.6780.1484.569
x Talked Less than Usual 0.9060.3302.742
x Restless Sleep 0.8270.2493.325
x Not Get Going 0.5870.1473.995
x Fearful2.2310.7662.9140.6980.2213.153
x Lonely 0.8790.2493.532
x People Unfriendly 0.7040.2073.406
x People Disliked Me 0.5850.1155.070
6. Diabetes x Hypertension with No Medication
or Suspected Hypertension (Ages 65–74, n = 56)
x Bothered by Things2.0780.5523.7650.6450.1105.844
x Life a Failure 0.5010.1273.948
x Crying Spells 0.5620.1334.216
x Depressed 0.7410.1365.465
x Blues 0.6590.1205.489
x Sad 0.6800.1335.126
x Happy 0.5410.1513.572
x Hopeful 0.5230.0935.633
x Enjoyed Life 0.5660.1154.929
x Good as Others 0.3760.1243.023
x Everything an Effort 0.6990.1215.771
x Poor Appetite 0.6330.1155.491
x Difficulty Concentrating 0.5700.0797.221
x Talked Less than Usual1.3390.4243.1600.4640.0825.684
x Restless Sleep 0.4990.1263.946
x Not Get Going 0.4920.1263.911
x Fearful 0.4940.1253.942
x Lonely 0.6510.1344.871
x People Unfriendly 0.3250.1162.798
x People Disliked Me 0.2820.0803.546
II. Synergies and Clustering in Other Conditions
1. Diabetes x Silent Cerebrovascular Disease(Ages 65–74, n = 39)
x Bothered by Things 0.5210.0945.537
x Life a Failure 0.3990.1392.874
x Crying Spells0.6300.3181.9780.4060.0894.578
x Depressed 0.5360.0975.524
x Blues0.7780.2882.7060.4910.0786.285
x Sad 0.5130.0935.546
x Happy1.0770.2065.2190.5290.0776.910
x Hopeful 0.4190.0725.831
x Enjoyed Life 0.4920.1902.594
x Good as Others 0.3560.1123.179
x Everything an Effort1.0470.4932.1250.3650.0824.447
x Poor Appetite 0.4750.0935.113
x Difficulty Concentrating0.6770.2193.0970.4170.0914.590
x Talked Less than Usual 0.3840.0804.780
x Restless Sleep 0.4120.0676.120
x Not Get Going 0.4660.0865.439
x Fearful 0.3630.0904.014
x Lonely 0.4090.0984.183
x People Unfriendly1.9280.7662.5180.2440.0902.702
x People Disliked Me 0.3200.1542.075
2. Stroke with No Diabetes (Over Age 74, n = 39)
Stroke with No Diabetes15.6561.40411.155
x Bothered by Things 0.4440.04210.595
x Life a Failure 0.3340.0526.410
x Crying Spells 0.3930.1113.554
x Depressed 0.4990.0726.953
x Blues 0.4760.0865.513
x Sad 0.4390.0785.610
x Happy 0.4950.0905.473
x Hopeful0.2340.1082.1640.3980.0439.325
x Enjoyed Life 0.4440.0835.327
x Good as Others 0.3690.0645.724
x Everything an Effort0.5410.2312.3450.4630.0905.161
x Poor Appetite0.5440.1922.8400.4190.0805.249
x Difficulty Concentrating1.6100.4873.3050.4450.04011.162
x Talked Less than Usual0.5950.2802.1230.4540.0607.548
x Restless Sleep 0.4040.0547.413
x Not Get Going 0.4210.0469.227
x Fearful 0.5120.1293.984
x Lonely 0.4230.0835.061
x People Unfriendly0.6330.2073.0550.3860.0834.671
x People Disliked Me 0.4220.1133.753
3. Diabetes x Heart Attack (Over Age 74, n = 37)
x Bothered by Things 0.5050.1283.953
x Life a Failure 0.3660.1232.966
x Crying Spells
x Depressed 0.5490.1433.851
x Blues1.7400.6462.6930.3860.1332.912
x Sad2.5360.8203.0940.4610.1383.348
x Happy 0.5410.1274.26
x Hopeful 0.4210.0954.421
x Enjoyed Life 0.3830.1582.424
x Good as Others 0.2950.0953.102
x Everything an Effort 0.4630.0895.186
x Poor Appetite 0.4710.1144.126
x Difficulty Concentrating 0.4490.1193.780
x Talked Less than Usual 0.3960.1253.173
x Restless Sleep 0.4920.0925.366
x Not Get Going1.3270.4582.8990.4920.1014.867
x Fearful2.5301.2102.0910.4650.1124.159
x Lonely1.1090.3483.1930.3950.1283.092
x People Unfriendly 0.2720.0475.816
x People Disliked Me5.0421.2114.1650.2250.0524.332
4. Diabetes x Excess Weight (Ages 65–74, n = 100)
x Bothered by Things 0.7560.1047.245
x Life a Failure 0.5770.1244.669
x Crying Spells 0.8000.1605.004
x Depressed 0.8830.1237.179
x Blues1.8040.4963.6400.8000.0998.068
x Sad 0.9870.1397.113
x Happy0.7430.3002.4750.6940.1454.793
x Hopeful 0.5860.0777.626
x Enjoyed Life 0.7970.1037.730
x Good as Others 0.5270.1084.864
x Everything an Effort 0.7690.0888.766
x Poor Appetite 0.6180.1185.238
x Difficulty Concentrating1.1110.3513.1670.6130.1065.799
x Talked Less than Usual 0.6280.0887.167
x Restless Sleep 0.5400.0737.353
x Not Get Going1.1070.5532.0010.5630.0777.359
x Fearful0.9380.3672.5540.5340.1015.304
x Lonely0.6080.3002.0220.7310.1206.075
x People Unfriendly0.8590.2813.0590.5350.1124.758
x People Disliked Me 0.4410.0587.607
5. Diabetes x Heart Failure (Over Age 74, n = 32)
x Bothered by Things1.6850.6402.633
x Life a Failure
x Crying Spells2.7701.2102.289
x Depressed
x Blues4.4521.5782.821
x Sad1.0460.4362.401
x Happy
x Hopeful
x Enjoyed Life
x Good as Others
x Everything an Effort
x Poor Appetite0.8610.4092.106
x Difficulty Concentrating0.8360.3972.105
x Talked Less than Usual
x Restless Sleep
x Not Get Going3.2691.2082.706
x Fearful4.7912.0602.326
x Lonely2.0570.8222.503
x People Unfriendly0.7420.2872.582
x People Disliked Me5.8202.4362.389
6. Diabetes x Smoking (Ages 65–74, n = 39)
x Bothered by Things 0.5640.0886.391
x Life a Failure 0.4180.1113.754
x Crying Spells 0.5180.0935.569
x Depressed 0.6350.1125.661
x Blues 0.6190.0986.303
x Sad1.7630.5253.3550.5740.1085.301
x Happy 0.4480.1133.966
x Hopeful 0.4590.0736.269
x Enjoyed Life 0.5680.0866.589
x Good as Others 0.3920.1462.689
x Everything an Effort1.1090.3003.7010.4310.0795.476
x Poor Appetite 0.4850.0716.791
x Difficulty Concentrating 0.5430.1094.987
x Talked Less than Usual 0.4430.0964.634
x Restless Sleep 0.4350.0974.490
x Not Get Going 0.4290.0864.997
x Fearful1.7850.7182.4860.3450.0734.691
x Lonely 0.4580.0974.733
x People Unfriendly 0.3420.0784.398
x People Disliked Me 0.2860.1162.461
7. Diabetes x Lost Ten Pounds
(Ages 65–74, n = 39)
x Bothered by Things3.2270.9203.5090.5330.1643.243
x Life a Failure 0.2020.0563.595
x Crying Spells 0.3740.1891.978
x Depressed2.0320.7372.7570.4740.1553.060
x Blues 0.4570.1463.122
x Sad 0.5120.1403.663
x Happy 0.4500.1183.820
x Hopeful 0.4560.1163.943
x Enjoyed Life 0.3920.0765.172
x Good as Others0.9160.3272.8040.3580.1332.699
x Everything an Effort 0.4470.1173.807
x Poor Appetite 0.3960.1522.610
x Difficulty Concentrating1.2920.3793.4140.4780.1094.397
x Talked Less than Usual 0.3720.1402.659
x Restless Sleep 0.4240.1004.243
x Not Get Going 0.4650.1104.244
x Fearful2.6950.4386.1570.3930.1502.621
x Lonely 0.4700.1612.927
x People Unfriendly
x People Disliked Me 0.4020.2041.972
1 I fixed the measurement loading (λ) of the CES-D item Depressed to one in order to set the metric of the measurement model. I compared the MIMIC models that included hypertension, hypertension with no medication, suspected hypertension, hypertension with no medication or suspected hypertension, or silent cerebrovascular disease as an interaction component to the subsample that excluded more progressed cerebrovascular disease (stroke, post-stroke cognitive impairment, vascular cognitive impairment), which may distort findings. The following reveals each disease group or subgroup that predicts clustering across the subsample of ages 65–74 or over age 74, the reflective indicators that contribute to this clustering, and their range of measurement loadings: Diabetes x Hypertension (Ages 65–74, n = 56): Bothered by Things (0.487), Life a Failure (0.524), Crying Spells (0.519), Depressed (1.000), Blues (0.692), Sad (0.793), Happy (0.647), Hopeful (0.398), Enjoyed Life (0.630), Good as Others (0.369), Everything an Effort (0.554), Poor Appetite (0.424), Difficulty Concentrating (0.474), Talked Less than Others (0.388), Restless Sleep (0.461), Not Get Going (0.532), Fearful (0.473), Lonely (0.602), People Unfriendly (0.325), and People Disliked Me (0.423). Diabetes x Hypertension (Over Age 74, n = 55): Depressed (1.000), Blues (0.671), Happy (0.616), Enjoyed Life (0.529), Talked Less than Usual (0.406), Fearful (0.523), and People Unfriendly (0.293). Diabetes x Hypertension with No Medication (Ages 65–74, n = 56): Bothered by Things (0.487), Life a Failure (0523), Crying Spells (0.518), Depressed (1.000), Blues (0.691), Sad (0.794), Happy (0.646), Hopeful (0.398), Enjoyed Life (0.630), Good as Others (0.369), Everything an Effort (0.554), Poor Appetite (0.424), Difficulty Concentrating (0.473), Talked Less than Usual (0.387), Restless Sleep (0.460), Not Get Going (0.531), Fearful (0.472), Lonely (0.601), People Unfriendly (0.324), and People Disliked Me (0.421). Diabetes x Hypertension with No Medication (Over Age 74, n = 54): Bothered by Things (0.424), Depressed (1.000), Blues (0.672), Sad (0.870), Happy (0.619), Enjoyed Life (0.531), Difficulty Concentrating (0.388), Talked Less than Usual (0.408), Fearful (0.525), and People Unfriendly (0.293). Diabetes x Suspected Hypertension (Over Age 74, n = 8): Hopeful (0.403), Everything an Effort (0.585), and Not Get Going (0.574). Diabetes x Hypertension with No Medication or Suspected Hypertension (Ages 65–74, n = 56): Bothered by Things (0.487), Life a Failure (0.523), Crying Spells (0.518), Depressed (1.000), Blues (0.692), Sad (0.794), Happy (0.646), Hopeful (0.397), Enjoyed Life (0.629), Good as Others (0.369), Everything an Effort (0.554), Poor Appetite (0.423), Difficulty Concentrating (0.473), Talked Less than Usual (0.387), Restless Sleep (0.460), Not Get Going (0.531), Fearful (0.472), Lonely (0.601), People Unfriendly (0.324), and People Disliked Me (0.422). Diabetes x Silent Cerebrovascular Disease (Ages 65–74, n = 39): Bothered by Things (0.489), Life a Failure (0.509), Crying Spells (0.500), Depressed (1.000), Blues (0.679), Sad (0.818), Happy (0.686), Hopeful (0.403), Enjoyed Life (0.657), Good as Others (0.370), Everything an Effort (0.530), Poor Appetite (0.399), Difficulty Concentrating (0.477), Talked Less than Usual (0.372), Restless Sleep (0.455), Not Get Going (0.517), Fearful (0.460), Lonely (0.604), People Unfriendly (0.326), and People Disliked Me (0.400). Stroke with No Diabetes (Over Age 74, n = 39): Predicts the weighted index (additive composite) of overall depression but none of the specific reflective indicators across the twenty CES-D depressive symptoms. Diabetes x Heart Attack (Over Age 74, n = 37): Bothered by Things (0.435), Life a Failure (0.458), Crying Spells (0.590), Depressed (1.000), Blues (0.703), Sad (0.886), Happy (0.626), Hopeful (0.403), Enjoyed Life (0.546), Everything an Effort (0.578), Poor Appetite (0.418), Difficulty Concentrating (0.399), Talked Less than Usual (0.407), Restless Sleep (0.523), Not Get Going (0.527), Fearful (0.550), Lonely (0.663), and People Unfriendly (0.288). Diabetes x Excess Weight (Ages 65–74, n = 100): Bothered by Things (0.507), Life a Failure (0.558), Crying Spells (0.569), Depressed (1.000), Blues (0.732), Sad (0.820), Happy (0.664), Hopeful (0.396), Enjoyed Life (0.680), Good as Others (0.393), Everything an Effort (0.572), Poor Appetite (0.442), Difficulty Concentrating (0.498), Talked Less than Usual (0.417), Restless Sleep (0.457), Not Get Going (0.547), Fearful (0.499), Lonely (0.622), and People Disliked Me (0.449). Diabetes x Heart Failure (Over Age 74, n = 32): Predicts none of the specific reflective indicators across the twenty CES-D depressive symptoms. Diabetes x Smoking (Ages 65–74, n = 39): Bothered by Things (0.489), Life a Failure (0.507), Crying Spells (0.510), Depressed (1.000), Blues (0.685), Sad (0.793), Happy (0.648), Hopeful (0.397), Enjoyed Life (0.637), Good as Others (0.376), Everything an Effort (0.543), Poor Appetite (0.427), Difficulty Concentrating (0.478), Talked Less than Usual (0.383), Restless Sleep (0.460), Not Get Going (0.522), Fearful (0.465), Lonely (0.590), People Unfriendly (0.322), and People Disliked Me (0.410). Diabetes x Lost Ten Pounds (Ages 65–74, n = 39): Bothered by Things (0.484), Life a Failure (0.516), Crying Spells (0.493), Depressed (1.000), Blues (0.669), Sad (0.802), Happy (0.665), Hopeful (0.408), Enjoyed Life (0.623), Good as Others (0.363), Everything an Effort (0.545), Poor Appetite (0.403), Difficulty Concentrating (0.480), Talked Less than Others (0.376), Restless Sleep (0.465), Not Get Going (0.522), Fearful (0.465), Lonely (0.606), People Unfriendly (0.309), and People Disliked Me (0.392). 2 Two-tailed test significance is as follows: (1) z = 1.960 (p = 0.05); (2) z = 2.326 (p = 0.025); (3) z = 2.576 (p = 0.01); (4) z = 3.291 (p = 0.005).
Publisher’s Note: MDPI stays neutral with regard to jurisdictional claims in published maps and institutional affiliations.

