Article

Evaluation of Pipe Materials in Water System Networks Using the Theory of Advanced Multi-Criteria Analysis

by
Omar Abdulah Shrrat Omar
1,2
1
Mechanical Engineering Department, Mechanical Engineering Faculty, Transilvania University of Brașov, 500036 Brasov, Romania
2
Garri1&2 Power Plant, Sudanese Thermal Power Generating STPG, Ministry of Energy & Petroleum, Khartoum 13080, Sudan
Sustainability 2023, 15(5), 4491; https://doi.org/10.3390/su15054491
Submission received: 26 January 2023 / Revised: 22 February 2023 / Accepted: 24 February 2023 / Published: 2 March 2023
(This article belongs to the Section Sustainable Water Management)

Abstract

:
This study used a multi-criteria analysis to find the optimal material for water pipes in water systems. This paper used FRISCO for calculating the criteria weights and ranking the considered types of pipes. Five different types are considered using 22 criteria. The considered criteria included economic, environmental, and pipe properties. The results showed that the FRISCO method could be used for decision-making in water systems.

1. Introduction

Modern cities have complex above- and below-ground infrastructure. Our drinking water, delivered by a network of underground pipes, is vital to public health and the economy. This underground infrastructure is often neglected [1]. According to the Environmental Protection Agency, 4000–5000 miles of pipes are replaced annually, and this number is expected to rise [2]. When water pipes are not taken care of, they do not function properly, and water is wasted [3]. Leaks, interruptions, and other problems in pipes throughout water distribution systems lead to water loss, also known as non-revenue water (NRW). The global annual NRW volume reached 126 billion cubic meters, and it reduces the quality of water services, the city’s water supply, and water quality and increases energy use [4]. Eighty-three percentage of non-revenue water was caused by leaks in transmission mains and service connections [5]. For instance, between 2014 and 2020, water system transmission lost 41% of Glendale’s potable water production [6] and 10–30% in the United States and the United Kingdom. Developing countries may reach 70%; in addition, 3–7% in the Netherlands [7], 45% in Turkey [8], 47% in rural Iran [9], 40% in Addis Ababa, Ethiopia [10], 54% in Gabon, 20% in Burkina Faso, 72% in Nigeria [11], and 57.2–58% in Skiathos, Greece [12]. The quality and the type of pipe material have a significant impact on it [13]. To reduce NRW due to leakage and pipe failure, water loss is reduced by replacing the pipes [13,14]. Material choice is one of the most difficult parts of designing and making structural elements. It is also important for success, cutting costs, and obtaining better results [15]. Leaky pipes include transmission, distribution, and service. Depending on where they occur, they have different flow rates, disrupting tendencies, and visibility [16]. There is a close relationship between choosing the pipe material in the water systems, whether they are extension systems for old projects or for new projects, and maintaining the quality, safety, sustainability, and costs of the water systems. In light of climate change and water scarcity, research on water loss in potable water systems during transport is essential. After the design is completed, it can be hard to choose the right materials because materials can have so many different properties [17], and inappropriate materials can cause the network of water to fail, and its competitiveness depends on its material selection [18]. In order to properly allocate resources, stakeholders are more concerned with understanding the causes of pipe failure [19].
The pipes must be renewed or replaced to ensure the safety and dependability of the water distribution system. To ensure a clean and safe water supply, it is necessary to replace or improve the water distribution system’s pipes and infrastructure. Leaky pipes result in water loss, infrastructure damage, and degraded water quality. To meet quality, distribution, safety, and sustainability standards, water systems are occasionally required to be rehabilitated or replaced.
In order to meet the needs of all parties involved, those making decisions about piping rehabilitation or replacement must make material choices. Should the current pipe material be used or should it be upgraded to something more suitable in terms of the environment, safety, sustainability, cost, etc.? Environmental impact, price, failure likelihood, useful life, and other metrics will be used to draw comparisons between various pipe markets. Since there are so many different kinds of materials, and each one has its own unique properties, it is important to use a systematic and effective way to figure out which ones will make the best replacements for pipes [15].
Various investigations have attempted to determine what influences the pipes that transport water. This research looked at how to combine the most important criteria when selecting pipe material for a new project or repairing it when there are many different options available, using FRISCO’s advanced multi-criteria analysis method.

1.1. Literature Review

The goal of the literature review is to study the water network by identifying the pipes and the factors that affect pipe failure. Then, they will be compared to figure out how to choose the best material for pipes if there are many options.

1.1.1. Literature Review on the Most Prevalent Option for Pipes

Pipes are the most frequently used component in water distribution systems. Having safe water pipes in place from the point of source all the way to the tap protects the public from contaminated water [20]. Using a theory of advanced multi-criteria analysis, the pipes under investigation were selected as viable alternatives that exist on the market and are widely utilized in water distribution systems, and based on the literature, most of the pipes that were used were those mentioned in the Rates of Water Main Failure in the United States and Canada detailed research. The percentage of pipes used was as follows: cast iron (CI, 28%), ductile iron (DI, 28%), polyvinyl chloride (PVC, 22%), and asbestos cement (AC, 13%). High-density polyethylene (HDPE), steel, molecularly oriented polyvinyl chloride (PVCO), concrete steel cylinder (CSC), and other materials make up the remaining 9% [1]. According to reference [21], HDPE and PVC pipes are widely used for water distribution. To investigate pipe failure, cast iron (CI), steel, ductile iron (DI), asbestos cement (AC) [1], PVC [22,23], and high-density polyethylene (HDPE) [24,25,26,27,28,29] pipes were studied. As also mentioned in these study [1], during the rehabilitation of a water pipeline, several alternatives to pipe materials, including ductile iron, cast iron, polyethylene, concrete, and asbestos cement, were compared to determine the most degraded material for replacement. CI, DI, AC, PVC-reinforced concrete, HDPE, PE, and other materials are used for water networks [1].

1.1.2. Water Distribution System Criteria and Design Considerations

During the rehabilitation of a water pipeline, several alternatives to pipe materials, including ductile iron, cast iron, polyethylene, concrete, and asbestos cement, were compared to determine the most degraded material for replacement [1]. In comparison to iron pipes, asbestos pipes are lighter, less rough, resistant to corrosion, and have low friction, and its disadvantages are load-induced fragility, repair difficulty, and low resistance to vibrations [30]. In the process of selecting a specific asbestos pipe, the following variables were compared as the most important: pressure loss, installation, price, lifespan, installation time, dimensions of pipes, including pipe length and diameter [31], reliability, system complexity, system efficiency, costs, environmental impacts, and sustainability [32].

1.1.3. Literature Review of Pipe Comparison Criteria

The selection of pipes affects the effectiveness of water distribution systems. A number of factors must be considered before selecting a water pipe. Each possibility needs to be assessed. This section will examine a variety of selection variables.

Low Cost of Production

When production costs are kept low, prices can be reduced and more people can afford the final product. It lessens the amount of pollution and waste created during production. Investment in renewable energy and recycling, for example, can be made more affordable if production costs are kept low. The result is less pollution and less depletion of natural resources. The cost of making a pipe varies depending on the material used, the size, the number of pipes made, and the machinery and labor involved. DI pipes have the highest production costs per kilometer of 305-mm-diameter pipes at $11.7/meter, followed by CI pipes at $8.725/m, PVC pipes at $7.875/m, and finally HDPE pipes at $5.375/m [33]. Manufacturing AC pipes is less expensive since it requires 40% less energy to manufacture than PVC pipes [34].

Recyclability of Pipes

Pipe recycling benefits the environment and industries that use it. These include improving sustainability, reducing environmental impact, and lowering industry and customer costs by reducing waste and energy use in pipe production from raw materials. The pipe material, recycling facilities, and demand for recycled materials determine whether a pipe can be recycled after its lifespan. Product environmental analysis should consider recyclability. PVC pipe is recyclable [35]. The melting down of HDPE, CI, and DI allows for their subsequent use in the production of brand-new goods.

Losses Due to Friction Depend on Coefficient Factors

By lowering friction, we can save working capital on energy, maintenance, and repairs. In water distribution networks, adequate pressure is essential for delivering water. It is affected by variables such as the coefficient of roughness [36]. In a piping system, friction loss is the energy or pressure lost due to fluid resistance. Pipe roughness is represented by a coefficient of friction in the Darcy–Weisbach equation and the Hazen–Williams equation [37]. The Hazen–Williams coefficients of friction for HDPE, DI, and PVC are 140 [38]; according to reference [39], the AC and PVC pipes are 130 and 130–140, respectively. The friction factor of PVC and CI is the same [40]. Related to energy loss due to friction, cities consume 75% of the world’s resources, 60–80% of its energy, and 75% of its harmful gas emissions [41]. AC has the lowest head loss, followed by DI and CI [42]: AC is 140; CI is 130 for new pipe, 40–120 for old pipe, 110 for 10 years, 90 for 20 years; DI is 140; and PVC is 130–140 [43]. The total energy needed in 50 years for pipes with a diameter of 508 mm over a distance of 1 km, expressed as a percentage, is 39%, 32%, and 29% for DI, HDPE, and PVC pipes, respectively [44]. The pipe can be sorted according to the average, with CI having a value of 110, followed by AC 133, PVC 134, HDPE 135, and DI 139.

Lifespans of Pipes

Pipes have a lifespan before they require replacement or repair due to normal damage. Since 1950, human activity has caused climate change [45]. The materials’ lifespans, diameters, and pressures can determine their environmental impact [46]. PVC, high-density polyethylene, and DI pipes have 25-, 50-, and over 50-year average life spans [46]. PVC, HDPE, LDPE, and DI have a lifespan of up to 100 years under good monitoring [47]. The age estimate for AC, PVC, and HDPE is 50 years and for DI and CI is 100 years [30]. According to reference [48], HDPE lasted longer than its expected 50 years. Water pumping and pipe transport have factory-set conditions. The 158.4 km of water pipes include 6.4 km of CI, 0.8 km of AC, 44.6 km of PVC, and 88.4 km of polyethylene. In the first 10 years, 54.9% of the operational life was used, followed by 30.3% in the next 25 years, and 14.9% in the next 50 years [49]. PE pipe material is 30 years old and still safe to use [50]. By arranging the pipes in the following order, the average age is calculated: PVC 75, HDPE 83, DI 83 and above, AC 100, and CI 100 years.

Probability of Failure

Pipe material, design and installation, operating conditions, and quality affect pipe failure probability. Pipe deterioration increases breakage rates, reduces hydraulic capacity, affects water quality, and shortens service life [51]. Some of the most common ways for HDPE pipes to break are ductile overload, non-ductile or pinhole cracks, and oxidative degradation [52]; for example, leaks at CI pipe sleeve connections; HDPE tee cracks, connector cracks, and pipe cracks; PVC pipe cracks, pipe corrosion, and tee leaks [49]. Between 1998 and 2002, the average number of pipe breaks per 100 miles in the United Kingdom was 5 for HDPE, compared to 8 for DI, 12 for PVC, 26 for AC, and 32 for CI [53]. In a Dutch failure case study, maintenance and failure data from seven companies were used to figure out how likely it was that a pipe would break in the future. Pipes are classified based on how easily they break during installation (AC, PE and PVC, CI, and DI), how quickly they deteriorate internally (AC, CI, DI, and PE and PVC), how quickly they deteriorate externally (CI, AC, PE and PVC, DI), and how quickly they deteriorate during land traffic (CI, AC, PE and PVC, and DI) [54]. It is possible to make a solid case out of DI, PVC, or HDPE, as mentioned in [53]. For optimal seismic performance in Los Angeles, high-density polyethylene (HDPE) or DI with locking joints may be the best option. Given a repair rate of six repairs per kilometer, the number of times a water pipeline is fixed per kilometer is mentioned in [55]. The length of the pipe increases the odds of breakage. Reducing the pipe diameter increases the possibility of breakage [56]. Pipes are more likely to break when pressure rises [56,57]. In general, there is a high risk of damage with PVC pipes [56]. NRW losses were studied as a network. Pipe bursts, breaks, and leaks have been reported in 14 states (2013–2017: 2,262,798 complaints): AC, 27.1%; HDPE, 19%; uPVC, 14.3%; DI, 8%; CI, 0.5%; and others, 2.1%. HDPE pipes contribute more to NRW than DI pipes; the study focused on HDPE, mild steel, and DI pipes [13]. CI and AC pipes fail over time, but for different reasons. CI fails due to a common fault, and AC fails due to a circular fault [58]. To evaluate the 14 pipe failure studies, we compared them using numbers from 1 to 5, with 5 representing the pipe with the lowest risk of failure, followed by the numbers from 4 to 1, and finally the arithmetic mean. DI has the lowest failure rate (3.79), followed by HDPE (3.7), PVC (3.15), CI (2.7), and AC (2.43), based on the arithmetic mean of the failure rates for each material. ’Examining Success Probabilities for ground movement Section also lists earthquake failure criteria.

Repair and Replacement Costs

The cost of maintaining a piping system varies according to its material, age, maintenance frequency, and maintenance or reinstallation procedures. Certain materials require special equipment. Professional replacement or repair may increase the cost of maintenance. Pipes are arranged according to their lifespan, CI, AC, DI, HDPE, and PVC; according to their installation, HDPE and PVC are the same and lower than DI and CI [33]; according to the probability of failure, DI has the lowest failure rate followed by HDPE, PVC, CI, and AC.

Pipe Weight and Portability

The densities per meter of PVC, HDPE, and DI for a diameter of 200 mm are 17.26, 15.02, and 31.40 kg/m, respectively [38]. The weight saving over PVC/DI pipe is 13% [47]. Lightweight PVC pipe reduces transportation costs and affects the climate while also simplifying pipe handling on-site [35]. For a pipe with a diameter of 300 mm, PVC is 10, CI is 68, PE is 11.5 kg/m [59], and AC is 27.4 kg/m [60].

Water Supply System Reliability

A piping system’s reliability is its long-term ability to perform its intended function. Pipe material, age, and resistance to failure due to the impact of wear, corrosion resistance, temperatures, UV radiation, or aggressive chemicals can all have an impact on the reliability of a piping system. Together, these elements cause pipe failure.

Traffic Density and Road Conditions Affect Pipes

Failure of local water supply systems as a result of traffic leads to higher repair costs, excessive water losses, and limited destruction of other utility networks [61]. For example, the deformation and failure of HDPE pipes are influenced by factors, such as traffic loads [62].. The environmental impact of road construction exceeds that of transportation and installation combined [46]. Heavy vehicles driving over buried HDPE, PVC, and DI pipes were modeled using finite element analysis. These loads had minimal effects under many conditions, including corrosion [24].

Ease of Handling Emergency Situations

Time is of the essence, so a piping system that is easy to access and repair is crucial. The type of pipe material, ease of repair, whether the pipe is buried deep underground, accessibility, special tools and equipment, weight and brittleness, location, and accessibility can affect emergency response. Metal and asbestos pipes require more extensive repairs or replacements, while plastic pipes can be repaired with a coupling. HDPE and PVC pipes are lightweight and easy to move. CI, DI, and AC are heavy and difficult to handle.

Estimated Future Repair and Replacement Expenses

Pipes made of materials like PVC or HDPE may require more frequent maintenance and have a higher repair and replacement cost due to their lower durability, whereas pipes made of Lifespan DI and CI may require less frequent maintenance and have a lower repair and replacement cost due to their higher durability.

Material Corrosion Rate

Corrosion is one of the most significant factors affecting water quality and pipe corrosion. AC resists corrosion. It has health risks that limit installation. DI and CI can be corroded by aggressive water. There have been several reports of red and turbid water. PVC and HDPE are resistant to corrosion. Some pipe plasticizers contain lead, an emerging pollutant problem [63]. Similarly, rapid corrosion occurs in both CI and DI [1]. Leaching corrosion causes AC pipes to fail [64,65,66]. In an investigation into the reasons for the failure of cast iron and steel pipes, corrosion, transient pressure, and street loads were identified as the leading causes of failure for large-diameter pipes [22]. Iron release from CI pipes causes red water [67] Cast iron is affected both internally and externally by corrosion, which causes pipeline failure and fracture [68].

Environmental Impact

Different pipe materials can have very different effects on the environment, depending on the material and how it is made, installed, and thrown away [33]. This criterion is important because it makes it necessary to look at how the environment might change over the life of the pipe to figure out how it will affect the environment. The life cycle of PVC, HDPE, and DI pipes was analyzed to determine their carbon emissions in energy, pipe installation, use, and transportation. The percentage difference is as follows: 25%, 25%, and 26% for PVC, HDPE, and DI pipes, respectively [33]. DI and PVC pipes have the largest and lowest environmental impacts, respectively, compared to HDPE [29,69]. The 90-mm-diameter HDPE and PVC pipes have comparable environmental impacts, and by comparing DI to HDPE and PVC with a 200-mm diameter, DI has greater environmental impacts [47]. In comparison, the percentages were 12%, 11%, and 53% for HDPE, PVC, and DI, respectively [41].

Biofilms

Biofilm protects bacteria from chlorine and helps infected microbes grow. It can cause pipe corrosion, hydraulic issues, poor water quality, bad tastes and odors, and macroinvertebrate growth [70]. Biofilms are associated with water discoloration and foul odors. It contributes to the corrosion of both metallic and synthetic polymeric substances [71]. Researchers looked at how bacteria formed biofilms on PVC, HDPE, and stainless steel that had been exposed to ozone water. They found that, overall, biofilm buildup on different surfaces was pretty similar [72]. In a flow/non-flow biofilm study, HDPE and PVC growth rates were also similar [73]. For colonization and biofilm formation in model drinking water distribution systems, HDPE was superior to PVC [74]. During the stable period, ductile iron (DI) had greater biofilms than polyethylene (PE) [75]. Mycobacterial gene copies were significantly higher in DI pipes than in CI pipes, indicating the importance of material type in biofilm formation [76], and its effect is greater on AC than on PVC pipes [77]. PVC and HDPE have less biofilm resistance [78].

Cumulative Energy Demand (CED)

In this context, we will examine pipes from the perspective of their cumulative energy demand. Constant dimensions were taken into account in the comparison process. DI pipes are two to three times more energy-intensive than HDPE and PVC [46]. By adding the operation and construction phases, PVC uses the least amount of energy, followed by HDPE and DI [47]. The energy requirements for pipes in the manufacturing process from the extraction of raw materials to plant exit are 34.4, 25.5, 75.2, and 74.9 MJ/kg for DI, CI, PVC, and HDPE, respectively, and can be arranged as CI, DI, HDPE, and PVC [33]. DI pipes have less embodied energy than PVC or HDPE pipes [79,80]. PVC has the highest embodied energy, followed by HDPE and DI [38,44]. Pipe manufacturing was neglected [46]. AC pipe requires 20–40% less energy than DI or PVC [81]. PVC uses more energy and emits more CO2 than non-recycled polyethylene, and vice versa if recycled [82]. The production phase accounts for 65% of the GWP and 67% of the cumulative energy demand [46]. When comparing the diameters of PVC, HDPE, and DI pipes, from smallest to largest, the greater diameter, the greater embodied energy, which was highest for DI, followed by HDPE, and lowest for PVC. In addition, PVC, which after 25 and 50 years, has the highest CED impact, followed by HDPE and DI [46].

Discoloration Water

Discolored tap water or turbidity/red water is a major cause of water quality complaints [83,84]. When talking about turbidity, the material of the pipe is very important, as can be seen in the case of iron pipes [85]. In a study where the pipes were arranged based on the quality of the water, the DI and CI pipe materials were ranked in the order of increasing turbidity and biofilm diversity as follows: CI and DI [86]. During the cleaning operations of water systems, there is a correlation in the concentrations of both iron and manganese [83].

Pressure Range

Researchers say water pipe rupture is related to the material and environment of the pipe, as well as the internal pressure load. Water hammers, which generate high water pressure, also cause pipe bursts. Broken pipes caused by high water pressure are a significant area of study [22,87]. PVC [23,88], ductile iron (DI) [89], cast iron (CI) [90], asbestos cement (AC) [91], and HDPE pipes deformation and failure under internal pressure must be studied and predicted to maximize their use [92].

Influence of Residual Chlorine

Chemical additives are needed to maintain the quality of water, but they can shorten pipe life. Desalinated water’s chlorine decay was linked to wall decay, and high wall decay indicated deteriorated distribution pipes [84]. Residual chlorine in tap water accelerates the deterioration of plastic pipes [93]. Inactivating micro-pollutants with chlorine dioxide or sodium hypochlorite has long-term effects on the pipe material [94]. Disinfectants and biofilm affect iron corrosion’s composition, structure, and morphology [95]. Tensile tests on chlorinated HDPE and PVC showed no changes. HDPE is more permeable to water than PVC due to being chlorinated [96]. Biofilms on CI had a different community composition than those on HDPE and PVC [97]. The likelihood of trihalomethane formation is highest in PVC pipes and then in PE pipes [98]. PVC has a lower chlorine effect than DI or CI [99]. Length of operation affects asbestos cement wall decay constants; PVC and polyethylene pipes have lower chlorine decay constants; CI pipes have higher chlorine decay constants [100]. Reactive (iron) and non-reactive (PVC) pipe walls decay [101]. Chlorine decay for PVC is less than DI; in CI pipes faster than PVC pipes [102]. Plastic is resistant to aggressive water [78].

Purchase Costs of Pipes

For pipe production, installation, and transportation phases of 12-inch diameter per km, some production and maintenance expenses are excluded. The equivalent cost for total GWP is $25/MT. For every metric ton of CO2, PVC costs $7950, DI costs $11,800, HDPE costs $5455, and CI costs $8820 [33]. HDPE was 5% cheaper and PVC was 10% cheaper than DI for 12-inch-diameter and smaller pipelines [53]. The buying prices for HDPE, PVC, DI, and CI pipes vary depending on the supplier, location, amount, size, maximum pressure, and diameter of the pipe. HDPE pipes cost $1–5 per foot, PVC pipes cost $1–20 per foot, DI pipes cost $20–30 per foot, and CI pipes cost between $20 and $40 per foot. The price for pipes of 200 mm diameter, for example, is as follows: asbestos $4.24/m, DI $16.40/m, CI $13/m [103], HDPE $0.21/meter, and PVC $0.5/meter [104]. The cost of manufacturing a pipe with a 12-inch diameter is as follows: HDPE $5.375/m, PVC $7.875/m, CI $8.725/m, and DI $11.7/m. Production costs are very high for DI, CI, PVC, and HDPE [33].

The Network Leakage Probability

Due to the complexity of the factors, predicting the rate at which water distribution network pipes will fail over time is important for setting aside enough funds for renewal [105]. A piping network’s leakage risk depends on its material, quality, lifespan, condition, environmental conditions, and maintenance and repair practices. Pipe material and quality can affect leakage. Compared to DI or HDPE, AC, CI, and PVC are more likely to leak. Older or less-protected pipes may leak more than newer ones. Regular inspections, cleaning, and repairs can identify and fix potential leakage points before they worsen, while neglecting maintenance and repair can increase leakage over time.

Guaranteed Risk-Free Pipework

The non-profit National Sanitation Foundation (NSF) certifies products that meet quality and safety standards. They approve PVC [106], HDPE, and DI pipes for drinking water [23]. AWWA, ASTM, and the EPA do not classify CI as drinking water pipes. Because of corrosion and iron leaching, cast iron pipes are rarely used for potable water systems. Iron in drinking water is harmful. The secondary maximum contaminant level for iron in drinking water set by the EPA is 0.3 mg/L [107]. AC consumption increases the risk of developing stomach cancer [107,108]. Asbestos risk scores did not predict the occurrence of gastrointestinal tumors [109,110], but it causes lung cancer [111] and ovarian cancer in women [112].

Examining Success Probabilities for Ground Movement

Earthquake water main rupture probability: High vulnerability for CI 6, moderate for AC 12, low to moderate for PVC 13, low for DI 18, and low for PE 19, i.e., arranged as PE, DI, PVC, AC, and CI [113]. In terms of earthquake performance, PVC has historically fared poorly in comparison to DI and HDPE [53]. During the earthquake, pipes break all over the place (failure types are barrel, pulled joint, joint failure, and fitting). AC 1.79, CI 1.51, PVC 1.43, and DI 0.49 are the percentage of repair pipes per kilometer in Kobe. Northridge/LADWP distribution pipes (24 inches): DI 0.03, AC 0.03, CI 0.09, and PVC NA. EBMUD/Loma Prieta: DI NA, CI 0.023, PVC 0.007, and AC 0.007. Loma Prieta/Santa Cruz: DI 0.01, CI 0.31, PVC 0, and AC 0.07 AC. Using the number of pipe breaks per kilometer to measure damage to Kobe’s water pipes shows that, on average, pipes break during earthquakes: AC 1.73, CI 1.49, PVC 1.38, and DI 0.47. The water distribution network had CI failures of 0.27, AC failures of 0.17, DI failures of 0.05, PVC failures of 0.17, and PE failures of 0.03 per km per year between 2005 and 2018 [114]. In a UK city, breaks in pipes, broken down by material, such as cast iron (45%), polyethene (22.3%), and asbestos cement (19%), of varying diameters (data from 1995–2018) are as follows: CI accounts for 69.3%, polyethene for 4.6%, and AC for 14.9% [56]. The length of the pipe increases the odds of breakage. Reducing the pipe diameter increases the possibility of breakage. Pipes are more likely to break when pressure rises [56]. In general, there is a high risk of damage with PVC pipes [56].

Additional Considerations

HDPE pipes are resistant to fatigue and water hammer, whereas PVC pipes are brittle and can leak quickly. HDPE is rubbery, whereas PVC is brittle like glass [115]. For HDPE, quantitative threshold odor number (TON) values ≥ 4. Migration tests of PVC pipes revealed few volatile migrants and no odor [21]. Socioeconomic factors affect pipe service life [19].
Based on the findings of a comprehensive literature review, a set of criteria and indicators are used. In order to maintain the quality, safety, sustainability, and costs of water systems, the literature review highlighted the significance of the decision-making process in selecting the pipe material in water systems, whether they are extension systems for old projects or modern systems. Many criteria for evaluating water pipes were discussed in the literature, either singly or collectively; however, in this study, these were compiled into 22 elements to make a comparison in the process of evaluating pipes in water systems using FRISCO’s theory of multi-criteria analysis.

2. Materials and Methods

Advanced multi-criteria analysis can be used to compare various options by determining the possibilities, defining the criteria, measuring the criteria and their relative importance, and determining weighted and overall scores.

2.1. Determine the Possibilities

These tubes were chosen after a thorough review of the aforementioned literature. According to the cited sources [1,21,22,23,24,25,26,27,28,29], these are the most significant water pipes in general.
  • alternative cast iron pipes (CI);
  • alternative ductile iron pipes (DI);
  • alternative high-density polyethylene pipes (HDPE);
  • alternative asbestos cement pipes (AC);
  • alternative polyvinyl chloride pipes (PVC).

2.2. The following Criteria Have Been Selected

A set of criteria was developed based on the findings of a comprehensive literature review. These 22 criteria have been compiled to represent the most important aspects in selecting pipes by using the multi-criteria evaluation method.
The criteria selected are as follows:
  • Low cost of production;
  • Recyclability of pipes;
  • Low friction losses;
  • Lifespans of pipes;
  • Repair and replacement costs;
  • Pipe weight and portability;
  • Water supply system reliability;
  • Traffic density and road conditions affect pipes;
  • Ease of handling emergency situations;
  • Estimated future repair and replacement expenses;
  • Probability of failure;
  • The environmental impacts;
  • The cumulative energy demands;
  • The network leakage probability;
  • Influence of residual chlorine;
  • Examining success probabilities for ground movement;
  • Discoloration water problem;
  • Biofilms problem;
  • Material corrosion rate;
  • Pressure range;
  • Guaranteed risk-free pipework
  • Purchase costs of pipes.

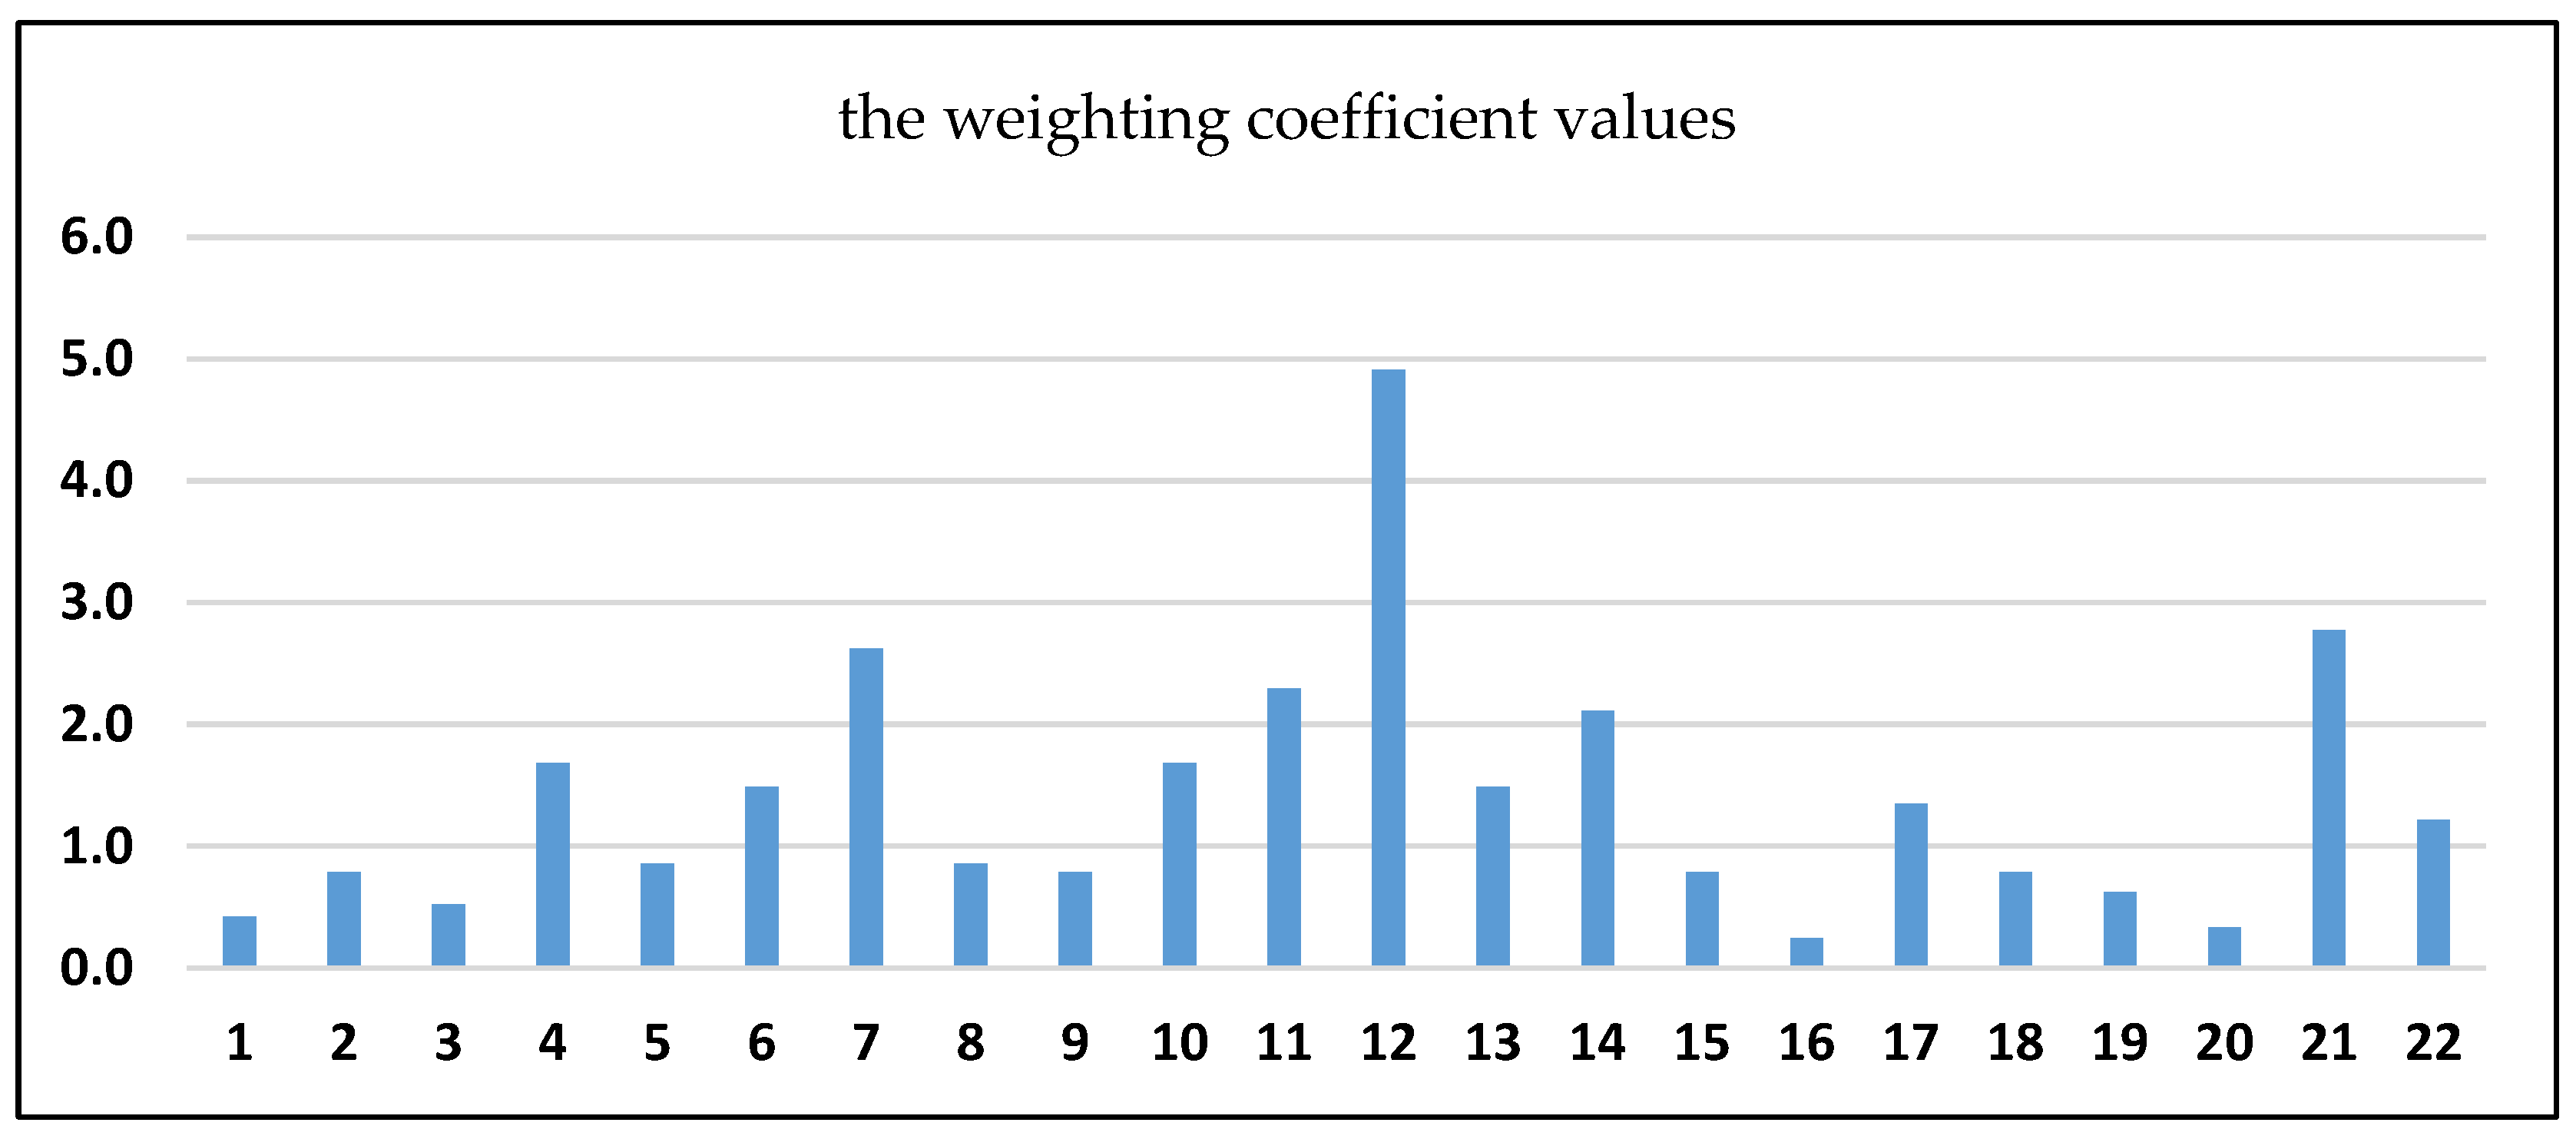
2.3. The Process of Determining Weights for Each Criterion

The FRISCO formula was used to rank the criteria and assign a weight factor for each criterion because it is universally acknowledged as the best and most used for this type of analysis [116,117,118,119,120,121,122,123,124].
The FRISCO formula was used to calculate the weighting coefficients:
γ i = p + Δ p + m + 0.5 ( Δ p + N c r t / 2 )
where
  • p represents the sum of the points obtained for each line by the element taken into account;
  • Δp represents the difference between the point of the item taken into account and the point of the item from the last level;
  • m represents the current number of criteria is outclassed (outperformed in terms of points) by the criteria considered;
  • Ncrt represents the total number of criteria that have been taken into account;
  • Δp′ represents the difference between the point of the item taken into account and the point of the first level.
The criteria’s weights on a three-value Latin square grid will be used to calculate the weighting factors (0, 0.5, and 1). As Ncrt is a representation of the number of criteria used in the study, Ncrt here is equal to 22. A comparison is made between each criterion in this grid, with the input in relation to weights (0, 0.5, 1) in each line, followed by the output in each column. That is when this criterion is parallel to the one in row [125].
For the insertion process in the Latin grid to calculate the weighting coefficients ( γ i ), if the criteria are more important than the comparison criterion, the cell concerned takes the number 1, and if it is of the same importance, the cell takes the number 0.5 and at last the value is set to 0 when it is of the lower importance.
After setting the weights, they are summed for each line and called the points (p), which are equal to half the square of the number of criteria. In this study, the number of criteria is 22, and the half of the square of the criteria is equal to 242.0, which is also equal to the sum of the total points [125].
After determining the total points, the level of importance is determined by that the largest value of the specific grade points or the specified criterion represents the number 1, which is a more important criterion, and then the rest of the numbers come to 22, which represents the last criterion in the order in terms of importance.
When several criteria share the same level as found in this Latin grid, for instance in criteria No. 10 and No. 14, the average here represents the level, so 10 and 14 take the same number, which is 5.5 [125].
The role of the level is to determine the order in which the criteria are ranked from the point of view of the degree. The level value helps determine the correct value of the parameter (m). The value (m) corresponding to a criterion is equal to the number of terms (positive integer or zero) in the ascending sequence of levels, with values strictly higher than the level of the criterion considered.
In the table made with a square grid, the values in the levels column will be sorted (either up or down), and with 22 criteria, the order of levels going up is [1, 2, 3, 4, 5.5, 5.5, …]. For example, for the criterion at level 1, m = 0; for the criterion at level 3, m = 19; and for the two criteria at level 5.5, m = 16 [125].
The role of the level is only to determine the order in which the criteria are ranked from the point of view of the degree.

2.4. A Contribution Note Is Added to One of the Criteria by Awarding an Ni Score

After figuring out the weighting coefficients, the variables will be analyzed by giving each option an Ni score based on the criteria or variables that were looked at. These scores show how important each criterion is. The scores are represented using the integer numbers from 1 to 10. The grade is given for each variable according to each criterion. That is, one variable is analyzed in turn in terms of each criterion, until all the variables are exhausted.

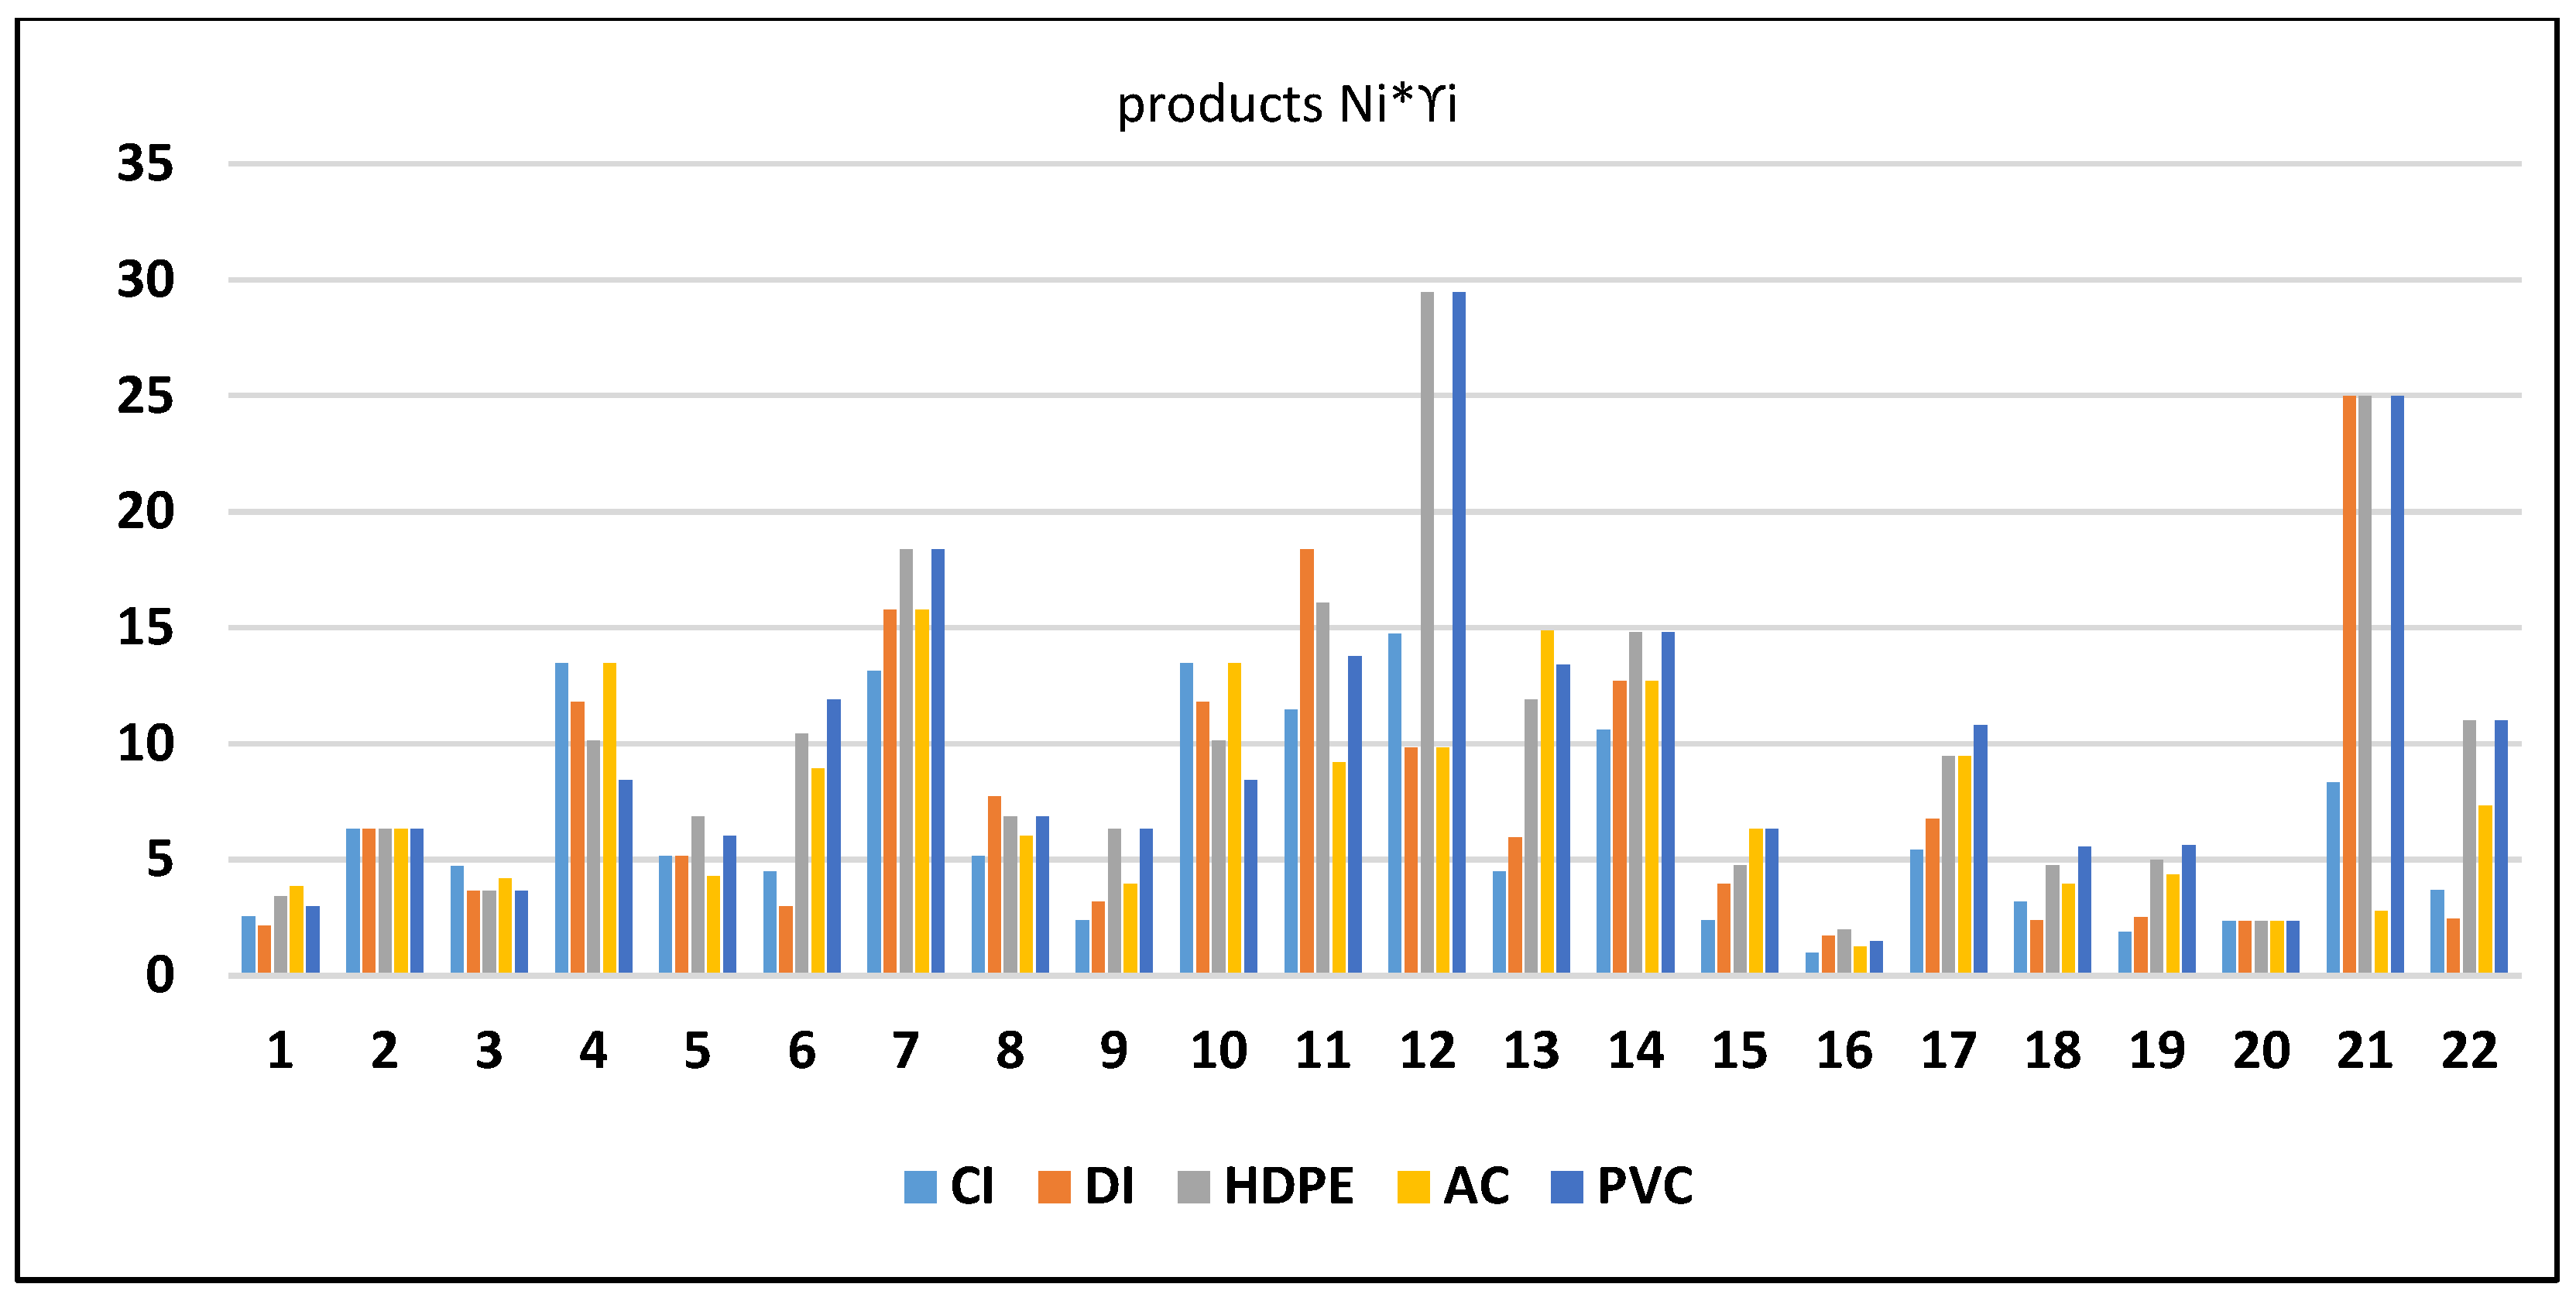
2.5. Calculation of Products between Ni Scores and Weighting Coefficients (Result Matrix)
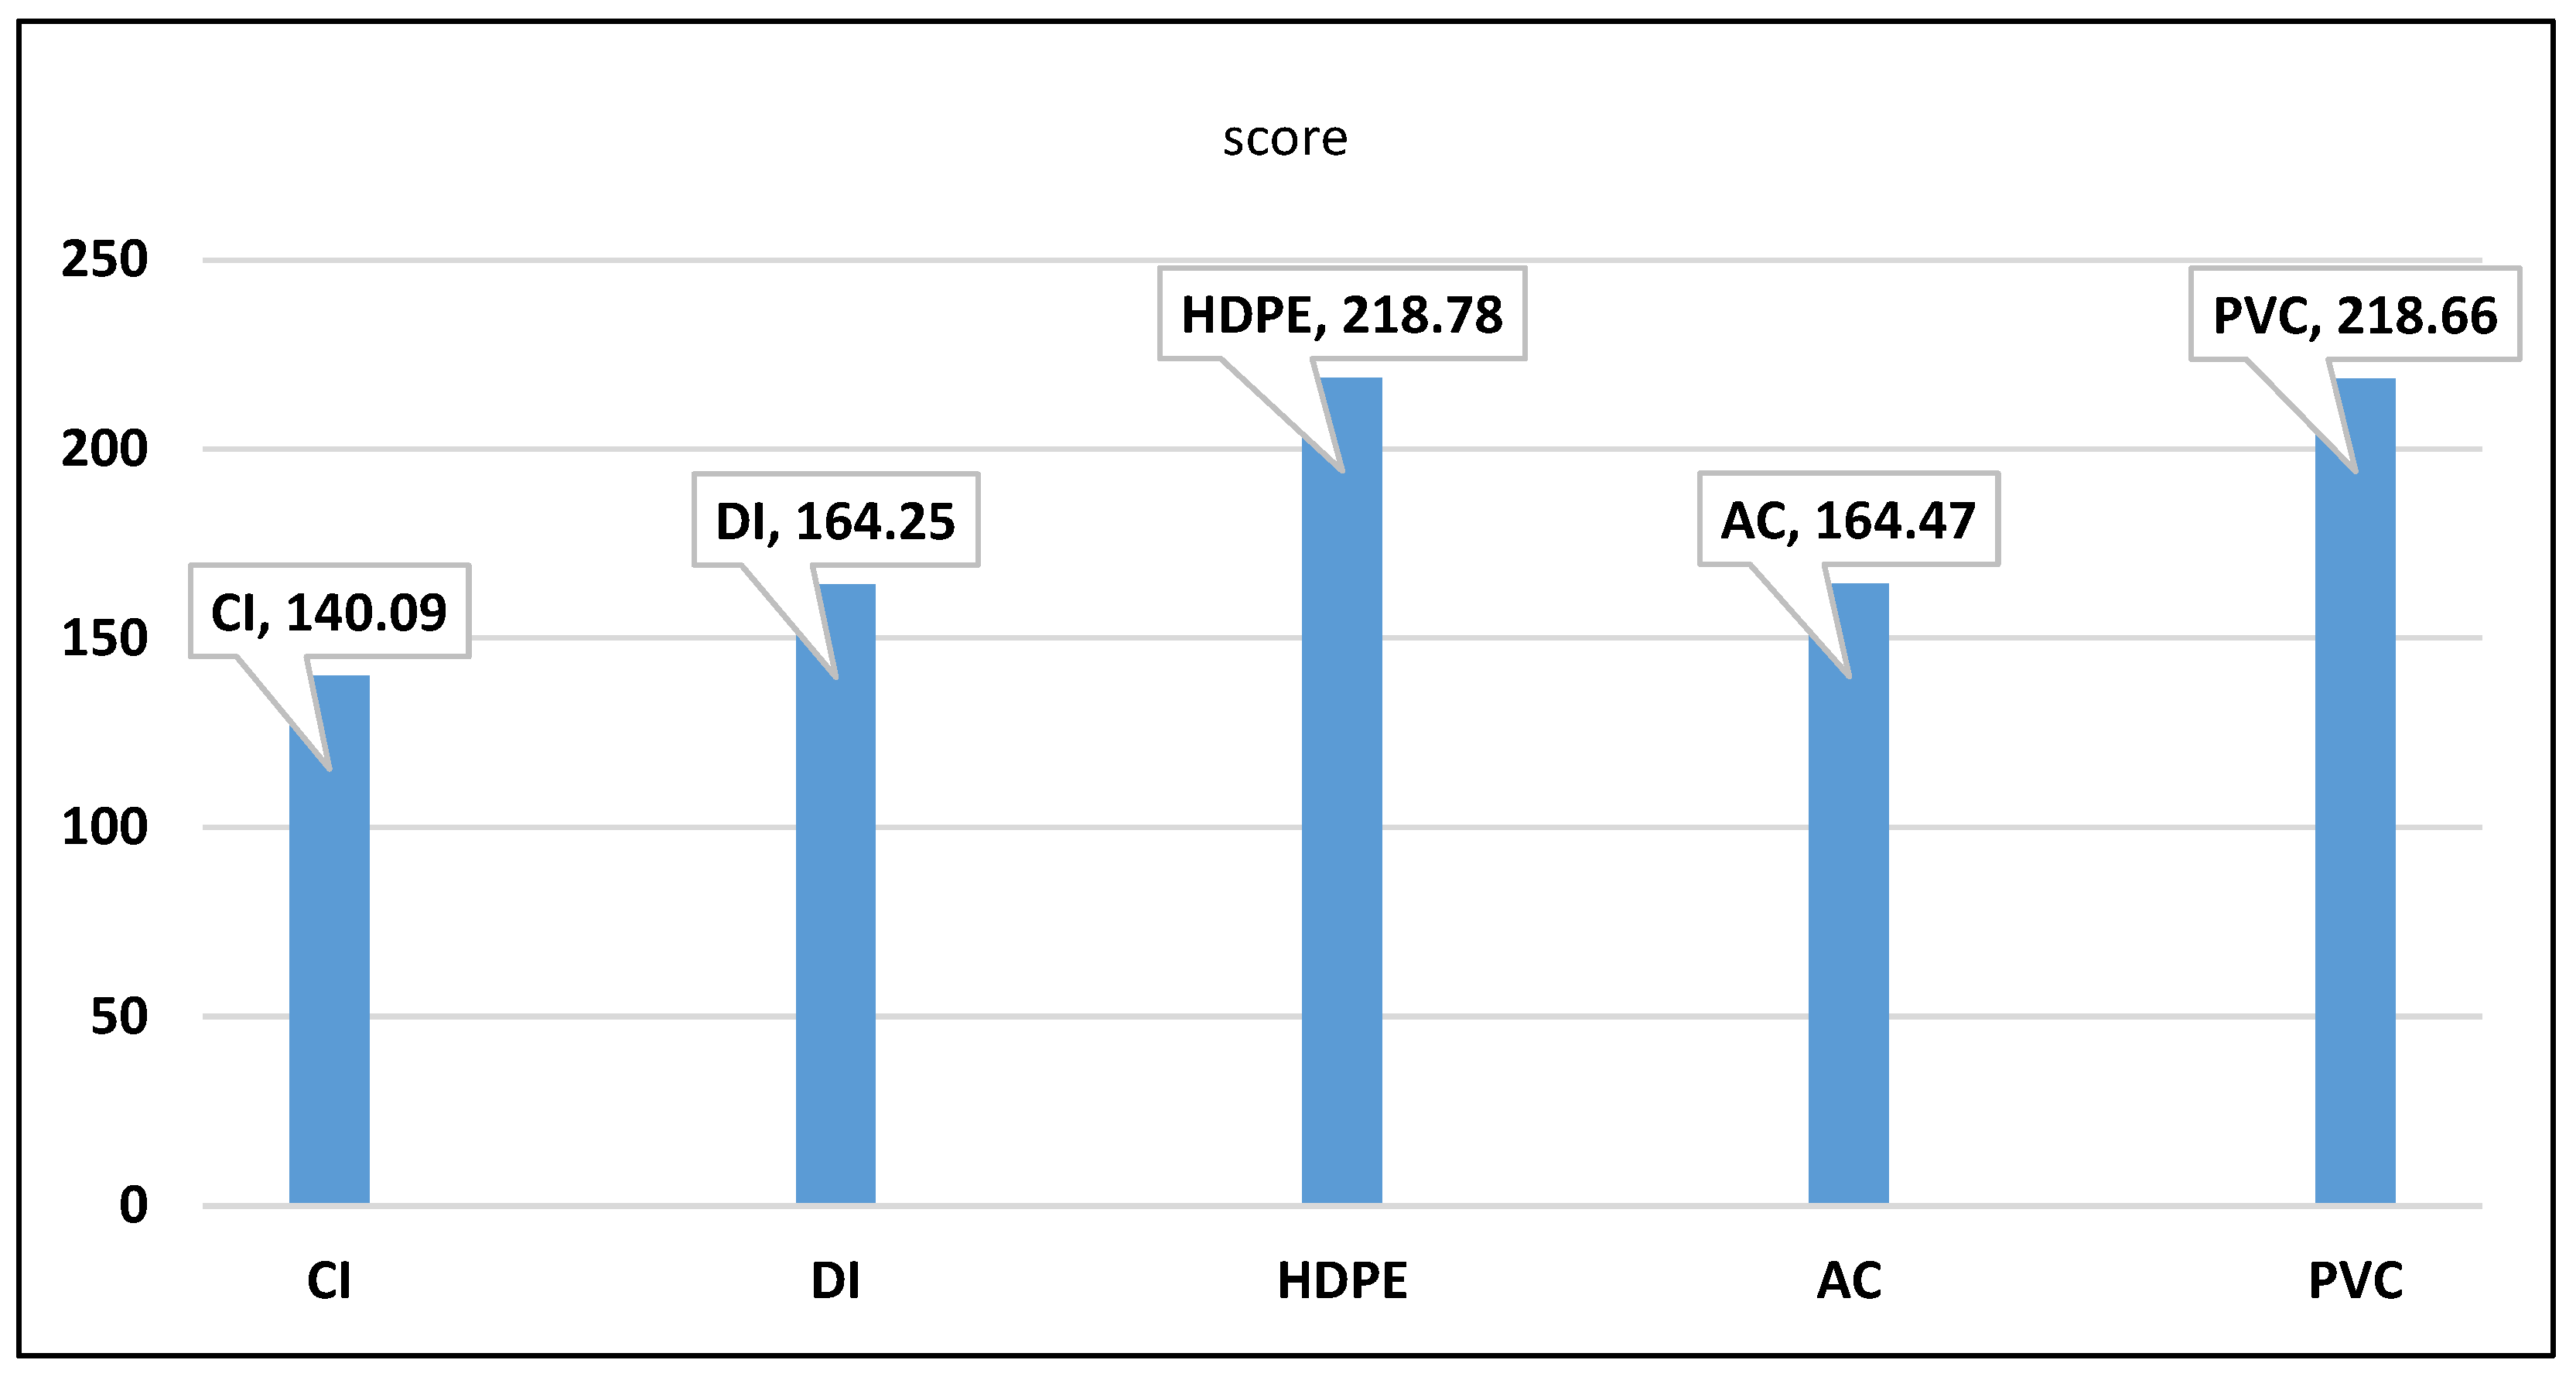
The products among the Ni scores of the criteria for the five pipe alternatives and weighting factors will be calculated in a table called the result matrix. Then this operation will be summed and will primarily be the variable with the largest summation, and if the values of the summation are close, the variables involved guarantee close performance.

3. Results

The data presented in Table 1 display the process of determining the weights of each criterion, and it is also noted that the main diagonal of the quadratic table of criteria contains only 0.5 values because no criterion can be more or less important than it, and then each row is summed separately to obtain the sum of the points represented with the letter (p).
To calculate the weighting coefficients of the FRISCO formula as given in Table 2; for example, to determine Δp, the difference between the element point taken into account in the calculation and the point of the last level element is calculated. Here, for example, the last item is criterion No. 16, which obtains 6.5 points and is compared to all the criteria from 1 to 22; in the same way to calculate (−Δp′) the difference between the point of the item taken and the first level, and here it is equal to criterion No. 12, which obtained 20 points.
The data presented in Table 3 show that the alternatives to pipes were analyzed by giving Ni scores for the criteria that were analyzed using the integers from 1 to 10. Criterion 12, which is a criterion that allocates environmental impacts, for example, says that HDPE has the least impact on the environment; so in terms of weight, the highest score is taken, and if the criteria are positive, the highest score will be given to the specific alternative.
Table 4 presents the results of multiplying the weighting coefficients in the scores for the five alternatives to the pipes. The final score, which is used to rank the alternatives, is found by adding the results of multiplying each column. This is shown in the last line of the table. The analyses revealed that the alternative, as shown in Figure 1, HDPE, has the highest quantity (218.78), followed by PVC (218.66), AC (164.47), DI (164.25), and finally CI (140.09). There are numerous similarities between PVC and HDPE, and AC and DI.

4. Discussion

Decision-making entails the identification and selection of alternatives in order to choose the most appropriate alternative based on the various considerations and expectations of the decision-makers. Every problem-solving decision is based on information determined by the priorities of the decision-makers. This study focused on the analysis of multiple alternatives based on the theory of advanced multi-criteria analysis, including information, alternatives, values, and preferences, in order to select the best pipes for water systems.
In order to preserve water resources as a result of leakage caused by exploding pipes and maintenance and replacement operations, it is crucial to make the right decision when selecting the type of pipe material to be used from the market’s available options. This study concluded with the assistance of stakeholders in the decision-making process based on evidence and facts in the installation and replacement of water system pipes by comparing the most commonly used materials in this field.
The 22 standards were developed on the basis of the literature and actual pipe problems encountered during the operational lifetime.
The weights were determined based on the opinions of water pipeline operation, maintenance, and planning specialists. The Ni scores were established based on an exhaustive review of the literature. These standards have been developed as a result of an in-depth analysis of pipe problems from the beginning of production to the end of their service life, as well as the factors that affect them, so that can evaluate alternatives.
Several specialized units in the field of water operation and maintenance have discussed the importance levels of water systems, but the evaluation process heavily depends on the institution’s priorities when determining its standards and weights.
The results of the Environmental Impact Assessment are one of the most important factors taken into account throughout the life of the pipes. After environmental impact and guaranteed risk-free piping work, the highest initial weights were assigned to criteria that have an impact on maintenance and operation, such as reliability, probability of failure, repairability, and service life, as presented in Figure 2, Figure 3 and Figure 4. About 41% of global warming and 44% of energy consumption come from water system operation and maintenance [46]. Pumping emits 90% of greenhouse gases and uses 60% of energy [57]. The annual energy consumption was 220–260 kWh per person [126].
According to the sources [38,44], PVC meets the cumulative energy demand criterion with the highest value. PVC and high-density polyethylene yield comparable end-products, so they converge. Despite cumulative energy demand (criterion 13) increasing from 9 to 10 for PVC pipes, HDPE pipes maintained their lead in terms of the final score. According to the established criteria, the HDPE alternative came in first, followed by PVC, asbestos cement, ductile iron, and cast iron.
Conducting weights may vary according to the policies of the institution, and it is a very complex process, but the priorities as shown in the percentage of weights can be adopted in accordance with the institution’s requirements. Taking current environmental commitments and climate changes during the pipes’ operational lives into account, the resulting weights were reasonable. The percentages ranged in eight levels, from 16% for environmental impact to 1% for ground movement and pressure level as presented in Figure 5.
The water supply may be harmful due to an asbestos pipe [66]. For ease of connection during maintenance, it can be used again to repair the same network if a pipe fails. Therefore, it was necessary to refer to it in the future replacement process, and a new criterion of comparison could be set in the case of connecting the old asbestos pipes with a new system of pipes to replace them according to the ease of connection with the asbestos line. Sometimes pipe replacement costs matter. Due to the high cost of replacing old pipes with new recommended pipes, asbestos is sometimes used in new water systems’ networks, especially in long asbestos networks.
Inaccurate data in an environmental impact can have a significant impact on the results. PVC has the highest CED effect after 25 and 50 years, followed by HDPE and DI [46]. Despite this change, HDPE remains in the first place in the final score, followed by PVC and DI.
As for the effect of pipe diameters on the selection process, the initial evaluation can be based on the environmental impact, i.e., the diameter of the pipe is selected based on the environmental impact. Then other criteria related to the specified diameter are compared as in [33], which demonstrated that PVC 410–510 mm, HDPE 410–460 mm, DI 460–510 mm, and CI 460–560 mm have the lowest economic costs and global warming potential [47]. Because pipe diameter is related to environmental impact and cost, it has a substantial impact on the evaluation process used to determine the final score. In addition, pipe diameter has a substantial impact on the weights process.
According to the available literature, the most frequently utilized pipes in water distribution systems were selected for this evaluation. The importance of comparison criteria, used materials, and weight has been extensively discussed with specialists, and given the focus of recent research, it is more logical.
Although embodied energy is an element of the environmental impact assessment, the single and combined comparisons were chosen. Water system sustainability can be better understood, and decisions can be made by taking into account both embodied energy and environmental impact but being aware of its function and design and able to offer suggestions for its enhancement, while making sure no essential elements of sustainability are missed. Despite its low energy consumption, a product may have a significant negative effect on the environment. The overall sustainability of the piping system can be improved by considering both criteria and addressing the trade-offs that arise from doing so.
Pipes’ expected lifetime was calculated using an average of findings from other studies; this could provide a more accurate picture once the rate of pipe failure during service was factored in.
Future research may include a consideration of the effect of environmental factors on the pipes as a criterion for evaluation. The severity of pipe defects changes with the seasons, as shown in [127,128], socioeconomic factors and soil quality [19], and mechanical properties of materials [129], including ultimate tensile strength, percent of elongation, hardness, and yield strength [15].
Due to a lack of information in the literature, the following elements have not been compared: fatigue, water hammering, elasticity, and fragility. However, they may be included in future studies comparing pipes based on their tolerance of operational conditions, such as fatigue, water hammering, elasticity, fragility [115], number of threshold odors (TON) [21], and UV radiation. In addition to the dimensions and operating conditions such as pressure and temperature, the temperature influences the yield stress diagram. Therefore, we recommend that temperature should be taken into account during the evaluation process, as it affects differently and may increase the likelihood of pipe failure [128]. Therefore, other criteria can be developed based on the degree to which temperature influences the pipes.
It is preferable to have input from other specialists when determining comparison criteria and assigning relative importance levels.

Funding

This research received no external funding. The APC was funded by Transylvania University of Brasov.

Institutional Review Board Statement

Not applicable.

Informed Consent Statement

Not applicable.

Data Availability Statement

Data is contained within the article. The data presented in this study are available in Evaluation of Pipe Materials in Water System Networks Using the Theory of Advanced Multi-Criteria Analysis.

Acknowledgments

The author wishes to express his gratitude to those who provided constructive criticism during the review process and for the help, encouragement, and corrections of Sorin VLASE and Șerban BOBANCU, without whom the results of this study would not have been as positive.

Conflicts of Interest

The author declares no conflict of interest.

References

  1. Folkman, S. Water Main Break Rates In the USA and Canada: A Comprehensive Study. In Mechanical and Aerospace Engineering Faculty Publications; Utah State University: Logan, UT, USA, 2018; Available online: https://digitalcommons.usu.edu/mae_facpub/174 (accessed on 15 January 2023).
  2. Thomas, A.; Mantha, B.R.K.; Menassa, C.C. A Framework to Evaluate the Life Cycle Costs and Environmental Impacts of Water Pipelines. In Proceedings of the Pipelines 2016, Kansas City, MO, USA, 17–20 July 2016; pp. 1152–1163. [Google Scholar] [CrossRef]
  3. Kilinç, Y.; Özdemir, Ö.; Orhan, C.; Firat, M. Evaluation of technical performance of pipes in water distribution systems by analytic hierarchy process. Sustain. Cities Soc. 2018, 42, 13–21. [Google Scholar] [CrossRef]
  4. Liemberger, R.; Wyatt, A. Quantifying the global non-revenue water problem. Water Supply 2018, 19, 831–837. [Google Scholar] [CrossRef]
  5. Chawira, M.; Hoko, Z.; Mhizha, A. Partitioning non-revenue water for Juru Rural Service Centre, Goromonzi District, Zimbabwe. Phys. Chem. Earth Parts ABC 2022, 126, 103113. [Google Scholar] [CrossRef]
  6. Mubvaruri, F.; Hoko, Z.; Mhizha, A.; Gumindoga, W. Investigating trends and components of non-revenue water for Glendale, Zimbabwe. Phys. Chem. Earth Parts ABC 2022, 126, 103145. [Google Scholar] [CrossRef]
  7. Beuken, R.H.S.; Lavooij, C.S.W.; Bosch, A.; Schaap, P.G. Low Leakage in the Netherlands Confirmed. In Proceedings of the Eighth Annual Water Distribution Systems Analysis Symposium (WDSA), Cincinnati, OH, USA, 27–30 August 2012; pp. 1–8. [Google Scholar] [CrossRef]
  8. Karadirek, I.E. Urban water losses management in Turkey: The legislation and challenges. Anadolu Univ. J. Sci. Technol.-Appl. Sci. Eng. 2016, 17, 572–584. [Google Scholar] [CrossRef] [Green Version]
  9. Negharchi, S.M.; Shafaghat, R. Leakage estimation in water networks based on the BABE and MNF analyses: A case study in Gavankola village, Iran. Water Supply 2020, 20, 2296–2310. [Google Scholar] [CrossRef]
  10. Assefa, Y.T.; Babel, M.S.; Sušnik, J.; Shinde, V.R. Development of a Generic Domestic Water Security Index, and Its Application in Addis Ababa, Ethiopia. Water 2019, 11, 37. [Google Scholar] [CrossRef] [Green Version]
  11. Macharia, P.; Kreuzinger, N.; Kitaka, N. Applying the Water-Energy Nexus for Water Supply—A Diagnostic Review on Energy Use for Water Provision in Africa. Water 2020, 12, 2560. [Google Scholar] [CrossRef]
  12. Kofinas, D.; Ulanczyk, R.; Laspidou, C.S. Simulation of a Water Distribution Network with Key Performance Indicators for Spatio-Temporal Analysis and Operation of Highly Stressed Water Infrastructure. Water 2020, 12, 1149. [Google Scholar] [CrossRef] [Green Version]
  13. Jones, L.J.N.; Kong, D.; Tan, B.T.; Rassiah, P. Non-Revenue Water in Malaysia: Influence of Water Distribution Pipe Types. Sustainability 2021, 13, 2310. [Google Scholar] [CrossRef]
  14. Ociepa, E.; Mrowiec, M.; Deska, I. Analysis of Water Losses and Assessment of Initiatives Aimed at Their Reduction in Selected Water Supply Systems. Water 2019, 11, 1037. [Google Scholar] [CrossRef] [Green Version]
  15. Anojkumar, L.; Ilangkumaran, M.; Sasirekha, V. Comparative analysis of MCDM methods for pipe material selection in sugar industry. Expert Syst. Appl. 2014, 41, 2964–2980. [Google Scholar] [CrossRef]
  16. Thornton, J.; Sturm, R.; Kunkel, G. Understanding the Types of Water Losses; McGraw-Hill Education: New York, NY, USA, 2008; ISBN 978-0-07-149918-7. [Google Scholar]
  17. Shanian, A.; Milani, A.S.; Carson, C.; Abeyaratne, R.C. A new application of ELECTRE III and revised Simos’ procedure for group material selection under weighting uncertainty. Knowl.-Based Syst. 2008, 21, 709–720. [Google Scholar] [CrossRef]
  18. Karande, P.; Chakraborty, S. Application of multi-objective optimization on the basis of ratio analysis (MOORA) method for materials selection. Mater. Des. 2012, 37, 317–324. [Google Scholar] [CrossRef]
  19. Fan, X.; Wang, X.; Zhang, X.; ASCE Xiong (Bill) Yu, P.E.F. Machine learning based water pipe failure prediction: The effects of engineering, geology, climate and socio-economic factors. Reliab. Eng. Syst. Saf. 2022, 219, 108185. [Google Scholar] [CrossRef]
  20. World Health Organization. Water Safety in Buildings; World Health Organization: Geneva, Switzerland, 2011; ISBN 978-92-4-154810-6. [Google Scholar]
  21. Skjevrak, I.; Due, A.; Gjerstad, K.O.; Herikstad, H. Volatile organic components migrating from plastic pipes (HDPE, PEX and PVC) into drinking water. Water Res. 2003, 37, 1912–1920. [Google Scholar] [CrossRef]
  22. Rajeev, P.; Kodikara, J.; Robert, D.; Zeman, P.; Rajani, B. Factors contributing to large diameter water pipe failure. Water Asset Manag. Int. 2014, 10, 9–14. [Google Scholar]
  23. American Water Works Association. PVC Pipe-Design and Installation; American Water Works Association: Austin, TX, USA, 2002; ISBN 978-1-61300-176-9. [Google Scholar]
  24. Uddin, S.; Lu, Q.; Nguyen, H. Truck Impact on Buried Water Pipes in Interdependent Water and Road Infrastructures. Sustainability 2021, 13, 11288. [Google Scholar] [CrossRef]
  25. Chakraborty, R. Pipe flow analysis and its investigation for the selection of water pipeline material using some prominent mcdm methods. Int. J. Eng. Res. Sci. Technol. 2016, 5, 30–41. [Google Scholar]
  26. Staff, A. Awwa Manual, Volume 55: Pe Pipe: Design and Installation; American Water Works Association: Austin, TX, USA, 2005; ISBN 978-1-61300-023-6. [Google Scholar]
  27. Chee, R.; Lansey, K.; Chee, E. Estimation of Water Pipe Installation Construction Costs. J. Pipeline Syst. Eng. Pract. 2018, 9, 04018008. [Google Scholar] [CrossRef]
  28. Bahadori, A. Chapter 8—Water supply and distribution systems. In Essentials of Oil and Gas Utilities; Bahadori, A., Ed.; Gulf Professional Publishing: Houston, TX, USA, 2016; pp. 225–328. ISBN 978-0-12-803088-2. [Google Scholar]
  29. Hajibabaei, M.; Nazif, S.; Tavanaei Sereshgi, F. Life cycle assessment of pipes and piping process in drinking water distribution networks to reduce environmental impact. Sustain. Cities Soc. 2018, 43, 538–549. [Google Scholar] [CrossRef]
  30. Coufal, M.; Václavík, V.; Dvorský, T.; Miroslava, B. Rehabilitation of asbestos cement water mains for potable water in the Czech republic. In Proceedings of the 14th SGEM GeoConference on Energy and Clean Technologies, Albena, Bulgaria, 17–26 June 2014; Volume 1. [Google Scholar]
  31. Așchilean, I.; Giurca, I. Choosing a Water Distribution Pipe Rehabilitation Solution Using the Analytical Network Process Method. Water 2018, 10, 484. [Google Scholar] [CrossRef] [Green Version]
  32. Mahjouri, M.; Ishak, M.B.; Torabian, A.; Abd Manaf, L.; Halimoon, N.; Ghoddusi, J. Optimal selection of Iron and Steel wastewater treatment technology using integrated multi-criteria decision-making techniques and fuzzy logic. Process Saf. Environ. Prot. 2017, 107, 54–68. [Google Scholar] [CrossRef]
  33. Du, F.; Woods, G.J.; Kang, D.; Lansey, K.E.; Arnold, R.G. Life Cycle Analysis for Water and Wastewater Pipe Materials. J. Environ. Eng. 2013, 139, 703–711. [Google Scholar] [CrossRef]
  34. Island, P. What is Asbestos Cement Pipe? (Advantages & Disadvantages). Pips Isl. 2022. Available online: https://www.pipsisland.com/what-is-asbestos-cement-pipe/ (accessed on 15 January 2023).
  35. Parvez, J. Life Cycle Assessment of PVC Water and Sewer Pipe and Comparative Sustainability Analysis of Pipe Materials. Proc. Water Environ. Fed. 2018, 2018, 5493–5518. [Google Scholar] [CrossRef]
  36. Tabesh, M.; Kazemi Soochelmaei, M. Studying the Effect of Factors Influencing the Change in Hazen-Williams Roughness Coefficient of Cast Iron Pipes during Operation Period. J. Water Wastewater Sci. Eng. 2018, 3, 23–34. [Google Scholar] [CrossRef]
  37. Arumugam, A.; Kibrom, H.; Gebreamlak, M.; Teame, M.; Mengstu, M. Comparative Analysis and Validation of Selected Explicit Equation Models for Determination of Darcy Friction Factor to Estimate Major Head Loss for a Pressurized Flow System. Sci. Technol. Asia 2022, 27, 216–235. [Google Scholar]
  38. Piratla, K.R.; Ariaratnam, S.T.; Cohen, A. Estimation of CO2 Emissions from the Life Cycle of a Potable Water Pipeline Project. J. Manag. Eng. 2012, 28, 22–30. [Google Scholar] [CrossRef]
  39. Abd Rahman, N.; Muhammad, N.S.; Abdullah, J.; Wan Mohtar, W.H.M. Model Performance Indicator of Aging Pipes in a Domestic Water Supply Distribution Network. Water 2019, 11, 2378. [Google Scholar] [CrossRef] [Green Version]
  40. Kamand, F.Z. Hydraulic Friction Factors for Pipe Flow. J. Irrig. Drain. Eng. 1988, 114, 311–323. [Google Scholar] [CrossRef]
  41. Sonnemann, G.; Margni, M. (Eds.) Life Cycle Management. In LCA Compendium–The Complete World of Life Cycle Assessment; Springer: Dordrecht, The Netherlands, 2015; ISBN 978-94-017-7220-4. [Google Scholar]
  42. Kuok, K.; Po Chan, C.; Ting, D. Evaluation of “C” Values to Head Loss and Water Pressure Due to Pipe Aging: Case Study of Uni-Central Sarawak. J. Water Resour. Prot. 2020, 12, 1077–1088. [Google Scholar] [CrossRef]
  43. American Water Works Association. Water Transmission and Distribution; American Water Works Association: Austin, TX, USA, 2003; ISBN 978-1-58321-231-8. [Google Scholar]
  44. Vahidi, E.; Jin, E.; Das, M.; Singh, M.; Zhao, F. Environmental life cycle analysis of pipe materials for sewer systems. Sustain. Cities Soc. 2016, 27, 167–174. [Google Scholar] [CrossRef]
  45. Melillo, J.M.; Richmond, T.; Yohe, G.W. Climate Change Impacts in the United States: The Third National Climate Assessment; U.S. Global Change Research Program: Washington, DC, USA, 2014.
  46. Hajibabaei, M.; Hesarkazzazi, S.; Lima, M.; Gschösser, F.; Sitzenfrei, R. Environmental assessment of construction and renovation of water distribution networks considering uncertainty analysis. Urban Water J. 2020, 17, 723–734. [Google Scholar] [CrossRef]
  47. Sanjuan-Delmás, D.; Petit-Boix, A.; Gasol, C.M.; Villalba, G.; Suárez-Ojeda, M.E.; Gabarrell, X.; Josa, A.; Rieradevall, J. Environmental assessment of different pipelines for drinking water transport and distribution network in small to medium cities: A case from Betanzos, Spain. J. Clean. Prod. 2014, 66, 588–598. [Google Scholar] [CrossRef] [Green Version]
  48. Schulte, U. A Vision Becomes True—50 Years of Pipes Made from High Density Polyethylene. In Proceedings of the Plastics Pipes XIII Conference, Washington DC, USA, 2–5 October 2006. [Google Scholar]
  49. Pietrucha-Urbanik, K.; Studziński, A. Qualitative analysis of the failure risk of water pipes in terms of water supply safety. Eng. Fail. Anal. 2019, 95, 371–378. [Google Scholar] [CrossRef]
  50. Li, S.; Wang, R.; Wu, W.; Sun, J.; Jing, Y. Non-hydraulic Factors Analysis of Pipe Burst in Water Distribution Systems. Procedia Eng. 2015, 119, 53–62. [Google Scholar] [CrossRef]
  51. Tavakoli, R.; Sharifara, A.; Najafi, M. Artificial Neural Networks and Adaptive Neuro-Fuzzy Models to Predict Remaining Useful Life of Water Pipelines. In Proceedings of the World Environmental and Water Resources Congress 2020, Henderson, NV, USA, 17–21 May 2020; pp. 191–204. [Google Scholar] [CrossRef]
  52. Duvall, D.E.; Edwards, D.B. Field Failure Mechanisms in HDPE Potable-Water Pipe. Plast. Eng. 2012, 68, 12–19. [Google Scholar] [CrossRef]
  53. Leung, J.; Ellison, D.; Bell, G.; Ballantyne, D. Selecting Water Main Materials for the Los Angeles Department of Water and Power. In Proceedings of the Pipelines Conference 2012, Miami Beach, FL, USA, 19–22 August 2012; pp. 1036–1045. [Google Scholar] [CrossRef]
  54. Alegre, H.; Almeida, M. do C. Strategic Asset Management of Water Supply and Wastewater Infrastructures; IWA Publishing: London, UK, 2009; ISBN 978-1-84339-186-9. [Google Scholar]
  55. Ballantyne, D. Seismic vulnerability assessment and design of pipelines. Am. Water Works Assoc. J. 2010, 102, 88–97. [Google Scholar] [CrossRef]
  56. Jara-Arriagada, C.; Stoianov, I. Pipe breaks and estimating the impact of pressure control in water supply networks. Reliab. Eng. Syst. Saf. 2021, 210, 107525. [Google Scholar] [CrossRef]
  57. Racoviceanu, A.I.; Karney, B.W.; Kennedy, C.A.; Colombo, A.F. Life-Cycle Energy Use and Greenhouse Gas Emissions Inventory for Water Treatment Systems. J. Infrastruct. Syst. 2007, 13, 261–270. [Google Scholar] [CrossRef] [Green Version]
  58. Kettler, A.J.; Goulter, I.C. An analysis of pipe breakage in urban water distribution networks. Can. J. Civ. Eng. 1985, 12, 286–293. [Google Scholar] [CrossRef]
  59. Maiolo, M.; Capano, G.; Carini, M.; Pantusa, D. Sustainability criteria for the selection of water supply pipeline. Cogent Eng. 2018, 5, 1491777. [Google Scholar] [CrossRef]
  60. Dimensions and Weight of Asbestos-Cement Pipes: With a Diameter of 100–150 mm and 200–250 mm, 300–400 mm. What Other Pipes Are There? External and Internal Dimensions. Available online: https://ibuilder-en.techinfus.com/asbestocement/razmery-i-ves-trub/ (accessed on 17 January 2023).
  61. Așchilean, I.; Iliescu, M.; Ciont, N.; Giurca, I. The Unfavourable Impact of Street Traffic on Water Distribution Pipelines. Water 2018, 10, 1086. [Google Scholar] [CrossRef] [Green Version]
  62. Fang, H.; Tan, P.; Du, X.; Li, B.; Yang, K.; Zhang, Y. Numerical and Experimental Investigation of the Effect of Traffic Load on the Mechanical Characteristics of HDPE Double-Wall Corrugated Pipe. Appl. Sci. 2020, 10, 627. [Google Scholar] [CrossRef] [Green Version]
  63. Staff, A. Internal Corrosion Control in Water Distribution Systems (M58); American Water Works Association: Austin, TX, USA, 2011; ISBN 978-1-61300-117-2. [Google Scholar]
  64. Al-Adeeb, A.M.; Matti, M.A. Leaching corrosion of asbestos cement pipes. Int. J. Cem. Compos. Lightweight Concr. 1984, 6, 233–240. [Google Scholar] [CrossRef]
  65. Sathiyaseelan, T. Deterioration of Asbestos-Cement Pipes; Thulasi Sathiyaseelan; Australia. 2009. Available online: https://ceed.wa.edu.au/wp-content/uploads/2017/02/11.Thulasi.Sathiyaseelan.pdf (accessed on 15 January 2023).
  66. Zavašnik, J.; Šestan, A.; Škapin, S. Degradation of asbestos–Reinforced water supply cement pipes after a long-term operation. Chemosphere 2022, 287, 131977. [Google Scholar] [CrossRef]
  67. Lin, X.; Xu, Q.; Li, Y.; Zhao, B.; Li, L.; Qiang, Z. Modeling iron release from cast iron pipes in an urban water distribution system caused by source water switch. J. Environ. Sci. 2021, 110, 73–83. [Google Scholar] [CrossRef]
  68. Akhi, A.H.; Dhar, A.S. Fracture parameters for buried cast iron pipes subjected to internal surface corrosions and cracks. J. Pipeline Sci. Eng. 2021, 1, 187–197. [Google Scholar] [CrossRef]
  69. Hajibabaei, M.; Nazif, S.; Vahedizade, S. Comparing the environmental impacts caused by construction and implementation of water distribution network pipes using Life Cycle Assessment (LCA) method. J. Water Wastewater Sci. Eng. 2016, 1, 37–48. [Google Scholar] [CrossRef]
  70. EPA US Health Risks From Microbial Growth and Biofilms in Drinking Water Distribution Systems. Available online: https://nepis.epa.gov/Exe/ZyNET.exe/P100ZMCD.txt?ZyActionD=ZyDocument&Client=EPA&Index=2000%20Thru%202005&Docs=&Query=&Time=&EndTime=&SearchMethod=1&TocRestrict=n&Toc=&TocEntry=&QField=&QFieldYear=&QFieldMonth=&QFieldDay=&UseQField=&IntQFieldOp=0&ExtQFieldOp=0&XmlQuery=&File=D%3A%5CZYFILES%5CINDEX%20DATA%5C00THRU05%5CTXT%5C00000040%5CP100ZMCD.txt&User=ANONYMOUS&Password=anonymous&SortMethod=h%7C-&MaximumDocuments=1&FuzzyDegree=0&ImageQuality=r75g8/r75g8/x150y150g16/i425&Display=hpfr&DefSeekPage=x&SearchBack=ZyActionL&Back=ZyActionS&BackDesc=Results%20page&MaximumPages=20&ZyEntry=1&slide# (accessed on 5 January 2023).
  71. Flemming, H.-C.; Percival, S.L.; Walker, J.T. Contamination potential of biofilms in water distribution systems. Water Supply 2002, 2, 271–280. [Google Scholar] [CrossRef]
  72. Zacheus, O.M.; Iivanainen, E.K.; Nissinen, T.K.; Lehtola, M.J.; Martikainen, P.J. Bacterial biofilm formation on polyvinyl chloride, polyethylene and stainless steel exposed to ozonated water. Water Res. 2000, 34, 63–70. [Google Scholar] [CrossRef]
  73. Manuel, C.M.; Nunes, O.C.; Melo, L.F. Dynamics of drinking water biofilm in flow/non-flow conditions. Water Res. 2007, 41, 551–562. [Google Scholar] [CrossRef] [PubMed] [Green Version]
  74. Rożej, A.; Cydzik-Kwiatkowska, A.; Kowalska, B.; Kowalski, D. Structure and microbial diversity of biofilms on different pipe materials of a model drinking water distribution systems. World J. Microbiol. Biotechnol. 2015, 31, 37–47. [Google Scholar] [CrossRef] [PubMed] [Green Version]
  75. Yan, X.; Lin, T.; Wang, X.; Zhang, S.; Zhou, K. Effects of pipe materials on the characteristic recognition, disinfection byproduct formation, and toxicity risk of pipe wall biofilms during chlorination in water supply pipelines. Water Res. 2022, 210, 117980. [Google Scholar] [CrossRef] [PubMed]
  76. Tang, W.; Li, Q.; Chen, L.; Zhang, W.; Wang, H. Biofilm Community Structures and Opportunistic Pathogen Gene Markers in Drinking Water Mains and the Role of Pipe Materials. ACS EST Water 2021, 1, 630–640. [Google Scholar] [CrossRef]
  77. Cloete, T.E.; Westaard, D.; van Vuuren, S.J. Dynamic response of biofilm to pipe surface and fluid velocity. Water Sci. Technol. 2003, 47, 57–59. [Google Scholar] [CrossRef] [PubMed]
  78. Giani, R.E.; Hill, C.P. M58-Internal Corrosion Control in Water Distribution Systems, 2nd ed.; American Water Works Association: Denver, CO, USA, 2017; ISBN 978-1-62576-202-3. [Google Scholar]
  79. Khan, S. Design Improvement in Water Distribution Systems: A Life Cycle Thinking Approach. Master’s Thesis, University of British Columbia, Vancouver, BC, Canada, 2019. [Google Scholar]
  80. Wu, W.; Simpson, A.; Maier, H. Reducing the carbon footprint from water distribution systems by using a lower discount rate. In Proceedings of the Practical Responses to Climate Change National Conference, Melbourne, Australia, 28 September–1 October 2010. [Google Scholar]
  81. Science and Publications. Available online: https://chrysotileassociation.com/sc_publi/sr.php (accessed on 19 December 2022).
  82. Alsabri, A.; Al-Ghamdi, S.G. Carbon footprint and embodied energy of PVC, PE, and PP piping: Perspective on environmental performance. Energy Rep. 2020, 6, 364–370. [Google Scholar] [CrossRef]
  83. Boxall, J.B.; Saul, A.J. Modeling Discoloration in Potable Water Distribution Systems. J. Environ. Eng. 2005, 131, 716–725. [Google Scholar] [CrossRef]
  84. Mortula, M.M.; Ali, T.A.; Sadiq, R.; Idris, A.; Al Mulla, A. Impacts of Water Quality on the Spatiotemporal Susceptibility of Water Distribution Systems. CLEAN–Soil Air Water 2019, 47, 1800247. [Google Scholar] [CrossRef]
  85. Perrin, Y.; Bouchon, D.; Delafont, V.; Moulin, L.; Héchard, Y. Microbiome of drinking water: A full-scale spatio-temporal study to monitor water quality in the Paris distribution system. Water Res. 2019, 149, 375–385. [Google Scholar] [CrossRef]
  86. Sun, S.; Zhou, Y.; Yu, H.; Li, W.; Zhou, W.; Luo, G.; Zhang, W. Effect of Pipe Materials on Bacterial Community, Redox Reaction, and Functional Genes. Coatings 2022, 12, 1747. [Google Scholar] [CrossRef]
  87. Yang, J.; Hu, S. Estimation of Burst Pressure of PVC Pipe Using Average Shear Stress Yield Criterion: Experimental and Numerical Studies. Appl. Sci. 2021, 11, 10477. [Google Scholar] [CrossRef]
  88. Jemii, H.; Bahri, A.; Boubakri, A.; Hammiche, D.; Elleuch, K.; Guermazi, N. On the mechanical behaviour of industrial PVC pipes under pressure loading: Experimental and numerical studies. J. Polym. Res. 2020, 27, 240. [Google Scholar] [CrossRef]
  89. Kim, J.W.; Park, C.Y. Effect of length of thinning area on the failure behavior of carbon steel pipe containing a defect of wall thinning. Nucl. Eng. Des. 2003, 220, 274–284. [Google Scholar] [CrossRef]
  90. Rajani, B.; Tesfamariam, S. Estimating time to failure of cast-iron water mains. Proc. Inst. Civ. Eng.-Water Manag. 2007, 160, 83–88. [Google Scholar] [CrossRef] [Green Version]
  91. Davis, P.; Silva, D.D.; Marlow, D.; Moglia, M.; Gould, S.; Burn, S. Failure prediction and optimal scheduling of replacements in asbestos cement water pipes. J. Water Supply Res. Technol.-Aqua 2008, 57, 239–252. [Google Scholar] [CrossRef]
  92. Majid, F.; Safe, M.; Elghorba, M. Burst behavior of CPVC compared to HDPE thermoplastic polymer under a controlled internal pressure. Procedia Struct. Integr. 2017, 3, 380–386. [Google Scholar] [CrossRef]
  93. Fujii, T.; Hirabayashi, H.; Matsui, Y.; Igawa, K.; Honma, H.; Yamada, K. Influence of residual chlorine and pressure on the degradation of water pipes of polyethylene of raised temperature. Polym. Degrad. Stab. 2021, 194, 109760. [Google Scholar] [CrossRef]
  94. Khan, I.A.; Lee, K.H.; Lee, Y.-S.; Kim, J.-O. Degradation analysis of polymeric pipe materials used for water supply systems under various disinfectant conditions. Chemosphere 2022, 291, 132669. [Google Scholar] [CrossRef]
  95. Wang, H.; Hu, C.; Hu, X.; Yang, M.; Qu, J. Effects of disinfectant and biofilm on the corrosion of cast iron pipes in a reclaimed water distribution system. Water Res. 2012, 46, 1070–1078. [Google Scholar] [CrossRef] [PubMed]
  96. Proverbs, D.; Mambretti, S.; Brebbia, C.A.; Ursino, N. Urban Water Systems & Floods; WIT Press: Southampton, UK, 2016; ISBN 978-1-78466-141-0. [Google Scholar]
  97. Li, W.; Tan, Q.; Zhou, W.; Chen, J.; Li, Y.; Wang, F.; Zhang, J. Impact of substrate material and chlorine/chloramine on the composition and function of a young biofilm microbial community as revealed by high-throughput 16S rRNA sequencing. Chemosphere 2020, 242, 125310. [Google Scholar] [CrossRef] [PubMed]
  98. Shabani, S. Assessment of Disinfection By-Product Formation in Polymeric Pipe Distribution Systems. Master’s Thesis, American University of Sharjah, Sharjah, United Arab Emirates, 2013. [Google Scholar]
  99. Yang, Y.J.; Impellitteri, C.A.; Clark, R.M.; Haught, R.C.; Schupp, D.A.; Panguluri, S.; Krishnan, E.R. Chlorine Decay and DBP Formation under Different Flow Regions in PVC and Ductile Iron Pipes: Preliminary Results on the Role of Flow Velocity and Radial Mass Transfer. In Proceedings of the World Environmental and Water Resources Congress 2008, Honolulu, HI, USA, 12–16 May 2008; pp. 1–11. [Google Scholar] [CrossRef]
  100. Al-Jasser, A.O. Chlorine decay in drinking-water transmission and distribution systems: Pipe service age effect. Water Res. 2007, 41, 387–396. [Google Scholar] [CrossRef] [PubMed]
  101. Hallam, N.B.; West, J.R.; Forster, C.F.; Powell, J.C.; Spencer, I. The decay of chlorine associated with the pipe wall in water distribution systems. Water Res. 2002, 36, 3479–3488. [Google Scholar] [CrossRef] [PubMed]
  102. Munavalli, G.R.; Kumar, M.S.M.; Kulkarni, M.A. Wall decay of chlorine in water distribution system. J. Water Supply Res. Technol.-Aqua 2009, 58, 316–326. [Google Scholar] [CrossRef]
  103. Asbestos Cement Pipes-Asbestos Pipes Latest Price, Manufacturers & Suppliers. Available online: https://dir.indiamart.com/impcat/asbestos-cement-pipes.html (accessed on 5 January 2023).
  104. Water Pipes-Water Pipes Manufacturers, Suppliers and Exporters on Alibaba.comHookahs. Available online: https://www.alibaba.com//trade/search?fsb=y&IndexArea=product_en&CatId=&tab=all&SearchText=water+pipes (accessed on 5 January 2023).
  105. Fan, X.; Zhang, X.; Yu, X. Uncertainty quantification of a deep learning model for failure rate prediction of water distribution networks. Reliab. Eng. Syst. Saf. 2023, 109088. [Google Scholar] [CrossRef]
  106. The Public Health and Safety Organization. Available online: https://www.nsf.org/ (accessed on 15 January 2023).
  107. US EPA, O. Drinking Water Regulations and Contaminants. Available online: https://www.epa.gov/sdwa/drinking-water-regulations-and-contaminants (accessed on 16 January 2023).
  108. Kjærheim, K.; Ulvestad, B.; Martinsen, J.I.; Andersen, A. Cancer of the gastrointestinal tract and exposure to asbestos in drinking water among lighthouse keepers (Norway). Cancer Causes Control 2005, 16, 593–598. [Google Scholar] [CrossRef]
  109. Totaro, M.; Giorgi, S.; Filippetti, E.; Gallo, A.; Frendo, L.; Privitera, G.; Baggiani, A. Asbestos in drinking water and hazards to human health: A narrative synthesis. Ig. E Sanita Pubblica 2019, 75, 303–312. [Google Scholar]
  110. Harrington, J.M.; Craun, G.F.; Meigs, J.W.; Landrigan, P.J.; Flannery, J.T.; Woodhull, R.S. An Investigation Of The Use Of Asbestos Cement Pipe For Public Water Supply And The Incidence Of Gastrointestinal Cancer In Connecticut, 1935–1973. Am. J. Epidemiol. 1978, 107, 96–103. [Google Scholar] [CrossRef]
  111. Handra, C.-M.; Chirila, M.; Smarandescu, R.-A.; Ghita, I. Near Missed Case of Occupational Pleural Malignant Mesothelioma, a Case Report and Latest Therapeutic Options. Int. J. Environ. Res. Public. Health 2022, 19, 14763. [Google Scholar] [CrossRef]
  112. Saito, C.A.; Bussacos, M.A.; Salvi, L.; Mensi, C.; Consonni, D.; Fernandes, F.T.; Campos, F.; Cavalcante, F.; Algranti, E. Sex-Specific Mortality from Asbestos-Related Diseases, Lung and Ovarian Cancer in Municipalities with High Asbestos Consumption, Brazil, 2000–2017. Int. J. Environ. Res. Public. Health 2022, 19, 3656. [Google Scholar] [CrossRef] [PubMed]
  113. Ballantyne, D. Overview of Piping Systems and their Seismic Vulnerability. Available online: https://responsiblechoice.info/wp-content/uploads/Overview-of-Piping-Systems-and-their-Seismic-Vulnerability.pdf (accessed on 15 January 2023).
  114. Barton, N.A.; Hallett, S.H.; Jude, S.R.; Tran, T.H. Predicting the risk of pipe failure using gradient boosted decision trees and weighted risk analysis. NPJ Clean Water 2022, 5, 22. [Google Scholar] [CrossRef]
  115. Autrique, R.; Rodal, E. Laboratory Study of Fatigue in Water Conveying HDPE and PVC Pipes Subject to Extreme Hydraulic Transient Pressures; Springer: Cham, Switzerland, 2018; p. 138. ISBN 978-3-319-70364-0. [Google Scholar]
  116. Bonbacu: Using the Multi-Criteria Analysis (Mca)...-Google Scholar. Available online: https://scholar.google.com/scholar_lookup?title=Using+the+multi-criteria+analysis+(mca)+in+the+drafting+of+doctorate+papers&author=Bonbacu,+S.&publication_year=2008&journal=Ann.+Oradea+Univ.+Fascicle+Manag.+Technol.+Eng.&volume=7&pages=1933%E2%80%931936 (accessed on 8 December 2022).
  117. Grecu, V.; Ciobotea, R.-I.-G.; Florea, A. Software Application for Organizational Sustainability Performance Assessment. Sustainability 2020, 12, 4435. [Google Scholar] [CrossRef]
  118. Grecu, V.; Morar, T. A Decision Support System for Improving Pedestrian Accessibility in Neighborhoods. Procedia-Soc. Behav. Sci. 2013, 92, 588–593. [Google Scholar] [CrossRef] [Green Version]
  119. Marinescu (Repanovici), R. Multi-criteria analysis of wearable activityfitness trackers and 3D concept models of smart jewellery. MATEC Web Conf. 2018, 178, 05017. [Google Scholar] [CrossRef]
  120. Alexandru, C. A STUDY ON THE SEMI-ACTIVE SUSPENSION SYSTEMS USED FOR MOTOR VEHICLES. J. Res. Innov. Sustain. Soc. 2020, 2, 16–25. [Google Scholar] [CrossRef]
  121. Repanovici, R.; Nedelcu, A. Mobile emergency notification apps: Current state, barriers and future potential. IOP Conf. Ser. Mater. Sci. Eng. 2021, 1009, 012049. [Google Scholar] [CrossRef]
  122. Leonte, A.S.; Nedelcu, A.; Dragan, R.G. Determination of Optimal Nondestructive Technique (NDT) Using Multi-Criteria Analysis. Appl. Mech. Mater. 2015, 760, 615–620. [Google Scholar] [CrossRef]
  123. Jaliu, C.; Saulescu, R.; Diaconescu, D.V.; Neagoe, M. Conceptual Design of a Chain Speed Increaser for Small Hydropower Stations; American Society of Mechanical Engineers Digital Collection: Lawrence, KS, USA, 2010; pp. 321–328. [Google Scholar]
  124. Sacarea, A.I.; Oancea, G.; Parv, L. Magnetic Particle Inspection Optimization Solution within the Frame of NDT 4.0. Processes 2021, 9, 1067. [Google Scholar] [CrossRef]
  125. Şerban BOBANCU Creativitate şi Inventică (C&I)–Curs–Secţiunea 1 şi Secţiunea 2 2015. Available online: https://www.academia.edu/44051040/Creativitate_and_Inventic%C4%83 (accessed on 15 January 2023).
  126. Venkatesh, G.; Brattebø, H. Energy consumption, costs and environmental impacts for urban water cycle services: Case study of Oslo (Norway). Energy 2011, 36, 792–800. [Google Scholar] [CrossRef]
  127. Pini, M.; Scarpellini, S.; Rosa, R.; Neri, P.; Gualtieri, A.F.; Ferrari, A.M. Management of Asbestos Containing Materials: A Detailed LCA Comparison of Different Scenarios Comprising First Time Asbestos Characterization Factor Proposal. Environ. Sci. Technol. 2021, 55, 12672–12682. [Google Scholar] [CrossRef] [PubMed]
  128. Merah, N.; Saghir, F.; Afarullah Khan, Z.; Bazoune, A. Effect of temperature on tensile properties of HDPE pipe material. Plast. Rubber Compos. 2006, 35, 226–230. [Google Scholar] [CrossRef]
  129. Vlase, S.; Marin, M.; Scutaru, M.L.; Scărlătescu, D.D.; Csatlos, C. Study on the Mechanical Responses of Plastic Pipes Made of High Density Polyethylene (HDPE) in Water Supply Network. Appl. Sci. 2020, 10, 1658. [Google Scholar] [CrossRef] [Green Version]
Figure 1. This is a figure showing the score of alternatives.
Sustainability 15 04491 g001
Figure 2. This is a figure showing the weighting coefficient values for all criteria.
Sustainability 15 04491 g002
Figure 3. This is a figure showing the Ni graph scores for each variable according to each criterion for all alternatives.
Sustainability 15 04491 g003
Figure 4. This is a figure showing the calculation of products Ni*ϒi.
Sustainability 15 04491 g004
Figure 5. This is a figure showing the comparison of the weights in terms of percentage.
Sustainability 15 04491 g005
Table 1. This is a table showing the process for determining the weights for each criterion.
12345678910111213141516171819202122
10.50.00.00.00.00.50.50.00.51.01.00.00.50.00.51.00.50.00.50.00.50.0
21.00.50.50.00.00.50.50.50.50.50.50.00.00.50.51.00.50.50.50.50.00.5
31.00.50.50.00.50.50.01.00.50.00.00.00.00.01.01.00.00.00.00.50.50.5
41.01.01.00.51.00.50.50.00.50.50.00.00.50.00.00.50.51.01.01.00.50.5
51.01.00.50.00.50.50.00.50.50.50.50.01.00.50.50.50.50.00.50.50.00.5
60.50.50.50.50.50.50.50.51.00.50.50.01.00.50.50.50.50.50.51.00.00.5
70.50.51.00.51.00.50.51.00.50.51.00.00.51.01.00.51.01.01.00.50.50.5
81.00.50.01.00.50.50.00.50.51.00.50.00.50.00.50.00.50.50.50.50.50.5
90.50.50.50.50.50.00.50.50.50.50.00.00.50.50.51.00.50.50.50.50.00.5
100.00.51.00.50.50.50.50.00.50.50.50.00.51.00.50.51.01.01.01.00.00.5
110.00.51.01.00.50.50.00.51.00.50.50.00.51.01.00.51.01.01.01.00.50.5
121.01.01.01.01.01.01.01.01.01.01.00.51.01.01.00.51.01.01.01.00.50.5
130.51.01.00.50.00.00.50.50.50.50.50.00.50.50.50.51.01.01.00.50.00.5
141.00.51.01.00.50.50.01.00.50.00.00.00.50.51.01.00.51.01.01.00.50.5
150.50.50.01.00.50.50.00.50.50.50.00.00.50.00.51.00.50.50.50.50.50.5
160.00.00.00.50.50.50.50.51.00.50.50.50.00.00.50.50.00.00.50.00.00.0
170.50.51.00.50.50.50.00.50.50.00.00.00.00.50.50.50.51.01.01.00.51.0
181.00.51.00.01.00.50.00.50.50.00.00.00.00.00.51.00.00.50.01.00.51.0
190.50.51.00.00.50.50.00.50.50.00.00.00.00.00.51.00.01.00.50.50.50.5
201.00.50.50.00.50.00.50.50.50.00.00.00.50.00.50.50.00.00.50.50.00.5
210.51.00.50.51.01.00.50.51.01.00.50.51.00.50.51.00.50.50.51.00.51.0
221.00.50.50.50.50.50.50.50.50.50.50.50.50.50.51.00.00.00.50.50.00.5
Table 2. This is a table showing the calculation of the weighting coefficients of the FRISCO formula.
CriteriapLevelΔp−Δp′mγi
17.520.01.012.52.00.426
29.515.53.010.55.00.791
38.019.01.512.03.00.522
412.06.55.58.015.01.684
510.012.53.510.05.00.857
611.58.55.08.513.01.487
715.02.58.55.019.02.625
810.012.53.510.05.00.857
99.515.53.010.55.00.791
1012.06.55.58.015.01.684
1114.04.07.56.018.02.294
1220.01.013.50.021.04.909
1311.58.55.08.513.01.487
1413.55.07.06.517.02.114
159.515.53.010.55.00.791
166.522.00.013.50.00.245
1711.010.04.59.012.01.350
189.515.53.010.55.00.791
198.518.02.011.54.00.622
207.021.00.513.01.00.333
2115.52.59.04.519.02.774
2210.511.04.09.511.01.220
Table 3. This is a table showing the contribution note for one of the criteria by awarding an Ni score.
Criteria CI
Ni
DI
Ni
HDPE
Ni
AC
Ni
PVC
Ni
165897
288888
397787
487685
566857
632768
756767
869878
934858
1087685
1158746
1232626
13348109
1456767
1535688
1647856
1745778
1843657
1934879
2077777
2139919
2232969
Table 4. This is a table showing the calculation of products between Ni scores and weighting coefficients (Result Matrix).
CIDIHDPEACPVC
Criteria γ i Ni Ni   ×   γ i Ni Ni   ×   γ i Ni Ni   ×   γ i Ni Ni   ×   γ i Ni Ni   ×   γ i
10.4362.5552.1383.4093.8372.98
20.7986.3386.3386.3386.3386.33
30.5294.7073.6573.6584.1773.65
41.68813.47711.79610.11813.4758.42
50.8665.1465.1486.8654.2976.00
61.4934.4622.97710.4168.92811.90
72.63513.13615.75718.38615.75718.38
80.8665.1497.7186.8676.0086.86
90.7932.3743.1686.3353.9586.33
101.68813.47711.79610.11813.4758.42
112.29511.47818.35716.0649.18613.76
124.91314.7329.82629.4529.82629.45
131.4934.4645.95811.901014.87913.38
142.11510.57612.69714.80612.69714.80
150.7932.3753.9564.7486.3386.33
160.2440.9871.7181.9651.2261.47
171.3545.4056.7579.4579.45810.80
180.7943.1632.3764.7453.9575.53
190.6231.8742.4984.9874.3695.60
200.3372.3372.3372.3372.3372.33
212.7738.32924.97924.9712.77924.97
221.2233.6622.44910.9867.32910.98
Final Score140.09164.25218.78164.47218.66
Disclaimer/Publisher’s Note: The statements, opinions and data contained in all publications are solely those of the individual author(s) and contributor(s) and not of MDPI and/or the editor(s). MDPI and/or the editor(s) disclaim responsibility for any injury to people or property resulting from any ideas, methods, instructions or products referred to in the content.

