Article

Smart Sales Empower Small Farmers: An Integrated Matching Method between Suppliers and Consumers Based on the Information Axiom

1
School of Management and Economics, North China University of Water Resources and Electric Power, Zhengzhou 450046, China
2
Department of Business Administration, Cheng Shiu University, Kaohsiung 10650, Taiwan
3
Department of Public Education, Zhengzhou University of Economics and Business, Zhengzhou 451191, China
*
Author to whom correspondence should be addressed.
Sustainability 2022, 14(24), 16937; https://doi.org/10.3390/su142416937
Submission received: 13 October 2022 / Revised: 6 December 2022 / Accepted: 14 December 2022 / Published: 16 December 2022
(This article belongs to the Special Issue Sustainable Marketing in China)

Abstract

:
Small farmers’ sustainable development has important significance for narrowing the gap between urban and rural areas and hastening the promotion of general prosperity in China. Currently, China still has 240 million small farmers. The sale of agricultural products is an important source of their income. Constrained by their small scale, lack of capital, and technology, small farmers often have to adopt a household operation mode. This decentralized agricultural production and operation mode results in significant difficulties for small farmers to benefit from planting and selling agricultural products. Many efforts have been made to help them, such as establishing agricultural product information platforms that can provide supply and demand information to facilitate small farmers’ sales. However, imbalances between suppliers and consumers and cross-regional transaction difficulties still exist. To promote the sustainable development of small farmers, this study develops an intelligent matching method for the transaction of agricultural products between suppliers and consumers. Firstly, a unique attribute set for agricultural products was established. Because most agricultural products are fresh, perishable, and not easily preserved, the general attributes (brand, logistics distance, product grade, and price) of commodities and the specific attributes (freshness, maturity, product certification, seasonal products, place of origin, and product safety) of agricultural products were taken into account. Secondly, by combining fuzzy mathematics with the information axiom, improved amount of information calculation methods for both quantitative and qualitative attributes were put forward. Thirdly, based on the amount of information about all attributes and with the goal of maximizing the transaction-matching degree for both the supplier and consumer, a multiobjective optimization model was proposed. Finally, the effectiveness and accuracy of the method were verified through a case study. In order to solve the dilemma of small farmers, this study proposes an integrated matching method for agricultural product transactions based on the information axiom. Through case verification, this method has good feasibility and effectiveness. It has broad application prospects which can be applied to information portals, e-commerce platforms, and other fields. The application of this method can empower small farmers’ capabilities, facilitate agricultural product sales, and promote small farmers’ sustainable development.

1. Introduction

At present, there are more than 230,000 small- and medium-sized Chinese agricultural business enterprises. Most of China’s rural areas still retain small-scale farmer economies [1]. The majority of agricultural product growers in China are mainly small farmers [2] who are “scattered, small, disorderly and weak”. In order to promote the sustainable development of the rural economy and small farmers, many scholars believe that it is important to help small farmers to produce more agricultural products and make them gain more sales benefits [3,4,5,6]. In recent years, innovating and upgrading agricultural production technology has lowered production costs, strengthened farmers’ production skills, and expanded the scale of agricultural production, leading to more prosperity in the agriculture industry [7]. However, although agricultural production has grown steadily, the pace of sales promotion is obviously lagging behind [8]. As a result, poor sales of agricultural products occur frequently and show an upward trend year by year, even worse when encountering COVID-19 [9]. This has dramatically hindered the progress of the agricultural industry, the prosperity of rural areas, and even the sustainable development of farmers. One reason for this is the lack of proper marketing channels. Small farmers are not the same as organized agricultural companies, farms, and agricultural cooperatives. They are not good at business and do not have enough experience to find suitable marketing channels. Intermediary agents in rural areas and residents of nearby towns and cities are their only choices to sell their produce. The other reason is the lack of bargaining capacity to earn more profits. Due to small-scale family operations, nontransparent price information, and being squeezed by powerful intermediaries, small farmers usually cannot sell their produce at moderate prices. Therefore, how to find a method to facilitate the sales of small farmers becomes a noteworthy research topic.
Actually, with the development of internet technology and the widespread application of mobile smartphones, rural e-commerce has gradually become saturated. Data from the China Business Information Network show that online retail sales in rural areas reached 1.79 trillion yuan in 2020 with a year-on-year growth of 5.3% [10]. Sales of agricultural products in China have been transformed into electronic marketing. Not only a large number of professional e-platforms, such as “vegnet”, “chinafarmin”, “myagric” and “cnhnb”, but also existing top e-commerce platforms, such as jd.com, taobao.com, and pinduoduo.com, have begun to help small farmers to sell agricultural products. The emergence of agricultural e-platforms has profoundly changed the traditional sales mode and reshaped the relationship between the suppliers and consumers of agricultural products [11], which facilitates the trade of agricultural products and provides a new sales method for small farmers. However, both consumers and suppliers are facing the same dilemma in the new transaction method. That is, it is hard for consumers to seek suitable agricultural product schemes that suit their actual needs; meanwhile, it is difficult for suppliers to seek suitable consumers to match their production. Therefore, understanding requirements between consumers and suppliers, solving the problem of matching suppliers and consumers, and building a fast, intelligent, and efficient matching method between suppliers and consumers with the use of an intelligent algorithm and advanced information technology in order to address small farmers’ sustainable development has become a large, practical need in the present situation.

2. Literature Review

2.1. The Matching Problem in Agricultural Products

Before delving into the problem of matching the supply and demand of agricultural products, it is necessary to survey related research on the concept of matching. In the past few decades, the matching problem has attracted extensive attention from many scholars. Matching research originated from marriage matching. In order to try to make both men and women find a satisfactory partner, Gale and Shapley proposed the G–S algorithm for seeking stable match results while Roth [12,13] advanced a two-sided matching concept and analyzed the existing examples in the market using preference information. Since then, scholars have carried out research on matching theory and its practical applications. For example, Shapley and Roth won the 2012 Nobel Prize in Economics for their outstanding contributions to matching research. In addition, the study of matching problems from the perspective of supply and demand began in 1994. Cable and Judge first studied the matching problem between people and organizations; they suggested using a “demand-supply” and “requirement-capability” viewpoint to analyze the matching of individuals and organizations [14]. With the gradual deepening of matching research, it has been applied to many fields and achieved breakthroughs, such as personnel position matching in the labor market [15,16,17,18], knowledge service supply and demand matching [19,20,21], resource supply and demand matching [22,23,24], etc.
The supply, demand, and price of agricultural products fluctuate greatly in different production cycles. There are often situations in which agricultural products cannot be sold without proper sales channels, and consumers haven’t suitable channels to purchase agricultural products they want. It is still difficult to match agricultural supply and demand in the market. Exploring efficient ways to match the supply and demand of agricultural products has always been an urgent problem to be solved in agricultural modernization. Scholars have begun to pay attention to the matching of supply and demand of agricultural products. Gao et al. [25] applied the intelligent internet of things (IIoT) to match agricultural supply and demand information. Li et al. developed a novel sentiment analysis-based method for matching creative agriproduct scheme consumers and suppliers through a case study in China [26]. Verdouw et al. presented a reference model for designing business processes in demand-driven fruit supply chains, aiming to continuously match supply capabilities to changing demand requirements [27]. Zhao et al. proposed the integration of a livestock product supply chain to solve the problem of imbalance and used a duck farm as a case study to show the integration process [28]. Based on location services, web 2.0 concepts, and bilateral trade matching theory, Niu and Zheng designed and implemented an information platform for agricultural trade [29]. Xu et al. used the grey prediction model to conduct demand forecasting for agricultural product logistics in the community to solve the problem of matching the supply and demand of community shops [30]; Kieu et al. proposed an MCDM model for improving the efficiency of agricultural supply chains by selecting the location distribution center [2].

2.2. The Matching Method

In terms of supply and demand matching, there are various optimization methods. To better review the existing findings, matching methods were systematically sorted out, which mainly consist of six matching methods including the Gale–Shapley method, WHIRL method, matching method based on “fuzzy set and utility theory”, SMAA method, TODIM method, and VIKOR method. The first well-known method is the Gale–Shapley method which was first introduced in the field of marriage matching [31]. In recent years, the G–S method has been widely used in other fields. For instance, Teo solved the student enrollment problem by using the Gale–Shapley model, explaining why the strategic behavior of students need not be a major concern [32]. Abououf maximized the level of satisfaction of workers by assigning them to their most preferred tasks using a Gale–Shapley model [33]. The second matching method is the WHIRL method. The WHIRL method has been used in the big data field to solve the problem of lacking common object identifiers [34]. It has been proven that the WHIRL method is more accurate, outperforming matching results and requiring less user involvement compared with the other algorithm [35]. However, different usage scenarios determine the choice of method. So, the third matching method based on “the fuzzy set and utility theory” is proposed to find “good” counterparts for a given entry in the marketplace [36]. Ragone also improved this method in the e-marketplace subsequently [37]. The fourth method is SMAA. There are multiple targets and persistent matching in the real world which the SMAA method is well-suited for. So, to help multiple decision makers choose their preferred alternative from a finite set, stochastic multicriteria acceptability analysis (SMAA) was developed [38]. The SMAA methodology is applicable in a broad range of decision-making contexts [39]. By using the SMAA method, Abdellah selected the location for centralizing cargo at the Moroccan airport hub [40]. The fifth and sixth methods are the Topsis method and Vikor method, both of them could handle matching problems in a certain situation and have good performance [41,42,43,44,45,46].
In conclusion, the above methods have been applied in different fields and have prominent performance. In order to better sort out the advantages and characteristics of the above methods, we have summarized the existing matching methods, as shown in Table 1. The methods are sorted by three main dimensions, including sides, attributes, and conditions, which could help scholars understand matching methods better.
All these studies put forward a variety of methods to solve the matching problem and provide a solid foundation for our research framework. With the development of rural e-commerce, research on the matching problem for agricultural products is gradually linked with information technology. However, relevant methods and technologies still have some limitations: (1) Current research mainly solves the problem of matching between supply and demand of agricultural products by integrating supply chains, developing trading platforms, and predicting logistics needs. They rarely explore the matching of supply and demand from the attributes of agricultural products. However, compared with general commodities, agricultural products have lots of unique attributes, such as perishability, freshness, seasonality, etc. These attributes will greatly affect the transaction volume and matching degree of agricultural products; (2) most matching methods have their own specific application scenarios. A matching process of agricultural products has these features: two sides matching between consumers and suppliers, qualitative and quantitative attributes need to be taken into account, and a one-shot deal in the transaction. Although existing matching methods have their own advantages, they cannot fully take into account all the above features(see Table 1). There is no ready method that can be directly used in the matching process of agricultural product transactions. Therefore, it is necessary to propose a new matching method to solve the problems in the process of agricultural product trading to facilitate sales.
Based on the above analysis, the innovations of this study are put forward from the aspects of index attributes and matching algorithms: (1) In terms of index attributes, this study not only considered the general commodity attributes of agricultural products but also their specific attributes and constructed a multiattribute indicator system for agricultural product trading to describe the outstanding characteristics of agricultural products in the process of agricultural product trading from a comprehensive perspective; (2) for the matching algorithm, by fully analyzing the characteristics of each current matching algorithm, this study applies the fuzzy mathematics theory and the information axiom method to the existing research on agricultural product supply and demand matching and establishes a one-time multiattribute agricultural product supply and demand matching model with improved information. This model takes into account the characteristics of a multiattribute indicator system, dynamic trading mechanism, and fuzzy trading language in the actual trading process of agricultural products and solves the problem that existing algorithms cannot fully fit the actual trading process of agricultural products. The method proposed in this study provides a solution for the structural imbalance between the supply and demand of agricultural products and optimizes the matching between suppliers and consumers of agricultural products, which can maximize suppliers’ interests and fulfill consumers’ needs as much as possible.

3. Establishment of the Agricultural Products Matching Model Based on the Information Axiom

3.1. Research Framework

In order to achieve smooth transactions for agricultural products, it is necessary to find the best match between suppliers and consumers quickly. This problem can be described as a typical multiobjective matching problem on a binary graph, as shown in Figure 1. To solve this problem, the attributes of agricultural products need to be identified from the perspective of both suppliers and consumers, and a multiattribute optimization model needs to be set up to find the optimal solution. As is shown in Figure 1, let B present the set of consumers consisting of m consumers, b i is the ith consumer, I = 1, 2, 3, …, m; let S present the set of suppliers consisting of n suppliers, and   s i is the j th supplier, j = 1, 2, 3, …, n. The link between B (consumers) and S (suppliers) presents whether there exists a transaction. The width of the line stands for the satisfaction of consumers and suppliers. The wider the line, the more satisfied both sides are. The purpose of a broker is to find the lines of the two types of nodes(such as bold lines) so they satisfy the requirements of both sides. The notation in this study is shown in Table 2.
The information axiom can deal with ambiguous information efficiently. Therefore, to achieve a higher matching degree between consumers and suppliers, we adopted the information axiom to establish a supplier and consumer matching model for agricultural products with multiple attributes. The feasibility and effectiveness of the method are illustrated by a comparative analysis of a case study. Referring to previous research [47,48,49,50], the detailed research framework is as follows:
  • Attributes were elaborately selected by considering the properties and requirements of agricultural products. These attributes were divided into two categories: general attributes(the common attributes of agricultural products) and specific attributes(the unique attributes of agricultural products). The system range and design range were determined from the perspective of both the supplier and consumer.
  • The attributes of agricultural products were divided into qualitative and quantitative attributes. Different kinds of attributes need to be calculated using different methods. For quantitative attributes, an improved method that introduces an intermediate value was used. For qualitative attributes, the amount of information was calculated by constructing a membership function with the fuzzy mathematics theory.
  • Aiming for the minimum total amount of information between supplier and consumer, after calculating the total amount of information of each supplier and consumer, a multiobjective optimization model was established.
  • To solve the model and obtain the optimal matching scheme, referring to previous research, the membership function and linear weighting method were used [48,51,52]. This method can transform the original multiobjective optimization model into a single-objective optimization model.
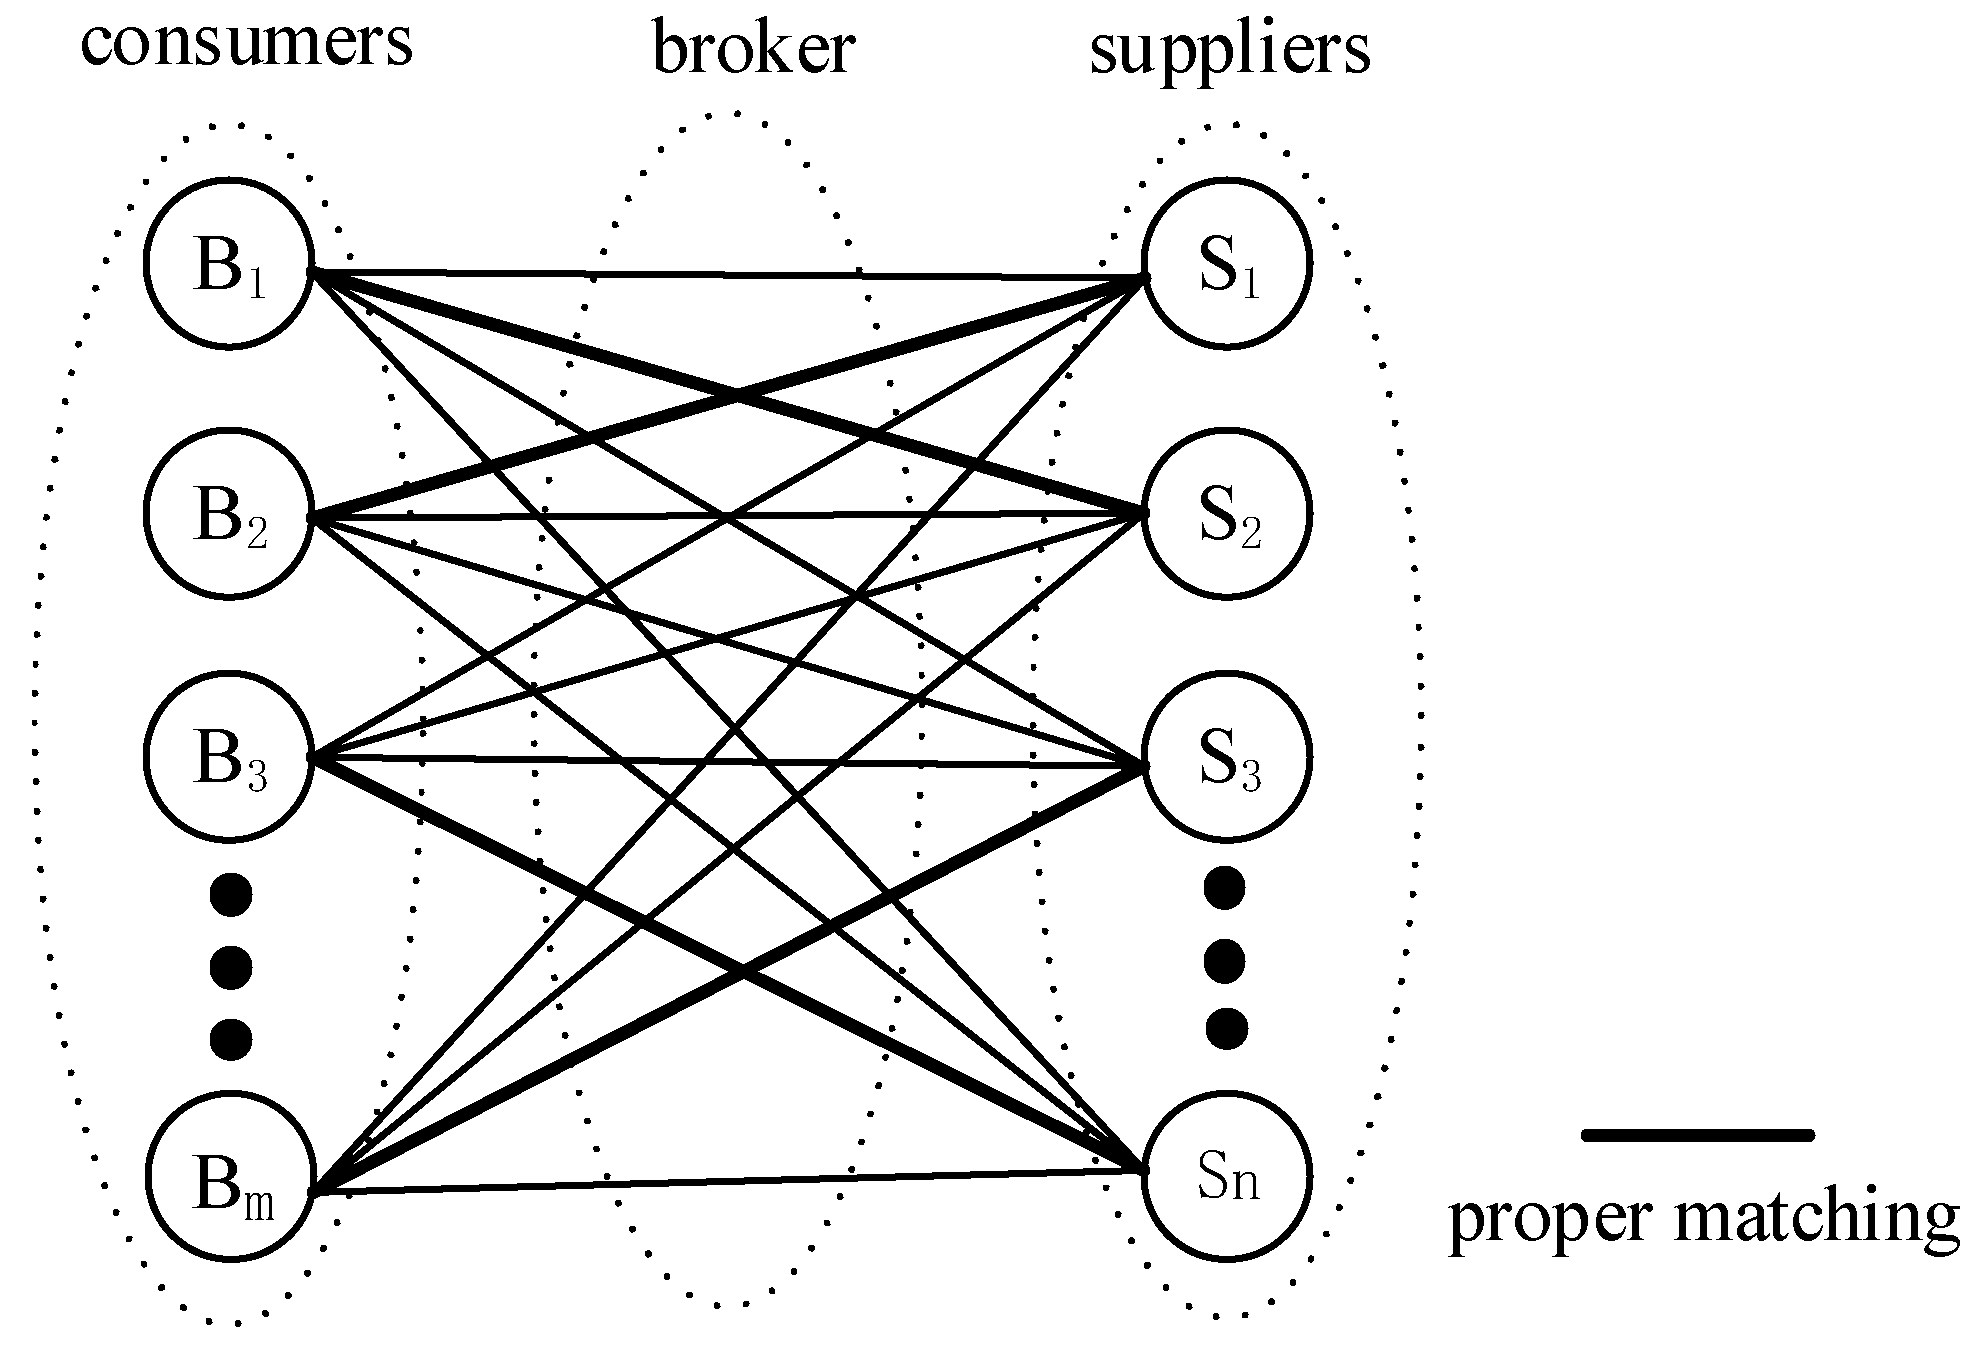
  • To testify to the effectiveness of the method, a case study was conducted. Six consumers and 11 suppliers of bananas were selected from a trading platform for agricultural products.

3.2. Determination of the Attributes of Agricultural Products

At present, many scholars have explored the research on the attributes of agricultural products. Agricultural products have both the attributes of general commodities and special natural attributes, which together constitute the unique overall attributes of agricultural products. This study follows the principles of comprehensive, systematic, and applicability, considers the availability of data and characteristics of the specific attributes of agricultural products, and determines two types of indicators: general attributes and unique attributes of agricultural products.
General attributes: For ordinary products, price, quality, style, brand, etc. often have a great impact on consumer purchase intention and choice [53]. When exploring the impact of product attributes on consumer purchase decisions, scholars mainly focus on two aspects: external attributes (such as brand, packaging, price, product grade, logistics, service quality, etc.) and internal attributes (such as appearance, performance, quality, etc.) [54,55,56,57,58]. Among all these attributes, price is always one of the most important references for consumers purchasing goods. According to the research results of Mauracher et al. [59], consumers state that price is a very important factor in their willingness to purchase a bottle of organic wine. The importance of price to consumers applies to all products. Products with high quality and low prices are more often loved by consumers [60]. Brandis another factor that influences consumers. Brand often refers to a label recognized by consumers, and it is greatly significant to consumer purchasing behavior. When given the choice to purchase less-familiar products, consumers would rather spend more money to purchase products from brands that have higher brand awareness [30,61,62,63]. However, for agricultural products, the role of brands has not been proven to be diminished. Product grade and packaging type are the embodiment of product characteristics and individuality. Higher product grades and appealing packaging can enable consumers to quickly select and identify targets among the dazzling array of commodities [64,65]. Logistics quality, service quality, and other related attributes of suppliers also directly affect the shopping experience of consumers [66,67,68]. Based on the above literature and analysis, price, brand, product grade, packaging type, logistics method, and logistics distance were selected as the general attributes of agricultural products.
Unique attributes: Since fruits, vegetables, meat, and other agricultural products have the features of freshness, seasonality, regionality, high logistics cost, and often large transportation losses, it is difficult to achieve unified standardization. Consumers with poor shopping experiences find it difficult to carry out transactions smoothly. Therefore, the unique attributes, such as fruit shape, freshness, and maturity degree, of agricultural products also need to be considered. Scholars have explored the attributes of agricultural products from many aspects, including brand, price, packaging, appearance, taste, freshness, nutritional quality, origin, safety, etc. [69,70]. Since most agricultural products are perishable and fragile, they cannot be sampled before purchase or use. Similarly, freshness and maturity are also important evaluation indicators for the quality of agricultural products [71,72]. Agricultural products have a fixed cycle of sowing, growing, and harvesting. Their production and consumption have strong seasonal characteristics [73,74,75]. People tend to choose agricultural products that are in season. With increases in residents’ income levels and improvements in dietary structure, the emphasis on consumption is changing from “quantity” to “quality”. Consumers are continually raising their expectations and demands for food. Due to the use of chemical fertilizers, antibiotics, pesticides, and other pollutants, people are paying more attention to the safety of agricultural products, especially organic green products [76,77]. Green organic product certification, traceability information, origin, etc. are aspects of the trust attributes of agricultural products, and they play an important role in consumers’ purchasing choices [78,79]. In China, the origin of products refers to regional space and geographical indication. The quality of agricultural products is closely related to the natural environment (soil, water, air, etc.) and social integrity. Regions of origin are highly correlated with the quality of agricultural products [80,81,82].
On the basis of the literature analysis, the unique attributes of agricultural products chosen in this study include freshness, maturity, seasonality, certification, safety, and origin. To further optimize the attributes proposed above, we consider that logistics distance has a strong correlation with logistics method and efficiency [83]. Logistics method usually include air, water, railway, road, and other options, but generally, products that need long-distance transportation usually choose faster logistics method. Therefore, when setting the logistics attribute, we only retain the logistics distance attribute. Attributes related to appearance were not selected either since the research purpose of this study is to put forward a universal agricultural products sales method. After selecting attributes of agricultural products, further analysis is still needed to consider the following:
  • By determining whether the attribute value can be directly quantified, attributes can be divided into quantitative and qualitative attributes. Each type of attribute value needs to be handled in a different way.
  • Considering whether the attribute must be satisfied, attributes can be divided into hard attributes and soft attributes. Hard attributes represent attributes that must meet certain requirements while soft attributes represent attributes that do not. (e.g., “I’d like to buy an organic apple at 3.5~5 yuan”. In this sentence, “an organic apple” represents a hard attribute that is satisfied strictly; “3~5 yuan” present a soft attribute that could be satisfied in certain situations.)
  • Considering satisfaction with the attribute’s value, attributes can be divided into interval type, benefit type, and cost type. Interval-type attributes are those whose value is closer to a fixed interval (including falling into the specified interval, such as maturity, which includes “live”, “fresh”, “relatively fresh”,” average”, and” slightly spoiled”). The closer the value is to the interval, the better it is. Benefit-type attributes are attributes whose value needs to be large. The larger the attribute value is, the better it is(e.g., the brand of an agricultural product).Cost-type attributes are attributes whose value needs to be small. The smaller the attribute value is, the better it is. For example, maturity is an interval-type attribute, brand is a benefit-type attribute, and logistics distance is a cost-type attribute(e.g., the logistics distance of an agricultural product).
Based on the above analysis, the attribute structure of agricultural products, including general and specific attributes, that needs to be considered, which is shown in Table 3.

3.3. Improved Amount of Information Calculation for Both Quantitative and Qualitative Attributes

Suppose attribute set M includes k attributes. As previously mentioned, agricultural product attributes can be described quantitatively or qualitatively. Quantitative attributes provide an amount of information that can be expressed in the form of a numerical value while qualitative attributes need to be transformed into a numerical value. When calculating the amount of information on agricultural products, system range S r represents the distribution range of attributes required (provided) by the consumer (supplier). Design range D r represents the distribution range of attributes expected by the supplier and consumer. C r is the common range, shown in Figure 2. The design range can be regarded as the expected level, and the system range can be regarded as the actual level. The common range is the overlap between the design range and system range [47,48] (e.g., the price range required by the consumer is [3~5], and the price of the product required by the supplier is [3.5~6]. In this situation, [3~5] represents the “design range”, [3.5~6] represents the “system range”, and [3.5~5] represents “common range”).
The probability that the amount of information satisfies the design scope through the system scope (common range) of the attribute can be expressed as [47,50,84,85]:
S r = f = f 1 , f 2 ,   D r = d =   d 1 , d 2   I = log 2 S r D r S r = log 2 S r C r

3.3.1. Amount of Information Calculation for Quantitative Attributes

The interval range of quantitative attributes is usually given in the form of a numerical interval and can be directly calculated. However, there could be limitations according to the traditional calculation method for the amount of information [86,87]. According to Equation (1), if all the system range attributes fall in the design range, which means S r D r , the amount of information will be zero. In this situation, it is impossible to compare match results. An improved method to calculate the amount of information is proposed by scholars. Still, this kind of method does not take into account the situation in which the system range exceeds the design range,   S r D r , which will lead to a negative value for the amount of information. That is obviously not reasonable. Therefore, this study introduces an intermediate value f ¯ = f 2 f 1 2 , and takes an e power operation of the logarithms of the logarithmic function in Equation (1). So, the amount of information in all situations will be non-negative.
Furthermore, according to the different requirements of the consumer on the range of attribute values, quantitative attributes can generally be divided into three types: interval type, benefit type, and cost type. For an interval-type attribute, it is better when the value is closer to a fixed interval (including falling into a specific interval); for a benefit-type attribute, the higher the value, the more satisfied consumers will be; for a cost-type attribute, the lower the value, the more satisfied consumers will be. The calculation formulas of the amount of information of the three attribute types are shown in Table 4.
When the attribute appears to be a single point value, the calculation formula of the amount of information is:
I k i j = 0 f 1 = f 2 d f 1 = f 2 d

3.3.2. Amount of Information Calculation for Qualitative Attributes

For when the attribute boundary among various levels is usually not clear, in order to facilitate the calculation, it is necessary to transform the ambiguous statement into an accurate value. The membership function in fuzzy mathematics theory is often used to quantify qualitative attributes. Qualitative attribute information can be changed into a numeric value, making it possible for the amount of information to be calculated. When quantifying qualitative attribute information, the key is to select appropriate membership functions to measure fuzzy information by considering the preferences of both sides. There are many different distribution forms of membership functions. The triangle membership function and trapezoid membership function are easy to understand and can better express qualitative information [88,89]. Additionally, their distribution form is more consistent with the characteristics of qualitative attribute information for agricultural products. For these reasons, this study adopts these two kinds of membership functions to measure qualitative attribute information for agricultural products.
Each attribute has language phrases L = l 1 , l 2 , , l T , where l i L is the i th language phrase. Attribute k can be represented by language phrases in L , e.g., the apple’s maturity is a set of languages, which could be seen as L , L = [live, fresh, relatively fresh, average, slightly spoiled]. The attribute information can be transformed into a triangular fuzzy number [90]:
f i = max i 2 T 1 , 0 , i 1 T 1 , min i T 1 , 1 , i = 1 , 2 , T
To calculate the amount of information of each attribute, the area formed by the membership function of the design range is defined as fuzzy design system range F D r , and the area formed by the membership function of system range is defined as fuzzy system range F C r . The intersection of F D r and F S r   is defined as a fuzzy common range. Similarly, because consumers have different requirements for each attribute, the amount of information calculated for qualitative attributes needs to be discussed in three types.
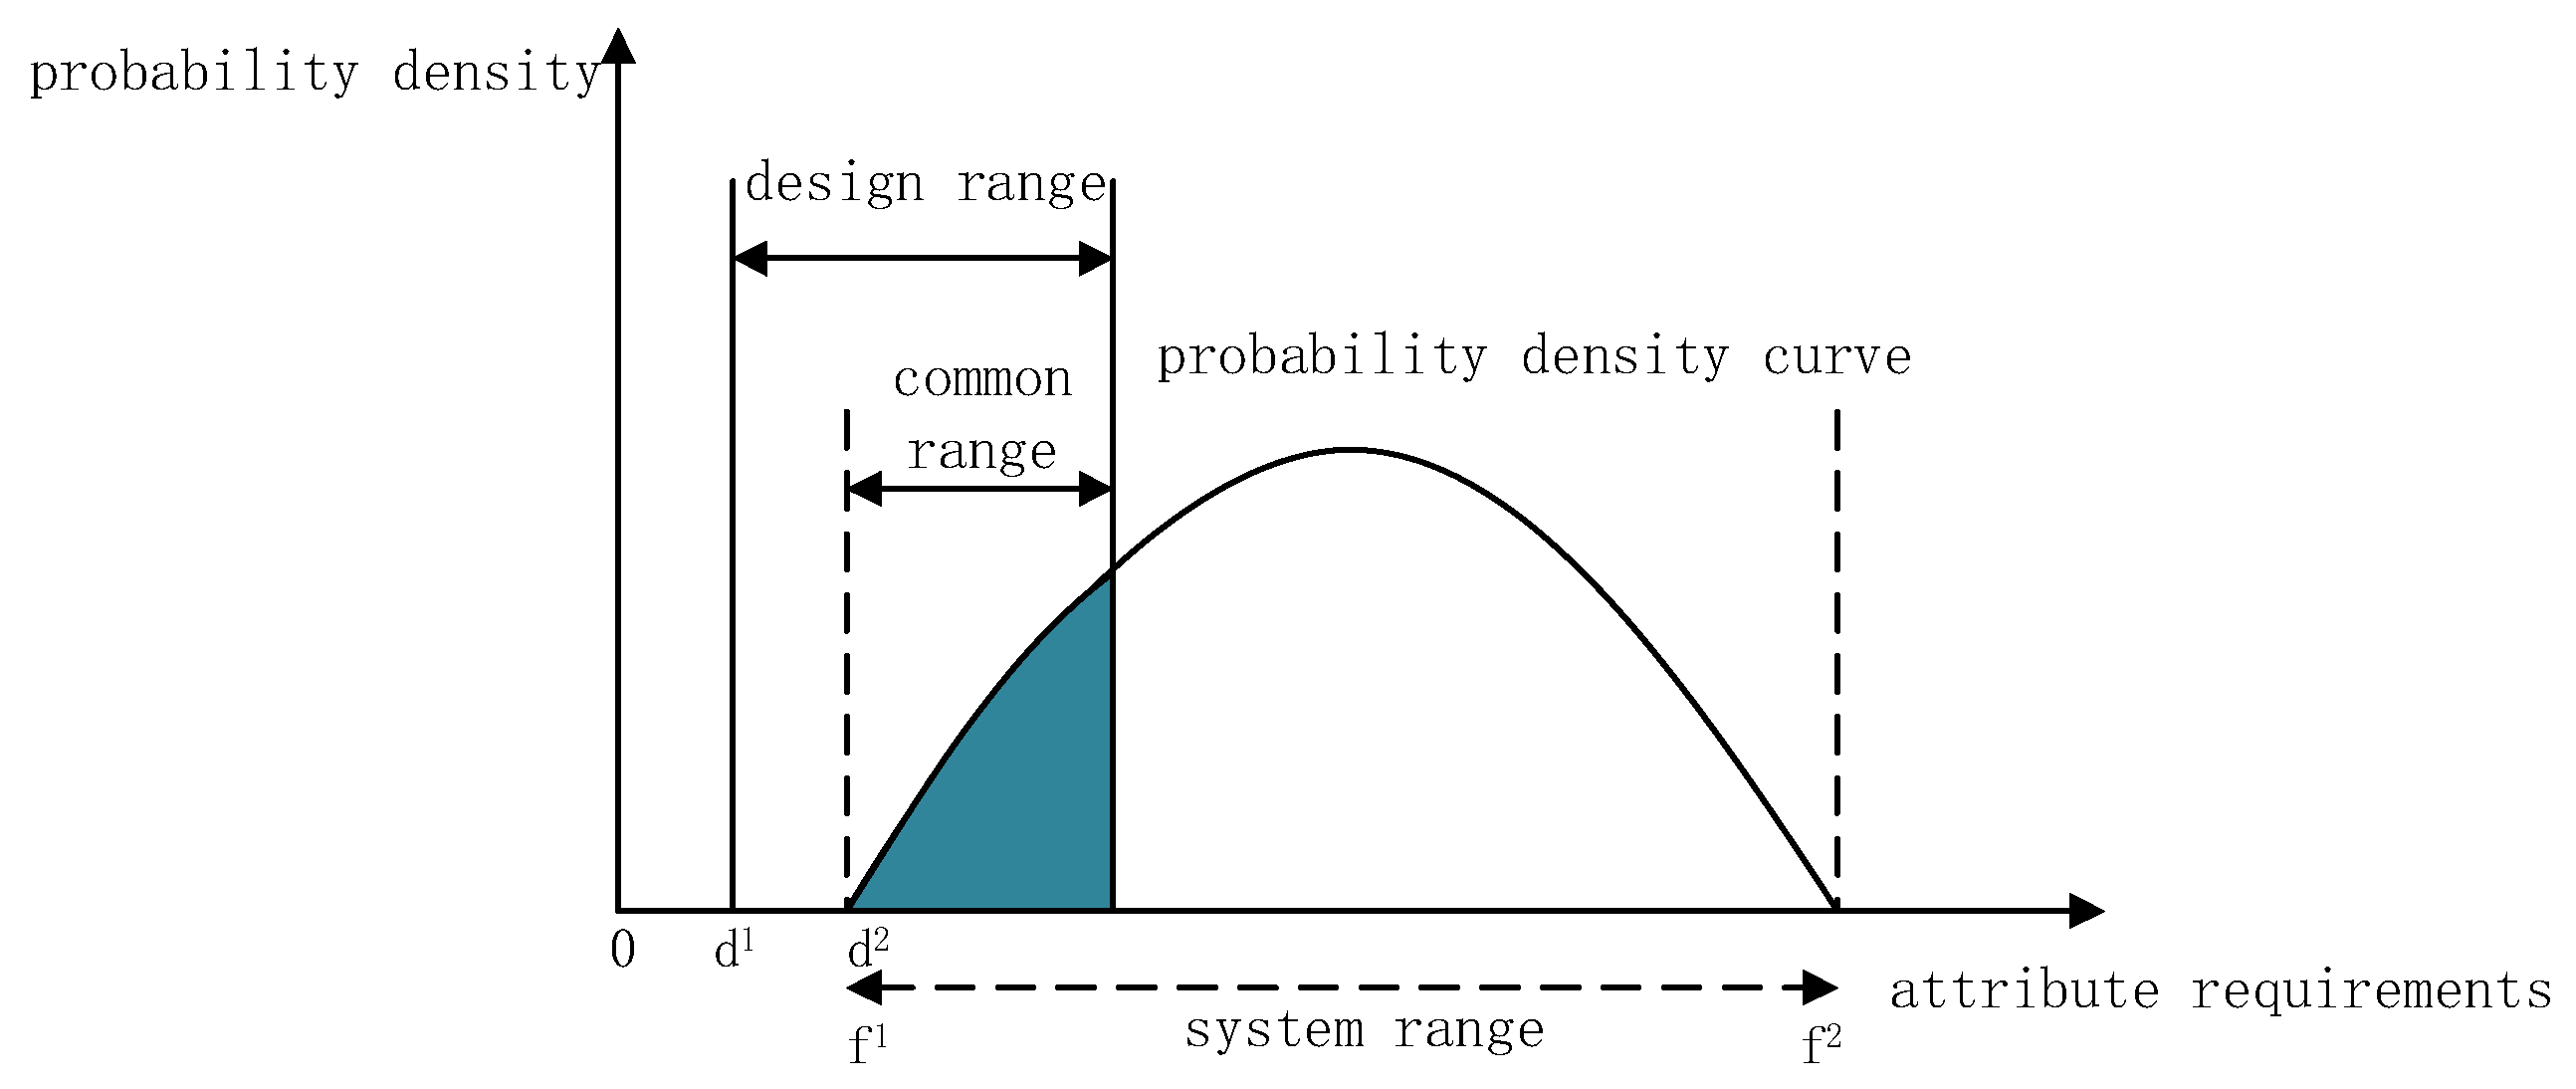
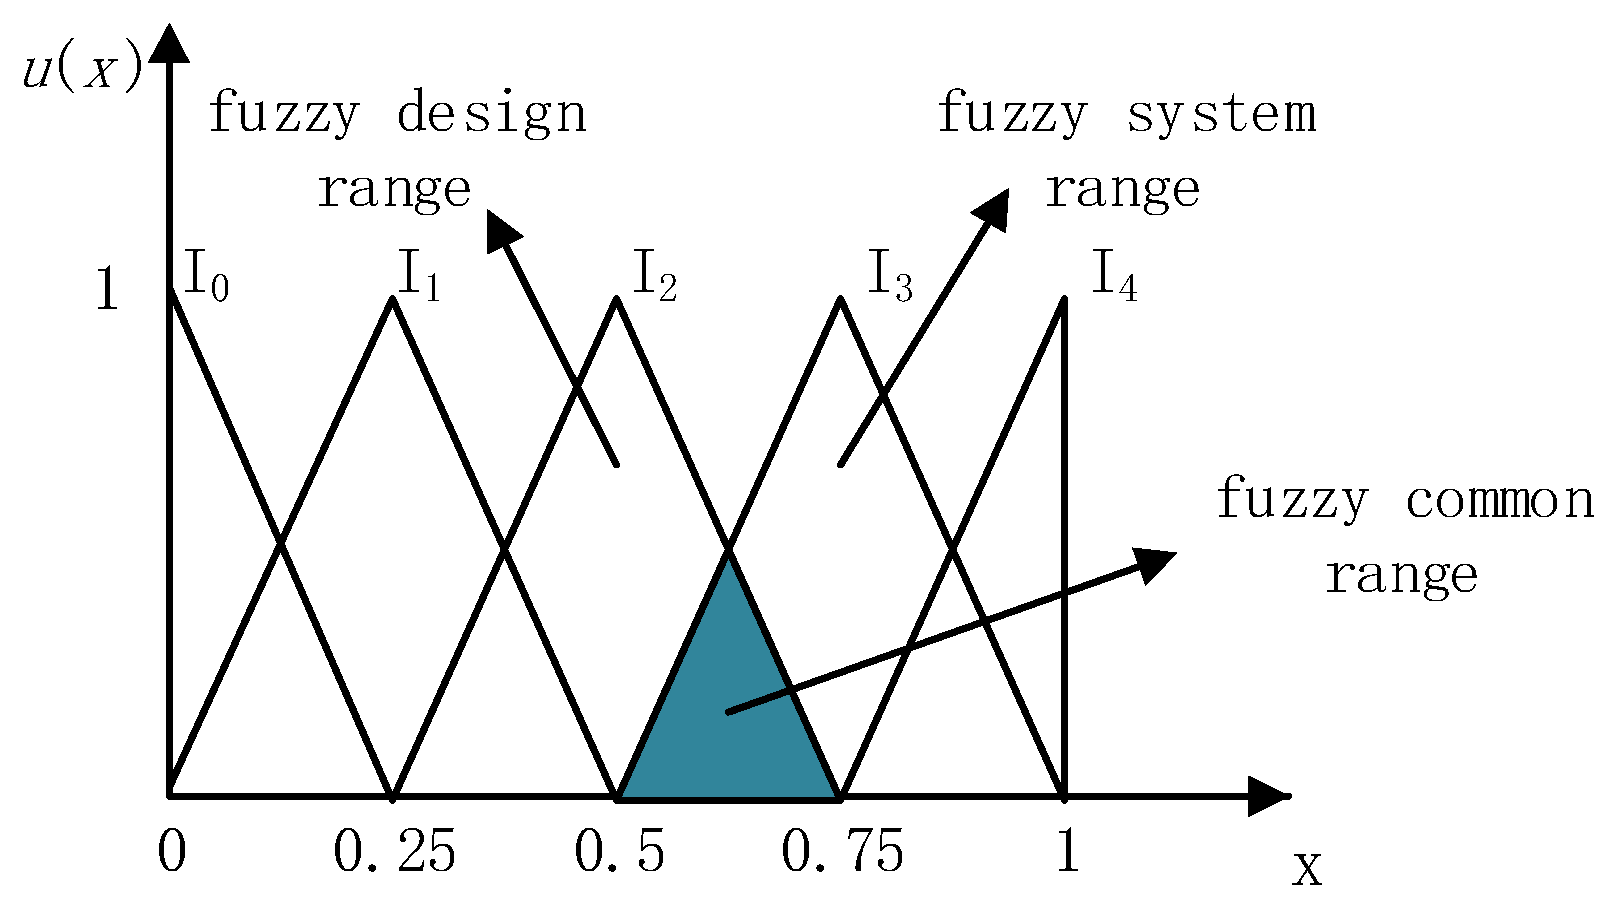
  • For interval-type attributes, the triangle membership can be directly used to calculate the amount of information, shown in Figure 3. The calculation formula for the amount of information is as follows:
    I k = f 2 d 1   or   f 1 d 2 log 2 F S r F C r = log 2 f 1 d 2 μ S x μ D x d x d 1 d 2 μ S x d x f 1 < d 1 < f 2   or   f 1 < d 2 < f 2 0 d 1 < f 1 < f 2 < d 2
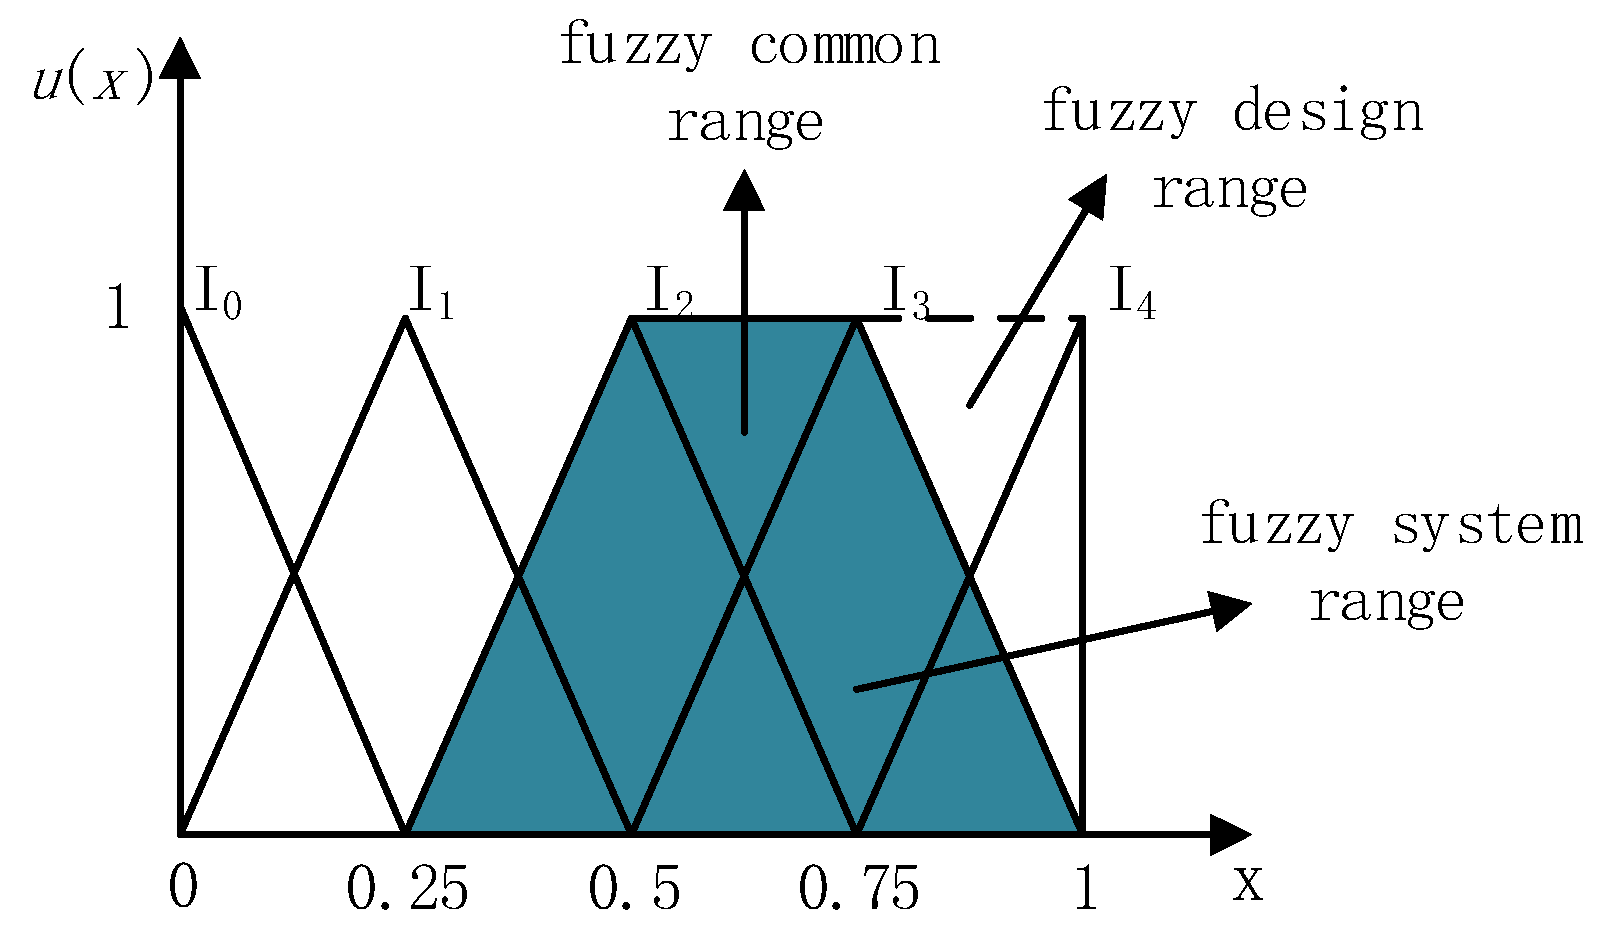
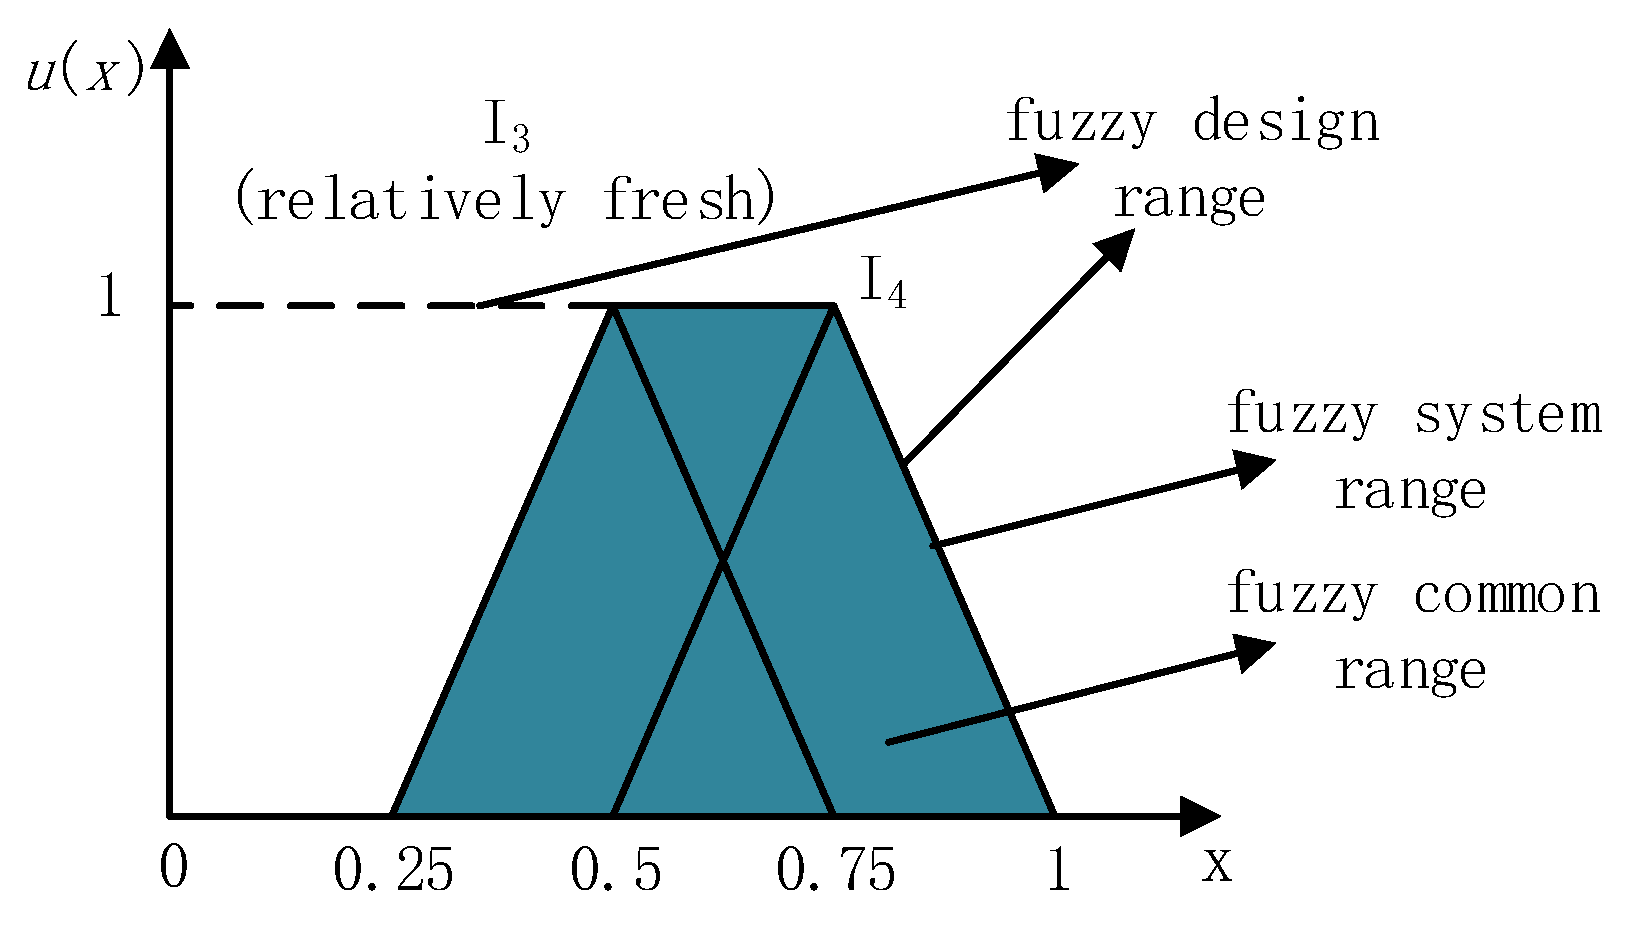
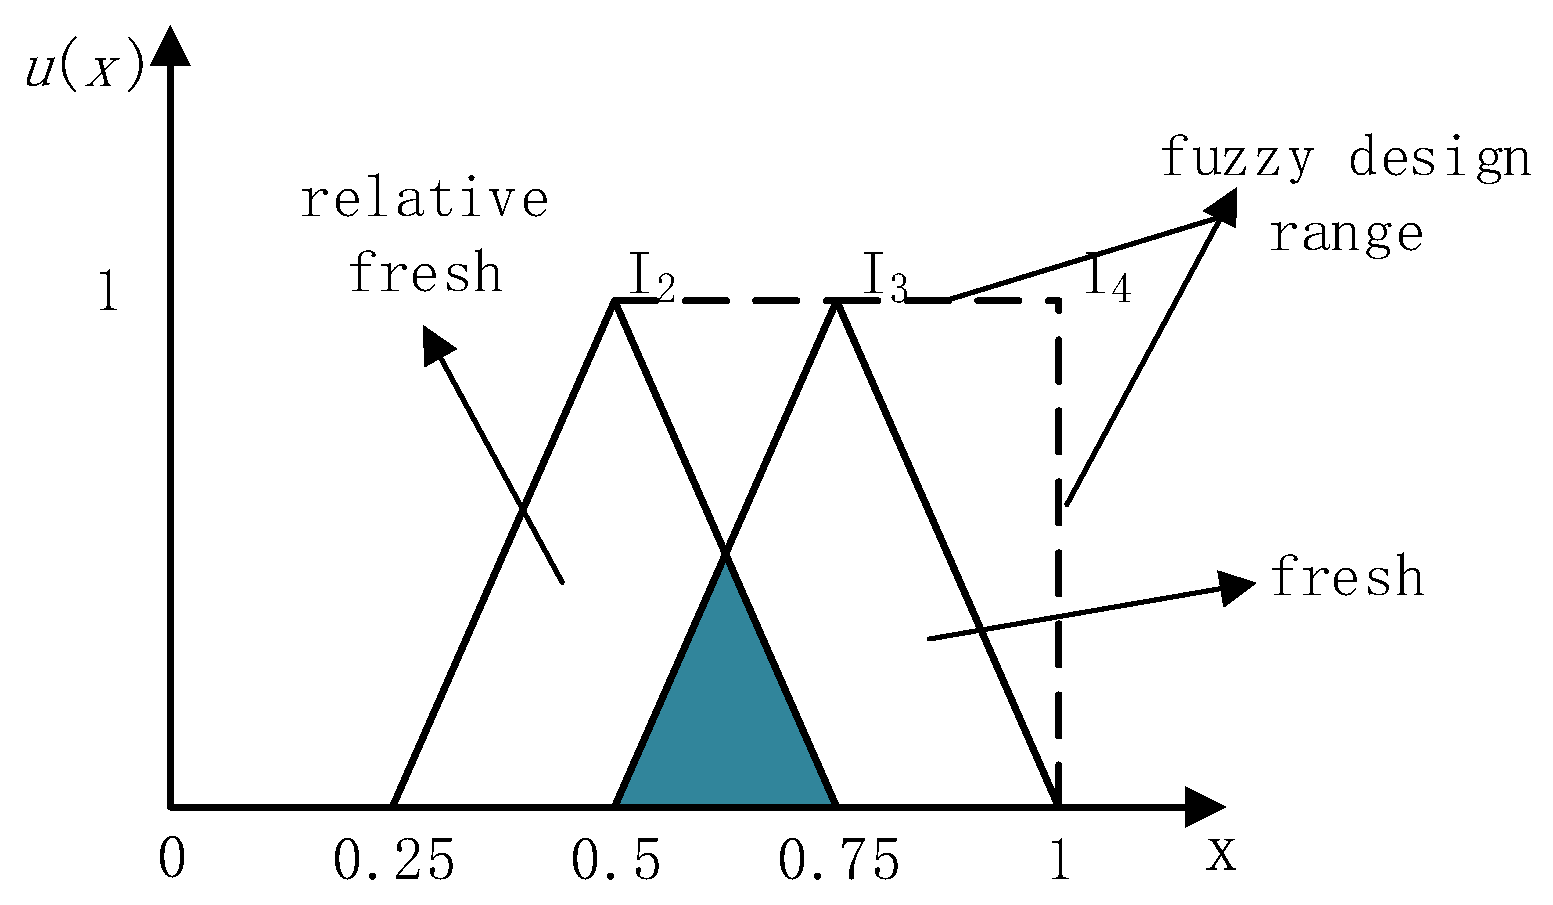
  • For benefit-type attributes, the direct use of triangular fuzzy numbers to calculate the amount of information does not conform to the actual situation of the suppliers and consumers in agricultural product transactions. The direct use of the triangular fuzzy number to calculate the amount of information result in the amount of information may be zero, but in fact, it can be bigger than the initial design range, as shown in Figure 4. For example, in fact, “fresh” is obviously better than “relative fresher”.To solve this problem, it is necessary to use the left trapezoidal membership function to calculate the amount of information contained in the attribute, which has been shown as Figure 5. The amount of information calculation formula should be modified as follows.
    I k = d 2 f 2 log 2 F S r F C r = log 2 f 1 d 2 μ S x μ D x d x 0 d 2 μ S x d x f 1 < d 1 < f 2 0 d 1 < f 1 < f 2 < d 2
  • For cost-type attributes, the calculation method is similar to the method used for benefit-type attributes. It is merely the opposite of the method used for benefit attributes. Cost-type attributes require the attribute value to be as small as possible. So, when cost-type attributes have a smaller value, they actually contain a small part of the attribute value. Thus, the fuzzy system range of the attribute value should include a larger system range. The fuzzy system range of cost-type attribute has been shown as Figure 6.
    I k = d 1 f 2 I k = log 2 F S r F C r = log 2 d 1 f 2 μ S x μ D x d x d 1 d 2 μ S x d x f 1 < d 1 < f 2 0 d 1 f 1

3.3.3. Calculate the Total Amount of Information on Both Sides

Suppose that there are m consumers and n suppliers in the agricultural product transaction, and the products involved in the transaction have k attributes. I k i j and I k j i are, respectively, the amount of information for the consumer and the amount of information for the supplier in the kth attribute when the ith consumer matches the jth supplier. When the ith consumer matches the jth supplier, the total amount of information of the consumer is I i j , and the total amount of information of the supplier is I j i .
I i j = k = 1 h I k i j ,   i = 1 , 2 , , m j = 1 , 2 , , n
I j i = k = 1 h I k j i ,   i = 1 , 2 , , m j = 1 , 2 , , n

3.4. Construction of the Matching Model

Suppose there are m suppliers and n   consumers in an agricultural product transaction involving k attributes of the agricultural products of concern to both parties. Each supplier and consumer can only trade once. When both parties meet their requirements of the constraint conditions, the transaction is successfully matched.
The model includes two objective functions: the total amount of information of the supplier Z 1 l and the total amount of information of the consumer   Z 2 l . Among them, l = 1 , 2 , , A max m , n min m , n . The matching result of supplier and consumer is represented by 0–1 variable. x i j = 1 indicates the i consumer is successfully matched with the j supplier. Otherwise, x i j = 0 . The followingmultiobjective optimization model is established according to the amount of information between the ith consumer and the jth supplier or the jth supplier and the ith consumer.
min Z 1 l = min i = 1 m j = 1 n I i j x i j ,   min Z 2 l = min j = 1 n i = 1 m I j i x j i
s . t . { (10) i = 1 m x i j 1                                                         j = 1 , 2 , , n (11) j = 1 n x i j 1                                                         i = 1 , 2 , , m   (12) i = 1 m j = 1 n I i j x i j t i j = 1 n x i j                 i = 1 , 2 , , m (13) j = 1 n i = 1 m I i j x i j t j i = 1 m x i j                 j = 1 , 2 , , m x i j = 0   o r   1         i = 1 , 2 , , m         j = 1 , 2 , n
Equation (9) is the objective function, and Equations (10)–(13) are constraint conditions. Equations (10) and (11) represent that each supplier (consumer) can conduct one transaction at most with one consumer (supplier). Equations (12) and (13), respectively, represent the maximum amount of information limitation. Furthermore, t i , t j   are the upper limits of the amount of information of the consumer and supplier, and t i > 0 , t j > 0 . This limit expresses the minimum match requirement for a successful transaction between the consumer and supplier. In the matching process, if the matching degree between both sides is too low, the transaction will be given up.

3.5. Model Solution

To solve the model, the linear weighted sum method of the membership function was employed [83,91]. Suppose max Z 1 l ,   max Z 2 l ,   min Z 1 l ,   min Z 2 l , respectively, are the maximum and minimum target values corresponding to the optimization of the objective function Z 1 l , Z 2 l separately [92]. The membership function corresponding to the objective function Formula (9) can be expressed as:
μ Z 1 l = max Z 1 l Z 1 l max Z 1 l min Z 1 l μ Z 2 l = max Z 2 l Z 2 l max Z 2 l min Z 2 l
Set α 1 , α 2 respectively as the weight of μ Z 1 l ,   μ   Z 2 l and meet   0 α 1 1 ,   0 α 2 1 ,   α 1 + α 2 = 1 . The linear weighting method is used to sum the two membership functions, so the original multiobjective optimization model can be transformed into a single-objective optimization model. Take the objective function Z l as a matching degree. The maximum Z l value is the optimization degree of the matching scheme. The original multiobjective optimization model is converted into a single-objective optimization model:
max Z l = max α 1 μ Z 1 l + α 2 μ Z 2 l

3.6. Solving Implementation Steps

Step 1: Identify multiattribute product attribute sets M = M 1 , M 2 , , M h . Hard attributes are rigid requirements for both suppliers and consumers. If a hard attribute is not satisfied, it will be filtered. The system range, design range, and common range of each attribute described by both parties are denoted as   S r ,   D r , and C r ;
Step 2: Calculate the amount of information of each attribute I k i j and I k j i , the total amount of information of the consumer   I i j , and the total amount of information of the supplier I j i ;
Step 3: Make i = 1 m x i j 1 ,     j = 1 , 2 , , n ;   j = 1 n x i j 1 ,     i = 1 , 2 , , m , calculate the total amount of information of the supplier Z 1 l and the total amount of information of the consumer Z 2 l in each matching scheme, among them: Z 1 l = i = 1 m j = 1 n I i j x i j ,     Z 2 l = j = 1 n i = 1 m I j i x j i ;
Step 4: Iterate over all Z 1 l , getting max Z 1 l and min Z 1 l ; iterate over all Z 2 l , getting max Z 2 l and min Z 2 l ;
Step 5: Calculate the value of each membership function μ Z 1 l ,     μ Z 2 l ;
Step 6: Retraverse all matching schemes to obtain the optimal matching degree and the optimal matching scheme.

4. Case Study

To verify the effectiveness of the method, six consumers and 11 suppliers of bananas were selected from a trading platform for agricultural products. For the suppliers, the logistics limitations consists of interval-type soft attributes; price consists of benefit-type soft attributes; and all other properties are objective attributes. The basic information of the consumers and suppliers to be matched is shown in Table 5 and Table 6.
Based on the above data of agricultural products consumers and suppliers, three matching models were calculated and compared. That was only considering the matching degree of the consumer, only considering the matching degree of the supplier, and considering the matching degree of both parties (based on previous literature and considering the fairness of both sides, α 1 = 0.5 ,     α 2 = 0.5 [48,49]). Table 7 shows the comparison of matching of three matching models.
Comparison results shown in Table 5 indicate that the matching model proposed in this study, which considers both supply and demand, has the highest matching degree and significantly improves the optimization of matching schemes. The reason is that taking into account both the satisfaction of the supplier and consumer eliminates some matching schemes that only meet the requirements of one side, which improves the matching degree of the optimal scheme. In the above matching process, because the upper limit of transaction information of both sides ( t i = 2 , t j = 1 ) is large, more matching pairs were generated. In order to further explore the relationship between the upper limit of transaction information and the optimal matching scheme, the upper limit of the amount of information required by both parties was changed. After that, the optimal matching degree and matching pairs in the different upper limits of the amount of information are shown in Table 8.
As shown in Table 8, with the reduction of the upper limit t i t j   for the amount of information of supplier (consumer) transactions, the overall optimal matching degree is increasing while matching pairs are decreasing. Through analysis of the simulation results, if the upper limit of the amount of information t i t j   is set too high for transaction matching between the supplier and consumer, it will avoid the low degree of transaction matching. However, if t i t j is set too low, the matching pairs may reduce to zero, and optimal transaction matching cannot be satisfied.
This means when the suppliers and consumers seek the matching degree scheme, the satisfaction of both sides is inversely related to the optimal scheme available. The higher the requirements for the satisfaction of suppliers and consumers, the harder it is to get a well-matched scheme. The solution results are consistent with reality. Therefore, rational and reasonable requirements of both sides are also very important for increasing the matching degree and obtaining a matching scheme.

5. Conclusions

Constrained by their small scale, lack of investment, and technology, most small farmers live on a meager income from their sales of agricultural products. The lack of an intelligent method to match consumers and suppliers in the market can hardly sell their produce smoothly, which leads them to a state of relative poverty and a lack of sustainable development opportunities. To solve the matching problem between small farmers and potential buyers of agricultural products, this study proposed a smart, efficient, and accurate matching method between suppliers and consumers. Firstly, considering most agricultural products are fresh, perishable, and not easily preserved, a unique attribute set of agricultural products was established which included general attributes and specific attributes of agricultural products. Secondly, by combining fuzzy mathematics with the information axiom, an improved amount of information calculation method for both quantitative and qualitative attributes was put forward. Thirdly, based on the amount of information about all attributes and with the goal of maximizing the transaction matching degree for both the supplier and consumer, a multiobjective optimization model was developed. Finally, the effectiveness and accuracy of the method were verified through a case study. Compared with the existing studies, this method: (1) fully considered the specific attributes of agricultural products other than general commodity attributes, such as freshness, maturity, and other attributes, and constructed a multiattribute indicator system for agricultural products transaction; (2) combining with fuzzy mathematics theory and the information axiom, developed an improved calculation of information amount for different needs for qualitative and quantitative attributes; (3) considering the dynamics and ambiguity in the agricultural product transaction process, established a one-shot multiattribute agricultural product supply and demand matching method. Through the experimental results, this method can effectively improve the matching degree of agricultural products.

6. Implications and Limitations

Smart sales can empower small farmers by increasing sales volume and price by improving matching degrees in the agricultural market. At the present stage, rural commerce platforms can only provide simple information-sharing and transaction functions. They are still not perfect trading markets for agricultural products. To better serve small farmers to sell their produce, the intelligent matching method proposed in this study can be embedded on agricultural e-commerce websites, which can provide a convenient, fast, and efficient way to find the most suitable consumers for them to avoid encountering poor sales. This helps to facilitate the transaction of agricultural products, increase sales income, and promote small farmers’ sustainable development capabilities.
However, there are still limitations in our study. Firstly, this study only considers the situation that each consumer can only match with one supplier while in reality, a single consumer can purchase products from multiple suppliers. Secondly, due to the perishable nature of many fresh agricultural products, such as vegetables, fruits, and meat, efficient transactions alone are not enough. The well-organized operation, good infrastructure, and fast logistics are particularly important. Without these efforts, agricultural products will spoil and rot, resulting in the loss of small farmers. Therefore, when studying the matching problem of suppliers and consumers of agricultural products, the above factors should be taken into account, and different contexts should be compared. Thirdly, how to better develop rural e-commerce and put forward more supporting technologies is also an important research direction. All these problems can be further studied.

Author Contributions

Methodology, supervision, writing—review and editing, and funding acquisition, W.H.; Data curation and writing—original draft, P.H.; Conceptualization and supervision, F.-S.T.; Formal analysis and writing—review and editing, Y.L.; Data curation and validation, Y.H. All authors have read and agreed to the published version of the manuscript.

Funding

This research was funded by the National Social Science Foundation of China (NSSFC), grant number 19BGL224; Major Science and Technology Projects in Henan Province, China, grant number 201110210300; Postgraduate Innovation Project of North China University of Water Resources and Electric Power, grant number YK-2021-118; Henan Province Higher Education Teaching Reform Research and Practice Project, 2021.

Institutional Review Board Statement

Not applicable.

Informed Consent Statement

Not applicable.

Data Availability Statement

The source of relevant data acquisition has been described in the text.

Conflicts of Interest

The authors declare no conflict of interest.

References

  1. Leng, K.; Bi, Y.; Jing, L.; Fu, H.-C.; Van Nieuwenhuyse, I. Research on agricultural supply chain system with double chain architecture based on blockchain technology. Futur. Gener. Comput. Syst. 2018, 86, 641–649. [Google Scholar] [CrossRef]
  2. Kieu, P.T.; Nguyen, V.T.; Nguyen, V.T.; Ho, T.P. A Spherical Fuzzy Analytic Hierarchy Process (SF-AHP) and Combined Compromise Solution (CoCoSo) Algorithm in Distribution Center Location Selection: A Case Study in Agricultural Supply Chain. Axioms 2021, 10, 53. [Google Scholar] [CrossRef]
  3. Hsu, J.Y.; Tseng, W.K.; Hsieh, J.Y.; Chang, C.J.; Chen, H. The Recommending Agricultural Product Sales Promotion Mode in E-Commerce Using Reinforcement Learning with Contextual Multiarmed Bandit Algorithms. Math. Probl. Eng. 2020, 2020, 8836000. [Google Scholar] [CrossRef]
  4. Mylan, J.; Geels, F.; Gee, S.; McMeekin, A.; Foster, C. Eco-innovation and retailers in milk, beef and bread chains: Enriching environmental supply chain management with insights from innovation studies. J. Clean. Prod. 2015, 107, 20–30. [Google Scholar] [CrossRef]
  5. Yu, X.; Li, C. Research on Supply Chain of Livestock Products Mode Based on Third-Party Logistics. In Proceedings of the 2011 International Conference on Engineering and Information Management (ICEIM 2011), Chengdu, China, 15–17 April 2011. [Google Scholar]
  6. Shi, P.; Yan, B. Factors affecting RFID adoption in the agricultural product distribution industry: Empirical evidence from China. Springerplus 2016, 5, 2029. [Google Scholar] [CrossRef] [Green Version]
  7. Tian, H.; Wang, T.; Liu, Y.; Qiao, X.; Li, Y. Computer vision technology in agricultural automation—A review. Inf. Processing Agric. 2020, 7, 1–19. [Google Scholar] [CrossRef]
  8. Christiaensen, L.; Rutledge, Z.; Taylor, J.E. Viewpoint: The future of work in agri-food. Food Policy 2021, 99, 101963. [Google Scholar] [CrossRef]
  9. Pakravan-Charvadeh, M.R.; Mohammadi-Nasrabadi, F.; Gholamrezai, S.; Vatanparast, H.; Flora, C.; Nabavi-Pelesaraei, A. The short-term effects of COVID-19 outbreak on dietary diversity and food security status of Iranian households (A case study in Tehran province). J. Clean. Prod. 2021, 281, 124537. [Google Scholar] [CrossRef]
  10. Zeng, M.; Liu, R.; Gao, M.; Jiang, Y. Demand Forecasting for Rural E-Commerce Logistics: A Gray Prediction Model Based on Weakening Buffer Operator. Mob. Inf. Syst. 2022, 2022, 3395757. [Google Scholar] [CrossRef]
  11. Yan, W. Research on the Application of Online-to-offline Mode in Agricultural Products E-Commerce Based on New Retail. In Proceedings of the 2019 International Conference on Economic Management and Cultural Industry (ICEMCI 2019), Shenzhen, China, 15–17 November 2019; pp. 272–275. [Google Scholar]
  12. Roth, A.E. Common and conflicting interests in two-sided matching markets. Eur. Econ. Rev. 1985, 27, 75–96. [Google Scholar] [CrossRef]
  13. Roth, A.E. New physicians: A natural experiment in market organization. Science 1990, 250, 1524–1528. [Google Scholar] [CrossRef] [Green Version]
  14. Cable, D.M.; Judge, T.A. Pay preferences and job search decisions: A person-organization fit perspective. Pers. Psychol. 1994, 47, 317–348. [Google Scholar] [CrossRef]
  15. Korkmaz, I.; Gökçen, H.; Çetinyokuş, T. An analytic hierarchy process and two-sided matching based decision support system for military personnel assignment. Inf. Sci. 2008, 178, 2915–2927. [Google Scholar] [CrossRef]
  16. Yu, D.; Xu, Z. Intuitionistic fuzzy two-sided matching model and its application to personnel-position matching problems. J. Oper. Res. Soc. 2020, 71, 312–321. [Google Scholar] [CrossRef]
  17. Mammadova, M.H.; Jabrayilova, Z. Methods Managing for Matching of Supply and Demand on the IT Specialists. Autom. Control. Comput. Sci. 2019, 53, 148–158. [Google Scholar] [CrossRef]
  18. Liang, Z.-C.; Yang, Y.; Liao, S.-G. Interval-valued intuitionistic fuzzy two-sided matching model considering level of automation. Appl. Soft Comput. 2022, 116, 108252. [Google Scholar] [CrossRef]
  19. Hoppe, H.C.; Ozdenoren, E. Intermediation in innovation. Int. J. Ind. Organ. 2005, 23, 483–503. [Google Scholar] [CrossRef] [Green Version]
  20. Klerkx, L.; Leeuwis, C. Balancing multiple interests: Embedding innovation intermediation in the agricultural knowledge infrastructure. Technovation 2008, 28, 364–378. [Google Scholar] [CrossRef]
  21. Han, J.; Li, B.; Liang, H.; Lai, K.K. A novel two-sided matching decision method for technological knowledge supplier and demander considering the network collaboration effect. Soft Comput. 2018, 22, 5439–5451. [Google Scholar] [CrossRef]
  22. Sambo, A. Matching electricity supply with demand in Nigeria. Int. Assoc. Energy Econ. 2008, 4, 32–36. [Google Scholar]
  23. Cheng, Y.; Tao, F.; Xu, L.; Zhao, D. Advanced manufacturing systems: Supply–demand matching of manufacturing resource based on complex networks and Internet of Things. Enterp. Inf. Syst. 2018, 12, 780–797. [Google Scholar] [CrossRef]
  24. Al-Ghussain, L.; Ahmad, A.D.; Abubaker, A.M.; Abujubbeh, M.; Almalaq, A.; Mohamed, M.A. A demand-supply matching-based approach for mapping renewable resources towards 100% renewable grids in 2050. IEEE Access 2021, 9, 58634–58651. [Google Scholar] [CrossRef]
  25. Gao, Z.; Wang, D.; Zhou, H. Intelligent circulation system modeling using bilateral matching theory under Internet of Things technology. J. Supercomput. 2021, 77, 13514–13531. [Google Scholar] [CrossRef]
  26. Li, Y.-H.; Zheng, J.; Fan, Z.-P.; Wang, L. Sentiment analysis-based method for matching creative agri-product scheme demanders and suppliers: A case study from China. Comput. Electron. Agric. 2021, 186, 106196. [Google Scholar] [CrossRef]
  27. Verdouw, C.; Beulens, A.; Trienekens, J.; Wolfert, J. Process modelling in demand-driven supply chains: A reference model for the fruit industry. Comput. Electron. Agric. 2010, 73, 174–187. [Google Scholar] [CrossRef]
  28. Zhao, L.; Huang, Y.; Liu, Z.; Wu, M.; Jiang, L. Research on Integration of Livestock Products Supply Chain Based on the Optimal Match between Supply and Demand. In Proceedings of the International Conference on Management Science and Engineering Management, Nomi, Japan, 17–20 August 2017; pp. 1089–1102. [Google Scholar]
  29. Niu, W.; Zheng, J. WebGIS based agricultural products trade platform using the bilateral matching model. In Proceedings of the 2014 The Third International Conference on Agro-Geoinformatics, Beijing, China, 11–14 August 2014; pp. 1–6. [Google Scholar]
  30. Xu, G.; Piao, S.; Song, Z. Demand Forecasting of Agricultural Products Logistics in Community. Am. J. Ind. Bus. Manag. 2015, 5, 507–517. [Google Scholar] [CrossRef] [Green Version]
  31. Gale, D.; Shapley, L.S. College admissions and the stability of marriage. Am. Math. Mon. 1962, 69, 9–15. [Google Scholar] [CrossRef]
  32. Huang, C.-C. Cheating by Men in the Gale-Shapley Stable Matching Algorithm. In Proceedings of the 2006 European Symposium on Algorithms, Zurich, Switzerland, 11–13 September 2006; pp. 418–431. [Google Scholar]
  33. Abououf, M.; Singh, S.; Otrok, H.; Mizouni, R.; Ouali, A. Gale-shapley matching game selection—A framework for user satisfaction. IEEE Access 2018, 7, 3694–3703. [Google Scholar] [CrossRef]
  34. Cohen, W.W. Data integration using similarity joins and a word-based information representation language. ACM Trans. Inf. Syst. 2000, 18, 288–321. [Google Scholar] [CrossRef] [Green Version]
  35. Tejada, S.; Knoblock, C.A.; Minton, S. Learning object identification rules for information integration. Inf. Syst. 2001, 26, 607–633. [Google Scholar] [CrossRef]
  36. Ragone, A.; Straccia, U.; Di Noia, T.; Di Sciascio, E.; Donini, F.M. Fuzzy matchmaking in e-marketplaces of peer entities using Datalog. Fuzzy Sets Syst. 2009, 160, 251–268. [Google Scholar] [CrossRef]
  37. Ragone, A.; Straccia, U.; Noia, T.D.; Sciascio, E.D.; Donini, F.M. Vague Knowledge Bases for Matchmaking in p2p e-Marketplaces. In Proceedings of the European Semantic Web Conference, Innsbruck, Austria, 3–7 June 2007; pp. 414–428. [Google Scholar]
  38. Lahdelma, R.; Salminen, P. Prospect theory and stochastic multicriteria acceptability analysis (SMAA). Omega 2009, 37, 961–971. [Google Scholar] [CrossRef]
  39. Tervonen, T.; Figueira, J.R. A survey on stochastic multicriteria acceptability analysis methods. J. Multi-Criteria Decis. Anal. 2008, 15, 1–14. [Google Scholar] [CrossRef]
  40. Menou, A.; Benallou, A.; Lahdelma, R.; Salminen, P. Decision support for centralizing cargo at a Moroccan airport hub using stochastic multicriteria acceptability analysis. Eur. J. Oper. Res. 2010, 204, 621–629. [Google Scholar] [CrossRef]
  41. Gomes, L.F.A.M.; Rangel, L.A.D. An application of the TODIM method to the multicriteria rental evaluation of residential properties. Eur. J. Oper. Res. 2009, 193, 204–211. [Google Scholar] [CrossRef]
  42. Fan, Z.-P.; Zhang, X.; Chen, F.-D.; Liu, Y. Extended TODIM method for hybrid multiple attribute decision making problems. Knowl. -Based Syst. 2013, 42, 40–48. [Google Scholar] [CrossRef]
  43. Tseng, M.-L.; Lin, Y.-H.; Tan, K.; Chen, R.-H.; Chen, Y.-H. Using TODIM to evaluate green supply chain practices under uncertainty. Appl. Math. Model. 2014, 38, 2983–2995. [Google Scholar] [CrossRef]
  44. Gou, X.; Xu, Z.; Liao, H.; Herrera, F. Probabilistic double hierarchy linguistic term set and its use in designing an improved VIKOR method: The application in smart healthcare. J. Oper. Res. Soc. 2021, 72, 2611–2630. [Google Scholar] [CrossRef]
  45. Zeng, L.; Zhao, Y.; Wang, X. How to develop the new urbanization in mineral resources abundant regions in China? A VIKOR-based path matching model. Resour. Policy 2022, 79, 103095. [Google Scholar] [CrossRef]
  46. Jati, H. Comparison of university webometrics ranking using multicriteria decision analysis: Topsis and vikor method. World Acad. Sci. Eng. Technol. Paris 2012, 71, 1663–1669. [Google Scholar]
  47. Kulak, O.; Kahraman, C. Multi-attribute comparison of advanced manufacturing systems using fuzzy vs. crisp axiomatic design approach. Int. J. Prod. Econ. 2005, 95, 415–424. [Google Scholar] [CrossRef]
  48. Chen, X.; Li, Z.; Fan, Z.-P.; Zhou, X.; Zhang, X. Matching demanders and suppliers in knowledge service: A method based on fuzzy axiomatic design. Inf. Sci. 2016, 346–347, 130–145. [Google Scholar] [CrossRef]
  49. Fan, Z.-P.; Li, M.-Y.; Zhang, X. Satisfied two-sided matching: A method considering elation and disappointment of agents. Soft Comput. 2018, 22, 7227–7241. [Google Scholar] [CrossRef]
  50. Kulak, O.; Kahraman, C. Fuzzy multi-attribute selection among transportation companies using axiomatic design and analytic hierarchy process. Inf. Sci. 2005, 170, 191–210. [Google Scholar] [CrossRef]
  51. Chen, X.; Han, J.; Fan, Z.-P.; Liu, Y. Fuzzy Axiomatic Design for Knowledge Demanders and Suppliers in Knowledge Service. In Proceedings of the 2010 IEEE International Conference on Industrial Engineering and Engineering Management, Xiamen, China, 29–31 October 2010; pp. 1077–1081. [Google Scholar]
  52. Yoon, K.; Hwang, C. Lecture Notes in Economics and Mathematical Systems; Springer: Berlin/Heidelberg, Germany, 1981; Volume 5. [Google Scholar]
  53. McNeill, L.; Moore, R. Sustainable fashion consumption and the fast fashion conundrum: Fashionable consumers and attitudes to sustainability in clothing choice. Int. J. Consum. Stud. 2015, 39, 212–222. [Google Scholar] [CrossRef]
  54. Symmank, C. Extrinsic and intrinsic food product attributes in consumer and sensory research: Literature review and quantification of the findings. Manag. Rev. Q. 2019, 69, 39–74. [Google Scholar] [CrossRef]
  55. Grunert, K.G. The common ground between sensory and consumer science. Curr. Opin. Food Sci. 2015, 3, 19–22. [Google Scholar] [CrossRef]
  56. Enneking, U.; Neumann, C.; Henneberg, S. How important intrinsic and extrinsic product attributes affect purchase decision. Food Qual. Prefer. 2007, 18, 133–138. [Google Scholar] [CrossRef]
  57. Deng, X.; Srinivasan, R. When do transparent packages increase (or decrease) food consumption? J. Mark. 2013, 77, 104–117. [Google Scholar] [CrossRef] [Green Version]
  58. Waheed, S.; Khan, M.M.; Ahmad, N. Product packaging and consumer purchase intentions. Mark. Forces 2018, 13, 97–114. [Google Scholar]
  59. Mauracher, C.; Procidano, I.; Valentini, M. How product attributes and consumer characteristics influence the WTP, resulting in a higher price premium for organic wine. Sustainability 2019, 11, 1428. [Google Scholar] [CrossRef] [Green Version]
  60. Kostyra, D.S.; Reiner, J.; Natter, M.; Klapper, D. Decomposing the effects of online customer reviews on brand, price, and product attributes. Int. J. Res. Mark. 2016, 33, 11–26. [Google Scholar] [CrossRef]
  61. Cheung, M.L.; Pires, G.D.; Rosenberger, P.J., III. Developing a conceptual model for examining social media marketing effects on brand awareness and brand image. Int. J. Econ. Bus. Res. 2019, 17, 243–261. [Google Scholar] [CrossRef]
  62. Sheth, J.N.; Newman, B.I.; Gross, B.L. Consumption Values and Market Choices: Theory and Applications; South-Western Publishing: Cinicinnati, OH, USA, 1991. [Google Scholar]
  63. Thammawimutti, A.; Chaipoopirutana, P.D.S. The relationship between brand equity, product attributes and purchase intention: A study of Sony digital cameras in Bangkok. AU J. Manag. 2005, 3, 5–10. [Google Scholar] [CrossRef]
  64. Llavata, B.; García-Pérez, J.V.; Simal, S.; Cárcel, J.A. Innovative pre-treatments to enhance food drying: A current review. Curr. Opin. Food Sci. 2020, 35, 20–26. [Google Scholar] [CrossRef]
  65. Akdeniz, B.; Calantone, R.J.; Voorhees, C.M. Effectiveness of Marketing Cues on Consumer Perceptions of Quality: The Moderating Roles of Brand Reputation and Third-Party Information. Psychol. Mark. 2013, 30, 76–89. [Google Scholar] [CrossRef]
  66. Chen, L.-d.; Gillenson, M.L.; Sherrell, D.L. Consumer acceptance of virtual stores: A theoretical model and critical success factors for virtual stores. ACM Sigmis Database Adv. Inf. Syst. 2004, 35, 8–31. [Google Scholar] [CrossRef]
  67. Galkin, A.; Dolia, C.; Davidich, N. The role of consumers in logistics systems. Transp. Res. Procedia 2017, 27, 1187–1194. [Google Scholar] [CrossRef]
  68. Paciarotti, C.; Torregiani, F. The logistics of the short food supply chain: A literature review. Sustain. Prod. Consum. 2021, 26, 428–442. [Google Scholar] [CrossRef]
  69. Massaglia, S.; Borra, D.; Peano, C.; Sottile, F.; Merlino, V. Consumer Preference Heterogeneity Evaluation in Fruit and Vegetable Purchasing Decisions Using the Best–Worst Approach. Foods 2019, 8, 266. [Google Scholar] [CrossRef] [Green Version]
  70. Demattè, M.L.; Pojer, N.; Endrizzi, I.; Corollaro, M.L.; Betta, E.; Aprea, E.; Charles, M.; Biasioli, F.; Zampini, M.; Gasperi, F. Effects of the sound of the bite on apple perceived crispness and hardness. Food Qual. Prefer. 2014, 38, 58–64. [Google Scholar] [CrossRef]
  71. Liu, M.; Dan, B.; Zhang, S.; Ma, S. Information sharing in an E-tailing supply chain for fresh produce with freshness-keeping effort and value-added service. Eur. J. Oper. Res. 2020, 290, 572–584. [Google Scholar] [CrossRef]
  72. Meng, X.; Kim, S.; Puligundla, P.; Ko, S. Carbon dioxide and oxygen gas sensors-possible application for monitoring quality, freshness, and safety of agricultural and food products with emphasis on importance of analytical signals and their transformation. J. Korean Soc. Appl. Biol. Chem. 2014, 57, 723–733. [Google Scholar] [CrossRef]
  73. Kelley, K.M.; Primrose, R.; Crassweller, R.; Hayes, J.E.; Marini, R. Consumer peach preferences and purchasing behavior: A mixed methods study. J. Sci. Food Agric. 2016, 96, 2451–2461. [Google Scholar] [CrossRef]
  74. Ardeshiri, A.; Sampson, S.; Swait, J. Seasonality effects on consumers’ preferences over quality attributes of different beef products. Meat Sci. 2019, 157, 107868. [Google Scholar] [CrossRef] [Green Version]
  75. Wakjira, M.T.; Peleg, N.; Anghileri, D.; Molnar, D.; Alamirew, T.; Six, J.; Molnar, P. Rainfall seasonality and timing: Implications for cereal crop production in Ethiopia. Agric. For. Meteorol. 2021, 310, 108633. [Google Scholar] [CrossRef]
  76. Basha, M.B.; Mason, C.; Shamsudin, M.F.; Hussain, H.I.; Salem, M.A. Consumers Attitude Towards Organic Food. Procedia Econ. Financ. 2015, 31, 444–452. [Google Scholar] [CrossRef] [Green Version]
  77. Hughes, D.; Merton, I. “Partnership in produce”: The J Sainsbury approach to managing the fresh produce supply chain. Supply Chain Manag. Int. J. 1996, 1, 4–6. [Google Scholar] [CrossRef]
  78. Girgenti, V.; Massaglia, S.; Mosso, A.; Peano, C.; Brun, F. Exploring perceptions of raspberries and blueberries by Italian consumers. Sustainability 2016, 8, 1027. [Google Scholar] [CrossRef] [Green Version]
  79. Bosona, T.; Gebresenbet, G. Food traceability as an integral part of logistics management in food and agricultural supply chain. Food Control 2013, 33, 32–48. [Google Scholar] [CrossRef]
  80. Lu, Y.; Song, S.; Wang, R.; Liu, Z.; Meng, J.; Sweetman, A.J.; Jenkins, A.; Ferrier, R.C.; Li, H.; Luo, W.; et al. Impacts of soil and water pollution on food safety and health risks in China. Environ. Int. 2015, 77, 5–15. [Google Scholar] [CrossRef] [PubMed] [Green Version]
  81. Carzedda, M.; Gallenti, G.; Troiano, S.; Cosmina, M.; Marangon, F.; de Luca, P.; Pegan, G.; Nassivera, F. Consumer Preferences for Origin and Organic Attributes of Extra Virgin Olive Oil: A Choice Experiment in the Italian Market. Foods 2021, 10, 994. [Google Scholar] [CrossRef] [PubMed]
  82. Lambarraa-Lehnhardt, F.; Ihle, R.; Elyoubi, H. How successful is origin labeling in a developing country context? Moroccan consumers’ preferences toward local products. Sustainability 2021, 13, 8433. [Google Scholar] [CrossRef]
  83. Hua, H.-Y.; Zhang, Z. Application of Artificial Intelligence Technology in Short-Range Logistics Drones. In Proceedings of the 2019 8th International Symposium on Next Generation Electronics (ISNE), Zhengzhou, China, 9–10 October 2019; pp. 1–4. [Google Scholar]
  84. Suh, N.P.; Suh, N.P. Axiomatic design: Advances and Applications; Oxford University Press: New York, NY, USA, 2001; Volume 4. [Google Scholar]
  85. Suh, N.P.; Suh, P.N. The Principles of Design; Oxford University Press: New York, NY, USA, 1990. [Google Scholar]
  86. Lingrong, Z.; Jixiang, L.; Meng, W.; Guobing, L. Cloud-level information axiom based on information supplier selection method. Mod. Manag. 2017, 37, 65–67. [Google Scholar]
  87. Ming, L.; Lu, L.; Chuan-bo, L. Method for Knowledge Management System Selection Based on Improved Fuzzy Information Axiom. Ind. Eng. J. 2010, 13, 15–18. [Google Scholar]
  88. Erol, I.; Ferrell Jr, W.G. A methodology for selection problems with multiple, conflicting objectives and both qualitative and quantitative criteria. Int. J. Prod. Econ. 2003, 86, 187–199. [Google Scholar] [CrossRef]
  89. Young, D.; Pérez, P.; Cantú, M.; Garza, M. Fuzzy Characterization of Qualitative Variables for the Development of an Overall Efficiency Index of Competitiveness: Using a Modified Triangular Membership Function. Artif. Intell. Appl. -Hybrid Intell. Syst. 2009, 35–47. [Google Scholar]
  90. Jiang, Y.-P.; Fan, Z.-P.; Ma, J. A method for group decision making with multi-granularity linguistic assessment information. Inf. Sci. 2008, 178, 1098–1109. [Google Scholar] [CrossRef]
  91. Darfoun, M.A.; El-Hawary, M.E. Multi-objective Optimization Approach for Optimal Distributed Generation Sizing and Placement. Electr. Power Compon. Syst. 2015, 43, 828–836. [Google Scholar] [CrossRef]
  92. Chen, Y.-W.; Wang, C.-H.; Lin, S.-J. A multi-objective geographic information system for route selection of nuclear waste transport. Omega 2008, 36, 363–372. [Google Scholar] [CrossRef]
Figure 1. Description of the matching problem.
Sustainability 14 16937 g001
Figure 2. System range, design range, and common range based on information axiom.
Sustainability 14 16937 g002
Figure 3. Membership function image of an interval-type attribute.
Sustainability 14 16937 g003
Figure 4. Fuzzy system range comparison in membership function.
Sustainability 14 16937 g004
Figure 5. Membership function image of a benefit-type attribute.
Sustainability 14 16937 g005
Figure 6. Membership function image of a cost-type attribute.
Sustainability 14 16937 g006
Table 1. Matching Algorithms and Characteristics.
Matching MethodsSidesAttributesConditions
Two-SidesOthersQuantitativeQualitativeOne-ShotContinuous
Gale–Shapley Technique
Whirl Technique
Matching method based on “Fuzzy Set and Utility theory”
SMAA Technique
TODIM Technique
VIKOR Technique
Table 2. Notation in this study.
Variables SymbolDescription of Meaning
B Represents the set of consumers consisting of m consumers
B i B i   represents the i-th consumer
S Represents the set of suppliers consisting of s suppliers
S i S i   represents the j-th supplier
S r Represents   the   distribution   range   of   attributes   required   ( or   provided )   by   the   consumer   ( supplier ) ,   which   range   from   f 1   to   f 2
D r Represents   the   distribution   range   of   attributes   expected   by   the   supplier   and   consumer ,   which   range   from   d 1   to   d 2
C r Represents   the   common   range   between   D r   and   S r , D r S r
f ¯ The   formula   is   f 2 f 1 2     represents the intermediate value of system range
I k i j The   amount   of   demand - side   information   when   matching   the   i   demand - side   with   the   j   supply - side   in   the   k   attribute
I k j i The   amount   of   supply - side   information   when   matching   the   j   demand - side   with   the   i supply - side   in   the   k   attribute
Z 1 l The total amount of information of supply-side
Z 2 l The total amount of information of demand-side
X i j Represents whether i consumer is successfully matched with j supplier ,   if   yes ,   X i j = 1 ;   otherwise ,   X i j = 0
μ S x μ S x   denotes the supply’s membership functions
μ D x μ D x   denotes the demand’s membership functions
Table 3. Attributes structure of agricultural products.
Attribute CategoryAttributeDescriptionAttribute FormConsumer Attribute ClassificationSupplier Attribute ClassificationSource
General attributesPriceYuan/kgQuantitativeCost-type soft attributeBenefit-type soft attributeMauracheret al. [59]; Symmank [54];
Ennekinget al. [56].
BrandNo brand, common brand, regional brand, famous national brandQualitativeBenefit-type soft attributeAccording to the consumer’s situationCheung et al. [61];
Grunert [55];
Shethet al. [62].
Product gradePremium,
first-class,
regular, etc.
QualitativeBenefit-type soft attributeAccording to the consumer’s situationLlavataet al. [64];
Akdeniz et al. [65],
Packaging typeOrdinary packaging, gift packagingQualitativeHard attributeHard attributeDeng&Srinivasan [57]; Waheed et al. [58].
Logistics distanceKmQuantitativeCost-type soft attributeCost-type soft attributeChen et al. [66];
Galkiet al. [67];
Paciarotti & Torregiani [68].
Unique attributesFreshnessLive, fresh, relatively fresh, average, slightly spoiledQualitativeBenefit-type soft attributeAccording to the supplier’s situationMassagliaet al. [69]; Demattè et al. [70];
MaturityFully mature, nearly mature, not matureQuantitativeAs required by the consumerAccording to the supplier’s situationLiu et al. [71];
Meng et al. [72].
SeasonalitySeasonal products, off-season products, cold storage productsQualitativeHard attributeHard attributeKelley et al. [73];
Ardeshiriet al. [74]; Wakjira et al. [75]
CertificationNo certification, organic, green, pesticide-free QualifiedQualitativeBenefit-type soft attributeHard attributeGirgentet al. [78];
Bosona & Gebresenbe [79].
Securitytraceable, NontraceableQualitativeHard attributeHard attributeBasha et al. [76];
Hughes & Merton [77]
OriginOrigin, no originQualitativeHard attributeHard attributeLu et al. [80]; Carzedda et al. [81]; Lambarraa-Lehnhardt et al. [82].
Table 4. The calculation formula for the amount of information for all types of attributes.
Interval Type AttributesBenefit Type AttributesCost Type Attributes
I = f 2 d 1   or   f 1 d 2 log 2 e C r d 2 d 1 f 1 < d 1 < f 2   or   f 1 < d 2 < f 2 0 d 1 < f 1 < f 2 < d 2 I = f 2 d 1 log 2 e d 2 f ¯ d 2 d 1 f ¯ < d 2   and   f 2 > d 1 0 f ¯ d 2 I = f 1 d 2 log 2 e f ¯ d 1 d 2 d 1 f ¯ > d 1   and   f 1 < d 2 0 f ¯ d 1
Table 5. Information about each consumer requirement.
ConsumerBrandLogistics DistanceProduct GradePricePackaging TypeFreshnessMaturityCertificationSeasonalityOriginSecurity
A1regional brand and above(1,2)first class and above(2.5,3.2)gift packagingrelatively fresh and aboveharvest maturitypesticide-free and aboveno requestorigintraceable
A2no request(1,3)second class and above(2.0,2.8)ordinary packagingunlimitedno requestno requestseasonal productsno requestno request
A3common brand and above(1,4)second class and above(2.0,2.6)no requestaverage and aboveharvest maturityno requestseasonal productsorigintraceable
A4no request(1,3)third class and above(2.0,2.8)ordinary packagingno requestharvest maturitypollution-free and aboveno requestno requestno request
A5no request(1,4)third class and above(1.8,2.5)no requestno requestno requestno requestseasonal productsno requestno request
A6regional brand and above(1,3)third class and above(1.9,2.9)gift packagingfresh and aboveno requestgreen and aboveseasonal productsorigintraceable
Table 6. Information about each supplier’s product.
SupplierBrandLogistics DistanceProduct GradePricePackaging TypeFreshnessMaturityCertificationSeasonalityOriginSecurity
B1famous national brand1first class(2.75,3.35)gift packagingliveharvest maturitygreenseasonal productsorigintraceable
B2regional brand4first class(2.20,2.95)gift packagingfreshharvest maturitypollution-freeseasonal productsorigintraceable
B3common brand3third class(1.95,2.45)ordinary packagingaverageedible maturitypollution-freeseasonal productsno originnontraceable
B4famous national brand2Premium(2.55,3.25)gift packagingfreshharvest maturityorganicseasonal productsorigintraceable
B5common brand3second class(2.10,2.90)ordinary packagingrelatively freshedible maturitypollution-freeseasonal productsorigintraceable
B6no brand2third class(1.75,2.35)ordinary packagingaverageedible maturitynocertificationseasonal productsno originnontraceable
B7famous national brand1advanced(2.45,3.95)gift packagingliveharvest maturityorganicseasonal productsorigintraceable
B8regional brand2second class(2.15,2.95)ordinary packagingrelatively freshharvest maturitygreenseasonal productsorigintraceable
B9no brand2third class(1.90,2.45)ordinary packagingrelatively freshharvest maturitynocertificationseasonal productsoriginnontraceable
B10common brand1first class(2.15,2.65)ordinary packagingrelatively freshharvest maturitygreenseasonal productsorigintraceable
B11regional brand3second class(2.20,2.95)gift packagingliveharvest maturitypollution-freeseasonal productsorigintraceable
Table 7. Comparison of matching results of three matching models.
Matching ModelOptimal MatchingOptimal Match Degree
Consumer A 1 B 4 , A 2 B 10 , A 3 B 11 , A 4 B 8 , A 5 B 2 , A 6 B 1 0.837
Supplier B 1 A 5 , B 2 A 3 , B 3 A 4 , B 4 A 1 , B 5 A 6 , B 10 A 2 0.500
Supply–Demand A 1 B 4 , A 2 B 10 , A 3 B 11 , A 4 B 8 , A 5 B 2 , A 6 B 7 0.863
Table 8. The optimal matching degree and matching pairs under different (ti, tj) conditions.
First Set of DataSecond Set of Data
( t i , t j )Optimal MatchMatching Pairs ( t i , t j ) Optimal MatchMatching Pairs
(1,1.8)0.8636(0.9,2)0.8636
(1,1.6)0.8776(0.8,2)0.8636
(1,1.4)0.8776(0.7,2)0.8764
(1,1.2)0.8776(0.6,2)0.8753
(1,1)0.8776(0.5,2)0.9462
(1,0.8)0.9145(0.4,2)0.9462
(1,0.6)0.9774(0.3,2)0.9462
(1,0.4)0.9773(0.2,2)0.9462
(1,0.2)0.9773(0.1,2)0.9671
Publisher’s Note: MDPI stays neutral with regard to jurisdictional claims in published maps and institutional affiliations.

