


The Impacts of Climate Change, Carbon Dioxide Emissions (CO2) and Renewable Energy Consumption on Agricultural Economic Growth in South Africa: ARDL Approach

Abstract
1. Introduction
2. Theoretical Framework
3. Literature Review
3.1. Agricultural Economic Growth and Environmental Degradation
3.2. Agricultural Economic Growth and Renewable Energy Consumption
3.3. Agricultural Economic Growth and Climate Change
3.4. Data Period
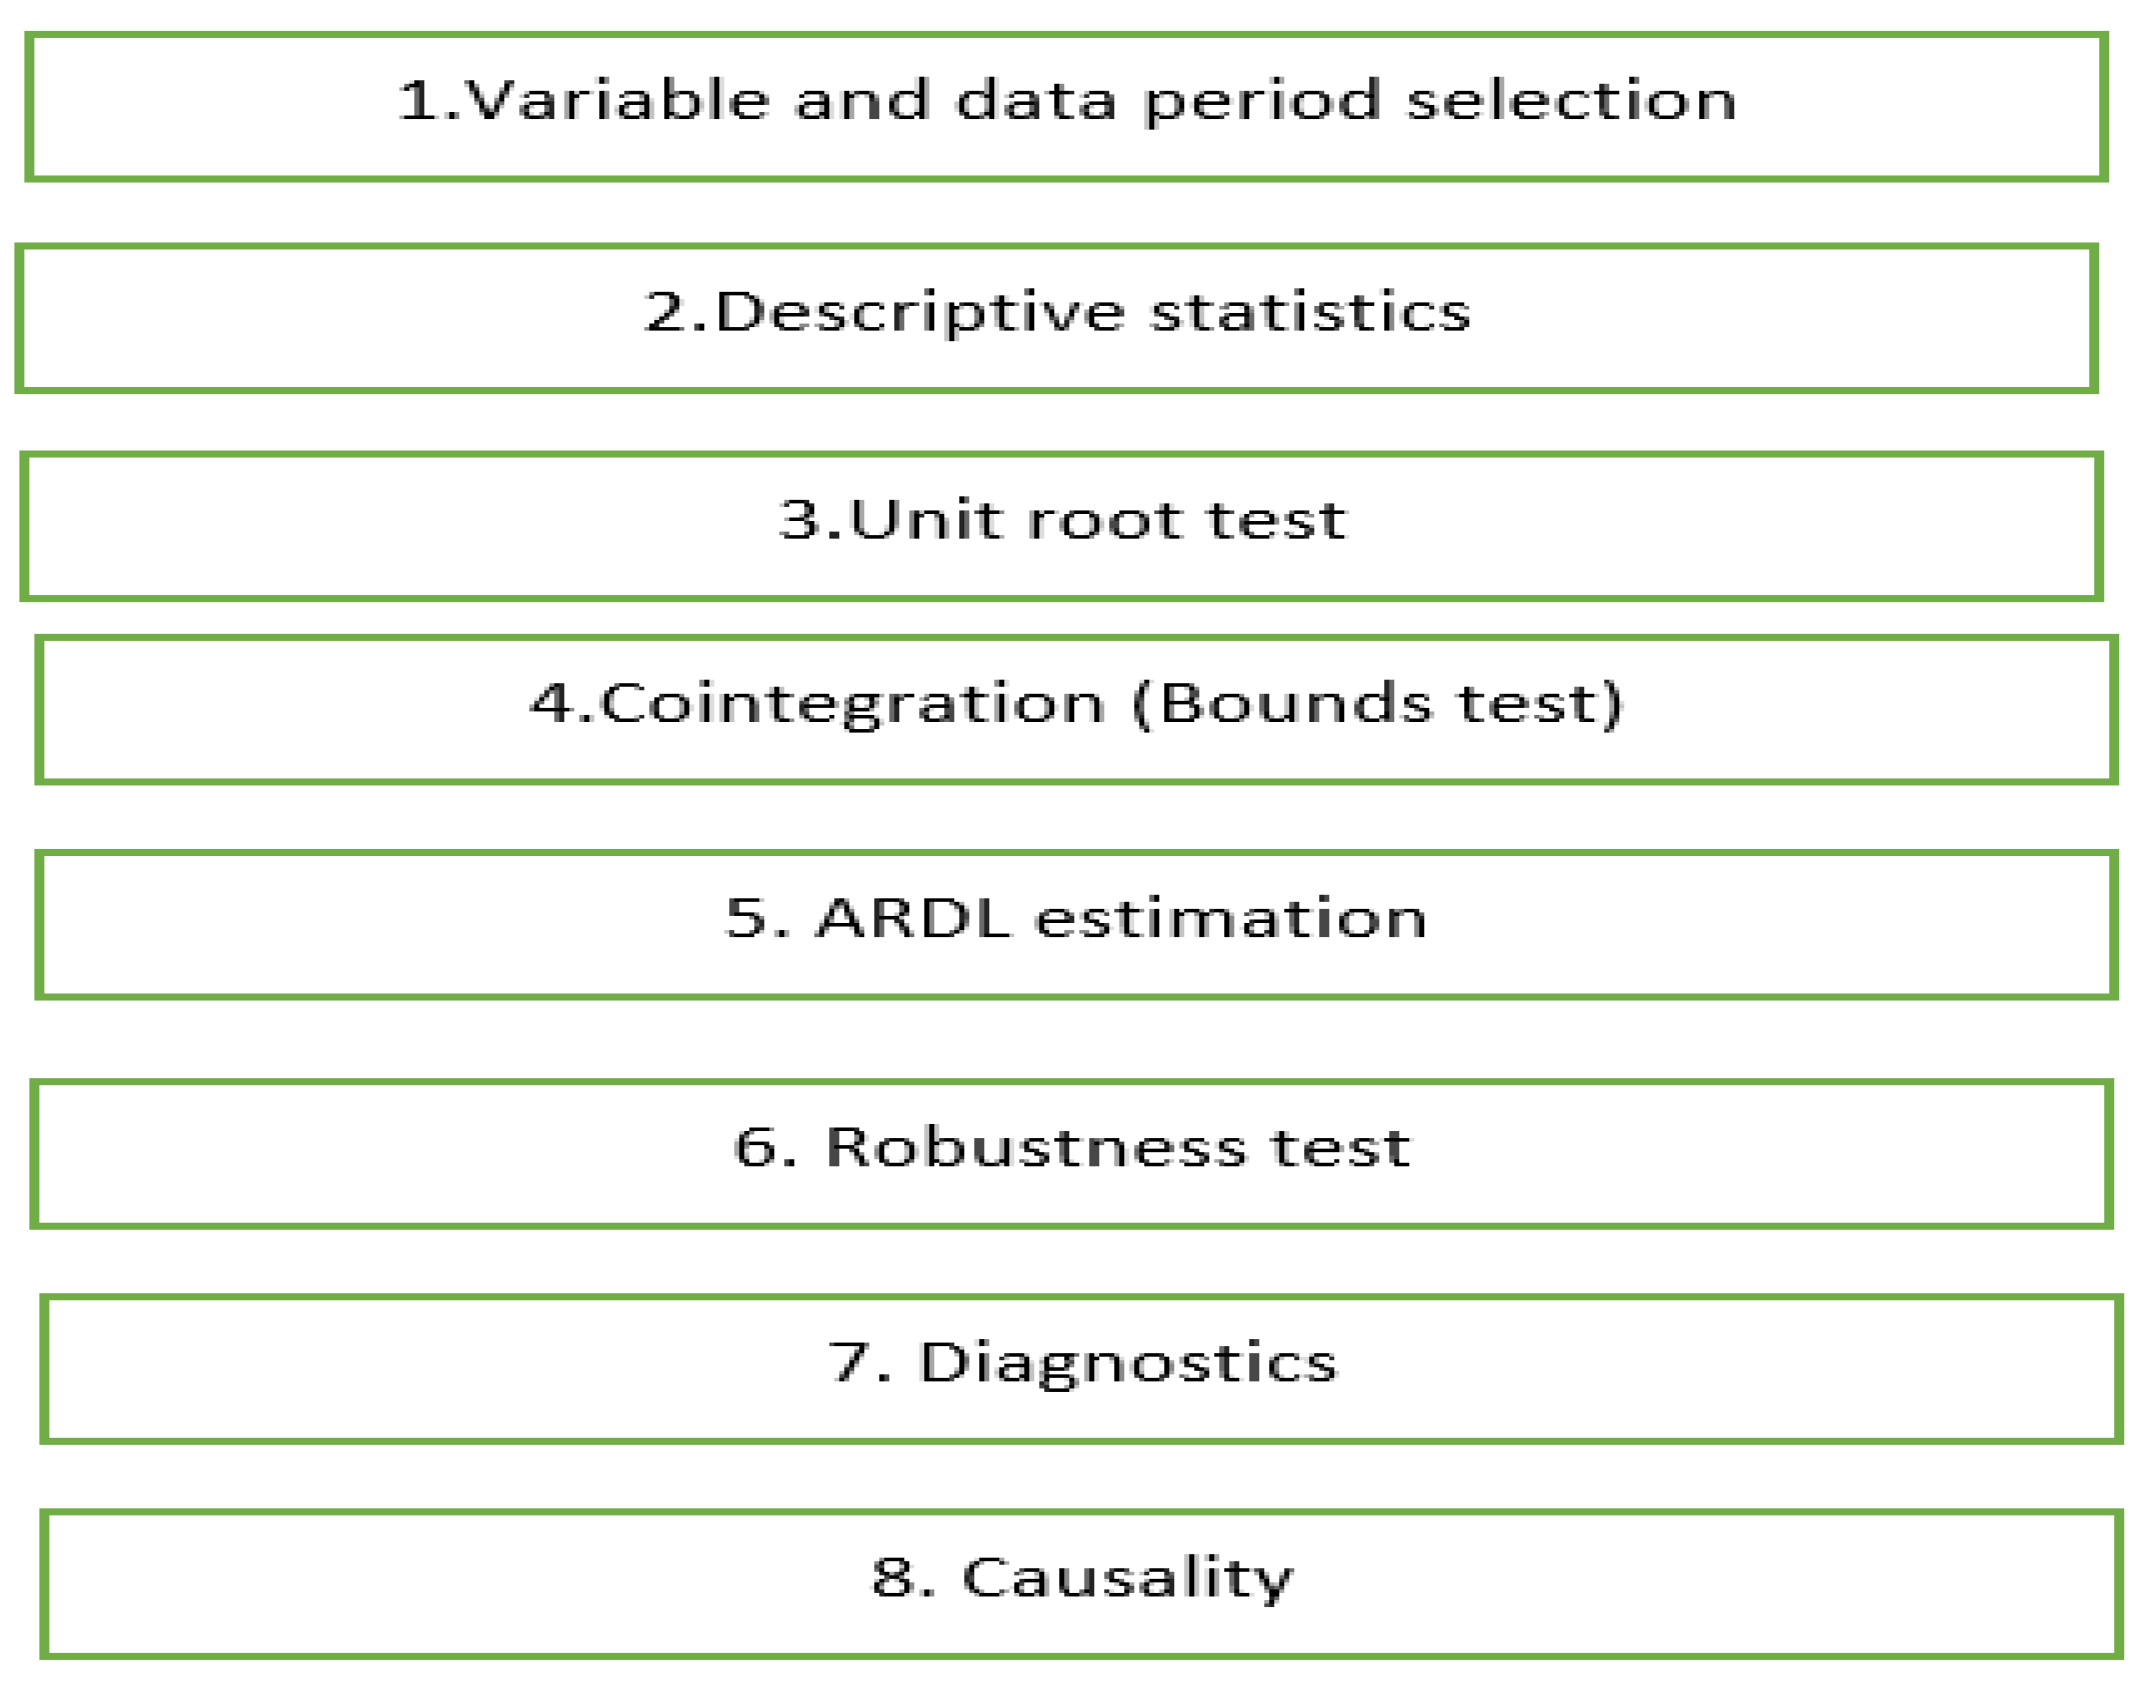
4. Methods
5. Results
5.1. Descriptive Statistics
5.2. Coefficient Correlation
5.3. Unit Root Test
5.4. Cointegration Test
5.5. Lag Selection
5.6. ARDL Error Correction and Long-Run Results
5.7. Diagonoistic Test
5.8. Model Robustness
6. Discussion
7. Conclusions and Policy Recommendations
Future Areas of Research
Funding
Institutional Review Board Statement
Informed Consent Statement
Data Availability Statement
Conflicts of Interest
References
- Arrhenius, S. XXXI. On the influence of carbonic acid in the air upon the temperature of the ground. Lond. Edinb. Dublin Philos. Mag. J. Sci. 1896, 41, 237–276. [Google Scholar] [CrossRef]
- Chamberlin, T.C. A Group of Hypotheses Bearing on Climatic Changes. J. Geol. 1897, 5, 653–683. [Google Scholar] [CrossRef]
- Van Huong, N.; Minh Nguyet, B.T.; Van Hung, H.; Minh Duc, H.; Van Chuong, N.; Do Tri, M.; Van Hien, D.; Van Hien, P. Economic impact of climate change on agriculture: A case of Vietnam. Ag. Bio. Forum 2022, 24, 1–12. [Google Scholar]
- Ashfaq, M.; Jan, I. Effects of Climate Change on Productivity of Maize Crop in Khyber Pakhtunkhwa. Sarhad J. Agric. 2019, 35, 925–932. [Google Scholar] [CrossRef]
- Ahsan, F.; Chandio, A.A.; Fang, W. Climate change impacts on cereal crops production in Pakistan: Evidence from cointegration analysis. Int. J. Clim. Chang. Strateg. Manag. 2020, 12, 257–269. [Google Scholar] [CrossRef]
- Abbas, S.; Mayo, Z.A. Impact of temperature and rainfall on rice production in Punjab, Pakistan. Environ. Dev. Sustain. 2021, 23, 1706–1728. [Google Scholar] [CrossRef]
- Chandio, A.A.; Jiang, Y.; Ahmad, F.; Adhikari, S.; Ain, Q.U. Assessing the impacts of climatic and technological factors on rice production: Empirical evidence from Nepal. Technol. Soc. 2021, 66, 101607. [Google Scholar] [CrossRef]
- Ait-El-Mokhtar, M.; Boutasknit, A.; Ben-Laouane, R.; Anli, M.; El Amerany, F.; Toubali, S.; Lahbouki, S.; Wahbi, S.; Med-dich, A. Vulnerability of Oasis Agriculture to Climate Change in Morocco. In Research Anthology on Environmental and Societal Impacts of Climate Change; IGI Global: Hershey, PA, USA, 2022; pp. 1195–1219. [Google Scholar]
- Baloch, Z.A.; Tan, Q.; Kamran, H.W.; Nawaz, M.A.; Albashar, G.; Hameed, J. A multi-perspective assessment approach of renewable energy production: Policy perspective analysis. Environ. Dev. Sustain. 2022, 24, 2164–2192. [Google Scholar] [CrossRef]
- Chandio, A.A.; Shah, M.I.; Sethi, N.; Mushtaq, Z. Assessing the effect of climate change and financial development on agricultural production in ASEAN-4: The role of renewable energy, institutional quality, and human capital as moderators. Environ. Sci. Pollut. Res. 2022, 29, 13211–13225. [Google Scholar] [CrossRef]
- Sadigov, R. Rapid Growth of the World Population and Its Socioeconomic Results. Sci. World J. 2022, 2022, 1–8. [Google Scholar] [CrossRef]
- Shafiee, S.; Topal, E. When will fossil fuel reserves be diminished? Energy Policy 2009, 37, 181–189. [Google Scholar] [CrossRef]
- World Bank. Open Data World Development Indicators, South Africa. 2022. Available online: https://databank.worldbank.org/data/reports.aspx?source=2&country (accessed on 5 October 2022).
- Department of Environmental Affairs (DEA). South Africa’s Third National Communication under the United Nations Framework Convention on Climate Change. 2018. Available online: https://unfccc.int/sites/default/files/resource/South%20African%20TNC%20Report%20%20to%20the%20UNFCCC_31%20Aug.pdf (accessed on 20 September 2022).
- Centre for Sustainability Transitions (CST), Stellenbosch University. Blended Finance Taskforce. 2021. Making Climate Capital work: Unlocking $8.5bn for South Africa’s Just Energy Transition. Available online: https://static1.squarespace.com/static/5acdc066c258b4bd2d15050b/t/628e373f28dafe216b114042/1653487452874/Making+Climate+Capital+Work+-+FINAL+REPORT.pdf (accessed on 7 November 2022).
- Tagwi, A.; Chipfupa, U. Participation of Smallholder Farmers in Modern Bioenergy Value Chains in Africa: Opportunities and Constraints. BioEnergy Res. 2022, 1–15. [Google Scholar] [CrossRef]
- Ayompe, L.M.; Davis, S.J.; Egoh, B.N. Trends and drivers of African fossil fuel CO2 emissions 1990–2017. Enviromental Res. Lett. 2021, 15, 124039. [Google Scholar] [CrossRef]
- OWID (Our Word in Data). 2022. Available online: https://ourworldindata.org/co2/country/south-africa?country=~ZAF (accessed on 12 September 2022).
- World Bank. Climate Risk Profile: South Africa (2021): The World Bank Group. 2021. Available online: https://climateknowledgeportal.worldbank.org/sites/default/files/country-profiles/15932-WB_South%20Africa%20Country%20Profile-WEB.pdf (accessed on 9 September 2022).
- University of Notre Dame. Notre Dame Global Adaptation Initiative. 2020. Available online: https://gain.nd.edu/our-work/country-index/ (accessed on 18 October 2022).
- Sebri, M. Use renewables to be cleaner: Meta-analysis of the renewable energy consumption–economic growth nexus. Renew. Sustain. Energy Rev. 2015, 42, 657–665. [Google Scholar] [CrossRef]
- Grossman, G.M.; Krueger, A.B. Environmental Impacts of a North American Free Trade Agreement; National Bureau of Economics Research Working Paper, No. 3194. NBER; National Bureau of Economics Research: Cambridge, UK, 1991. [Google Scholar] [CrossRef]
- Jahanger, A.; Usman, M.; Murshed, M.; Mahmood, H.; Balsalobre-Lorente, D. The linkages between natural resources, human capital, globalization, economic growth, financial development, and ecological footprint: The moderating role of technological innovations. Resour. Policy 2022, 76, 102569. [Google Scholar] [CrossRef]
- IEA, G.E. CO2 Status Report 2018; International Energy Agency: Paris, France, 2019; p. 562. [Google Scholar]
- Tenaw, D.; Beyene, A.D. Environmental sustainability and economic development in sub-Saharan Africa: A modified EKC hypothesis. Renew. Sustain. Energy Rev. 2021, 143, 110897. [Google Scholar] [CrossRef]
- Shahbaz, M.; Sinha, A. Environmental Kuznets curve for CO2 emissions: A literature survey. J. Econ. Stud. 2019, 46, 106–168. [Google Scholar] [CrossRef]
- Destek, M.A.; Sinha, A. Renewable, non-renewable energy consumption, economic growth, trade openness and ecological footprint: Evidence from organisation for economic Cooperation and development countries. J. Clean. Prod. 2020, 242, 118537. [Google Scholar] [CrossRef]
- Chen, Y.; Wang, Z.; Zhong, Z. CO2 emissions, economic growth, renewable and non-renewable energy production and foreign trade in China. Renew. Energy 2019, 131, 208–216. [Google Scholar] [CrossRef]
- Balsalobre-Lorente, D.; Driha, O.M.; Bekun, F.V.; Osundina, O.A. Do agricultural activities induce carbon emissions? The BRICS experience. Environ. Sci. Pollut. Res. 2019, 26, 25218–25234. [Google Scholar] [CrossRef]
- Pata, U.K. Linking renewable energy, globalization, agriculture, CO2 emissions and ecological footprint in BRIC countries: A sustainability perspective. Renew. Energy 2021, 173, 197–208. [Google Scholar] [CrossRef]
- Prastiyo, S.E.; Hardyastuti, S. How agriculture, manufacture, and urbanization induced carbon emission? The case of Indonesia. Environ. Sci. Pollut. Res. 2020, 27, 42092–42103. [Google Scholar] [CrossRef]
- Raihan, A.; Tuspekova, A. Dynamic impacts of economic growth, energy use, urbanization, agricultural productivity, and forested area on carbon emissions: New insights from Kazakhstan. World Dev. Sustain. 2022, 1, 100019. [Google Scholar] [CrossRef]
- Selcuk, M.; Gormus, S.; Guven, M. Do agriculture activities matter for environmental Kuznets curve in the Next Eleven countries? Environ. Sci. Pollut. Res. 2021, 28, 55623–55633. [Google Scholar] [CrossRef] [PubMed]
- Gurbuz, I.B.; Nesirov, E.; Ozkan, G. Does agricultural value-added induce environmental degradation? Evidence from Azerbaijan. Environ. Sci. Pollut. Res. 2021, 28, 23099–23112. [Google Scholar] [CrossRef] [PubMed]
- Raihan, A.; Muhtasim, D.A.; Farhana, S.; Hasan, A.U.; Pavel, M.I.; Faruk, O.; Rahman, M.; Mahmood, A. Nexus between economic growth, energy use, urbanization, agricultural productivity, and carbon dioxide emissions: New insights from Bangladesh. Energy Nexus 2022, 8, 100144. [Google Scholar] [CrossRef]
- Atasel, O.Y.; Guneysu, Y.; Pata, U.K. Testing the Agricultural Induced EKC Hypothesis: Fresh Empirical Evidence from the Top Ten Agricultural Countries. Agris-Line Pap. Econ. Inform. 2022, 14, 19–31. [Google Scholar] [CrossRef]
- Yurtkuran, S. The effect of agriculture, renewable energy production, and globalization on CO2 emissions in Turkey: A bootstrap ARDL approach. Renew. Energy 2021, 171, 1236–1245. [Google Scholar] [CrossRef]
- Eshete, Z.S.; Mulatu, D.W.; Gatiso, T.G. CO2 emissions, agricultural productivity and welfare in Ethiopia. Int. J. Clim. Change Strateg. Manag. 2020, 12, 687–704. [Google Scholar] [CrossRef]
- Emam, A. Present and future: Does agriculture affect economic growth and the environment in the Kingdom of Saudi Arabia? Agric. Econ. 2022, 68, 380–392. [Google Scholar] [CrossRef]
- Cetin, M.A.; Bakirtas, I.; Yildiz, N. Does agriculture-induced environmental Kuznets curve exist in developing countries? Environ. Sci. Pollut. Res. 2022, 29, 34019–34037. [Google Scholar] [CrossRef] [PubMed]
- Cai, Y.; Brock, W.; Xepapadeas, A. Climate Change Impact on Economic Growth: Regional Climate Policy under Cooperation and Noncooperation (No. 2214); Athens University of Economics and Business: Athens, Greece, 2022; Available online: https://ideas.repec.org/p/aue/wpaper/2214.html (accessed on 18 October 2022).
- Tan, D.; Adedoyin, F.F.; Alvarado, R.; Ramzan, M.; Kayesh, M.S.; Shah, M.I. The effects of environmental degradation on agriculture: Evidence from European countries. Gondwana Res. 2022, 106, 92–104. [Google Scholar] [CrossRef]
- Jebli, M.B.; Youssef, S.B. The role of renewable energy and agriculture in reducing CO2 emissions: Evidence for North Africa countries. Ecol. Indic. 2017, 74, 295–301. [Google Scholar] [CrossRef]
- Ben Jebli, M.; Ben Youssef, S. Renewable energy consumption and agriculture: Evidence for cointegration and Granger causality for Tunisian economy. Int. J. Sustain. Dev. World Ecol. 2017, 24, 149–158. [Google Scholar] [CrossRef]
- Zandi, G.; Haseeb, M. The Importance of Green Energy Consumption and Agriculture in Reducing Environmental Degradation: Evidence From Sub-Saharan African Countries. Int. J. Financial Res. 2019, 10, 215–227. [Google Scholar] [CrossRef]
- Nendissa, D.R.; Iriany, A.; Sui, J.M.; Khoiriya, N.; Suphattanakul, O.; Wisetsri, W. Role of Renewable and Nonrenewable Energy on Agricultural Economics in Indonesia. Int. J. Energy Econ. Policy 2022, 12, 352–360. [Google Scholar] [CrossRef]
- Naseem, S.; Guang, J.T. A system-GMM approach to examine the renewable energy consumption, agriculture and economic growth’s impact on CO2 emission in the SAARC region. GeoJournal 2021, 86, 2021–2033. [Google Scholar] [CrossRef]
- Sibanda, M.; Ndlela, H. The Link between Carbon Emissions, Agricultural Output and Industrial Output: Evidence from South Africa. J. Bus. Econ. Manag. 2020, 21, 301–316. [Google Scholar] [CrossRef]
- Dumrul, Y.; Kilicaslan, Z. Economic impacts of climate change on agriculture: Empirical evidence from ARDL approach for Turkey. J. Bus. Econ. Financ. 2017, 6, 336–347. [Google Scholar] [CrossRef]
- Akomolafe, K.J.; Awoyemi, O.B.; Babatunde, A. Climate Change and Its Effects on Agricultural Outputs in Nigeria. Asian J. Agric. Ext. Econ. Sociol. 2018, 25, 1–11. [Google Scholar] [CrossRef][Green Version]
- Imran, A.; Javed, Z.H.; Shabbir, M.; Waseem, L.; Naqvi, A.A. Climate Changes and its Impact on the Agriculture Sector in Selected South Asian Countries. Int. J. Econ. Environ. Geol. 2019, 10, 97–101. [Google Scholar]
- Vatankhah, T.; Moosavi, S.N.; Tabatabaei, S.M. The economic impacts of climate change on agriculture in Iran: A CGE model analysis. Energy Sources Part A: Recover. Util. Environ. Eff. 2020, 42, 1935–1949. [Google Scholar] [CrossRef]
- Talib, M.; Ahmed, M.; Naseer, M.; Slusarczyk, B.; Popp, J. The Long-Run Impacts of Temperature and Rainfall on Agricultural Growth in Sub-Saharan Africa. Sustainability 2021, 13, 595. [Google Scholar] [CrossRef]
- El-Khalifa, Z.S.; Zahran, H.F.; Ayoub, A. Climate Change Factors’ Impact on the Egyptian Agricultural Sector. Asian J. Agric. Rural Dev. 2022, 12, 192–200. [Google Scholar] [CrossRef]
- Rit, B. Impact of Climate Change on Agriculture: Empirical Evidence from South Asian Countries; Springer: Singapore, 2022; pp. 83–106. [Google Scholar] [CrossRef]
- Mammo, B. Climate Change and its Impact on Agricultural GDP Growth in Ethiopia: A Time Series Analysis. Int. J. Acad. Res. Econ. Manag. Sci. 2022, 11, 307–322. [Google Scholar] [CrossRef] [PubMed]
- Alehile, K.S.; Njiforti, P.P.; Duru, M.C.; Jibril, M.S. Impact of climate change on Nigerian agricultural sector crop production. J. Econ. Allied Res. 2022, 7, 105–115. [Google Scholar]
- Alsultan, N.A.; Dar, A.A. Climate Extreme and Agriculture Development: Fresh Insight From Top Agri-Economics. Export. Prod. Qual. Renew. Energy Sustain. Prod. 2022, 9, 807681. [Google Scholar] [CrossRef]
- Zia, B.; Rafiq, M.; Saqib, S.E.; Atiq, M. Agricultural Market Competitiveness in the Context of Climate Change: A Systematic Review. Sustainability 2022, 14, 3721. [Google Scholar] [CrossRef]
- Rahman, M.; Nguyen, R.; Lu, L. Multi-level impacts of climate change and supply disruption events on a potato supply chain: An agent-based modeling approach. Agric. Syst. 2022, 201, 103469. [Google Scholar] [CrossRef]
- Priya, M.; Sharma, L.; Kaur, R.; Bindumadhava, H.; Nair, R.M.; Siddique, K.H.M.; Nayyar, H. GABA (γ-aminobutyric acid), as a thermo-protectant, to improve the reproductive function of heat-stressed mungbean plants. Sci. Rep. 2019, 9, 7788. [Google Scholar] [CrossRef]
- Kurukulasuriya, P.; Rosenthal, S. Climate Change and Agriculture: A Review of Impacts and Adaptations; World Bank: Washington, DC, USA, 2013. [Google Scholar]
- Kunimitsu, Y.; Sakurai, G.; Iizumi, T. Systemic Risk in Global Agricultural Markets and Trade Liberalization under Climate Change: Synchronized Crop-Yield Change and Agricultural Price Volatility. Sustainability 2020, 12, 10680. [Google Scholar] [CrossRef]
- Davis, K.F.; Downs, S.; Gephart, J.A. Towards food supply chain resilience to environmental shocks. Nat. Food 2021, 2, 54–65. [Google Scholar] [CrossRef]
- Stevanović, M.; Popp, A.; Lotze-Campen, H.; Dietrich, J.P.; Müller, C.; Bonsch, M.; Schmitz, C.; Bodirsky, B.L.; Humpenöder, F.; Weindl, I. The impact of high-end climate change on agricultural welfare. Sci. Adv. 2016, 2, e1501452. [Google Scholar] [CrossRef] [PubMed]
- Nowak, A.; Kasztelan, A. Economic competitiveness vs. green competitiveness of agriculture in the European Union countries. Oeconomia Copernic. 2022, 13, 379–405. [Google Scholar] [CrossRef]
- UN Climate Change. Impacts, Adaptation and Vulnerability. Contribution of Working Group II to the Sixth Assessment Report of the Intergovernmental Panel on Climate Change; Cambridge University Press: Cambridge, UK; New York, NY, USA, 2022; Available online: https://www.ipcc.ch/report/ar6/wg2/downloads/report/IPCC_AR6_WGII_TechnicalSummary.pdf (accessed on 8 November 2022).
- Philippon, N.; Rouault, M.; Richard, Y.; Favre, A. The influence of ENSO on winter rainfall in South Africa. Int. J. Clim. 2012, 32, 2333–2347. [Google Scholar] [CrossRef]
- Lindesay, J.A. South African rainfall, the Southern Oscillation and a Southern Hemisphere semi-annual cycle. J. Clim. 1988, 8, 17–30. [Google Scholar] [CrossRef]
- Mason, S.J. Climatic change over the Lowveld of South Africa. Clim. Chang. 1996, 32, 35–54. [Google Scholar] [CrossRef]
- Jury, M.R.; Pathack, B.; Wang, B.; Powell, M.; Raholijao, N. A Destructive Tropical Cyclone Season in the Sw Indian Ocean: January-February 1984. South Afr. Geogr. J. 1993, 75, 53–59. [Google Scholar] [CrossRef]
- Moeletsi, M.E.; Walker, S.; Landman, W.A. ENSO and implications on rainfall characteristics with reference to maize production in the Free State Province of South Africa. Phys. Chem. Earth Parts A/B/C 2011, 36, 715–726. [Google Scholar] [CrossRef]
- Desalegn, C.; Edossa, Y.E.; Woyessa, W.; Welderufael, A. Analysis of Droughts in the Central Region of South Africa and Their Association with SST Anomalies. Int. J. Atmos. Sci. 2014, 2014, 508953. [Google Scholar] [CrossRef]
- Kulionis, V. The Relationship between Renewable Energy Consumption, CO2 Emissions and Economic Growth in Denmark. Master’s Dissertation, Lund University, Lund, Sweden, 2013. [Google Scholar]
- Popp, D.; Hascic, I.; Medhi, N. Technology and the diffusion of renewable energy. Energy Econ. 2011, 33, 648–662. [Google Scholar] [CrossRef]
- Kumar, R. The United Nations and Global Environmental Governance. Strat. Anal. 2020, 44, 479–489. [Google Scholar] [CrossRef]
- Paglia, E. The Swedish initiative and the 1972 Stockholm Conference: The decisive role of science diplomacy in the emergence of global environmental governance. Humanit. Soc. Sci. Commun. 2021, 8, 2. [Google Scholar] [CrossRef]
- Seyfang, G. Environmental mega-conferences—From Stockholm to Johannesburg and beyond. Glob. Environ. Chang. 2003, 13, 223–228. [Google Scholar] [CrossRef]
- Qi, X. The rise of BASIC in UN climate change negotiations. South Afr. J. Int. Aff. 2011, 18, 295–318. [Google Scholar] [CrossRef]
- Bayulken, B.; Huisingh, D. A literature review of historical trends and emerging theoretical approaches for devel-oping sustainable cities (part 1). J. Clean. Prod. 2015, 109, 11–24. [Google Scholar] [CrossRef]
- Osborn, D.; Bigg, T. Earth summit II: Outcomes and Analysis; Routledge: London, UK, 2013. [Google Scholar] [CrossRef]
- Quental, N.; Lourenço, J.M.; da Silva, F.N. Sustainable development policy: Goals, targets and political cycles. Sustain. Dev. 2011, 19, 15–29. [Google Scholar] [CrossRef]
- Wapner, P. World Summit on Sustainable Development: Toward a Post-Jo’burg Environmentalism. Glob. Environ. Politi 2003, 3, 1–10. [Google Scholar] [CrossRef]
- Pesaran, M.H.; Shin, Y.; Smith, R.J. Bounds testing approaches to the analysis of level relationships. J. Appl. Econom. 2001, 16, 289–326. [Google Scholar] [CrossRef]
- Begum, M.; Masud, M.M.; Alam, L.; Bin Mokhtar, M.; Amir, A.A. The impact of climate variables on marine fish production: An empirical evidence from Bangladesh based on autoregressive distributed lag (ARDL) approach. Environ. Sci. Pollut. Res. 2022, 29, 87923–87937. [Google Scholar] [CrossRef]
- Warsame, A.A.; Sheik-Ali, I.A.; Ali, A.O.; Sarkodie, S.A. Climate change and crop production nexus in Somalia: An empirical evidence from ARDL technique. Environ. Sci. Pollut. Res. 2021, 28, 19838–19850. [Google Scholar] [CrossRef] [PubMed]
- Emenekwe, C.C.; Onyeneke, R.U.; Nwajiuba, C.U. Assessing the combined effects of temperature, precipitation, total ecological footprint, and carbon footprint on rice production in Nigeria: A dynamic ARDL simulations approach. Environ. Sci. Pollut. Res. 2022, 29, 85005–85025. [Google Scholar] [CrossRef]
- Asfew, M.; Bedemo, A. Impact of Climate Change on Cereal Crops Production in Ethiopia. Adv. Agric. 2022, 2022, 1–8. [Google Scholar] [CrossRef]
- Abbas, S.; Kousar, S.; Shirazi, S.A.; Yaseen, M.; Latif, Y. Illuminating Empirical Evidence of Climate Change: Impacts on Rice Production in the Punjab Regions, Pakistan. Agric. Res. 2022, 11, 32–47. [Google Scholar] [CrossRef]
- Ceesay, E.K.; Fanneh, M.M. Economic growth, climate change, and agriculture sector: ARDL bounds testing ap-proach for Bangladesh (1971–2020). Econ. Manag. Sustain. 2022, 7, 95–106. [Google Scholar]
- He, W.; Chen, W.; Chandio, A.A.; Zhang, B.; Jiang, Y. Does Agricultural Credit Mitigate the Effect of Climate Change on Cereal Production? Evidence from Sichuan Province, China. Atmosphere 2022, 13, 336. [Google Scholar] [CrossRef]
- Warsame, A.A.; Sheik-Ali, I.A.; Barre, G.M.; Ahmed, A. Examining the effects of climate change and political in-stability on maize production in Somalia. Environ. Sci. Pollut. Res. 2022, 1–14. [Google Scholar]
- Nelson, C.R.; Plosser, C.R. Trends and random walks in macroeconmic time series: Some evidence and implications. J. Monetary Econ. 1982, 10, 139–162. [Google Scholar] [CrossRef]
- Khan, N.U.; Alim, W.; Begum, A.; Han, H.; Mohamed, A. Examining Factors That Influence the International Tourism in Pakistan and Its Nexus with Economic Growth: Evidence from ARDL Approach. Sustainability 2022, 14, 9763. [Google Scholar] [CrossRef]
- Jordan, S.; Philips, A.Q. Cointegration testing and dynamic simulations of autoregressive distributed lag models. Stata J. 2018, 18, 902–923. [Google Scholar] [CrossRef]
- Zivot, E.; Andrews, D.W.K. Further evidence on the great crash, the oil-price shock, and the unit-root hypothesis. J. Bus. Econ. Stat. 2002, 20, 25–44. [Google Scholar] [CrossRef]
- Dickey, D.A.; Fuller, W.A. Distribution of the estimators for autoregressive time series with a unit root. J. Am. Stat. Assoc. 1979, 74, 427–431. [Google Scholar]
- Phillips, P.C.; Perron, P. Testing for a unit root in time series regression. Biometrika 1988, 75, 335–346. [Google Scholar] [CrossRef]
- Engle, R.F.; Granger, C.W. Co-integration and error correction: Representation, estimation, and testing. Econom. J. Econom. Soc. 1987, 251–276. [Google Scholar] [CrossRef]
- Johansen, S. Statistical analysis of cointegration vectors. J. Econ. Dyn. Control. 1988, 12, 231–254. [Google Scholar] [CrossRef]
- Johansen, S.; Juselius, K. Maximum likelihood estimation and inference on cointegration—with appucations to the demand for money. Oxf. Bull. Econ. Stat. 1990, 52, 169–210. [Google Scholar] [CrossRef]
- Fritz, M.; Koch, M. Economic development and prosperity patterns around the world: Structural challenges for a global steady-state economy. Glob. Environ. Chang. 2016, 38, 41–48. [Google Scholar] [CrossRef]
- Khobai, H.B.; Le Roux, P. The relationship between energy consumption, economic growth and carbon dioxide emission: The case of South Africa. Int. J. Energy Econ. Policy 2017, 7, 102–109. [Google Scholar]
- Shikwambana, L.; Mhangara, P.; Kganyago, M. Assessing the Relationship between Economic Growth and Emissions Levels in South Africa between 1994 and 2019. Sustainability 2021, 13, 2645. [Google Scholar] [CrossRef]
- Nkengfack, H.; Fotio, H.K.; Djoudji, S.T. The Effect of Economic Growth on Carbon Dioxide Emissions in Sub-Saharan Africa: Decomposition into Scale, Composition and Technique Effects. Mod. Econ. 2019, 10, 1398–1418. [Google Scholar] [CrossRef]
- Boukhelkhal, A. Energy use, economic growth and CO2 emissions in Africa: Does the environmental Kuznets curve hypothesis exist? New evidence from heterogeneous panel under cross-sectional dependence. Environ. Dev. Sustain. 2022, 24, 13083–13110. [Google Scholar] [CrossRef]
- Alaganthiran, J.R.; Anaba, M.I. The effects of economic growth on carbon dioxide emissions in selected Sub-Saharan African (SSA) countries. Heliyon 2022, 8, e11193. [Google Scholar] [CrossRef] [PubMed]
- Shahbaz, M.; Khan, S.; Ali, A.; Bhattacharya, M. The Impact of Globalization on CO2 Emissions in China. Singap. Econ. Rev. 2017, 62, 929–957. [Google Scholar] [CrossRef]
- Mardani, A.; Streimikiene, D.; Cavallaro, F.; Loganathan, N.; Khoshnoudi, M. Carbon dioxide (CO2) emissions and economic growth: A systematic review of two decades of research from 1995 to 2017. Sci. Total. Environ. 2019, 649, 31–49. [Google Scholar] [CrossRef]
- Khan, M.B.; Saleem, H.; Shabbir, M.S.; Huobao, X. The effects of globalization, energy consumption and economic growth on carbon dioxide emissions in South Asian countries. Energy Environ. 2022, 33, 107–134. [Google Scholar] [CrossRef]
- Leitão, J.; Ferreira, J.; Santibanez-González, E. New insights into decoupling economic growth, technological progress and carbon dioxide emissions: Evidence from 40 countries. Technol. Forecast. Soc. Chang. 2022, 174, 121250. [Google Scholar] [CrossRef]
- Raihan, A.; Tuspekova, A. Nexus between economic growth, energy use, agricultural productivity, and carbon dioxide emissions: New evidence from Nepal. Energy Nexus 2022, 7, 100113. [Google Scholar] [CrossRef]
- Wen, J.; Mughal, N.; Zhao, J.; Shabbir, M.S.; Niedbała, G.; Jain, V.; Anwar, A. Does globalization matter for environmental degradation? Nexus among energy consumption, economic growth, and carbon dioxide emission. Energy Policy 2021, 153, 112230. [Google Scholar] [CrossRef]
- Ali, M.U.; Gong, Z.; Ali, M.U.; Wu, X.; Yao, C. Fossil energy consumption, economic development, inward FDI impact on CO2 emissions in Pakistan: Testing EKC hypothesis through ARDL model. Int. J. Financ. Econ. 2021, 26, 3210–3221. [Google Scholar] [CrossRef]
- Sadiq, M.; Kannaiah, D.; Khan, G.Y.; Shabbir, M.S.; Bilal, K.; Zamir, A. Does sustainable environmental agenda matter? The role of globalization toward energy consumption, economic growth, and carbon dioxide emissions in South Asian countries. Environ. Dev. Sustain. 2022, 1–20. [Google Scholar] [CrossRef]
- Cao, H.; Khan, M.K.; Rehman, A.; Dagar, V.; Oryani, B.; Tanveer, A. Impact of globalization, institutional quality, economic growth, electricity and renewable energy consumption on Carbon Dioxide Emission in OECD countries. Environ. Sci. Pollut. Res. 2022, 29, 24191–24202. [Google Scholar] [CrossRef]
- Abbasi, K.R.; Kirikkaleli, D.; Altuntaş, M. Carbon dioxide intensity of GDP and environmental degradation in an emerging country. Environ. Sci. Pollut. Res. 2022, 29, 84451–84459. [Google Scholar] [CrossRef]
- Hamid, I.; Alam, S.; Murshed, M.; Jena, P.K.; Sha, N.; Alam, M.N. The roles of foreign direct investments, economic growth, and capital investments in decarbonizing the economy of Oman. Environ. Sci. Pollut. Res. 2022, 29, 22122–22138. [Google Scholar] [CrossRef]
- Murshed, M.; Rashid, S.; Ulucak, R.; Dagar, V.; Rehman, A.; Alvarado, R.; Nathaniel, S.P. Mitigating energy production-based carbon dioxide emissions in Argentina: The roles of renewable energy and economic globalization. Environ. Sci. Pollut. Res. 2022, 29, 16939–16958. [Google Scholar] [CrossRef] [PubMed]
- Alao, R.O.; Payaslioglu, C.; Alhassan, A.; Alola, A.A. Accounting for carbon dioxide emission effect of energy use, economic growth, and urbanization in the OPEC member states. Int. Soc. Sci. J. 2022, 72, 129–143. [Google Scholar] [CrossRef]
- Rehman, A.; Ma, H.; Ozturk, I.; Radulescu, M. Revealing the dynamic effects of fossil fuel energy, nuclear energy, renewable energy, and carbon emissions on Pakistan’s economic growth. Environ. Sci. Pollut. Res. 2022, 29, 48784–48794. [Google Scholar] [CrossRef] [PubMed]
- Yu-Ke, C.; Awan, R.U.; Aziz, B.; Ahmad, I.; Waseem, S. The relationship between energy consumption, natural resources, and carbon dioxide emission volatility: Empirics from G-20 economies. Environ. Sci. Pollut. Res. 2022, 29, 25408–25416. [Google Scholar] [CrossRef]
- Shokoohi, Z.; Dehbidi, N.K.; Tarazkar, M.H. Energy intensity, economic growth and environmental quality in populous Middle East countries. Energy 2022, 239, 122164. [Google Scholar] [CrossRef]
- Bhuiyan, M.A.; Kahouli, B.; Hamaguchi, Y.; Zhang, Q. The role of green energy deployment and economic growth in carbon dioxide emissions: Evidence from the Chinese economy. Environ. Sci. Pollut. Res. 2022, 1–12. [Google Scholar] [CrossRef]
- Jatuporn, C.; Takeuchi, K. Assessing the impact of climate change on the agricultural economy in Thailand: An empirical study using panel data analysis. Environ. Sci. Pollut. Res. 2022, 1–10. [Google Scholar] [CrossRef]
- Kiani, A.; Iqbal, T. Climate Change Impact on Wheat Yield in Pakistan (An Application of ARDL Approach). NUST J. Soc. Sci. Humanit. 2018, 4, 240–262. [Google Scholar] [CrossRef]
- Xiang, X.; Solaymani, S. Change in cereal production caused by climate change in Malaysia. Ecol. Inform. 2022, 70, 101741. [Google Scholar] [CrossRef]
- Janjua, P.Z.; Samad, G.; Khan, N. Climate Change and Wheat Production in Pakistan: An Autoregressive Distributed Lag Approach. NJAS-Wagening. J. Life Sci. 2014, 68, 13–19. [Google Scholar] [CrossRef]
- Chandio, A.A.; Magsi, H.; Ozturk, I. Examining the effects of climate change on rice production: Case study of Pakistan. Environ. Sci. Pollut. Res. 2020, 27, 7812–7822. [Google Scholar] [CrossRef]
- Gul, A.; Xiumin, W.; Chandio, A.A.; Rehman, A.; Siyal, S.A.; Asare, I. Tracking the effect of climatic and non-climatic elements on rice production in Pakistan using the ARDL approach. Environ. Sci. Pollut. Res. 2022, 29, 31886–31900. [Google Scholar] [CrossRef]
- Jena, P.K. Nexus between Climate Change and Agricultural Production in Odisha, India: An ARDL Approach. Int. J. Environ. Agric. Biotechnol. 2021, 6, 136–144. [Google Scholar] [CrossRef]
- Rashid, M.; Husnain, Z.; Shakoor, U.; Husnain, M.I.U. Impact of Climate Change on Cotton Production in Pakistan: An ARDL Bound Testing Approach. Sarhad J. Agric. 2020, 36, 333–341. [Google Scholar] [CrossRef]
- Maino, M.R.; Emrullahu, D. Climate Change in Sub-Saharan Africa Fragile States: Evidence from Panel Estimations (No. 2022/054); International Monetary Fund: Washington, DC, USA, 2022. [Google Scholar]
- Brini, R. Renewable and non-renewable electricity consumption, economic growth and climate change: Evidence from a panel of selected African countries. Energy 2021, 223, 120064. [Google Scholar] [CrossRef]
- Acaroğlu, H.; Güllü, M. Climate change caused by renewable and non-renewable energy consumption and economic growth: A time series ARDL analysis for Turkey. Renew. Energy 2022, 193, 434–447. [Google Scholar] [CrossRef]


| Year | Host | Commitment | Source |
|---|---|---|---|
| 1945 | San Francisco | United Nations (UN)-focus on peace, security, human rights, and development-2nd world war aftermath. | [76] |
| 1972 | Stockholm | United Nations Conference on the Human Environment (UNCHE)-global efforts on climate change action began | [77] |
| 1982 | Nairobi | UN Environment Programme (UNEP)-Stockholm follow up | [78] |
| 1985 | Vienna | Convention for the Protection of the Ozone Layer | [79] |
| 1989 | Montreal | The Montreal Protocol-fund establishment for agricultural and manufactured goods substances depleting the ozone in developing country. | [79] |
| 1992 | Rio de Janeiro | United Nations Conference on Environment and Development (UNCED)/Earth Summit-Sustainable development concept brought in, and Agenda 21 action plan created. | [80] |
| 1994 | Rio de Janeiro | United Nations Climate Change Framework Convention (UNFCCC)-focused on mitigation of carbon emissions. The decision-making body of UNFCCC is the Conference of Parties (COP). | [67] |
| 1995 | Berlin | The first conference of Parties (COP1) was held | [67] |
| 1997 | New York | United Nations General Assembly Special Session (UNGASS) on Sustainable Development/Earth Summit II-Agenda 21 5-year review progress. | [81] |
| 1997 | Kyoto | Kyoto Protocol | [82] |
| 2002 | Johannesburg | United Nations World Summit on Sustainable Development (WSSD)-feedback on Rio de Janeiro convention progress/Political Declaration-corporate accountability and responsibility introduced. | [83] |
| 2015 | Paris | 2015 Paris Agreement was negotiated at COP21 in Paris: works on 5-year cycle based long-term low greenhouse gas emission development strategies (LT-LEDS) which talks to the nationally determined contributions (NDCs) outlining CO2 emissions targets. starting in 2024 country reporting on progress will be done under an enhanced transparency framework (ETF). | [67] |
| Authors | Country | Period | Variables | Outcomes | Technique |
|---|---|---|---|---|---|
| [88] | Somalia | 1985–2016 |
|
|
|
| [86] | Bangladesh | 1961–2019 |
|
|
|
| [87] | Nigeria | 1971–2018 |
|
|
|
| [88] | Ethiopia | 1990–2020 |
|
|
|
| [54] | Egypt | 1990–2020 |
|
|
|
| [89] | Pakistan | 1979–2018 |
|
|
|
| [90] | Gambia | 1971–2020 |
|
|
|
| [3] | Vietnam | 1990–2020 |
|
|
|
| [91] | China | 1978–2018 |
|
|
|
| [92] | Somalia | 1980–2018 |
|
|
|
| Variable | Description | Data Source |
|---|---|---|
| LAGR_GDP | Agriculture value added, a share of GDP (2015 constant US$) | WDI |
| LCO2 | CO2 Emissions from Energy (Mt) | BP |
| LRENC | Renewable energy consumption (TWh) | BP |
| LTEMP | Mean annual temperature (°C) | CCKP |
| LPREC | Annual precipitation (mm) | CCKP |
| LNAGR_GDP | LNCO2 | LNPREC | LNTEMP | LNRENC | |
|---|---|---|---|---|---|
| Mean | 22.383 | 5.796 | 6.161 | 2.890 | 3.151 |
| Median | 22.373 | 5.879 | 6.149 | 2.894 | 3.643 |
| Maximum | 23.037 | 6.165 | 6.531 | 2.959 | 4.788 |
| Minimum | 21.793 | 4.982 | 5.765 | 2.828 | 0.565 |
| Std. Dev. | 0.303 | 0.350 | 0.160 | 0.028 | 1.171 |
| Skewness | 0.199 | −0.889 | 0.184 | −0.012 | −0.815 |
| Kurtosis | 2.336 | 2.655 | 2.867 | 2.765 | 2.456 |
| Jarque-Bera | 1.248 | 6.837 | 0.319 | 0.117 | 6.150 |
| Probability | 0.536 | 0.033 | 0.853 | 0.943 | 0.046 |
| Sum | 1119.129 | 289.818 | 308.048 | 144.505 | 157.539 |
| Sum Sq. Dev. | 4.510 | 6.003 | 1.247 | 0.039 | 67.229 |
| LNAGR_GDP | LNCO2 | LNPREC | LNTEMP | LNRENC | |
|---|---|---|---|---|---|
| LNAGR_GDP | 1.000 | 0.848 | −0.228 | 0.637 | 0.860 |
| LNCO2 | 0.848 | 1.000 | −0.328 | 0.726 | 0.900 |
| LNPREC | −0.228 | −0.328 | 1.000 | −0.634 | −0.216 |
| LNTEMP | 0.637 | 0.726 | −0.634 | 1.000 | 0.631 |
| LNRENC | 0.860 | 0.900 | −0.216 | 0.631 | 1.000 |
| Series | Model | ADF | ADF-P | PP | PP-P |
|---|---|---|---|---|---|
| At Level-I(0) | τμ ττ τ | Value | τμ ττ τ | Value | |
| LNAGR_GDP | Intercept (tm) | 1.680 | 0.999 | −0.552 | 0.872 |
| Intercept & Trend (tt) | −4.723 | 0.002 | −4.760 | 0.002 | |
| None (t) | 2.622 | 0.997 | 2.704 | 0.998 | |
| LNCO2 | Intercept (tm) | −3.184 | 0.027 | −3.674 | 0.008 |
| Intercept & Trend (tt) | −0.967 | 0.939 | −1.128 | 0.914 | |
| None (t) | 3.376 | 1.000 | 2.799 | 0.998 | |
| LNPREC | Intercept (tm) | −5.356 | 0.000 | −5.326 | 0.000 |
| Intercept & Trend (tt) | −5.775 | 0.000 | −5.764 | 0.000 | |
| None (t) | −0.010 | 0.674 | 0.360 | 0.785 | |
| LNTEMP | Intercept (tm) | −2.999 | 0.042 | −2.894 | 0.053 |
| Intercept & Trend (tt) | −4.833 | 0.002 | −4.614 | 0.003 | |
| None (t) | 1.593 | 0.971 | 0.562 | 0.834 | |
| LNRENC | Intercept (tm) | −1.550 | 0.500 | −1.550 | 0.500 |
| Intercept & Trend (tt) | −2.560 | 0.300 | −2.520 | 0.318 | |
| None (t) | 0.856 | 0.892 | 0.856 | 0.892 | |
| At 1st difference-I(1) | |||||
| d(LNAGR_GDP) | Intercept (tm) | −8.386 | 0.000 | −14.089 | 0.000 |
| Intercept & Trend (tt) | −4.597 | 0.004 | −14.185 | 0.000 | |
| None (t) | −7.494 | 0.000 | −9.172 | 0.000 | |
| d(LNCO2) | Intercept (tm) | −6.063 | 0.000 | −6.083 | 0.000 |
| Intercept & Trend (tt) | −7.225 | 0.000 | −7.224 | 0.000 | |
| None (t) | −2.031 | 0.042 | −5.220 | 0.000 | |
| d(LNPREC) | Intercept (tm) | −11.577 | 0.000 | −20.258 | 0.000 |
| Intercept & Trend (tt) | −11.454 | 0.000 | −20.281 | 0.000 | |
| None (t) | −11.702 | 0.000 | −20.706 | 0.000 | |
| d(LNTEMP) | Intercept (tm) | −5.386 | 0.000 | −20.296 | 0.000 |
| Intercept & Trend (tt) | −5.318 | 0.000 | −21.071 | 0.000 | |
| None (t) | −5.057 | 0.000 | −14.111 | 0.000 | |
| d(LNRENC) | Intercept (tm) | −7.830 | 0.000 | −7.830 | 0.000 |
| Intercept & Trend (tt) | −4.049 | 0.014 | −7.773 | 0.000 | |
| None (t) | −7.541 | 0.000 | −7.556 | 0.000 |
| Critical Values | |||||||||
|---|---|---|---|---|---|---|---|---|---|
| 10% | 5% | 1% | Outcome | ||||||
| Lag Length | F-Statistic | k | Lower Bound | Upper Bound | Lower Bound | Upper Bound | Lower Bound | Upper Bound | |
| ARDL(3,2,3,3,0) | 4.314459 | 4 | 2.402 | 3.345 | 2.85 | 3.905 | 3.892 | 5.173 | |
| Cointegrated | |||||||||
| Lag | LogL | LR | FPE | AIC | SC | HQ |
|---|---|---|---|---|---|---|
| 0 | 131.4737726 | NA | 0.000000 | −5.49886 | −5.300094 | −5.424401 |
| 1 | 284.0767282 | 265.3964 | 0.000000 | −11.04681 | −9.854222 * | −10.60006 * |
| 2 | 309.3340288 | 38.43502 * | 0.000000 | −11.058 | −8.871582 | −10.23896 |
| 3 | 332.2327498 | 29.8679 | 0.000000 | −10.96664 | −7.786395 | −9.775302 |
| 4 | 362.9502096 | 33.38854 | 0.000000 | −11.21523 * | −7.041154 | −9.651594 |
| Dependent Variable: LNAGR_GDP | ||||
|---|---|---|---|---|
| Selected Model: ARDL (3, 2, 3, 3, 0) | ||||
| Variable | Coefficient | Std. Error | t-Statistic | Prob. |
| ECM | −0.239 *** | 0.044 | −5.483 | 0.000 |
| LNAGR_GDPt−1 | −0.356 *** | 0.118 | −3.010 | 0.005 |
| LNAGR_GDPt−2 | −0.419 *** | 0.125 | −3.365 | 0.002 |
| LNCO2t | 0.072 | 0.265 | 0.271 | 0.788 |
| LNCO2t−1 | 0.932 *** | 0.278 | 3.352 | 0.002 |
| LNPRECt | 0.012 | 0.102 | 0.117 | 0.908 |
| LNPRECt−1 | −0.602 *** | 0.155 | −3.883 | 0.000 |
| LNPRECt−2 | −0.281 ** | 0.106 | −2.660 | 0.012 |
| LNTEMPt | −0.494 | 0.845 | −0.585 | 0.562 |
| LNTEMPt−1 | −4.110 *** | 1.114 | −3.689 | 0.001 |
| LNTEMPt−2 | −1.841 ** | 0.827 | −2.228 | 0.032 |
| R-squared | 0.614 | Mean dependent var | 0.021 | |
| Adjusted R-squared | 0.507 | S.D. dependent var | 0.108 | |
| S.E. of regression | 0.076 | Akaike info criterion | −2.112 | |
| Sum squared residuals | 0.209 | Schwarz criterion | −1.679 | |
| Log-likelihood | 60.622 | Hannan-Quinn criteria | −1.949 | |
| F-statistic | 5.730 | Durbin-Watson stat | 2.028 | |
| Prob(F-statistic) | 0.000 *** | |||
| Variable * | Coefficient | Std. Error | t-Statistic | Prob. |
|---|---|---|---|---|
| LNCO2(−1) | −0.739 | 0.732 | −1.011 | 0.318 |
| LNPREC(−1) | 2.556 * | 1.381 | 1.850 | 0.071 |
| LNTEMP(−1) | 21.219 *** | 9.467 | 2.241 | 0.030 |
| LNRENC | 0.305 | 0.206 | 1.484 | 0.145 |
| Null Hypothesis: | F-Statistic | Prob. | |
|---|---|---|---|
| LNCO2 does not Granger Cause LNAGR_GDP | 0.620 | 0.542 | |
| LNAGR_GDP does not Granger Cause LNCO2 | 0.108 | 0.898 | |
| LNPREC does not Granger Cause LNAGR_GDP | 0.555 | 0.578 | |
| LNAGR_GDP does not Granger Cause LNPREC | 1.943 | 0.156 | |
| LNTEMP does not Granger Cause LNAGR_GDP | *** | 5.456 | 0.008 |
| LNAGR_GDP does not Granger Cause LNTEMP | *** | 7.148 | 0.002 |
| LNRENC does not Granger Cause LNAGR_GDP | * | 2.495 | 0.094 |
| LNAGR_GDP does not Granger Cause LNRENC | 0.422 | 0.658 | |
| LNPREC does not Granger Cause LNCO2 | 2.318 | 0.111 | |
| LNCO2 does not Granger Cause LNPREC | 1.876 | 0.166 | |
| LNTEMP does not Granger Cause LNCO2 | 0.093 | 0.911 | |
| LNCO2 does not Granger Cause LNTEMP | *** | 7.331 | 0.002 |
| LNRENC does not Granger Cause LNCO2 | * | 2.740 | 0.076 |
| LNCO2 does not Granger Cause LNRENC | *** | 4.439 | 0.018 |
| LNTEMP does not Granger Cause LNPREC | 0.174 | 0.841 | |
| LNPREC does not Granger Cause LNTEMP | 1.010 | 0.373 | |
| LNRENC does not Granger Cause LNPREC | 0.882 | 0.421 | |
| LNPREC does not Granger Cause LNRENC | *** | 3.684 | 0.033 |
| LNRENC does not Granger Cause LNTEMP | *** | 4.196 | 0.022 |
| LNTEMP does not Granger Cause LNRENC | *** | 4.755 | 0.014 |
| Diagnostic Statistics | p-Values | Outcome |
|---|---|---|
| Breusch-Godfrey LM | 0.641 | No serial correlation |
| Breusch-Pagan-Godfrey | 0.606 | No Heteroskedasticity |
| Jarque-Bera Test | 0.373 | Normal residuals |
| Dependent Variable: LNAGR_GDP | ||||||||||||||
|---|---|---|---|---|---|---|---|---|---|---|---|---|---|---|
| FMOLS | DOLS | CCR | ||||||||||||
| Variable | Coefficient | Std. Error | t-Statistic | Prob. | Variable | Coefficient | Std. Error | t-Statistic | Prob. | Variable | Coefficient | Std. Error | t-Statistic | Prob. |
| LNCO2 | 0.213 | 0.253 | 0.841 | 0.405 | LNCO2 | −0.046 | 0.279 | −0.165 | 0.870 | LNCO2 | 0.216 | 0.246 | 0.877 | 0.385 |
| LNPREC | 0.317 | 0.278 | 1.141 | 0.260 | LNPREC | 0.596 | 0.424 | 1.406 | 0.170 | LNPREC | 0.494 | 0.387 | 1.275 | 0.209 |
| LNTEMP | 3.910 | 2.159 | 1.811 | 0.077 | LNTEMP | 9.910 | 3.171 | 3.125 | 0.004 | LNTEMP | 5.332 | 2.698 | 1.977 | 0.054 |
| LNRENC | 0.118 | 0.066 | 1.798 | 0.079 | LNRENC | 0.104 | 0.085 | 1.234 | 0.227 | LNRENC | 0.102 | 0.071 | 1.440 | 0.157 |
| C | 7.539 | 6.998 | 1.077 | 0.287 | C | −9.993 | 10.346 | −0.966 | 0.342 | C | 2.368 | 9.232 | 0.256 | 0.799 |
| R2 | 0.7 | R2 | 0.8 | R2 | 0.7 | |||||||||
Publisher’s Note: MDPI stays neutral with regard to jurisdictional claims in published maps and institutional affiliations. |
© 2022 by the author. Licensee MDPI, Basel, Switzerland. This article is an open access article distributed under the terms and conditions of the Creative Commons Attribution (CC BY) license (https://creativecommons.org/licenses/by/4.0/).
Share and Cite
Tagwi, A. The Impacts of Climate Change, Carbon Dioxide Emissions (CO2) and Renewable Energy Consumption on Agricultural Economic Growth in South Africa: ARDL Approach. Sustainability 2022, 14, 16468. https://doi.org/10.3390/su142416468
Tagwi A. The Impacts of Climate Change, Carbon Dioxide Emissions (CO2) and Renewable Energy Consumption on Agricultural Economic Growth in South Africa: ARDL Approach. Sustainability. 2022; 14(24):16468. https://doi.org/10.3390/su142416468
Chicago/Turabian StyleTagwi, Aluwani. 2022. "The Impacts of Climate Change, Carbon Dioxide Emissions (CO2) and Renewable Energy Consumption on Agricultural Economic Growth in South Africa: ARDL Approach" Sustainability 14, no. 24: 16468. https://doi.org/10.3390/su142416468
APA StyleTagwi, A. (2022). The Impacts of Climate Change, Carbon Dioxide Emissions (CO2) and Renewable Energy Consumption on Agricultural Economic Growth in South Africa: ARDL Approach. Sustainability, 14(24), 16468. https://doi.org/10.3390/su142416468