Abstract
The beneficial effects of green and blue areas on human wellbeing are significant. Physical activity is a crucial factor for the promotion of good human health and wellbeing, and running constitutes one of the most popular forms of outdoor physical activity. This study examines the effect of six urban “route landscapes” with different landscape characters used for outdoor running on the heart rates and speeds of 30 people wearing a smartwatch while running. These routes included: (1) a running track in a stadium; (2) a road without street trees; (3) a road with street trees; (4) an urban park without sea view; (5) an urban park with sea view; and (6) a road by the sea. Additionally, a questionnaire survey was conducted to determine participants’ perceptions and preferred “route landscape” for running. In the study, higher heart rates were recorded on routes without trees, including the stadium. The lowest heart rate was recorded in the park by the sea, followed by the road by the sea, which were at the lowest altitudes amongst the routes studied. Additionally, the highest mean speed of participants was recorded during the run on the road by the sea. The results also showed that irrespectively of the routes, increases in altitude and gradient caused an increase in the heart rates. In the survey, the majority of respondents stated that they would have felt calm and joy during a run either in a park or in a park by the sea. With rising sea levels dictating not to build, carbon capture being necessary in parks, and trees by roads reducing the heat island effect, this study reveals the best “route landscapes” for runners’ health and global warming.
1. Introduction
Climate change is the world’s largest health threat of the 21st century and affects dense urban areas more adversely than rural areas [1]. Since 2007, most of the world’s population lives in urban areas [2,3]. The negative effects of urbanization are well documented [4,5]. In many cities, the lack of shade and tree canopies to reduce building energy consumption contributes to greenhouse gas emissions and the urban heat island effect [6,7]. In addition, in many cities, with the increase in sea levels and heavy precipitation, buildings in low-lying coastal areas or flood plains are prone to floods [6]. In urban areas, the built environment comprised of both large- and small-scale settings (i.e., cities, neighborhoods, houses, shops, hospitals, etc.), as well as roads, sidewalks, green spaces, and transport networks, contributes significantly to climate change and health effects [6]. Through the careful planning of buildings, land uses, and transport networks, urban areas can support both climate change mitigation and human health [6]. For example, the placement of residential buildings in relation to commercial areas influences people’s choice of transit (walking, cycling, driving, or public transport use) and has a significant effect on the body mass index (BMI) [6,8]; people show higher BMI scores when car use to commute to work/school and the shops increases [8]. To address climate change, the risks to the population’s public health need to be considered, and an understanding of ecological relations and the imperatives of environmental sustainability need to be established collectively [9,10].
The effect of the environment on human health has been analyzed by many researchers, who demonstrated how green areas have a positive impact on human health. Researchers have demonstrated that urban plants filter the air [11], reduce the impact of noise [12,13], regulate the microclimate, reduce rainwater runoff, and provide aesthetical and cultural values to cities [12]. In densely populated areas, a statistically significant positive relationship between green spaces and prosperity has been found, since green spaces provide significant outlets for people to improve their well-being [14]. In densely populated areas, the presence of green spaces increases physical activity and contributes to human physical and psychological well-being [7,15,16]. The more densely populated an area is, the more the individual benefits from using green spaces [16,17]. People who live near green spaces have more opportunities to exercise and consequently more chances at a healthier life [18].
Physical activity is associated with improved mental or spiritual health [16], as well as social health [19,20]. People exercising on a treadmill while viewing a city with urban green or a rural landscape demonstrate reduced blood pressure and a positive effect on self-esteem [21]. Various exercise activities performed in natural environments, such as walking, cycling, horse-riding, fishing, canal-boating, and conservation activities, show, post-activity, a significant improvement in people’s self-esteem and total mood disturbance (anger, confusion, depression, fatigue, and tension) [22]. Health improvements are greater when physical activity is performed within a natural environment than in other areas [22]. The role of physical activity as a factor through which green spaces have a beneficial effect on mental and social health is highlighted in the study by Zhang et al. [20] but also in the study by Rhodes and Nasuti [23]. Physical activity increases the closer people live to a green space [24] and the larger the size of the green space is [25]. Schipperijn et al. [26] note that the factors that significantly affect physical activity are mainly the size and characteristics of the green space.
The beneficial effects of green areas on physical and mental health are also mentioned in the study by Kondo et al. [27]. They show that there is a negative relationship between urban green spaces and mortality, heart rate, and violence, and a positive relationship with mood and physical activity. Richardson et al. [28], examining the relationship between green spaces and health, and whether physical activity is the link between green spaces and health, report that people in greener neighborhoods are less likely to have poor mental health and are at reduced risk of cardiovascular disease. Song et al. [29,30] show that walking in the woods compared to walking in the urban context reduces negative emotions such as “anger–hostility”, “depression–distraction”, “confusion”, “fatigue”, and “tension–nervousness” and increases positive emotions such as “energy”. Sellers et al. [31], investigating whether there are differences in the facilitation of exercise between a 30 min walk in a park and one in the urban fabric, show that walking in the park, since it is not interrupted as it happens in the urban fabric due to traffic, creates conditions for people to increase physical activity in relation to walking within the urban fabric. The positive psychological effects of walking in green areas are mentioned in the studies by de Bitro et al. [32] and Koselka et al. [33].
Many studies also report the existence of a positive impact of areas that have water, such as seashores, lakes, and rivers, on the general health [34,35,36] and the mental health [37,38,39] of people living or exercising in areas near water. Britton et al. [40], in a systematic review of studies on the effects of water in areas on the health and well-being of people living or exercising in these areas, note that there are immediate health benefits, especially for the mental health and well-being of individuals. The majority of studies find a positive or weak correlation between areas with water, and the health and well-being variables. Similar are the results of the literature review by Gascon et al. [39]. The environment in which water is contained works beneficially and improves the health of individuals [41].
Most research studying the effect of the environment on human health is focused on pedestrians and cyclists, while running is among the most popular physical activities [42]. Within urban areas, traffic noise and unexpected pedestrian movements may counteract the psychological benefits of running [43]. It has been reported that routes in downtown areas and near traffic have low safety and general runnability, whereas routes near parks and in residential areas with low traffic have higher safety for runners [42]. Poor lighting, unleashed dogs, and encounters with cyclists and cars have been reported to impede running [44]. Runners’ heart rate and speed are influenced by varying levels of familiarity and sensorimotor stimuli of routes [45]; familiar routes increase the speed and decrease the heart rate and attention (short-term memory performance) of runners compared with unfamiliar routes [45]. Researchers have found that while running, the alteration in the route gradient causes runners to modify their technique, i.e., step length and frequency [46]. In addition, altitude affects the heart rate, which is applied in training to enhance the performance of runners [47].
To date, the majority of research has investigated the impact of green or blue areas on health without considering in detail the landscape characteristics of the site visited. The presence of green and water, as already mentioned, has a positive effect on human health; however, information is limited on the effect of the various characteristics that compose the landscape, e.g., whether it is green, blue, or urban. Additionally, there is not much information on the effect of the landscape characteristics of routes on runners. The various characteristics and features that compose the landscape character of a location within a city can potentially affect runners’ performance and health. The study of landscape characteristics in urban areas can inform design principles or even policies to support human health and well-being. This study aimed to examine the effect of varying “route landscapes” with different characteristics, such as the presence of green and/or sea, as well as differences in altitude and gradient, on the health of people during running and, in particular, their speed and heart rate, as well as the perceptions of people of the various route landscapes. To achieve the aim of the study, a field study, as well as a separate questionnaire survey, was implemented. The outcomes of the study could facilitate the design of routes for running, which could contribute to supporting human health while running and concomitantly mitigate the negative effects of climate change.
2. Materials and Methods
As mentioned above, this study examined different urban “route landscapes” (i.e., routes with different landscape characters) used for outdoor running. The study was cross-sectional and comprised two phases: a field study, which measured physiological indicators (i.e., heart rate and speed), and a questionnaire survey, which assessed people’s perceptions of the different routes.
2.1. Routes
Six routes, 700 m long, in two different areas of Athens (4 in the Galatsi area and 2 in the Palaio Faliro area), Greece, were selected for the study (Figure 1). Galatsi is a northern suburb of Athens, located on the mainland, 4 km from the city center, at a mean altitude of 160 m. It is a densely populated area of Athens, adjacent to both Alsos Veikou park and the pine forest of Tourkovounia hill. On the other hand, Palaio Faliro is located on the western coast of Attica, 6 km southwest of Athens city center. Within Palaio Faliro and adjacent to the coast is Floisvos Park, which constitutes a popular destination for recreation, and athletic and cultural activities. Avenues characterized by frequent traffic run along one boundary of both the Alsos Veikou park in Galatsi and the Floisvos Park in Palaio Faliro: Leoforos Veikou and Leoforos Poseidonos, respectively.
Figure 1.
Two main locations of the routes selected for the study; top image [48], bottom image [49].
The landscape characters of the six routes selected for the study, including a stadium, varied. The key elements that composed the landscape character of each route were the presence of plants, traffic, or sea view, and the terrain expressed in terms of altitude and gradient. Therefore, the landscape characters of the studied routes were as follows (Figure 2):
- (1)
- Running track in a stadium: It was located in Galatsi and was an open space with a turf football pitch in the center, a running track on the perimeter, and stands along one side of the stadium. The mean altitude was approximately 185 masl. The gradient along the route was approximately level (<2%).
- (2)
- Road without street trees: It was located along Leoforos Veikou (avenue) with 4 lanes divided by a planted traffic island, street trees, and 5-storey residential buildings containing shops on the main floor on either side of the avenue. The mean altitude was approximately 169 masl. The gradient along the route was approximately level (<2%).
- (3)
- Road with street trees: It was located along Leoforos Veikou (avenue) with 4 lanes divided by a planted traffic island; street trees and park plants were present in the studied side, and there were 5-storey residential buildings on the opposite side. The mean altitude was approximately 166 masl. The gradient along the route was approximately level (<2%).
- (4)
- Urban park without sea view: It was a path located within a park (Alsos Veikou Park, in Galatsi) with plants on either side. The plants within the park were mainly large-sized coniferous (such as Pinus halepensis, P. pinea, and Cupressus sempervirens), broadleaved trees (such as Brachychiton acerifolius, Cercis siliquastrum, Eucalyptus globulus, Platanus acerifolius, Jacaranda mimosifolia, etc.), and ornamental shrubs. The mean altitude was approximately 173 masl. The gradient along the route altered between 2 and 12%.
- (5)
- Urban park by the sea: It was a path located within a park (Floisvos Park, in Palaio Faliro) with plants on one or both sides of the path and constant views of the sea. The plants within the park were mainly medium-sized and fewer large-sized broadleaved trees (such as Acacia cyanophylla, Acacia julibrissin, Acacia dealbata, Casuarina equisetifolia, Eucalyptus sp., Morus alba, Olea europaea, Platanus orientalis, Populus alba, Populus nigra, etc.), and ornamental shrubs. The mean altitude was approximately 5 masl. The gradient along the route was approximately level (<2%).
- (6)
- Road by the sea: It was located along Leoforos Poseidonos (avenue) in Palaio Faliro, with 6 lanes divided by a planted traffic island; a tram line, street trees, and views of the sea were present in the studied site, and street trees and 5-storey residential buildings, occasionally containing shops on the main floor, were on the opposite side. The mean altitude was approximately 8 masl. The gradient along the route was approximately level (<2%).

Figure 2.
Schematic representation of the landscape characters of the six routes (“route landscapes”) selected for the study.
2.2. Field Study
In the first phase of the study, the participants of the field study were randomly recruited from areas near the studied routes during a pause while running. Prospective participants were informed about the study as well as the locations of the six studied routes and voluntarily asked to read and sign a consent form if they wished to participate. Each participant took part in the study on a weekend day of their choice provided the environmental conditions were appropriate (see below). The details and collected data of all participants were anonymous. More specifically, 30 adults, 16 male and 14 female, 19–29 years old (median of 26 years), of normal body weight (median BMI of 23.33) volunteered to participate in the field study. All participants stated that they ran outdoors 1–2 times per week. Permission to conduct the current research was obtained by Committee of Ethics and Deontology of Agricultural University of Athens, Greece. Participants ran all six routes on the same day in random order amongst them and were taken to each location. The study took place on sunny days, in the morning between 11:00 and 13:00 on weekends, under similar climatic conditions, during early spring, in March–April 2021 (the daily mean temperatures ranged in both locations between 14.5 and 16.2 °C). The duration of the run on each route ranged approximately between 3.9 and 5.7 min. All participants wore a GPS smartwatch (Garmin Forerunner 235; Garmin Ltd., Switzerland) on their left wrist. Along each route throughout the duration of the run, the GPS smartwatch recorded the participants’ heart rate and speed every 20 s. Additionally, the collected data were post-processed to obtain the mean heart rate and the corresponding speed, gradient (<2%, 2–4,99%, 5–7,99%, 8–11,99%, and ≥12%), and mean altitude every 50 m along the length of each route (Figure 3). The altitude (masl) of each route was obtained using MERIT DEM [50].
Figure 3.
Schematic representation of the gradient per 50 m along each of the six routes selected for the study and values of the mean route altitude and gradient. The altitude is expressed in meters above sea level (masl), and the gradient is expressed in degrees (°). Gradient values above and below each route depict the inclines of an uphill and a downhill segment, respectively.
2.3. Questionnaire Survey
In the second phase of the study, a different sample of participants volunteered to participate in the questionnaire survey. A questionnaire survey with sixteen questions was administered online using Google Forms between 3 and 10 June 2021. The link to the questionnaire survey was disseminated to randomly selected runners near the areas of the routes selected for the field study. Prospective participants were informed about the study and were asked if they wished to voluntarily participate in the survey on their own leisure time on the specified dates (3–10 June 2021). The completion of the questionnaire was anonymous. The questionnaire was divided into 2 sections. The first section was composed of 9 questions concerning peoples’ preferences with respect to the “route landscapes” they enjoyed while running, while the second section was composed of 6 questions concerning participants’ details (Table 1). In total, 228 adults completed the questionnaire.

Table 1.
Questionnaire survey content addressed to participants online using Google Forms *.
The research questions of the first section aimed to investigate the participants’ preferences for the different routes and to determine the factors that affected these preferences. To improve communication with the participants, some abbreviations of the studied “route landscapes” were applied, i.e., stadium (instead of running track in a stadium), park (instead of urban park without sea view), and park by the sea (instead of urban park with sea view). To improve the manuscript’s readability by avoiding periphrastic repetitiveness, the above abbreviations are also applied in the Results and Discussion sections.
2.4. Statistical Analysis
2.4.1. Field Study
The research question of this study was the investigation of the independent variable “route landscape character” (the short term used is “route”) on the participants’ mean heart rates and speeds. The control variables were the personal–demographic characteristics of the participants. We measured the heart rates of the participants every 20 sec and every 50 m. The difference between these two measurements is that in the second method, (heart rate every 50 m), it is feasible to include in the model the impact of the gradient and the altitude of the ground. These two variables do not exist in the case of the measurement of the heart rate every 20 s.
A hierarchical linear model [51] was applied to study the hypotheses that the participants’ gender, age, BMI, and frequency of physical exercise, as well as the route altitude and gradient, affected the participants’ mean heart rates and speeds recorded (every 20″ and 50 m, respectively) separately on each of the six route landscapes studied.
The statistical method used to capture the effects of the landscape elements on the heart rates of the participants was the hierarchical linear model [51]. This type of model investigates the relationship between a dependent variable (heart rates produced every 20″/50 m) and the independent variables (route, gradient, and altitude), taking into account the hierarchical nature of the data, in the sense that measurements are nested within each individual. The data produced by the measurement of each participant every 20″ or every 50 m were considered as random effects terms in the hierarchical model of linear regression. We assumed that the dependent variables followed a normal distribution (Gaussian). The hierarchical linear model consists of a two-level analysis. In the first level, the link function between the dependent (heart rate) and fixed effects independent variable (route) are linked through the following model specification:
- first level
yij~f (yij|θij)
θij = h (μij)
μij = β0ij + β1ij·Χ1ij
- second level
Coefficient β of the independent variable (route) is considered, in the second level, as a dependent variable through the following linear formula:
where Xj are the second-level explanatory variables (gradient and altitude) and b represent the constant term and the gradient for the above explanatory variables, respectively. Finally, r1j are the random errors, which are assumed to follow a normal distribution with zero mean and standard deviation σ21r, that is, r1j~N (0, σ21r).
β1ij = b10j + b1j·Χ1j + b2j·Χ2j + b3j + r1j,
The variable “route” was represented by six different places, which were “stadium”, “park”, “road with street trees”, “road without street trees”, “park by the sea” and “road by the sea”. The reference category for “route” was “stadium”. The reference category for “gradient” was “<2%”. The reference category for “altitude” was the stadium’s “corresponding altitude” (i.e., mean altitude: 185 masl). Finally, all two-way interaction terms between the independent variables were included in the hierarchical regression model.
The comparison between the adjusted models in order to choose the best model was based on the comparison of nested models using the backward elimination procedure. This implied starting with the complete model, which included all the explanatory variables, and then removing the variable with the highest non-statistical significance. The comparison between the previous model and the alternative model was performed with the use of AIC (Akaike’s Information Criterion) and BIC (Bayesian Information Criterion) based on the likelihood of the under-examination models. The best model was the model with the lowest value of AIC and BIC criteria.
R software [52] was used to fit the hierarchical models to the data. Specifically, the lme4 library [53] and the lmer( ) function were applied to adapt the hierarchical models.
2.4.2. Questionnaire Survey
The questionnaire’s data were imported into SPSS Statistical Software, v.17.0 (SPSS Inc., Chicago, IL, USA), and analyzed. A descriptive analysis of the questionnaire survey was undertaken; it involved calculating the percentage frequency for each individual question’s categories to depict the most frequent answers.
Additionally, in question 9, to investigate which route was more preferred by the participants, each of the 6 routes was compared with one of the other 5 routes. Hence, 15 pairs of routes were created, and each participant had to select from each pair the preferred route. All six routes were presented to the participants with an image. In each pair, the selected route received the value of 1, while the non-selected route received the value of 0. After completing the 15 pairs the total value for each route was calculated by adding the given values from all the pairs. The maximum value that the route could receive was 5 (i.e., the particular route was selected in all 5 possible combinations), and the minimum was 0, i.e., the route was not selected at all. The statistical methodology applied was the analysis of variance (ANOVA), with the dependent variable being the total calculated value of the routes based on the participants’ preferences and the independent categorical variables being gender, age, parental status, field of study, education level, and occupation. In the case of a statistically significant difference, the Bonferroni test was applied at a 5% significance level for the comparison of the means.
3. Results
3.1. Field Study
The highest mean heart rate of participants was recorded during the run in the stadium, while the lowest mean heart rate was recorded during the run in the park by the sea (Figure 4).
Figure 4.
Mean heart rate (bpm) of participants recorded during their run on each of the selected six routes in the study (N = 30, mean ± S.E.).
The highest mean speed of participants was recorded during the run on the road by the sea (9965 km h−1) and on the road with street trees (Figure 5).
Figure 5.
Mean speed (km h−1) of participants recorded during their run on each of the selected six routes in the study (N = 30, mean ± S.E.).
The mean heart rate of the participants was affected significantly by both the gradient and altitude of the routes (p-value < 0.05). More specifically, the correlation coefficient between the mean heart rate and the altitude was 0.184 (p-value < 0.001), and that between the mean heart rate and the gradient was 0.196 (p-value < 0.001). The mean altitude of the routes was smaller in Paleo Faliro and greater in Galatsi (Figure 3). Concerning the mean gradient, the park presented the greatest value, while the road without trees presented the smallest value (Figure 3).
On the other hand, a negative significant correlation was found between the mean route speed and altitude (correlation coefficient = −0.047, p-value = 0.015). A positive significant correlation was found between the mean route speed and gradient (coefficient correlation = 0.111, p-value < 0.001).
The comparison of models for the heart rates of the participants recorded every 20″ using AIC and BIC showed that the final model with “route” as the only independent explanatory variable was the best-fit model (Table 2).
Table 2.
Comparison of models for the heart rate of participants (N = 30) recorded every 20″ during the run on each route using AIC and BIC. Starting from the complete model, the independent variables are age, BMI, gender, and route.
The comparison of models for the heart rates of the participants recorded every 50 m using AIC and BIC showed that the final model with gradient, route, and route*altitude interaction as the independent explanatory variables was the best-fit model (Table 3).
Table 3.
Comparison of models for the heart rate of participants (n = 30) recorded every 50 m during the run on each route using AIC and BIC. Starting from the complete model, the independent variables are BMI, frequency of physical exercise, age, gender, gradient, route, and route*altitude interaction.
Based on the information shown by the different models using AIC and BIC (Table 2 and Table 3) on the estimation of the impact of the landscape characters of the routes studied, the effect of the route gradient, the route, and the route*corresponding altitude interaction on the heart rates of the participants was significant (Table 4). Note that both the gradient and the altitude were included in the models only for the participants’ heart rates recorded every 50 m. More specifically, the estimated coefficient of the participants’ heart rates every 20″ was statistically significant among the different routes (p-value < 0.05) (Table 4, Figure 6). The participants’ heart rates were statistically significant in all the routes studied and were lower than the corresponding heart rates recorded in the stadium, which was the reference category. The lowest heart rate was recorded in the park by the sea (b = −13.109; p-value < 0.05) and the second-lowest heart rate on the road by the sea (−4.697; p-value < 0.05). The participants’ heart rates recorded both on the road without street trees and in the park were lower than the corresponding heart rates recorded on the road with street trees.
Table 4.
Estimation of parameters b regarding the effect of the landscape characters of the routes selected for the study on the participants’ heart rates (bpm) recorded during each run every 20″ and 50 m. The negative values indicate that the particular category of independent variables had a more negative effect on the dependent variable, i.e., heart rate (bpm), than the reference category.
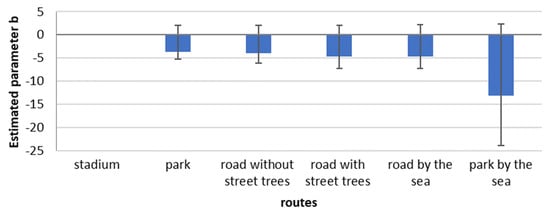
Figure 6.
Estimated parameters b regarding the effect of the landscape characters of the routes selected for the study on the participants’ heart rates (N = 30) recorded during each run every 20″.
Having recorded the participants’ heart rates every 50 m allowed both the altitude and gradient of each route studied to be considered in the models. The results obtained using AIC and BIC showed that the route, gradient, and interaction between route and altitude significantly affected the participants’ heart rates (p-value < 0.05) (Table 4, Figure 7). More specifically, the participants’ heart rates recorded on both the road without street trees (b = −602.36; p-value < 0.05) and the road with street trees (b= −588.981; p-value <0.05) were lower than the corresponding participants’ heart rates recorded in the stadium and in the park (b = 590.50; p-value < 0.05).
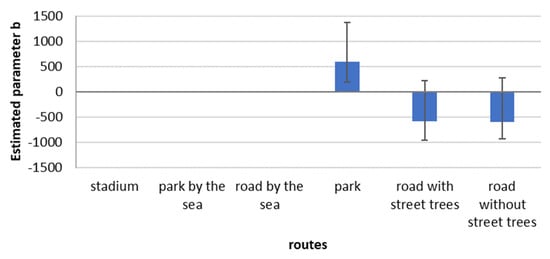
Figure 7.
Estimated parameters b regarding the effect of the landscape characters of the routes selected for the study on the participants’ heart rates (N = 30) recorded during each run every 50 m.
Considering the interaction between route and altitude on the participants’ heart rates, the results showed that the participants’ heart rates were not affected by the low altitude of the park by the sea in relation to the altitude of the stadium (Table 4, Figure 8). Moreover, the participants’ heart rates decreased at the low altitude of the park in relation to the altitude of the stadium. On the other hand, the participants’ heart rates increased at the low altitudes of the road by the sea (b = 4.115; p-value < 0.05), the road without street trees (b = 3.627; p-value < 0.05), and the road with street trees (b = 3.611; p-value < 0.05) in relation to the altitude of the stadium.
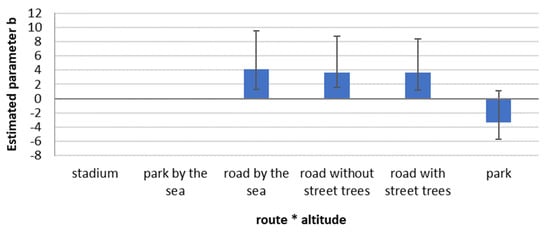
Figure 8.
Estimated parameters b regarding the combined effect of the altitudes and corresponding landscape characters of the routes selected for the study on the participants’ heart rates (N = 30) recorded during each run every 50 m.
The change in gradient along the routes significantly affected the heart rates of the participants (Table 4, Figure 9). The heart rates of the participants recorded along a route with a gradient more than or equal to 12.00% (b = 13.73; p-value < 0.05) were greater than the corresponding heart rates of the participants along a route with a gradient lower than 2%. Similarly, the heart rates of the participants recorded along a route with a gradient between 5.00 and 7.99% (b = 10.694; p-value < 0.05) was greater than the corresponding heart rates of the participants recorded along a route with a gradient lower than 2%. The studied routes barely contained gradients between 8.00 and 11.99%; therefore, the results showed no significance of the participants’ heart rates recorded. On the other hand, the heart rates of the participants recorded along a route with gradients between 2.00 and 4.99% were similar to the corresponding participants’ heart rates recorded along a route with a gradient <2.00%.
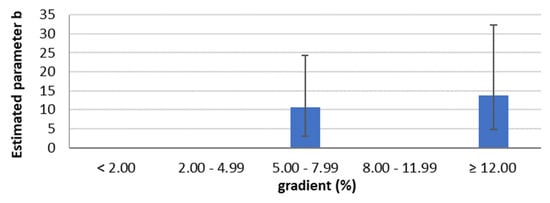
Figure 9.
Estimated parameters b regarding the effect of gradient of the routes selected for the study on the participants’ heart rates (N = 30) recorded during each run every 50 m.
3.2. Questionnaire Survey
3.2.1. Participant Details
The questionnaire was completed by 228 participants, among whom 58.3% were female and 41.7% were male (Table 5). Regarding the participants’ age, the majority were <35 years, with most being between 25 and 29 years (SD = 0.936) (Table 5). Only 16.7% of the participants stated to be parents (Table 5).
Table 5.
Socio-demographic details of participants that completed the questionnaire survey (N= 228).
The field of study of most participants was economics, management, and informatics (29.4%) followed in descending order by positive sciences (mathematics, physics, chemistry, agriculture, etc.) (26.8%), polytechnic sciences (12.7%), physical education and sports science (11.0%), health sciences (10.5%), and humanities, law, and social sciences together with military, police, fire, and merchant marine (4.8%) (Table 5). Concerning their education level, 35.5% held a university or polytechnic degree and 29.0% a master’s or Ph.D. degree, while the remaining 9.6% were graduates of technological education, 13.6% of higher vocational education, and 12.3% of lyceum (Table 5). As far as their occupation status was concerned, 37.7% were students, 35.1% private-sector employees, 10.5% freelancers, 7% civil workers, and 9.6% unemployed (Table 5). The majority of the participants (97,8%) stated that they ran in the city (Table 6). Regarding the frequency of running, 26.8% of the participants ran once a week on a weekday, and 23.7% every weekend and on holidays; furthermore, 22.4% of the participants ran equally daily or every other day and 2.6% every fortnight, while 2.2% of the participants did not run (Table 6).
Table 6.
Information on the running practice of participants that completed the questionnaire survey (N = 228).
3.2.2. Route Preference
If all of the studied routes were available to the participants, the majority of participants indicated a preference for running in a park located by the sea (54.8%) followed in descending order by a park (24.1%), a road with street trees (15.1%), a road by the sea (3.6%), a stadium (2.4), and a road without street trees (0.0%) (Figure 10).
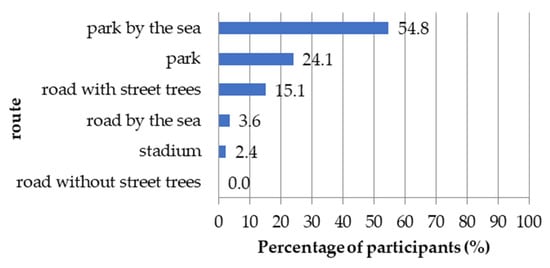
Figure 10.
Percentage (%) of participants stating the most preferred route for running (N = 228).
Regarding how much the participants would have liked to run on each of the six routes selected for the study, the results showed that the majority of participants would have liked to run in a park by the sea very much (76.7%), followed in descending order by a park (67.1%), a road with street trees (43.9%), a stadium (14.5%), a road by the sea (5.2%), and a road without street trees (1.4%) (Figure 11). On the other hand, the majority of participants stated that they would not have liked or would have liked little to run on a road without street trees (59.4% and 35.5%, respectively).
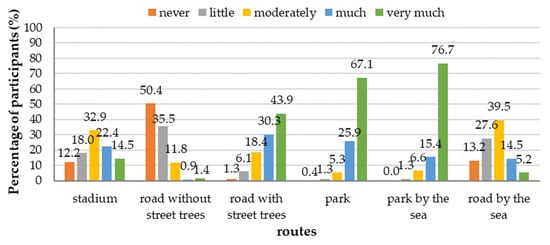
Figure 11.
Percentage (%) of participants stating how much they would have liked to go for a run on each route on a 5-point Likert scale (never, little, moderately, much, and very much) (N = 228).
When asked how green spaces affected exercise performance, the majority of participants stated “positively” (76.3%) (Figure 12). Similarly, when asked how green spaces by the sea affected exercise performance, the majority of participants stated “positively” (71.5%) (Figure 13).
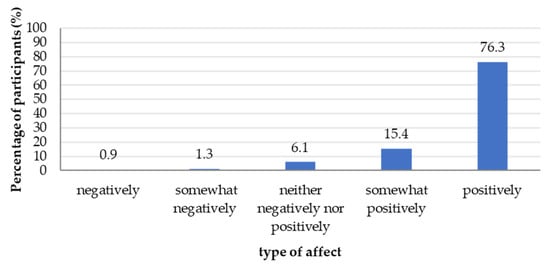
Figure 12.
Percentage (%) of participants stating how green spaces affected their exercise performance on a 5-point Likert scale (negatively; somewhat negatively; neither negatively nor positively; somewhat positively; and positively) (N = 228).
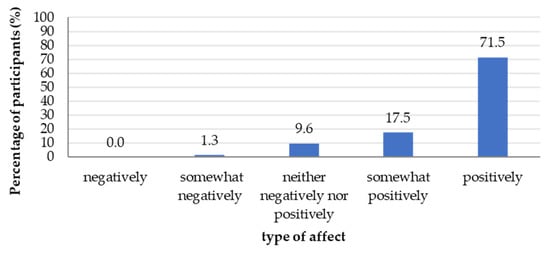
Figure 13.
Percentage (%) of participants stating how the presence of the sea affected their exercise performance on a 5-point Likert scale (negatively; somewhat negatively; neither negatively nor positively; somewhat positively; and positively) (N = 228).
Concerning the emotions developed while running on the various types of routes, the majority of the participants stated that they would have felt both calm (“very much”; 63.6%) and joy (“very much”; 71.1%) during a run in a park by the sea compared with any of the other routes studied (Figure 14). A relatively large amount of participants also stated that they would have felt calm (“much”; 55.3%) and joy (“very much”; 69.7%) during a run in a park. Though participants stated that they would have felt joy (“much”; 54.8%) on a road with street trees, they also stated that they would have felt both calm and anxiety (both “little”; 67.5% and 52.6%, respectively). Most participants stated that they would have felt calm (“moderately”; 49.6%) and joy (“little”; 48.7%) during a run in a stadium. On the hand, the majority of the participants stated that they would have felt anxiety (“very much”; 76.8%) and anger (“little”; 63.2%) during a run on a road without street trees.
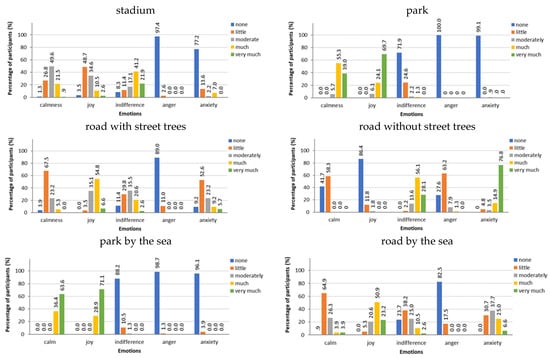
Figure 14.
The percentage (%) of participants in relation to the amount of the different types of emotions (calm, joy, indifference, anger, anxiety) that they would have felt during a run on each of the six routes studied (stadium, park, road with street trees, road without street trees, park by the sea, and road with street trees by the sea) (N = 228).
The results regarding the number of times each of the six routes were selected by participants when presented in pairs in all possible combinations (totaling fifteen pairs) showed that amongst the most selected routes to run on, 69.3% of the participants preferred a route in a park by the sea, followed by a route in a park (21.5%) (Figure 15). Furthermore, the majority of participants indicated the preference to run on roads without street trees the least (75.4%).
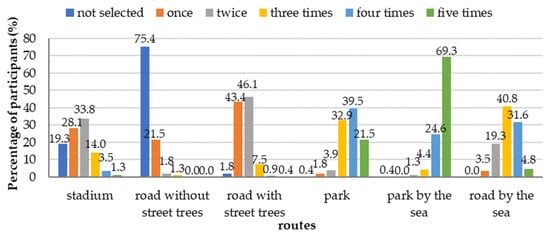
Figure 15.
The percentage of participants stating the route they would prefer to go for a run on based on the number of times each of the six routes (stadium, park, road with street trees, road without street trees, park by the sea, and road by the sea) was selected when presented in pairs in all possible combinations (totaling fifteen pairs), (N = 228). Value = number of times each route was selected on a scale from 0 (=route not selected (i.e., minimum number of times each route could be selected)) to 5 (=maximum number of times each route could be selected).
Further analyses assessing the routes for running in pairs using the analysis of variance model showed statistically significant differences only among the mean total values of the six routes over the 15 combinations of routes studied. The analysis of variance model, using the Bonferroni test (p-value < 0.05) to determine statistically significant differences among the mean values of the routes based on the participants’ preferences, is presented in Table 7. An index was constructed showing the participants’ overall rating for each of the six routes. By comparing the routes in pairs, each participant gave the value of 1 to the route they chose and 0 to the other. The minimum value that the variable took was zero if the route was not selected in any of the five proposed comparisons and five if it was selected in all five proposed comparisons. This index was the dependent variable in the analysis of variance (ANOVA), and the different routes were the independent variables. In particular, the route in the park by the sea had the highest value (4.605), followed by the route in the park (3.737) and the route on the road by the sea (3.149). There were no differences in the preferences of the participants between the routes on the road with street trees and in the stadium, while the route on a road without street trees was the least preferred.
Table 7.
Mean total values calculated for each of the six routes studied (stadium, park, road with street trees, road without street trees, park by the sea, and road with street trees by the sea) based on the participants’ preferences (N = 228). Note: value = 5 most preferred route and 0 = not preferred route.
When participants were asked to select their first- and second-choice routes for running amongst the six routes selected for the study, the majority of participants selected a route in a park by the sea (43.0%), followed with a relatively small difference by a route in a park (40.4%), as the first choice and a route in a park (53.9%) as the second choice (Figure 16).
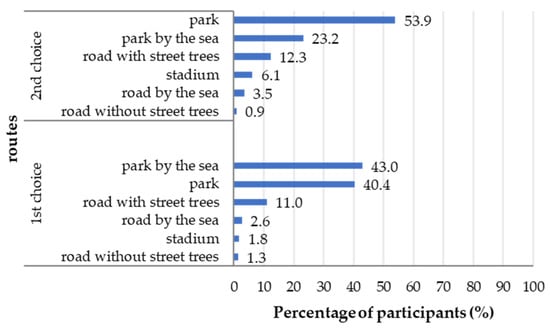
Figure 16.
The percentage (%) of participants in relation to their first- and second-choice routes for running amongst the six routes selected for the study (stadium, park, road with street trees, road without street trees, park by the sea, and road with street trees by the sea) (N = 228).
4. Discussion
There is a common misconception that the size of a sample should be determined based on the size of a population [54]. The importance lies in the extent to which the sample population reflects the population from which it is drawn [54]. Though the sample sizes of both the field study and questionnaire survey were relatively small (N = 30 and N = 228, respectively), no large differences were observed in the characteristics of both samples regarding the demographic information of the participants when compared with the characteristics of the city’s population. The representativeness of the sample population of the city’s population was the outcome of the selection process followed, which was based on the random selection of participants.
4.1. Field Study
The results of the current study agree with the findings of other authors [27], who found a negative association between urban green space exposure and heart rate. Laurino et al. [55] found that the maximum heart rate of runners was higher while running along a road with traffic than while running along a road with limited traffic characterized by extensive vegetation and the presence of a river. A similar study with elderly people walking generated greater heart rates on a built-up commercial street than on a residential street with trees and front gardens [56]. In the current study, higher heart rates were recorded on routes that had no trees, i.e., the stadium and the road without street trees, while the lowest heart rate was recorded in the park with views of the sea. The absence of trees in the landscape possibly contributed to generating the higher heart rates recorded on routes with no trees than on the other routes with trees or greenery. In cities, there are limited opportunities to develop new parks due to the limited availability of space; however, tree planting on roads within cities is a possible option and should be considered to support runners’ health. Introducing trees on treeless roads could benefit runners as well as other user groups, such as pedestrians, and in parallel contribute to reducing the effect of heat islands within cities through the shading of tree canopies [6,7].
The mean heart rate of participants was affected significantly by both the altitude and the gradient of the routes. On routes with altitude-varying terrain (gradient), runners modify the step length and frequency to adapt to the modifications of the terrain and achieve stability [45]. It has been found that the heart rate rises with the increase in the demands of uphill running [57]. In the current study, the correlation coefficient between the participants’ mean heart rate and altitude and that between the mean heart rate and gradient were positive. On the other hand, the correlation between the mean route speed and altitude was negative, whereas the correlation between the participants’ mean speed and gradient was positive. The study results agree with those of other research showing that submaximal-level exercise at a medium altitude compared with a low altitude increases the heart rate [58,59] and that runners modify their running techniques to achieve optimal metabolic efficiency; when running uphill, a runner’s heart rate increases, while the step length decreases, and the step frequency increases [45,46]. In the current study, the mean difference in altitude between the routes in Palaio Faliro (by the sea) and those in Galatsi ranged between 158 and 177 m. Though both locations (Palaio Faliro and Galatsi) were classed as being at low altitude, the difference in altitude was enough to demonstrate a positive coefficient between the mean heart rate and altitude. This seems to be the first study to demonstrate a positive coefficient between the mean heart rate and altitude during running on routes with a relatively small difference in altitude. Further studies are necessary to establish whether relatively small differences in altitude can indeed elicit heart rate differences.
The current study showed that the participants’ heart rates (recorded every 20″) on all the routes studied were lower than the corresponding heart rates recorded in the stadium, which was at the greatest altitude amongst all the routes studied. Moreover, the lowest heart rate was recorded in the park by the sea, followed by the road by the sea, which were at the smallest altitudes amongst the routes studied (Table 4, Figure 6). Additionally, the highest mean speed of participants was recorded during the run on the road by the sea. These results further confirmed the aforementioned results obtained from the correlation between the participants’ mean heart rate and altitude. The above results further suggest that the presence of sea enhances the benefits offered by the greenery of a park. Under the constant threat of climate change and rising sea levels, in coastal areas, developing parks by the sea should be preferred over the flood susceptibility and vulnerability of building development [6].
Considering the effect of the route landscape on the participants’ heart rates (recorded every 50 m) without considering the effect of altitude can be “misleading”, as the results showed that the combined effect of route and altitude influenced the participants’ heart rates (Table 4, Figure 8). When considering the combined effect of route*altitude, the participants’ heart rates recorded on the roads increased in comparison to the corresponding participants’ heart rates in the stadium at the greatest altitude. The results of the current study suggested that road traffic possibly had a negative effect on the participants’ heart rates, since the altitude of all the road routes was lower than the stadium’s altitude. Higher amounts of pollutants (CO, CO2, HC, O3, and PM2.5) have been found on high-traffic urban roads than in urban green spaces; a significant correlation between the heart rate (RR interval) during running and CO concentration has also been reported [55]. The increase in the heart rate with CO levels is considered to be related to the greater physical effort required due to air pollution [55]. Although air pollution was not monitored in this study, it is possible that air pollution may have contributed to the greater heart rates of participants recorded during their run on the roads. Furthermore, in comparison to the participants’ heart rates in the stadium at the greatest altitude, the corresponding participants’ heart rates in the park by the sea at the lowest altitude were not affected, while the participants’ heart rates in the park were reduced. Urban planting has been found to reduce CO2 levels through the direct sequestration and accumulation of carbon by trees and shrubs [6]. Urban planting has also been found to improve microclimate and air pollution dispersion, as well as human thermal comfort [60]. Zhang et al. [61] note that the air temperature is the most important factor affecting outdoor thermal comfort. Furthermore, tree features such as height, green coverage, shape, and crown permeability can influence the thermal environment and thus human thermal comfort [62]. Possibly, the presence of plants improved thermal comfort in the park, causing reduced heart rate. However, the heart rates recorded in the park by the sea were not reduced compared with the stadium. The plant composition and tree size in both park locations varied, which may have had a different effect on thermal comfort; the plants in the park were mainly composed of large-sized coniferous and broadleaved trees, whereas the plants in the park by the sea were mainly composed of medium-sized and less large-sized broadleaved trees. The latter results are difficult to conclusively interpret without determining the park’s vegetation effect on thermal comfort on each route, which was not measured in the current study. Additional study is necessary to determine the effect of thermal comfort on the heart rate.
The change in gradient along the routes affected the participants’ heart rates (Table 4, Figure 9). The mean gradient of all routes studied was shallow; however, in places, the gradient was slightly greater than shallow or moderate (i.e., >10%) [63]. The results showed that routes at 5–7.99% and ≥12% increased the heart rate irrespectively of the route landscapes. Furthermore, the studied routes barely contained gradients between 8.00 and 11.99%; thus, the results showed no significance in the participants’ heart rates recorded. These results agree with the results of other researchers [46], who showed that people’s heart rates increased with the gradient.
Though the current study showed that both altitude and gradient affect the heart rate, it must be noted that for an individual route, the altitude remains constant, while the gradient changes when running in opposite directions on the same route. Therefore, both altitude and gradient are independent variables determined by “where” the runner runs and not by the surroundings of the routes, which can changed, such as the absence of trees on the road. Introducing trees on roads to support runners’ health would concomitantly reduce the adverse effects of climate change, thus supporting the health of the wider population.
4.2. Questionnaire Survey
4.2.1. Participant Details
Only a very small amount of participants (2.2%) stated they did not run. As the questionnaire aimed to study people’s preferences for different types of routes for running within the city, it was mainly answered by people who ran within the city (97.8%) and that ran regularly, at least once a week (72.9%); therefore, the results presented herein are representative of people who run. The participants’ occupation, background, and level of education comprised different relatively homogeneously distributed groups. Though the questionnaire was representative of people from both genders, regarding the variable of age, the majority of the participants were <35 years. The latter results of the study suggest that mostly people younger in age run (<35 years). Several authors state that age and educational level influence physical activity motivation [64]. In addition, features present in the urban environment, such as public toilets, have been found to be conducive for running, particularly in the older age groups (65+) [65]; within Athens, public toilets are sparse, which perhaps may deter older people from running. Further research is necessary to establish whether a larger sample size would produce a more representative sample for the variable of age. Furthermore, the majority of the participants were not parents; these findings were expected, as most participants’ age was <35 years, and the results agree with EU data stating that the median age of women at childbirth in 2019 was 31.4 years [66].
4.2.2. Route Preference
Amongst the six routes studied, over half of the respondents to the questionnaire survey would have preferred to run on a route within a park by the sea, followed by a route within a park, which was selected by approximately a quarter of the respondents; these results were confirmed by the response from the majority of the respondents, who stated they would have liked to run on these routes very much (76.7% and 67.1%, respectively) (Figure 11). A relatively high percentage of respondents also stated they would have liked to run on roads with street trees very much (43.7%). In contrast, a high percentage of respondents stated they would not have liked or would have liked little to run on a road without street trees (59.4% and 35.5%, respectively) (Figure 11). This study agrees with other researchers [19,22,24], who also found that individuals preferred green routes to non-green routes. Running on green routes enhances an individual’s physical activity [19,22,24] and improves both the individual’s physical and mental health [27,28]. Moreover, the field study of the current research, as already mentioned above, showed a negative association between urban green space exposure and heart rate. Stressful conditions during running, such as traffic noise, air pollution, and unexpected movements of pedestrians in an urban setting, can counteract the emotional benefits of running [43].
Most respondents believed that both green spaces and green spaces by the sea had a positive effect on exercise performance (76.3% and 71.5%, respectively) (Figure 12 and Figure 13). These results were confirmed by the majority of respondents, who stated that they would have felt positive emotions (joy and calm; “very much” or “much”) during a run either in a park or in a park by the sea (Figure 14). The respondents also stated that they would have felt positive emotions (joy; “much”) during a run on a road with street trees or on a road by the sea; however, they also stated that they would have felt anxiety (“little”) (Figure 14); anxiety was selected relatively less in relation to roads by the sea. During a run in a stadium, most respondents stated that they would have felt emotions such as calm (“moderate”) and joy (“little”). On the other hand, the majority of the respondents stated that they would have felt anxiety (“very much”) and anger (“little”) during a run on a road without street trees. The above results also agreed with the results of the field study in the current research, which showed that higher heart rates were generated on routes with no trees than on routes with trees or greenery. It has been found that running or even walking in a green area or in areas by the sea creates peace, joy, and pleasure in relation to running in the urban fabric [14,29,30,67].
Well-being can be achieved by engaging in and enjoying everyday activities [68]. In the current study, the result indicating that positive emotions (calm and joy) during a run in a park or in a park by the sea compared with feeling anxiety (“very much”) and anger (“little”) during a run on a road without street trees also suggests that the “route landscape” affects experiencing “flow”. Flow refers to the “optimal experience” during which the attention of a person is fully invested in performing a specific task and both the mind and body work harmoniously, with the person functioning at his or her fullest capacity [69]. Frequent flow experience is associated with high levels of well-being [68]. In this study, it seems that people could have achieved “flow” while running in a park and in a park by the sea, thus achieving high levels of well-being. More detailed studies are proposed to confirm the effect of “route landscapes” on people achieving flow experience.
The results of the comparison in pairs of the different routes studied showed that the most preferred routes selected by the respondents for running were in a park by the sea, followed by a route in a park and a route on a road by the sea, while the least preferred route was a road without street trees (Figure 15). The results also showed that the respondent’s preference between the road with street trees or the stadium was similar. The results showing the first and second choices of routes for running amongst the six routes selected for the study agreed with the paired-route comparison results; thus, the first-choice route for running was a route in a park by the sea, followed by a route in a park, and the second choice was a route in a park (Figure 16). As already discussed above, in the current field study, the participants generated the lowest heart rates in the park with views of the sea. The beneficial effects of the sea on the health of individuals are highlighted in the studies by Pasanen et al. [70] and Britton et al. [40]. People prefer paths where there are trees, paths that are green, and paths that are by the sea in relation to the urban fabric, where pollution and noise prevail. Fresh air [11] and noise reduction [13] improve the quality of the urban environment [12].
5. Conclusions
Physical activity plays a pivotal role in supporting human health and well-being within cities. Running is one of the most popular activities performed outdoors in urban areas. The benefits of green and blue areas on human well-being are documented; however, detailed information on the landscape characteristics of routes for running that support human health and well-being is limited. This study examined the impact of six routes with different landscape characters on the heart rate and speed of runners, as well as their perceptions. The study considered factors that could affect the heart rate, such as the presence of green and blue areas, altitude, and gradient. More specifically, the “route landscapes” studied were a running track within a stadium, a road without street trees, a road with street trees, a path within an urban park with large-sized coniferous and broadleaved trees, a path within an urban park with medium-sized broadleaved trees and views of the sea, and a road by the sea.
Overall, the results of the questionnaire survey were confirmed by the results of the field study undertaken. The heart rates of the runners were greater during the run on the routes that contained no trees (i.e., the stadium and the road with no trees). Amongst the studied routes, the presence of the sea, as well as green (particularly trees), seemed to reduce the heart rates of the runners. Even the presence of street trees on the road reduced the runners’ heart rates. Both the heart rates and speeds of runners were influenced by the difference in altitude and gradient of the studied routes. The highest mean speeds of the participants were recorded during the run on the road by the sea at the smallest altitude. In general, increases in altitude and gradient caused an increase in the heart rate. The participants of the survey would have preferred to run in an urban park by the sea and in an urban park with large-sized trees and stated that they would have felt positive emotions (calmness and joy) during a run on a route in a park or in a park by the sea. Most participants stated a dislike to run on a road without street trees and expressed that they would have felt anxiety and anger (“little”) during a run on a road without street trees. It must be noted that the above findings have wider implications, as they support climate change reduction, which would benefit not just the runners’ but the city population’s health.
This study is in favor of developing routes for running outdoors in parks with large-sized coniferous and broadleaved trees, where possible combined with the presence of the sea, to increase benefits during running, such as reduced heart rate and the creation of positive emotions. Further research is proposed to examine the effect of different vegetation types on the microclimate and, in particular, on the thermal comfort and heart rate along running routes. The outcomes presented in this study could facilitate the design of outdoor routes for running and in parallel contribute to mitigating the effects of climate change.
Author Contributions
Conceptualization, A.T.P.; methodology, A.T.P. and M.C.; formal analysis, A.T.P., C.M. and M.C.; investigation, A.T.P. and M.C.; data curation, A.T.P., M.C. and C.M.; writing—original draft preparation, A.T.P. and M.C.; writing—review and editing, A.T.P. and C.M.; visualization, A.T.P. and M.C.; supervision, A.T.P. All authors have read and agreed to the published version of the manuscript.
Funding
This research received no external funding.
Institutional Review Board Statement
The study was approved by the Committee of Ethics and Deontology of the Agricultural University of Athens, in conductance to the regulation of principles and operation (approval code:22/26.04.2021).
Informed Consent Statement
Informed consent was obtained from all subjects involved in the study.
Acknowledgments
We would like to thank all participants that contributed to our study. Special thanks are expressed to all participants of the field study who ran the six different routes studied.
Conflicts of Interest
The authors declare no conflict of interest.
References
- Costello, A.; Abbas, M.; Allen, A.; Ball, S.; Bell, S.; Bellamy, R.; Friel, S.; Groce, N.; Johnson, A.; Kett, M.; et al. Managing the health effects of climate change. Lancet 2009, 373, 1693–1733. [Google Scholar] [CrossRef] [PubMed]
- United Nations. Population, Development and the Environment; United Nations: New York, NY, USA, 2013. [Google Scholar]
- Ritchie, H. Urbanization. 2018. Available online: http://ourworldindata.org/urbanization (accessed on 17 July 2020).
- Li, H.; Meier, F.; Lee, X.; Chakraborty, T.; Liu, J.; Schaap, M.; Sodoudi, S. Interaction between urban heat island and urban pollution island during summer in Berlin. Sci. Total Environ. 2018, 636, 818–828. [Google Scholar] [CrossRef] [PubMed]
- Ulpiani, G. On the linkage between urban heat island and urban pollution island: Three-decade literature review towards a conceptual framework. Sci. Total Environ. 2021, 751, 141727. [Google Scholar] [CrossRef] [PubMed]
- Younger, M.; Morrow-Almeida, H.R.; Vindigni, S.M.; Dannenberg, A.L. The Built Environment, Climate Change, and Health Opportunities for Co-Benefits. Am. J. Prev. Med. 2008, 35, 517–526. [Google Scholar] [CrossRef]
- Heidari, L.; Younger, M.; Chandler, G.; Gooch, J.; Schramm, P. Integrating Health Into Buildings of the Future. J. Sol. Energy Eng. 2017, 139, 010802. [Google Scholar] [CrossRef] [PubMed]
- Pendola, R.; Gen, S. BMI, auto use, and the urban environment in San Francisco. Health Place 2007, 13, 551–556. [Google Scholar] [CrossRef]
- McMichael, A.J.; Neira, M.; Bertollini, R.; Campbell-Lendrum, D.; Hales, S. Climate change: A time of need and opportunity for the health sector. Lancet 2009, 374, 2123–2125. [Google Scholar] [CrossRef]
- Rydin, Y.; Bleahu, A.; Davies, M.; Dávila, J.D.; Friel, S.; De Grandis, G.; Groce, N.; Hallal, P.C.; Hamilton, I.; Howden-Chapman, P.; et al. Shaping cities for health: Complexity and the planning of urban environments in the 21st century. Lancet 2012, 379, 2079–2108. [Google Scholar] [CrossRef]
- Selmi, W.; Weber, C.; Riviere, E.; Blond, N.; Mehdi, L.; Nowak, D. Air pollution removal by trees in public green spaces in Strasbourg city, France. Urban For. Urban Green. 2016, 17, 182–201. [Google Scholar] [CrossRef]
- Bolund, P.; Hunhammar, S. Ecosystem services in urban areas. Ecol. Econ. 1999, 29, 239–301. [Google Scholar] [CrossRef]
- Dzhambov, A.M.; Dimitrova, D.D. Green spaces and environmental noise perception. Urban For. Urban Green 2015, 14, 1000–1008. [Google Scholar] [CrossRef]
- Kuo, F.E.; Bacaicoa, M.; Sullivan, W.C. Transforming inner-city landscapes: Trees, sense of safety and preference. Environ. Behav. 1998, 30, 28–59. [Google Scholar] [CrossRef]
- Morris, N. Health, Well-Being and Open Space: A Literature Review; OPENspace: Edinburgh, UK, 2003. [Google Scholar]
- Ambrey, C.L. Greenspace, physical activity and well-being in Australian capital cities: How does population size moderate the relationship. Public Health 2016, 133, 38–44. [Google Scholar] [CrossRef] [PubMed]
- Arnberger, A. Urban densification and recreational quality of public urban green spaces. A Viennese case study. Sustainability 2012, 4, 703. [Google Scholar] [CrossRef]
- Lee, A.C.K.; Jordan, H.C.; Hosley, J. Value of urban green spaces in promoting healthy living and wllbeing: Prospects for planning. Risk Manag. Healthc. Policy 2015, 8, 131–137. [Google Scholar] [CrossRef] [PubMed]
- Barton, H. Land use planning and health and well—Being. Land Use Policy 2009, 26S, S115–S123. [Google Scholar] [CrossRef]
- Zhang, L.; Zhou, S.; Kwan, M.-P.; Chen, F.; Lin, R. Impacts of individual daily greenspace exposure on health based on individual activity space and structural equation modeling. Int. J. Environ. Res. Public Health 2018, 15, 2323. [Google Scholar] [CrossRef] [PubMed]
- Prettry, J.; Peacock, J.; Sellens, M.; Griggin, M. The mental and physical health outcomes of green exercise. Int. J. Environ. Res. Public Health 2005, 15, 319–337. [Google Scholar] [CrossRef]
- Pretty, J.; Peacock, J.; Hine, R.; Sellens, M.; South, N.; Griffin, M. Green exercise in the UK countryside: Effects on health and psychological well-being and implications for policy and planning. J. Environ. Plan. Manag. 2007, 50, 211–231. [Google Scholar] [CrossRef]
- Rhodes, R.E.; Nasuti, G. Trends and changes in research on the psychology of physical activity across 20 years: A quantitative analysis of 10 journals. Prev. Med. 2011, 53, 17–23. [Google Scholar] [CrossRef]
- Kaczynski, A.T.; Potwarka, L.R.; Smale, B.J.A.; Mark, E.H. Association of Parkland Proximity with Neighborhood and Park-based Physical Activity: Variations by Gender and Age. Leis. Sci. 2009, 31, 174–191. [Google Scholar] [CrossRef]
- Giles-Corti, B.; Broomhall, M.H.; Knuiman, M.; Collins, C.; Douglas, K.; Ng, K.; Lange, A.; Donovan, R.J. Increasing walking. How important is distance to, attractiveness, and size of public open space? Am. J. Prev. Med. 2005, 28, 169–176. [Google Scholar] [CrossRef] [PubMed]
- Schipperijn, J.; Bentsen, P.; Troelsen, J.; Toftager, M.; Stigsdotter, U.K. Associations between physical activity and characteristics of urban green space. Urban For. Urban Green. 2013, 12, 109–116. [Google Scholar] [CrossRef]
- Kondo, M.C.; Fluehr, J.M.; Mckeon, T.; Branas, C.C. Urban Green Space and its impact on human health. Int. J. Environ. Res. Public Health 2018, 15, 445. [Google Scholar] [CrossRef] [PubMed]
- Richardson, E.A.; Pearce, J.; Mitchell, R.; Kingham, S. Role of physical activity in the relationship between urban green space and health. Public Health 2013, 127, 318–324. [Google Scholar] [CrossRef]
- Song, C.; Ikei, H.; Park, B.-J.; Lee, J.; Kagawa, T.; Miyazaki, Y. Psychological benefits of walking through forest areas. Int. J. Environ. Res. Public Health 2018, 15, 2804. [Google Scholar] [CrossRef]
- Song, C.; Ikei, H.; Park, B.-J.; Lee, J.; Kagawa, T.; Miyazaki, Y. Effects of walking in a forest on young women. Int. J. Environ. Res. Public Health 2019, 16, 229. [Google Scholar] [CrossRef]
- Sellers, C.E.; Grant, P.M.; Ryan, C.G.; O’ Kane, C.; Raw, K.; Conn, D. Take a walk in the park? A cross-over pilot trial comparing brisk walking in two different environments: Park and urban. Prev. Med. 2012, 55, 438–443. [Google Scholar] [CrossRef]
- de Brito, J.N.; Pope, Z.C.; Mitchell, N.R.; Schneider, I.E.; Larson, J.M.; Horton, T.H.; Pereira, M.A. Changes in psychological and cognitive outcomes after green versus suburban walking: A pilot crossover study. Int. J. Environ. Res. Public Health 2019, 16, 2894. [Google Scholar] [CrossRef]
- Koselka, E.P.D.; Weidner, L.C.; Minasov Berman, M.G.; Leonard, W.R.; Santoso, M.V.; de Brito, J.N.; Pope, Z.C.; Pereira, M.A.; Horton, T.H. Walking Greem: Developing an evidence base for nature prescriptions. Int. J. Environ. Res. Public Health 2019, 16, 4338. [Google Scholar] [CrossRef]
- Burkart, K.; Meier, F.; Schneider, A.; Breitner, S.; Canario, P.; Alcoforado, M.J.; Scherer, D.; Endicher, W. Modification of heat-related mortality in an elderly urban population by vegetation (urban green) and proximity to water (urban blue): Evidence from Lisbon, Portugal. Environ. Health Perspect. 2016, 124, 927–934. [Google Scholar] [CrossRef] [PubMed]
- Garrett, N.; Smith, M.; Schluter, P.J.; Bollard-Breen, B. Coastal accessibility and availability for physical activity: A cross-sectional assessment in New Zealand adults. Open J. Prev. Med. 2016, 6, 273–286. [Google Scholar] [CrossRef][Green Version]
- Garrett, J.K.; White, M.P.; Juang, J.; Ng, S.; Hui, Z.; Leung, C.; Tse, L.A.; Fung, F.; Elliott, L.R.; Depledge, M.H.; et al. Urban blue space and health and well—being in Hong Kong: Results from a survey of older adults. Health Place 2019, 55, 100–110. [Google Scholar] [CrossRef] [PubMed]
- Dempsey, S.; Devine, M.T.; Gillespie, T.; Lyons, S.; Nolan, A. Coastal blue space and depression in older adults. Health Place 2018, 54, 110–117. [Google Scholar] [CrossRef]
- Dzhambov, A.M.; Markevych, I.; Hartig, T.; Tilov, B.; Arabadzhiev, Z.; Stoyanov, D.; Gatseva, P.; Dimitrova, D.D. Multiple pathways link urban green—and blue—space to mental health in young adults. Environ. Res. 2018, 166, 223–233. [Google Scholar] [CrossRef]
- Gascon, M.; Zijema, W.; Vert, C.; White, M.P.; Nieuwenhuijsen, M.J. Outdoor blue spaces, human health and well-being: A systematic review of qualitative studies. Int.J. Hyg. Environ. Health 2017, 220, 1207–1221. [Google Scholar] [CrossRef]
- Britton, E.; Kindermann, G.; Domegan, C.; Carlin, C. Blue care: A systematic review of blue space interventions fore health and wellbeing. Health Promot. Int. 2020, 35, 50–69. [Google Scholar] [CrossRef]
- Volker, S.; Kistemann, T. The impact of blue space on human health and well—being—Salutogenetic health effects of inland surface waters: A review. Int. J. Hyg. Environ. Health 2011, 214, 449–460. [Google Scholar] [CrossRef]
- Shashank, A.; Schuurman, N.; Copley, R.; Lear, S. Creation of a rough runnability index using an affordance-based framework. Environ. Plan B Urban Anal. City Sci. 2022, 49, 321–334. [Google Scholar] [CrossRef]
- Bodin, M.; Hartig, T. Does the outdoor environment matter for psychological restoration gained through running? Psychol. Sport. Exerc. 2003, 4, 141–153. [Google Scholar] [CrossRef]
- Ettema, D. Runnable Cities: How Does the Running Environment Influence Perceived Attractiveness, Restorativeness, and Running Frequency? Environ. Behav. 2016, 48, 1127–1147. [Google Scholar] [CrossRef]
- Exel, J.; Mateus, N.; Gonçalves, B.; Abrantes, C.; Calleja-González, J.; Sampaio, J. Entropy Measures Can Add Novel Information to Reveal How Runners’ Heart Rate and Speed Are Regulated by Different Environments. Front. Psychol. 2019, 10, 1278. [Google Scholar] [CrossRef] [PubMed]
- Padulo, J.; Powell, D.; Milia, R.; Ardigo, L.P. A Paradigm of Uphill Running. PLoS ONE 2013, 8, e69006. [Google Scholar] [CrossRef]
- Burtscher, M.; Nachbauer, W.; Baumgartl, P.; Philadelphy, M. Benefits of training at moderate altitude versus sea level training in amateur runners. Eur. J. Appl. Physiol. Occup. Physiol. 1996, 74, 558–563. [Google Scholar] [CrossRef]
- Map data©2022 Google.
- Imagery©2022 TerraMetrics, Map Data©2022 Google.
- Yamazaki, D.; Ikeshima, D.; Tawatari, R.; Yamaguchi, T.; O’Loughlin, F.; Neal, J.C.; Sampson, C.C.; Kanae, S.; Bates, P.D. A high accuracy map of global terrain elevations. Geophys. Res. Lett. 2017, 44, 5844–5853. [Google Scholar] [CrossRef]
- Raundebush, S.; Bryk, A. Hierarchical Linear Models. Applications and Data Analysis Methods, 2nd ed.; Sage Publications: London, UK, 2002. [Google Scholar]
- R Core Team. R: A Language and Environment for Statistical Computing; R Foundation for Statistical Computing: Vienna, Austria, 2012; Available online: http://www.r-project.org/ (accessed on 27 August 2018).
- Bates, D.; Mächler, M.; Bolker, B.M.; Walker, S.C. Fitting linear mixed- effects models using lme4. J. Stat. Softw. 2015, 67, 1. [Google Scholar] [CrossRef]
- Veal, A.J. Research Methods for Leisure and Tourism, A Practical Guide, 3rd ed.; Prentice Hall: Edinburgh, UK, 2006. [Google Scholar]
- Laurino, M.; Lomonaco, T.; Bellagambi, F.G.; Ghimenti, S.; Messeri, A.; Morabito, M.; Marrucci, E.; Pratali, L.; Trivella, M.G. Sport in Town: The Smart Healthy ENV Project, a Pilot Study of Physical Activity with Multiparametric Monitoring. Int. J. Environ. Res. Public Health 2021, 18, 2432. [Google Scholar] [CrossRef] [PubMed]
- Roe, J.; Mondschein, A.; Neale, C.; Barnes, L.; Boukhechba, M.; Lopez, S. The Urban Built Environment, Walking and Mental Health Outcomes Among Older Adults: A Pilot Study. Front. Public Health 2020, 8, 575946. [Google Scholar] [CrossRef]
- Creagh, U.; Reilly, T.; Nevill, A.M. Heart rate response to “off-road” running events in female athletes. Br. J. Sports Med. 1998, 32, 34–38. [Google Scholar] [CrossRef] [PubMed]
- Weston, A.R.; Mackenzie, G.; Tufts, M.A.; Mars, M. Optimal time of arrival for performance at moderate altitude (1700 m). Med. Sci. Sports Exerc. 2001, 33, 298–302. [Google Scholar] [CrossRef]
- Bärtsch, P.; Gibbs, J.S.R. Effect of altitude on the heart and the lungs. Contempoary Rev. Cardiovasc. Med. 2007, 19, 2191–2202. [Google Scholar] [CrossRef] [PubMed]
- Gatto, E.; Buccolieri, R.; Aarrevaara, E.; Ippolito, F.; Emmanuel, R.; Perronace, L.; Santiago, J.L. Impact of Urban Vegetation on Outdoor Thermal Comfort: Comparison between a Mediterranean City (Lecce, Italy) and a Northern European City (Lahti, Finland). Forests 2020, 11, 228. [Google Scholar] [CrossRef]
- Zhang, L.; Wei, D.; Hou, Y.; Du, J.; Liu, Z.; Zhang, G.; Shi, L. Outdoor Thermal Comfort of Urban Park—A Case Study. Sustainability 2020, 12, 1961. [Google Scholar] [CrossRef]
- De Abreu-Harbich, L.V.; Labaki, L.C.; Matzarakis, A. Effect of tree planting design and tree species on human thermal comfort in the tropics. Landsc. Urban Plan. 2015, 138, 99–109. [Google Scholar] [CrossRef]
- Lemire, M.; Lonsdorfer-Wolf, E.; Isner-Horobeti, M.-E.; Kouassi, B.Y.L.; Geny, B.; Favret, F.; Dufour, S.P. Cardiorespiratory Responses to Downhill Versus Upihill Running in Endurance Athletes. Res. Q. Exerc. Sport 2018, 89, 511–517. [Google Scholar] [CrossRef] [PubMed]
- Malchrowicz-Mosko, E.; León-Guereño, P.; Tapia-Serrano, M.A.; Sánchez-Miguel, P.A.; Waskiewicz, Z. What Encourages Physically Inactive People to Start Running? An Analysis of Motivations to Participate in Parkrun and City Trail in Poland. Front. Public Health 2020, 8, 581017. [Google Scholar] [CrossRef] [PubMed]
- Schuurman, N.; Rosenkrantz, L.; Lear, S.A. Environmental Preferences and Concerns of Recreational Road Runners. Int. J. Environ. Res. Public Health 2021, 18, 6268. [Google Scholar] [CrossRef] [PubMed]
- European Union. Eurostat Reagional Yearbook, 2021 ed.; Publications Office of the European Union: Luxemburgh, 2021; p. 206. [Google Scholar]
- Sallis, J.F.; Owen, N. Ecological models of health behabiour. In Health Behaviour and Health Education:Theory, Research and Practice, 3rd ed.; Glanz, K., Rimer, B.K., Lewis, F.M., Eds.; Jossey-Bass: San Francisco, CA, USA, 2002; pp. 462–484. [Google Scholar]
- Tse, D.C.K.; Nakamura, J.; Csikszentmihalyi, M. Living well by “flowing” well: The indirect effect of autotelic personality on well-being through flow experience. J. Posit. Psychol. 2021, 16, 310–321. [Google Scholar] [CrossRef]
- Csikszentmihalyi, M. Flow and the Foundations of Positive Psychology, The Collective Works of Mihaly Csikszentmihalyi; Springer: Claremont, CA, USA, 2014. [Google Scholar]
- Pasanen, T.P.; White, T.P.; Wheeler, B.W.; Garrett, J.K.; Elliott, L.R. Neighbourhood blue space, health and wellbeing: The mediating role of different types of physical activity. Environ. Int. 2019, 131, 105016. [Google Scholar] [CrossRef] [PubMed]
Publisher’s Note: MDPI stays neutral with regard to jurisdictional claims in published maps and institutional affiliations. |
© 2022 by the authors. Licensee MDPI, Basel, Switzerland. This article is an open access article distributed under the terms and conditions of the Creative Commons Attribution (CC BY) license (https://creativecommons.org/licenses/by/4.0/).