

Research on State Recognition Technology of Elevator Traction Machine Based on Modulation Feature Extraction


Abstract
1. Introduction
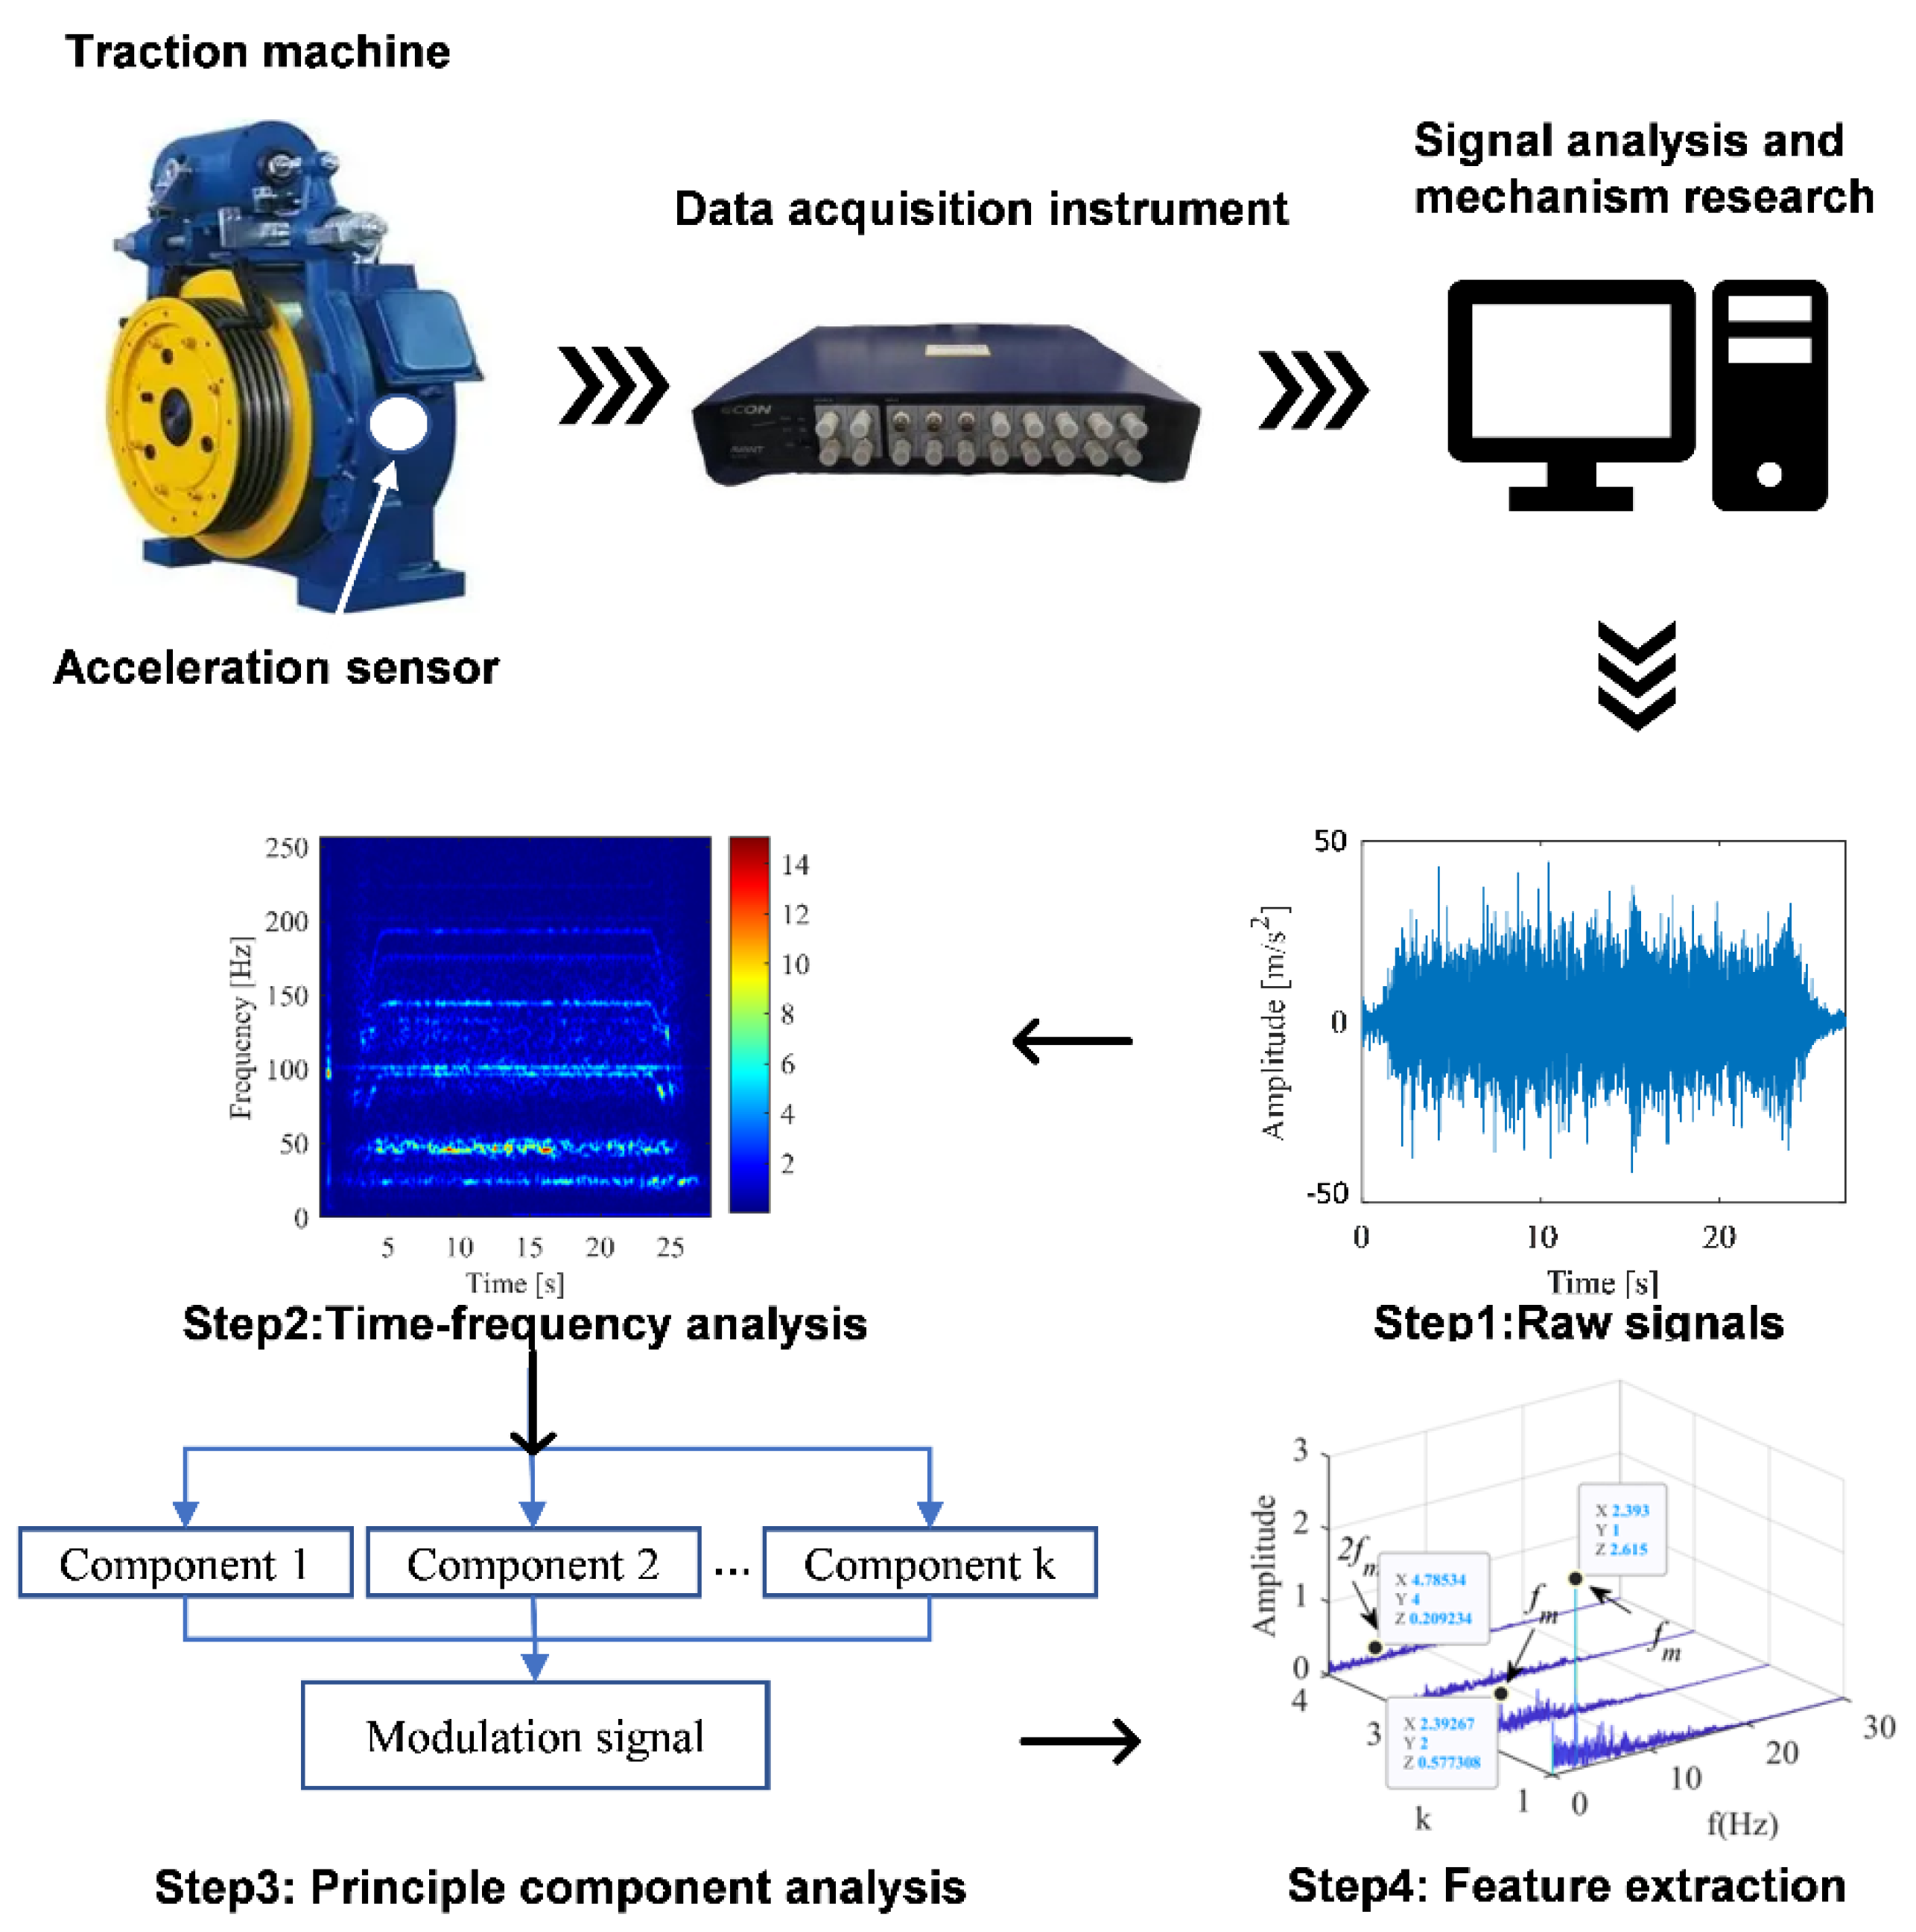
2. Methodology
2.1. DPCA Method
2.2. Elevator Traction Machine Parameters
2.3. Equipment Selection
2.4. Test Conditions
3. Case Analysis
3.1. Analysis of Influence of Elevator Running Speed on Main Engine Vibration
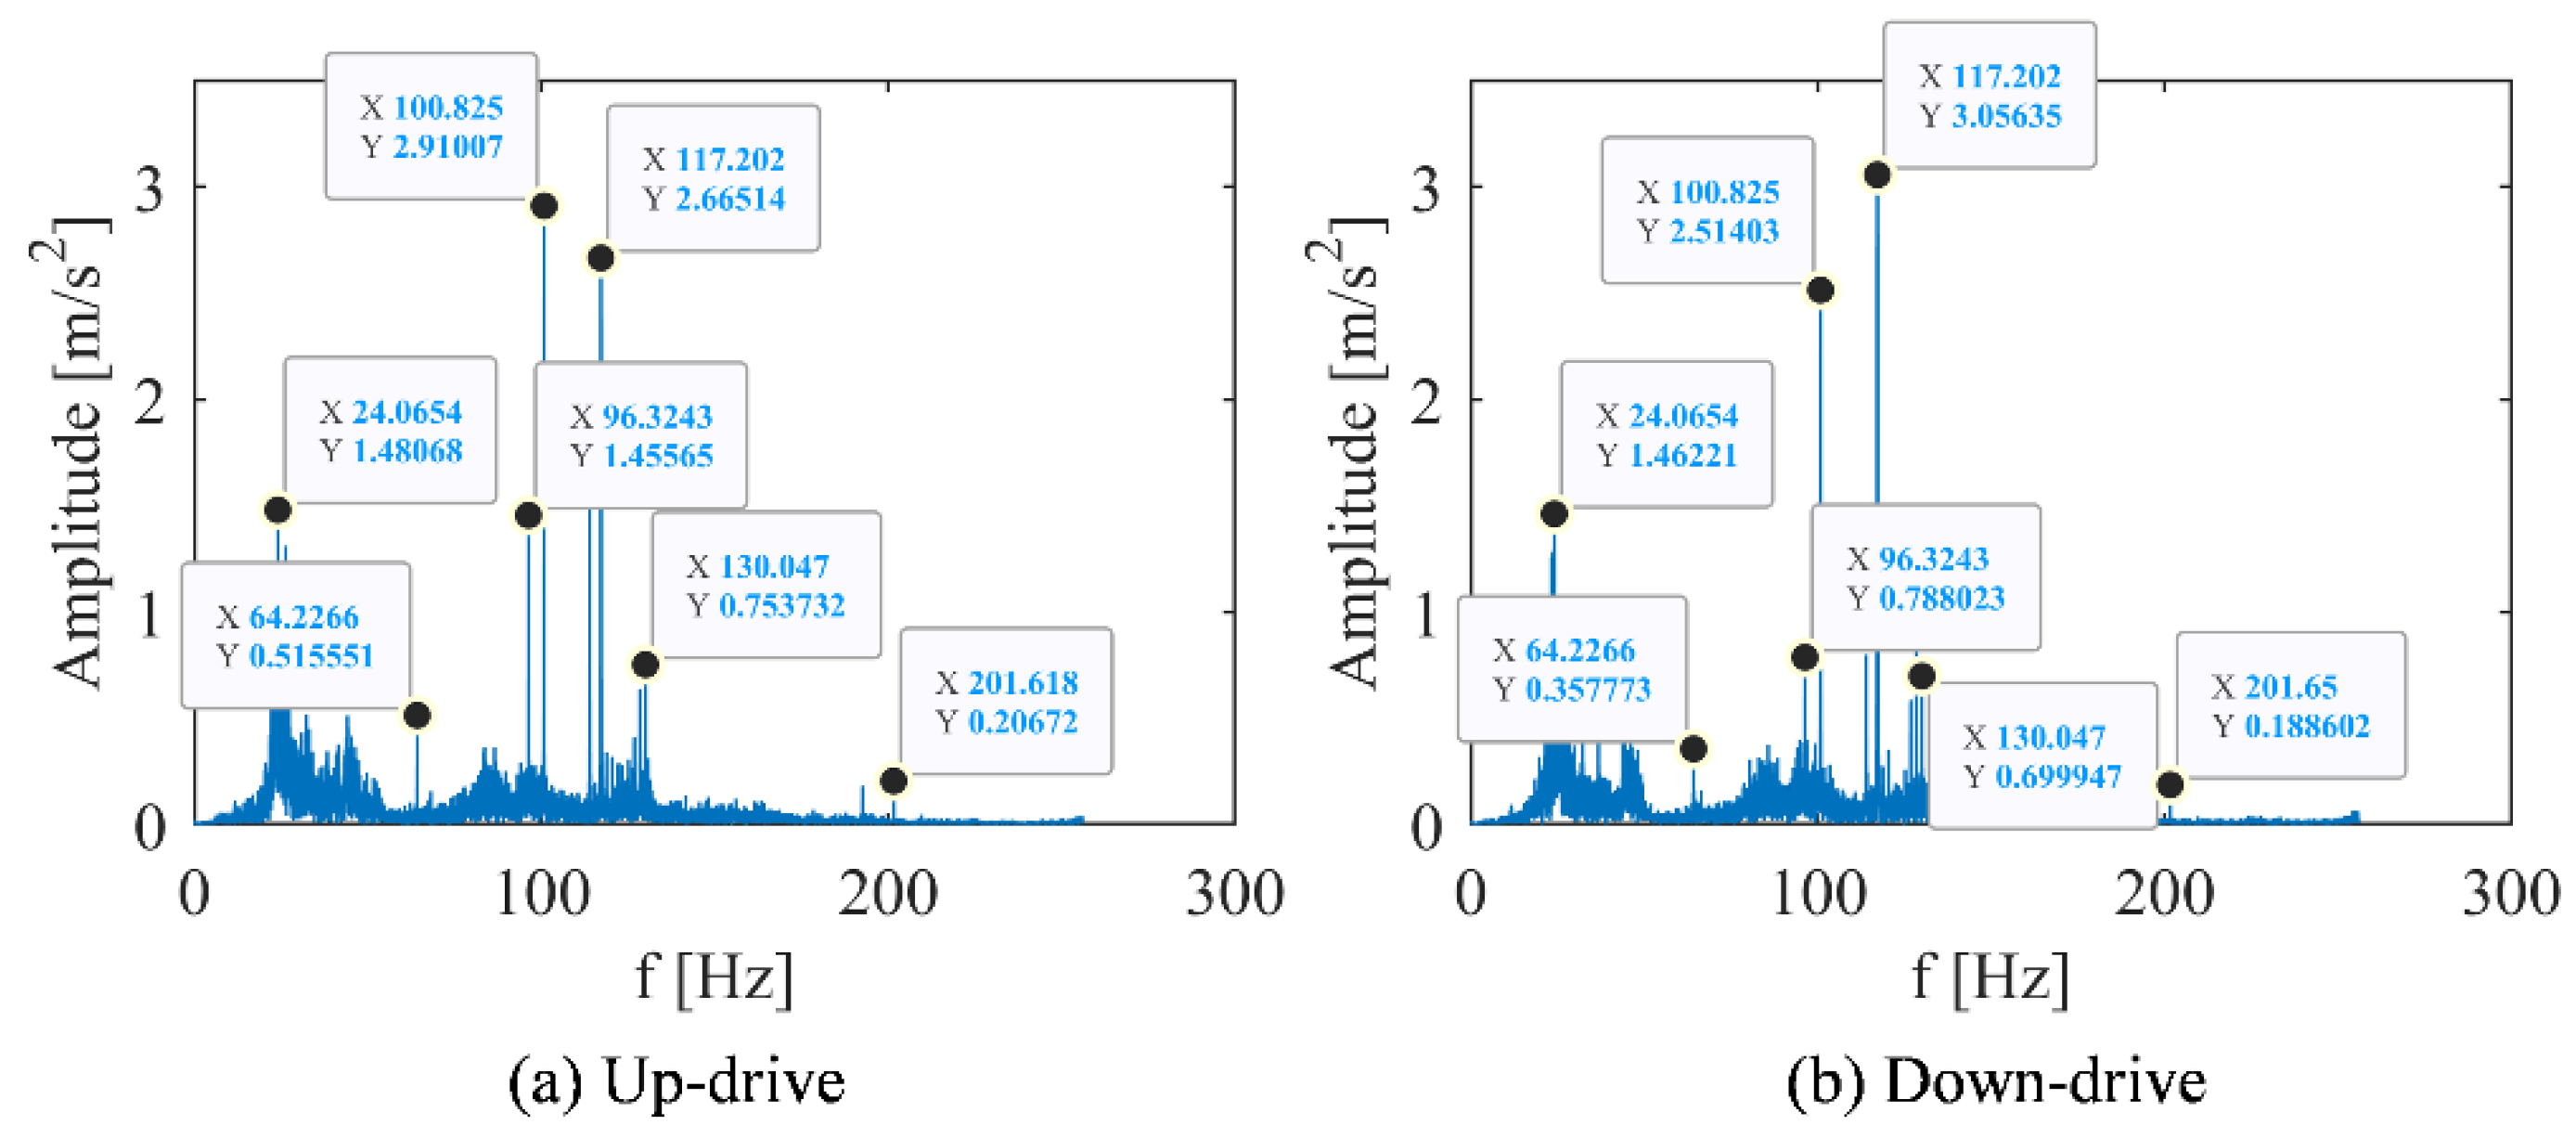
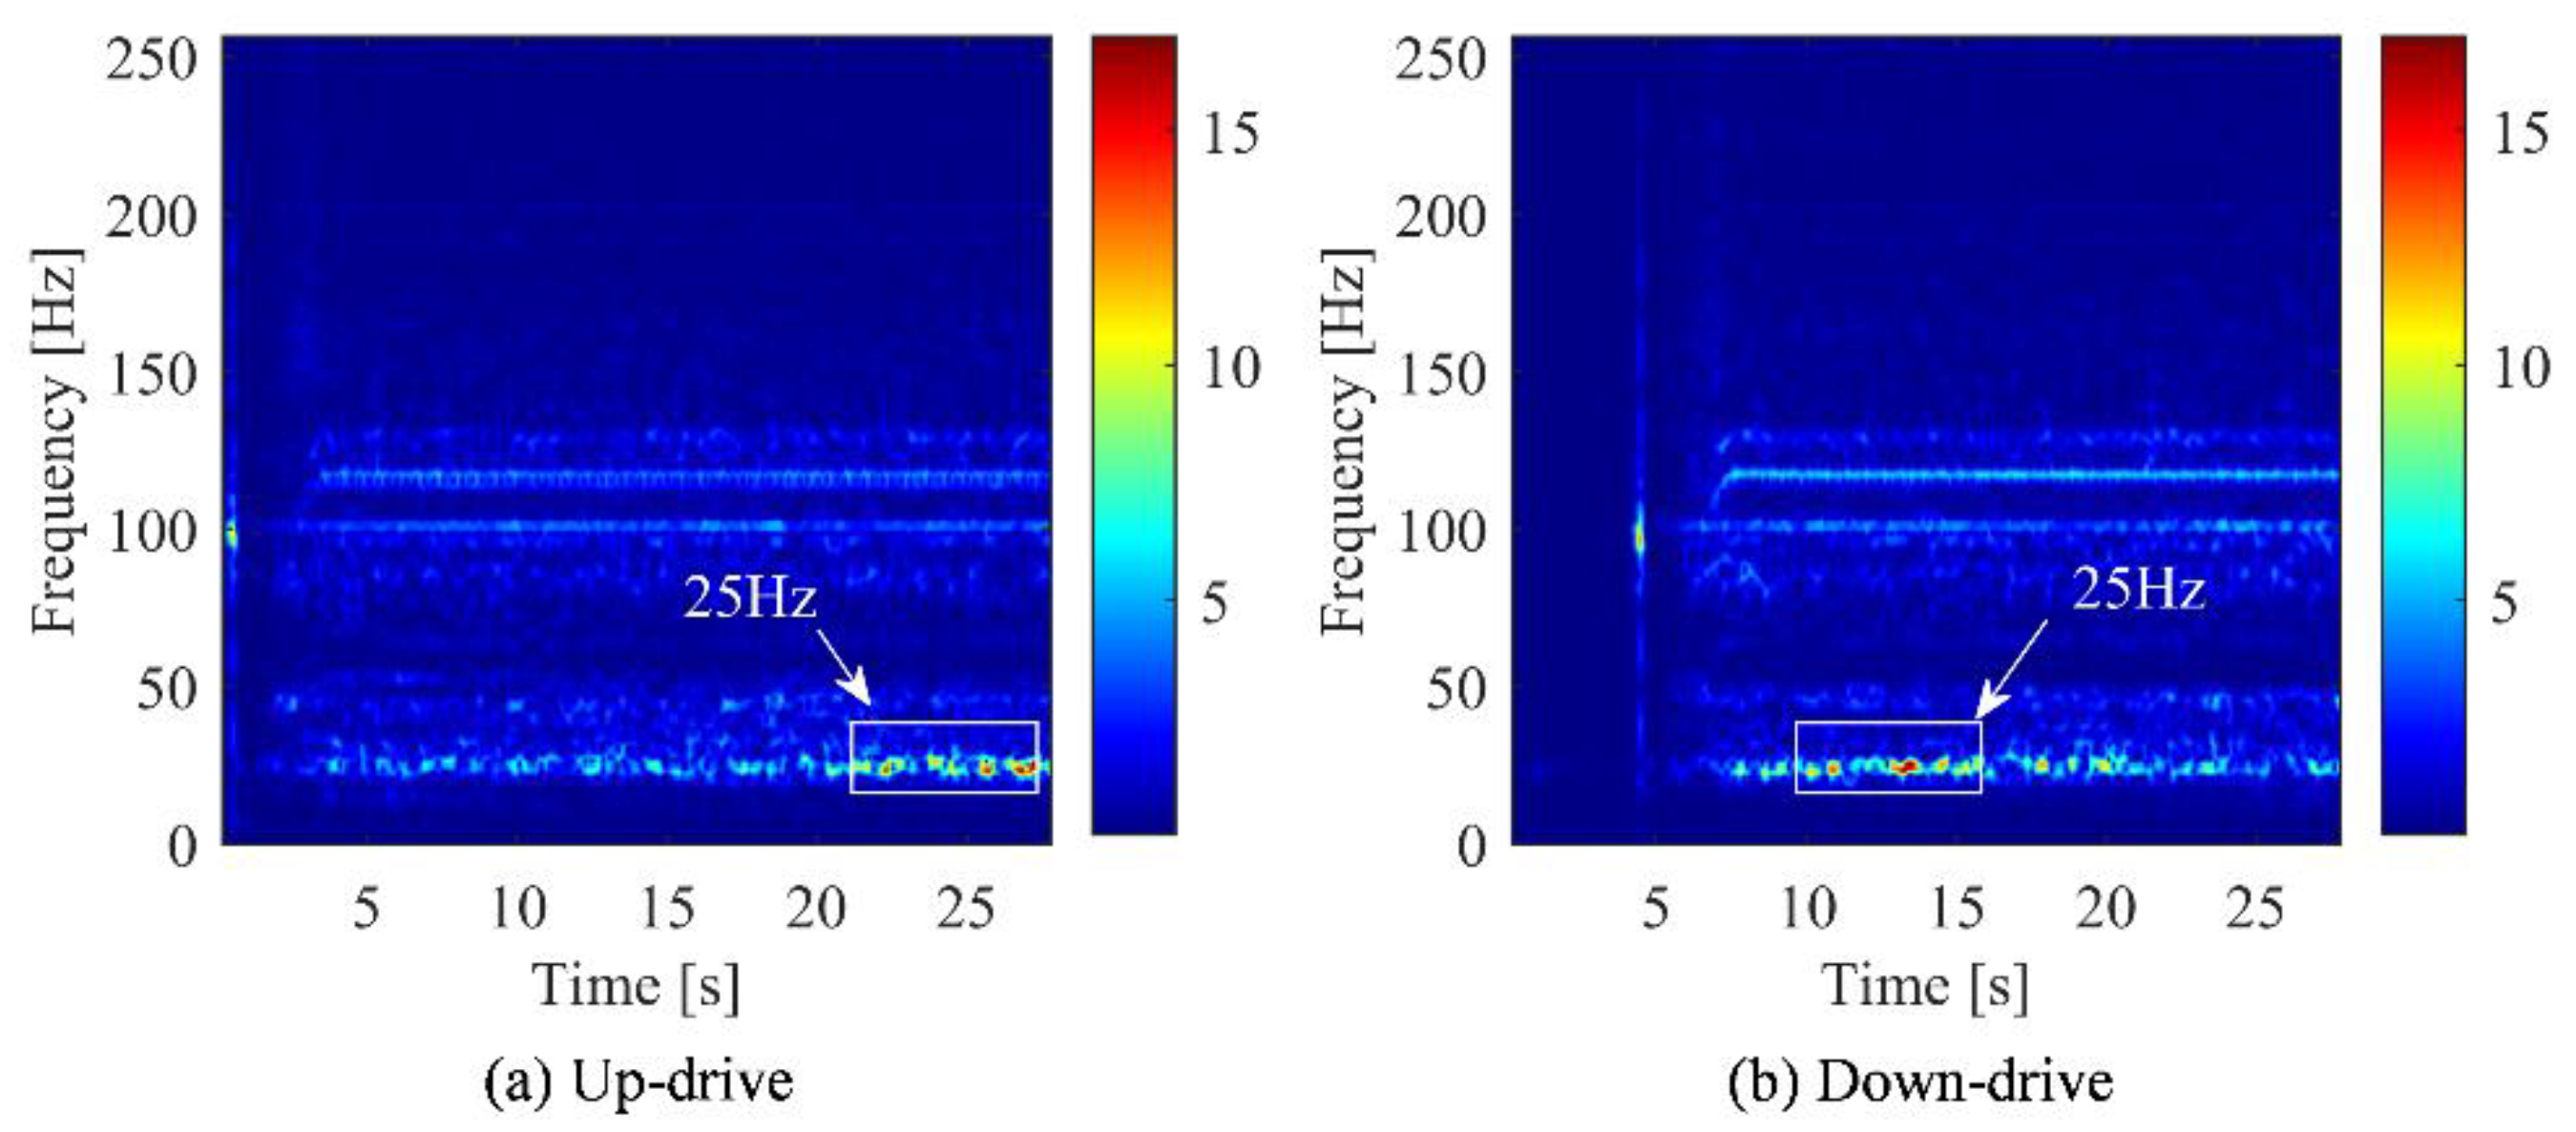
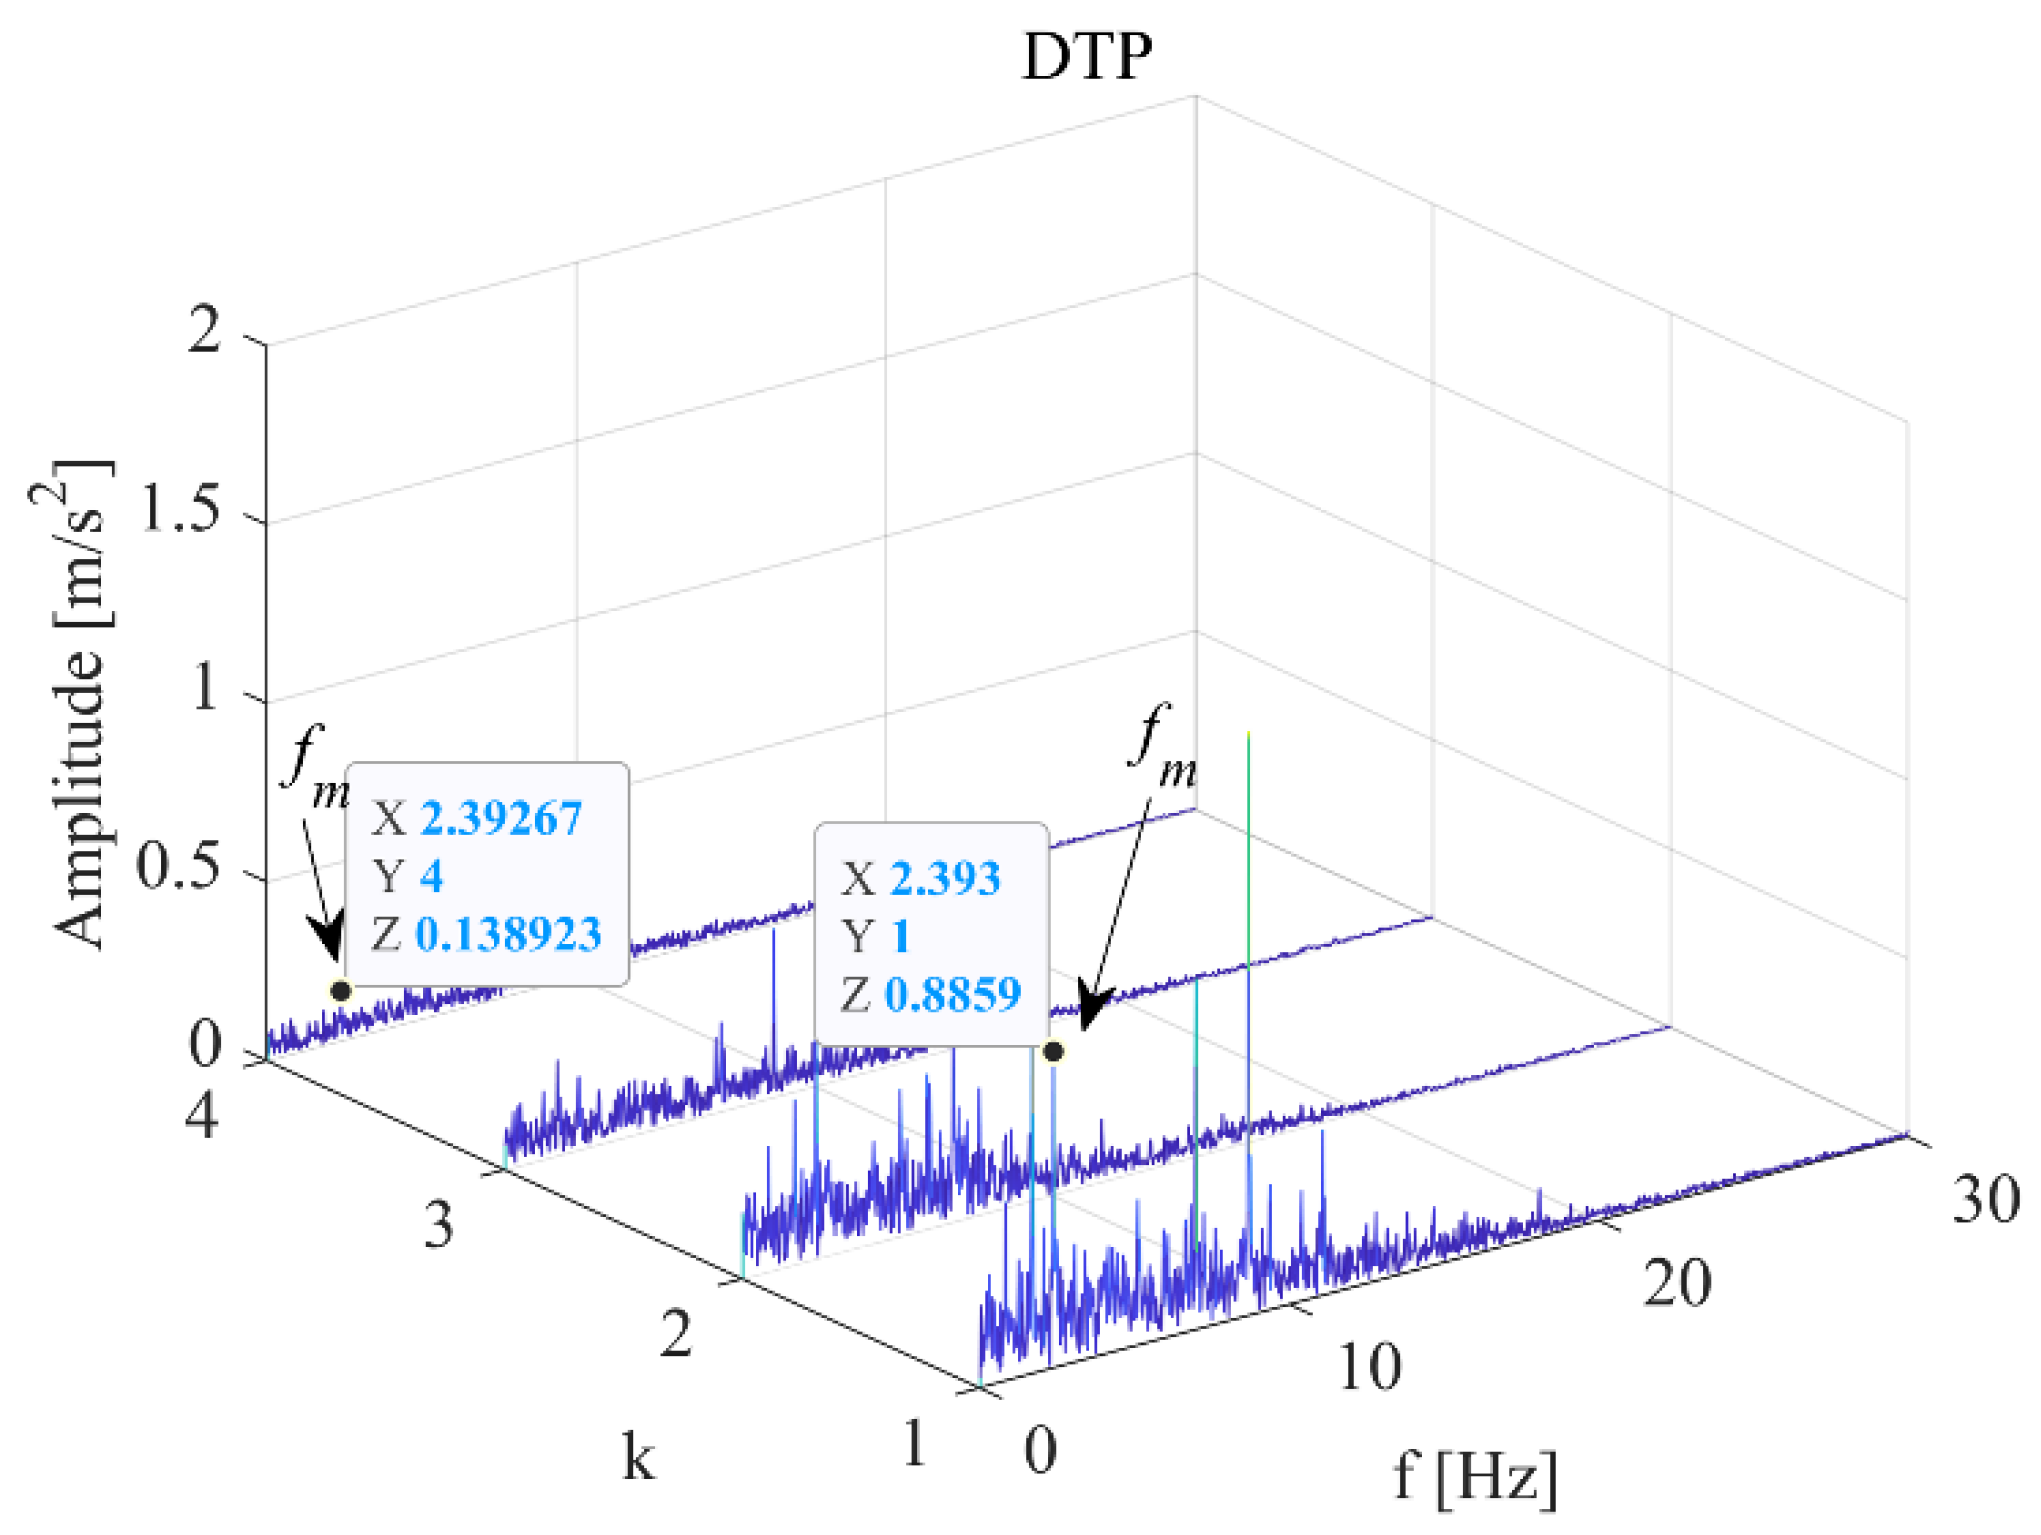
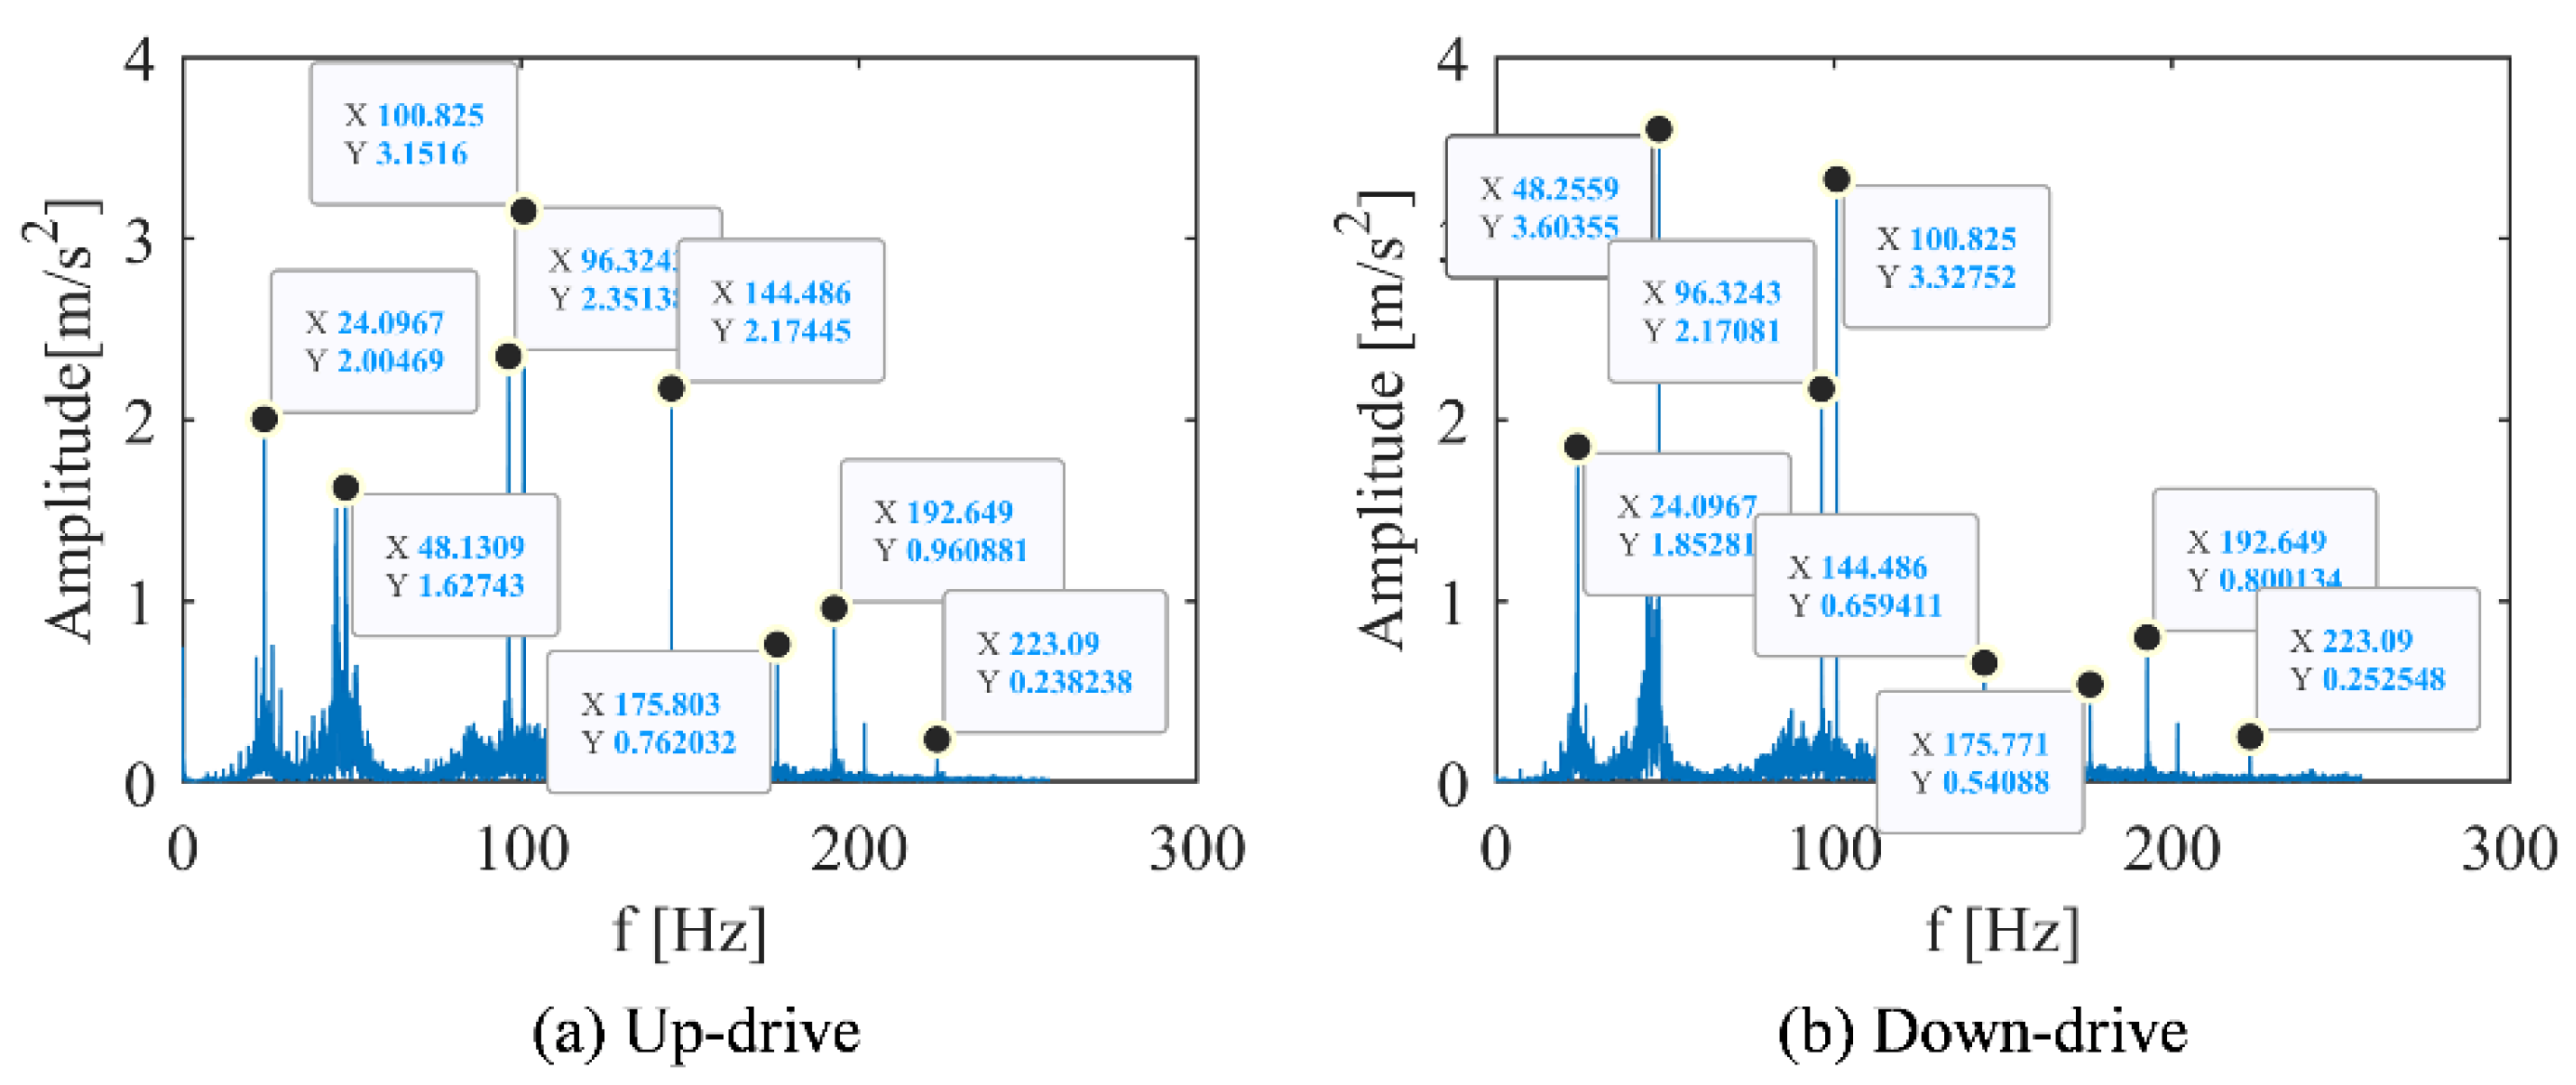
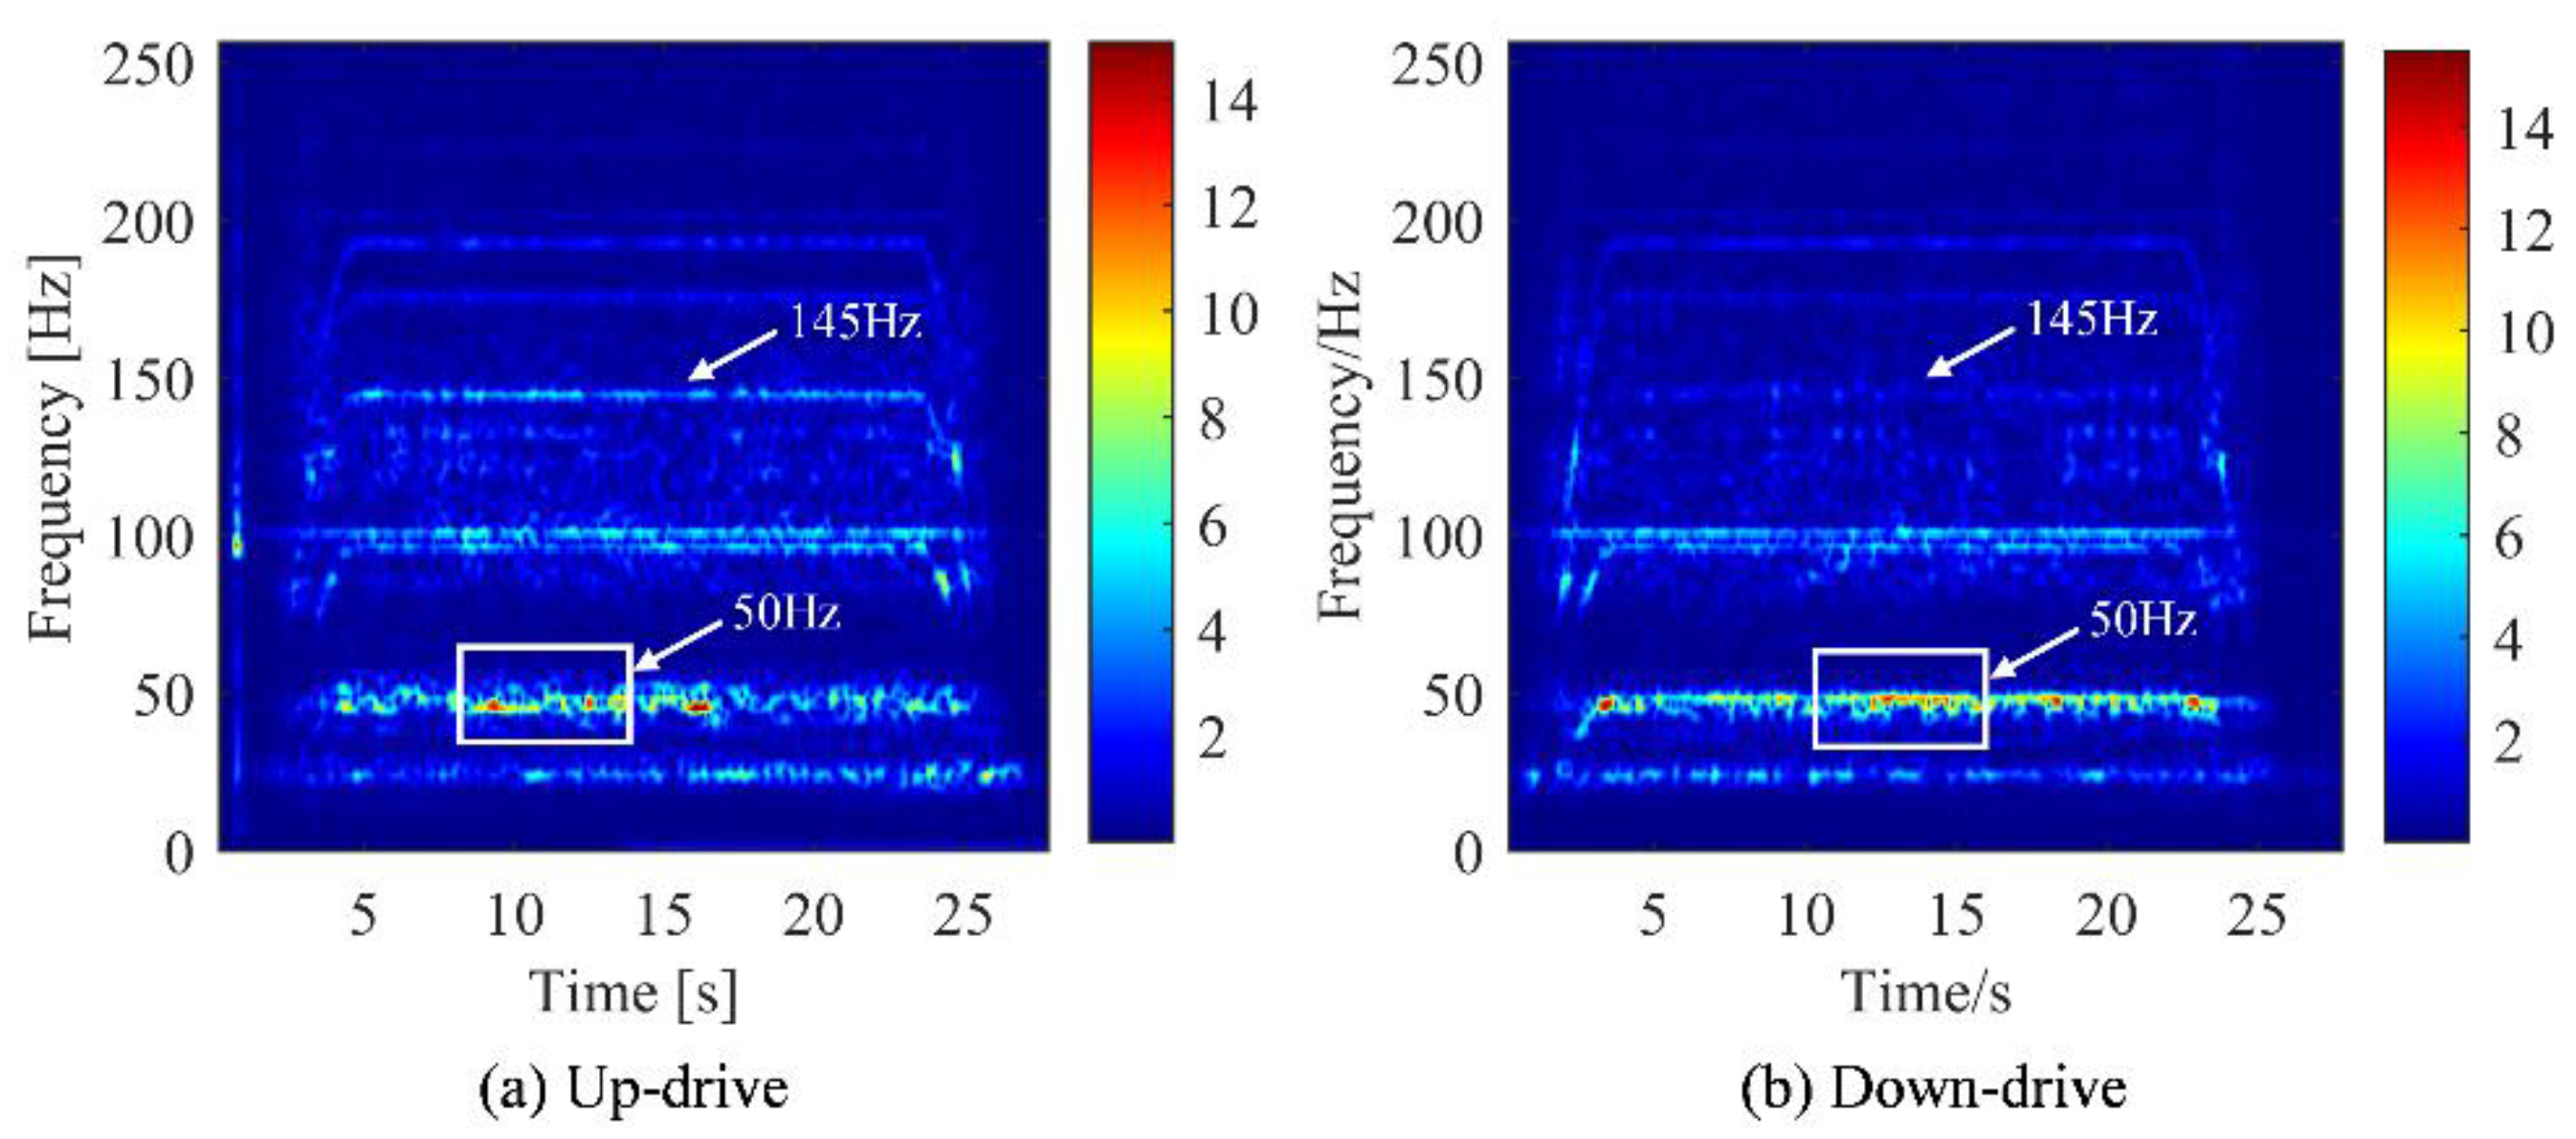
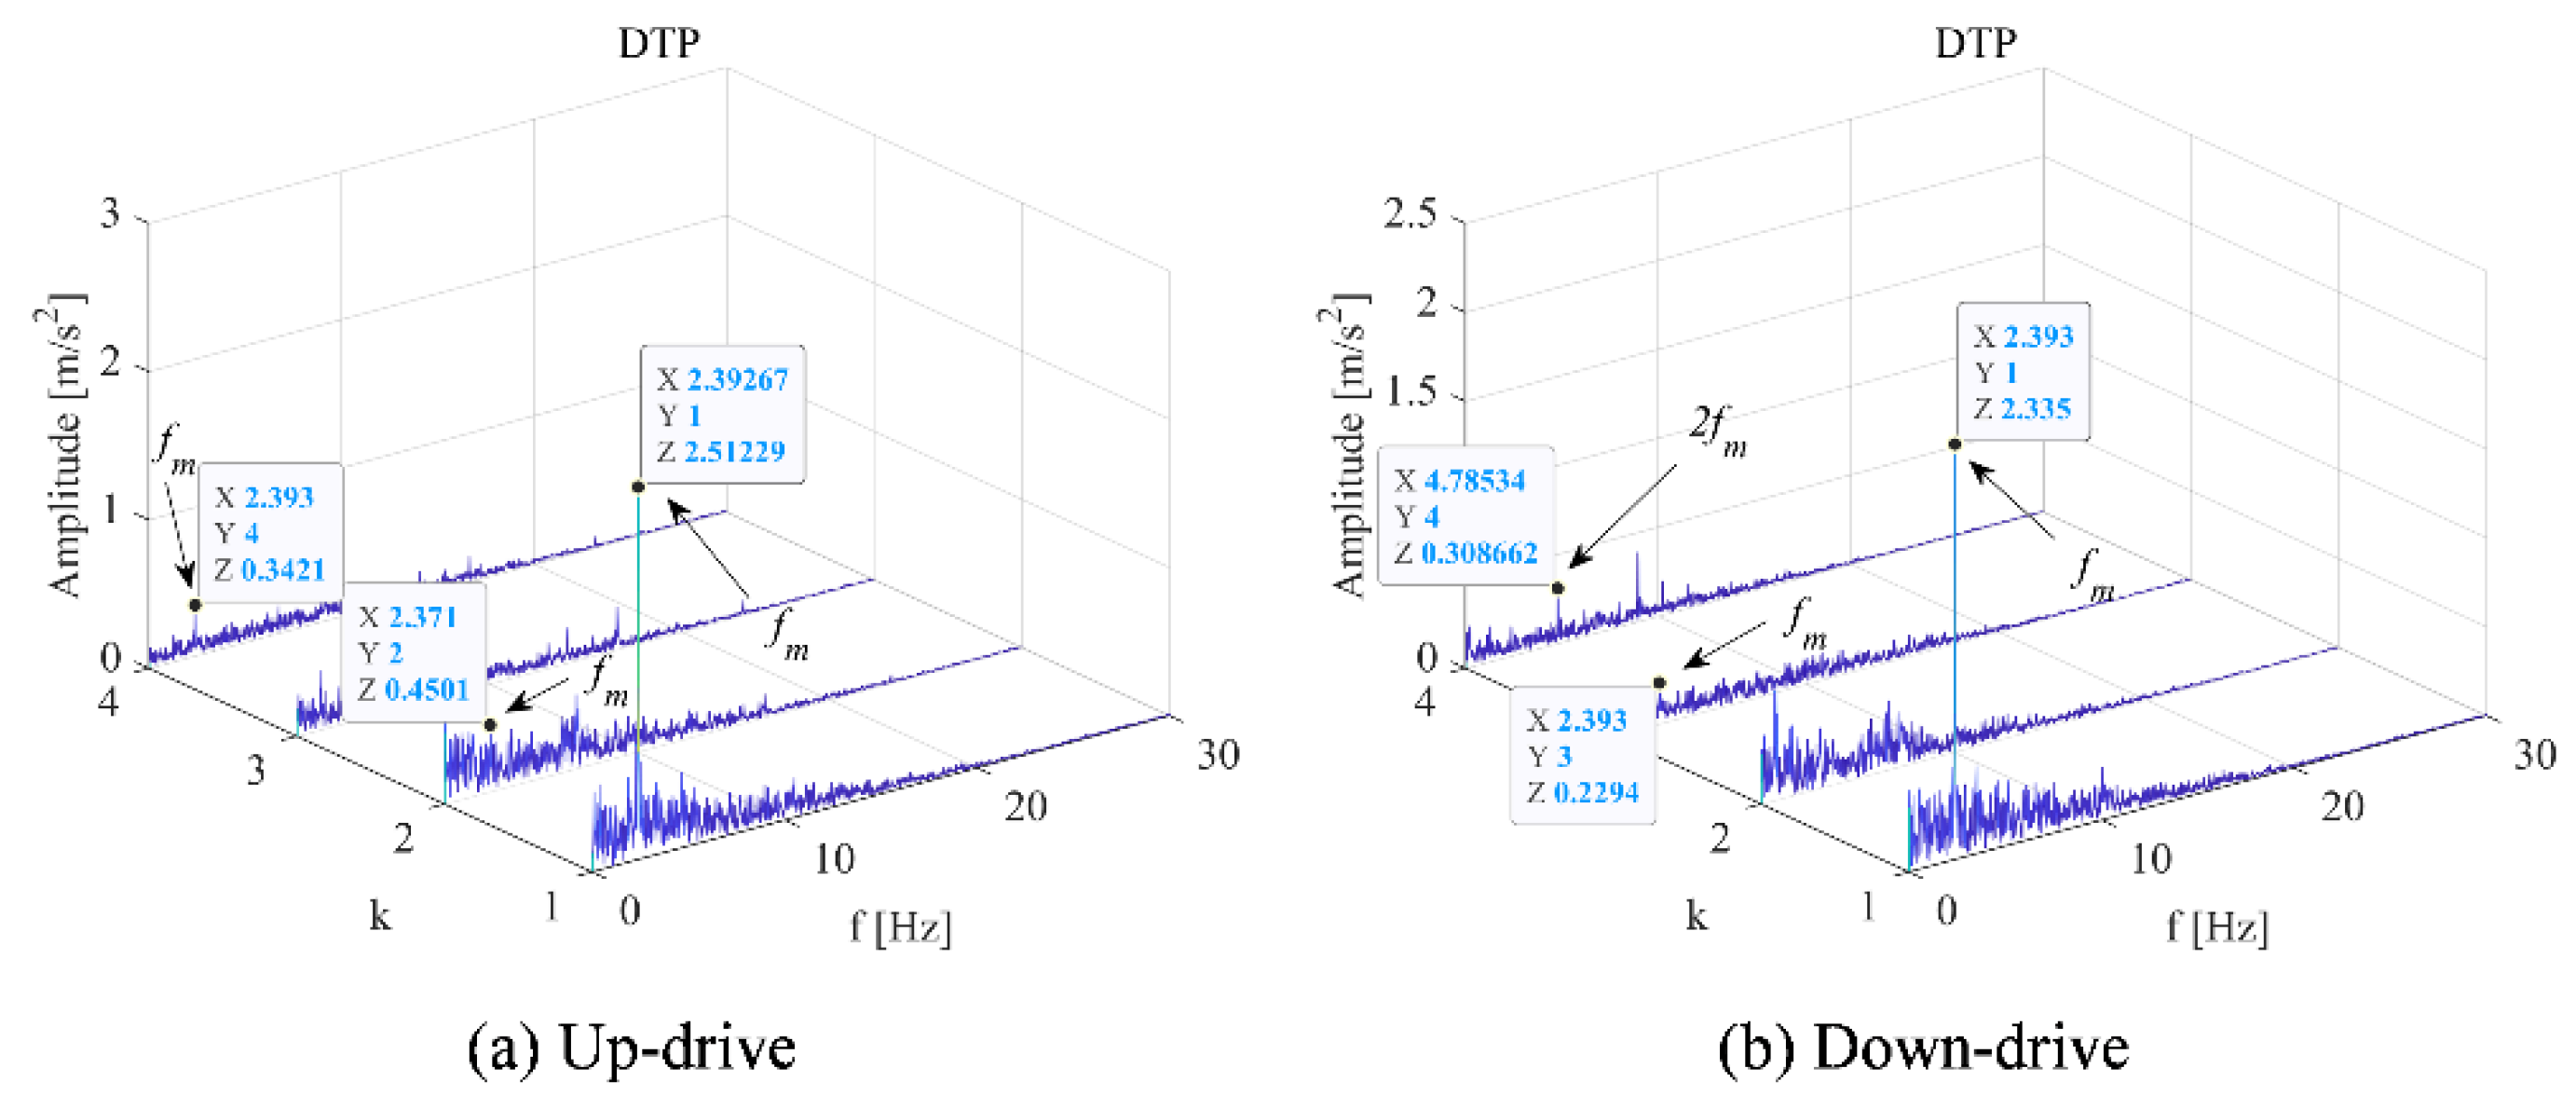
3.2. Analysis on the Influence of Elevator Running Direction on the Vibration of Main Engine
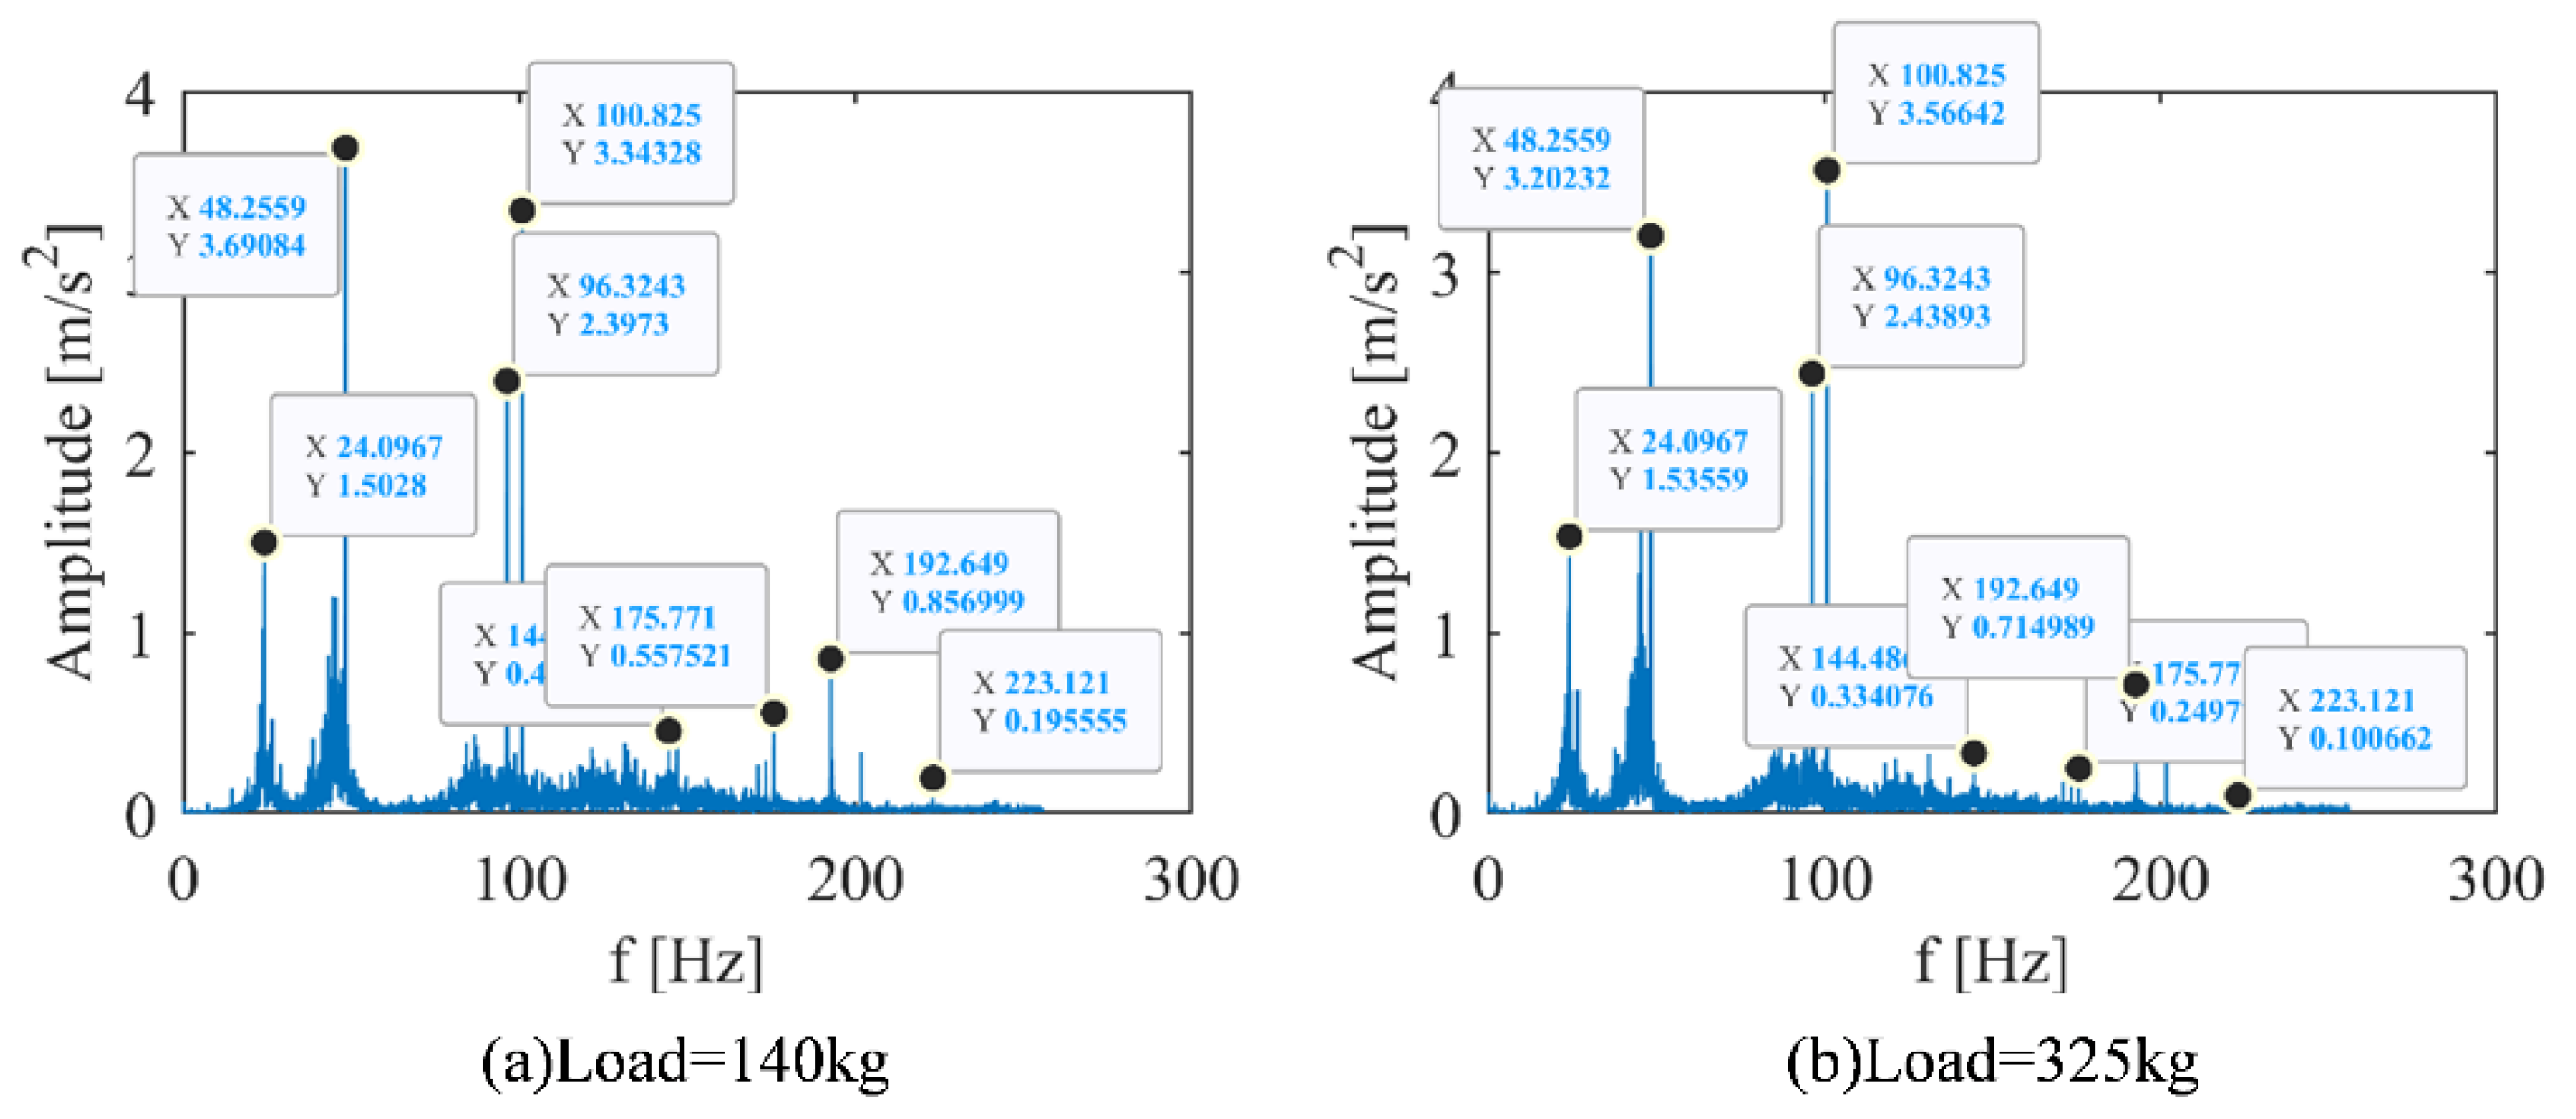
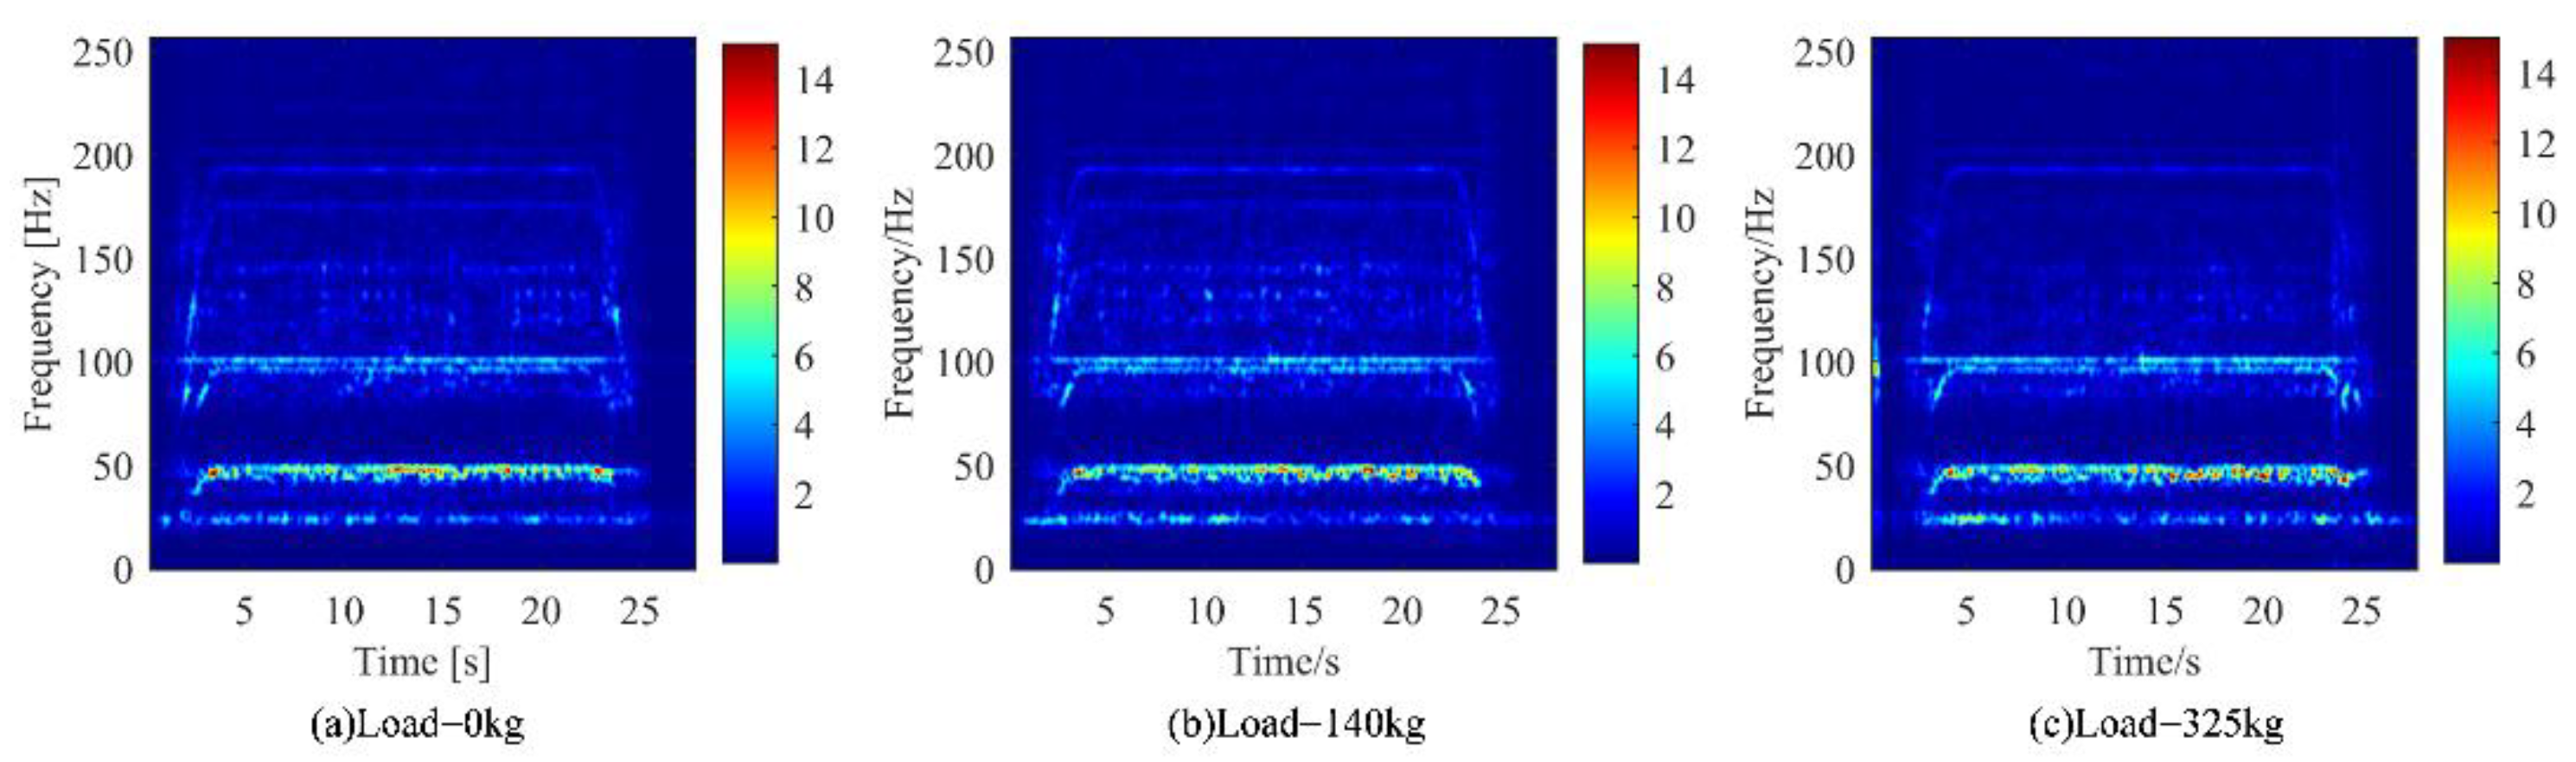
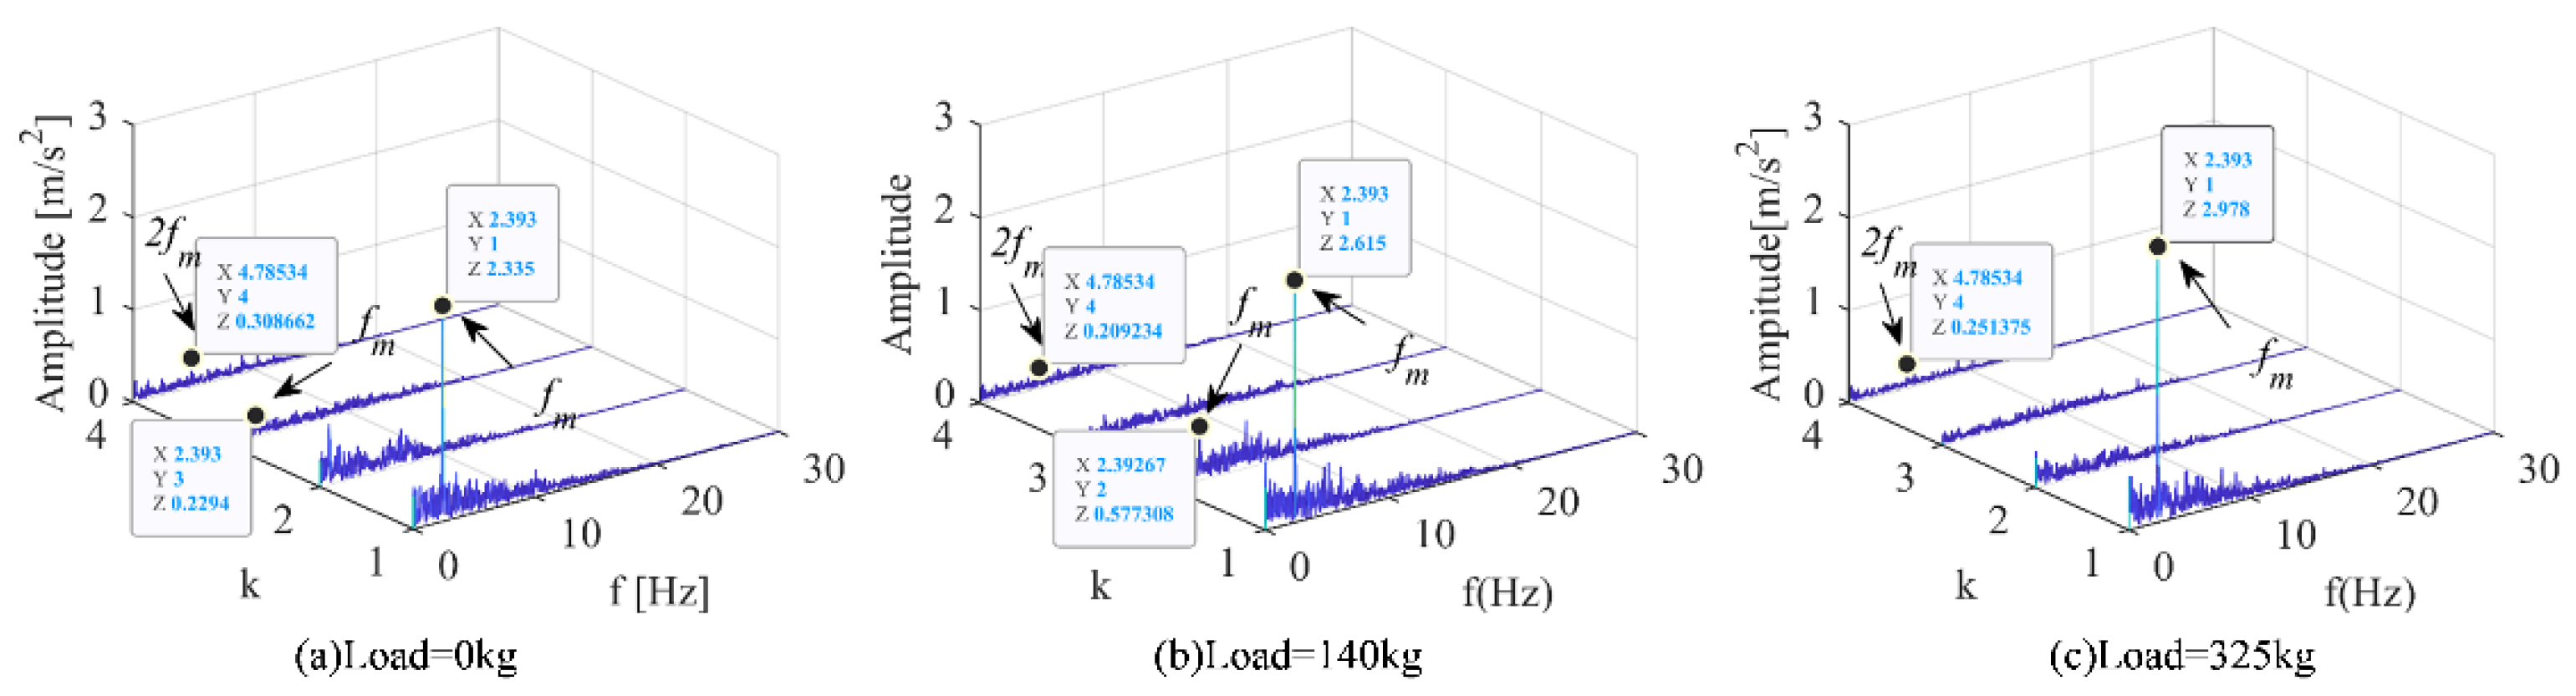
3.3. Analysis of Influence of Elevator Load on Main Engine Vibration
4. Conclusions
- (1)
- For the influence of different operating speeds of the elevator on the vibration signal, the difference can be obtained by analyzing the frequency-domain diagram through the FFT. The time-frequency diagram and the demodulation diagram can more clearly highlight the difference and complete the identification of the state of the traction machine. The amplitude modulation ratio of fm is approximate to the speed ratio under working conditions for different speeds;
- (2)
- For the up and down working conditions of the elevator, the frequency domain diagram and the time-frequency diagram cannot accurately distinguish the two working conditions. The DPCA demodulation method could highlight the weak state characteristic signal and distinguish the states of different working conditions;
- (3)
- Under different load conditions, it is difficult to observe the obvious differences and similarities of the vibration signals of the traction machine by time-frequency method. However, the DPCA demodulation method can effectively solve the influence of background noise and unknown frequency interference of the traction machine vibration signal. With the increase of load, the amplitude modulation of shaft frequency (fm) increases;
- (4)
- The state identification technology discussed in this paper involved a healthy traction machine under various operation. The state identification of traction machines with different faults will be carried out in future work.
Author Contributions
Funding
Institutional Review Board Statement
Informed Consent Statement
Data Availability Statement
Acknowledgments
Conflicts of Interest
References
- Cai, N.; Chow, W.K. Numerical Studies on Fire Hazards of Elevator Evacuation in Supertall Buildings. Indoor Built Environ. 2019, 28, 247–263. [Google Scholar] [CrossRef]
- Wen, P.; Zhi, M.; Zhang, G.; Li, S. Fault Prediction of Elevator Door System Based on PSO-BP Neural Network. Engineering 2016, 8, 761–766. [Google Scholar] [CrossRef]
- Liu, J.; Gong, Z.; Bai, Z.; Gu, M.; Liu, M.; Chang, L. Analysis of Elevator Motor Fault Detection Based on Chaotic Theory. J. Inf. Comput. Sci. 2014, 11, 229–235. [Google Scholar] [CrossRef]
- Lan, S.; Gao, Y.; Jiang, S. Computer Vision for System Protection of Elevators. J. Phys. Conf. Ser. 2021, 1848, 012156. [Google Scholar] [CrossRef]
- Feng, S.; Chen, J.; Liang, Y.; Xu, H. Research on Camera Bracket for Elevator Traction Wheel Groove. In Proceedings of the 2021 International Conference on Electronic Information Engineering and Computer Science, EIECS 2021, Changchun, China, 23–26 September 2021; pp. 820–823. [Google Scholar]
- Jiang, X.Y.; Huang, X.C.; Huang, J.P.; Tong, Y.F. Real-Time Intelligent Elevator Monitoring and Diagnosis: Case Studies and Solutions with Applications Using Artificial Intelligence. Comput. Electr. Eng. 2022, 100, 107965. [Google Scholar] [CrossRef]
- Xiaojuan, X.; Ningxiang, Y.; Jianxun, C.; Xiaoming, L. Wear Recognition Method for Traction Wheel Groove of Elevator Based on Image Processing. China Saf. Sci. J. 2019, 29, 122. [Google Scholar] [CrossRef]
- Jia, M.; Gao, X.; Li, H.; Pang, H. Elevator Running Fault Monitoring Method Based on Vibration Signal. Shock Vib. 2021, 2021, 4547030. [Google Scholar] [CrossRef]
- You, L.; Hu, J.; Fang, F.; Duan, L. Fault Diagnosis System of Rotating Machinery Vibration Signal. Procedia Eng. 2011, 15, 671–675. [Google Scholar] [CrossRef]
- Esteban, E.; Salgado, O.; Iturrospe, A.; Isasa, I. Design Methodology of a Reduced-Scale Test Bench for Fault Detection and Diagnosis. Mechatronics 2017, 47, 14–23. [Google Scholar] [CrossRef]
- Nandi, A.; Ahmed, H. Condition Monitoring with Vibration Signals; Wiley: Hoboken, NJ, USA, 2019; ISBN 9781119544623. [Google Scholar]
- Wu, K.; Chu, N.; Wu, D.; Antoni, J. The Enkurgram: A Characteristic Frequency Extraction Method for Fluid Machinery Based on Multi-Band Demodulation Strategy. Mech. Syst. Signal Process. 2021, 155, 107564. [Google Scholar] [CrossRef]
- Xiang, L.; Tang, G.; Hu, A. Vibration Signal’s Time-Frequency Analysis and Comparison for a Rotating Machinery. J. Vib. Shock 2010, 29, 42–45. [Google Scholar]
- Wang, Z.; Yang, J.; Li, H.; Zhen, D.; Xu, Y.; Gu, F. Fault Identification of Broken Rotor Bars in Induction Motors Using an Improved Cyclic Modulation Spectral Analysis. Energies 2019, 12, 3279. [Google Scholar] [CrossRef]
- Jin, Y.; Liu, X.X.; Liu, W.P. Design of Hydraulic Fault Diagnosis System Based on Labview. Adv. Mater. Res. 2012, 457–458, 257–260. [Google Scholar] [CrossRef]
- Feldman, M. Hilbert Transform in Vibration Analysis. Mech. Syst. Signal Process. 2011, 25, 735–802. [Google Scholar] [CrossRef]
- Lei, Y.; Lin, J.; He, Z.; Zuo, M.J. A Review on Empirical Mode Decomposition in Fault Diagnosis of Rotating Machinery. Mech. Syst. Signal Process. 2013, 35, 108–126. [Google Scholar] [CrossRef]
- Wang, Y.; Xiang, J.; Markert, R.; Liang, M. Spectral Kurtosis for Fault Detection, Diagnosis and Prognostics of Rotating Machines: A Review with Applications. Mech. Syst. Signal Process. 2016, 66–67, 679–698. [Google Scholar] [CrossRef]
- Feng, Z.; Chu, F.; Zuo, M.J. Time-Frequency Analysis of Time-Varying Modulated Signals Based on Improved Energy Separation by Iterative Generalized Demodulation. J. Sound Vib. 2011, 330, 1225–1243. [Google Scholar] [CrossRef]
- Feng, Z.; Chen, X.; Liang, M. Iterative Generalized Synchrosqueezing Transform for Fault Diagnosis of Wind Turbine Planetary Gearbox under Nonstationary Conditions. Mech. Syst. Signal Process. 2015, 52–53, 360–375. [Google Scholar] [CrossRef]
- Chen, X.; Feng, Z. Iterative Generalized Time–Frequency Reassignment for Planetary Gearbox Fault Diagnosis under Nonstationary Conditions. Mech. Syst. Signal Process. 2016, 80, 429–444. [Google Scholar] [CrossRef]
- Song, Y.; Liu, J.; Wu, D.; Zhang, L. The MFBD: A Novel Weak Features Extraction Method for Rotating Machinery. J. Braz. Soc. Mech. Sci. Eng. 2021, 43, 547. [Google Scholar] [CrossRef]
- Antoni, J.; Xin, G.; Hamzaoui, N. Fast Computation of the Spectral Correlation. Mech. Syst. Signal Process. 2017, 92, 248–277. [Google Scholar] [CrossRef]
- Antoni, J. Cyclostationarity by Examples. Mech. Syst. Signal Process. 2009, 23, 987–1036. [Google Scholar] [CrossRef]
- Feng, Z.; Chen, X.; Liang, M. Joint Envelope and Frequency Order Spectrum Analysis Based on Iterative Generalized Demodulation for Planetary Gearbox Fault Diagnosis under Nonstationary Conditions. Mech. Syst. Signal Process. 2016, 76–77, 242–264. [Google Scholar] [CrossRef]
- Feng, Z.; Chen, X. Adaptive Iterative Generalized Demodulation for Nonstationary Complex Signal Analysis: Principle and Application in Rotating Machinery Fault Diagnosis. Mech. Syst. Signal Process. 2018, 110, 1–27. [Google Scholar] [CrossRef]
- Wang, Z.; Yang, J.; Li, H.; Zhen, D.; Gu, F.; Ball, A. Improved Cyclostationary Analysis Method Based on TKEO and Its Application on the Faults Diagnosis of Induction Motors. ISA Trans. 2022, 128, 513–530. [Google Scholar] [CrossRef] [PubMed]
- Song, Y.; Liu, J.; Chu, N.; Wu, P.; Wu, D. A Novel Demodulation Method for Rotating Machinery Based on Time-Frequency Analysis and Principal Component Analysis. J. Sound Vib. 2019, 442, 645–656. [Google Scholar] [CrossRef]
- Song, Y.; Liu, Z.; Hou, R.; Gao, H.; Huang, B.; Wu, D.; Liu, J. Research on Electromagnetic and Vibration Characteristics of Dynamic Eccentric PMSM Based on Signal Demodulation. J. Sound Vib. 2022, 541, 117320. [Google Scholar] [CrossRef]
- Maraini, D.; Nataraj, C. Freight Car Roller Bearing Fault Detection Using Artificial Neural Networks and Support Vector Machines. Mech. Mach. Sci. 2015, 23, 663–672. [Google Scholar]
- Singh, S.; Vishwakarma, M. A Review of Vibration Analysis Techniques for Rotating Machines. Int. J. Eng. Res. 2015, V4, 757–761. [Google Scholar] [CrossRef]


| Parameter | Value |
|---|---|
| Model | GETM3.DM |
| Moment of inertia [kg·m2] | 4.4 |
| Pulley diameter [mm] | 400 |
| Rated voltage [V] | 513 |
| Rated current [A] | 12.6 |
| Rated power [kW] | 9.7 |
| Rated speed [rpm] | 168 |
| Rated frequency [Hz] | 28 |
| Working Condition | Classification | ||
|---|---|---|---|
| Different running directions | (a) Elevator up | (b) Elevator down | |
| Different operating speeds | (a) 1 m/s | (b) 2.4 m/s | |
| Different loads | (a) no-load | (b) 140 kg | (c) 325 kg |
| Peak Sequence Number | 1 | 2 | 3 | 4 | 5 | 6 | 7 |
|---|---|---|---|---|---|---|---|
| Frequency (Hz) | 24.1 | 64.2 | 96.3 | 100.8 | 117.2 | 130.0 | 201.6 |
| Up-drive (m/s2) | 1.48 | 0.51 | 0.52 | 1.46 | 2.91 | 2.67 | 0.64 |
| Down-drive (m/s2) | 1.46 | 0.49 | 0.36 | 0.79 | 2.51 | 3.06 | 0.82 |
| Peak Sequence Number | 1 | 2 | 3 | 4 | 5 | 6 | 7 | 8 |
|---|---|---|---|---|---|---|---|---|
| Frequency (Hz) | 24.1 | 48.1 | 96.3 | 100.8 | 144.5 | 175.8 | 192.6 | 223.1 |
| Up-drive (m/s2) | 2.00 | 1.63 | 2.35 | 3.15 | 2.17 | 0.76 | 0.96 | 0.24 |
| Down-drive (m/s2) | 1.85 | 3.60 | 2.17 | 3.33 | 0.66 | 0.53 | 0.80 | 0.25 |
| Peak Sequence Number | 1 | 2 | 3 | 4 | 5 | 6 | 7 | 8 |
|---|---|---|---|---|---|---|---|---|
| Frequency (Hz) | 24.1 | 48.1 | 96.3 | 100.8 | 144.5 | 175.8 | 192.6 | 223.1 |
| 0 kg | 1.85 | 3.60 | 2.17 | 3.33 | 0.66 | 0.53 | 0.80 | 0.25 |
| 140 kg | 1.50 | 3.69 | 2.40 | 3.34 | 0.42 | 0.56 | 0.86 | 0.20 |
| 325 kg | 1.54 | 3.20 | 2.44 | 3.57 | 0.33 | 0.25 | 0.71 | 0.28 |
Publisher’s Note: MDPI stays neutral with regard to jurisdictional claims in published maps and institutional affiliations. |
© 2022 by the authors. Licensee MDPI, Basel, Switzerland. This article is an open access article distributed under the terms and conditions of the Creative Commons Attribution (CC BY) license (https://creativecommons.org/licenses/by/4.0/).
Share and Cite
Li, D.; Yang, J.; Liu, Y. Research on State Recognition Technology of Elevator Traction Machine Based on Modulation Feature Extraction. Sensors 2022, 22, 9247. https://doi.org/10.3390/s22239247
Li D, Yang J, Liu Y. Research on State Recognition Technology of Elevator Traction Machine Based on Modulation Feature Extraction. Sensors. 2022; 22(23):9247. https://doi.org/10.3390/s22239247
Chicago/Turabian StyleLi, Dongyang, Jianyi Yang, and Yong Liu. 2022. "Research on State Recognition Technology of Elevator Traction Machine Based on Modulation Feature Extraction" Sensors 22, no. 23: 9247. https://doi.org/10.3390/s22239247
APA StyleLi, D., Yang, J., & Liu, Y. (2022). Research on State Recognition Technology of Elevator Traction Machine Based on Modulation Feature Extraction. Sensors, 22(23), 9247. https://doi.org/10.3390/s22239247