Article

Diffusion Coefficients and Activation Energies of Diffusion of Organic Molecules in Polystyrene below and above Glass Transition Temperature

Fraunhofer Institute for Process Engineering and Packaging (IVV) Giggenhauser Straße 35, 85354 Freising, Germany
Polymers 2021, 13(8), 1317; https://doi.org/10.3390/polym13081317
Submission received: 19 March 2021 / Revised: 11 April 2021 / Accepted: 13 April 2021 / Published: 16 April 2021
(This article belongs to the Special Issue Polymers and Soft Matter: From Synthesis to Structure & Dynamics)

Abstract

:
General Purpose Polystyrene (GPPS) and High Impact Polystyrene (HIPS) is used in packaging food as well as for technical products. Knowledge of the diffusion behavior of organic molecules in polystyrene (PS) is important for the evaluation of the diffusion and migration process. Within this study, diffusion coefficients were determined in GPPS and HIPS below and above the glass transition temperature. Diffusion coefficients were determined from desorption kinetics into the gas phase using spiked GPPS and HIPS sheets as well as from permeation kinetics through a thin GPPS film. Overall, 187 diffusion coefficients were determined in GPPS and HIPS at temperatures between 0 °C and 115 °C. From the temperature dependency of the diffusion coefficients 45 activation energies of diffusion EA and the pre-exponential factor D0 were determined. As expected, the activation energies of diffusion EA show a strong dependency from the molecular volume of the investigated substances. At the glass transition temperature, only a slight change of the diffusion behavior were observed. Based on EA and D0, prediction parameters for diffusion coefficients were established.

1. Introduction

Polystyrene (PS) is widely used as packaging materials for food [1]. Crystal polystyrene (general purpose polystyrene (GPPS)) is used for containers for a variety of foods and as disposable cups for beverages. GPPS is normally not suitable for packaging of food with a high fat content, e.g., salad dressings and margarine, because the high fat levels may cause stress cracking resulting in a decreased barrier function [2]. To overcome the brittleness of polystyrene, butadiene synthetic rubbers (between 5% and 12%) are added during polymerization to manufacture high impact polystyrene (HIPS). Opaque HIPS is used for food containers and yogurt cups. GPPS and HIPS plastics have poor barrier properties to permanent gases like oxygen and carbon dioxide. This reduces the shelf life of food packed in PS, but on the other hand, makes HIPS a good packaging material for yogurt and milk products as some penetration of oxygen is necessary to assist the yogurt fermentation process. Foamed PS is thermoformed into a variety of trays for meat, poultry, fish, fruit and vegetables as well as containers for eggs, and fast foods, and disposable cups for hot beverages. PS is also used for technical products or applications such as electronics, furniture, toys, building insulation and automotive parts.
Residual volatile substances like residual monomers or side-products formed during the polymerization process, e.g., styrene, toluene, ethylbenzene, iso-propylbenzene and n-propylbenzene can be determined in the polystyrene packaging materials and might migrate into food after contact with polystyrene packaging [3,4,5,6,7,8]. Polymer additives [9] and oligomers [10,11,12,13] can also migrate into food. In order to predict this migration, diffusion coefficients DP for organic substances in the polymer should be available. Since PS is used also for hot beverages, diffusion coefficients at high temperatures should also be available [6,14]. In this regard, activation energies of diffusion are useful for the prediction of the migration at elevated temperatures.
In some cases, PS is used as a functional barrier in order to reduce the migration of polymer additives or dyes [15,16]. Prediction of barrier properties towards organic compounds also needs knowledge about the diffusion behavior of PS. In addition, prediction of diffusion coefficients might be useful for the evaluation of post-consumer recyclates for reuse in food packaging applications as well as in cleaning efficiency simulation of the corresponding recycling processes. This had been successfully shown for polyethylene terephthalate (PET) [17,18].
To the knowledge of the author, systematic studies on diffusion coefficients DP and activation energies of diffusion EA for GPPS and HIPS are not available in the scientific literature. Most of the diffusion coefficients available in the scientific literature are derived from migration experiments in food or food simulants. As mentioned above, GPPS is not suitable for fatty food which interacts with the polymer, resulting in increasing migration and consequently, higher diffusion coefficients. HIPS might also show strong interactions with food simulants. Food simulants like ethanol/water mixtures, n-heptane or iso-octane show strong interactions with polystyrene leading to an over-estimation of the migration which results into too high diffusion coefficients due to swelling and stress cracks compared to the pure diffusion of organic molecules. On the other hand, most of the typical applied foods do not show such strong interactions with PS. Therefore, diffusion coefficients based on migration measurements into food simulants will lead to prediction parameters which are too conservative. In addition, most of the diffusion coefficients which are used for the prediction models are derived from single point measurements, e.g., after storage for 10 d at 40 °C or 60 °C [9]. From single point measurements, it is not possible to show if the diffusion process is following Fickian laws of diffusion. Parametrization of prediction parameters based on migration kinetics appears to be a more suitable approach for the determination of diffusion coefficients in PS or in polymers in general.
The aim of this study was to determine the diffusion coefficients of organic molecules in GPPS and HIPS over a broad temperature range below and above the glass transition temperature of 100 °C. Diffusion coefficients were determined from desorption kinetics into the gas phase using spiked GPPS and HIPS sheets as well as from permeation kinetics through a thin GPPS film. From the temperature dependency of the diffusion coefficients the activation energies of diffusion EA and the pre-exponential factor D0 were determined. From the results, parameters for the prediction of diffusion coefficients for organic molecules in GPPS and HIPS below and above the glass transition temperature were derived.

2. Materials and Methods

2.1. Sample Materials and Model Compounds for Desorption Testing

2.1.1. Manufacturing of Polystyrene Sheets Spiked with Model Compounds

Pairs of spiked sheets with thicknesses of 350 µm were prepared from GPPS and HIPS polymer for the desorption kinetics into the gas phase. Model compounds were used as surrogates for real contaminants because polystyrene samples with real contaminants in the molecular weight range of interest are rarely available. Two sets of model compounds were spiked homogeneously during polystyrene sheet production. The first sheet was spiked with a mixture of n-alkanes n-octane, n-decane, n-dodecane, up to n-tetracosane. The second sheet was spiked with a mixture of the following substances: acetone, ethyl acetate, toluene, chlorobenzene, phenyl cyclohexane, benzophenone and methyl stearate.

2.1.2. Quantification of Spiking Levels in the Polystyrene Sheets

The concentrations of the model compounds were determined quantitatively in the PS sheets by extraction with acetone as solvent. A 1.0 g measure of the PS material was immersed with 10 mL acetone and stored at 40 °C for 3 d. Subsequently, the solvent was removed and the sheets were extracted again in order to prove if the first extraction was exhaustive. The extracts were then analyzed by gas chromatography with flame ionization detection (GC–FID): Column: DB 1; 20 m length; 0.18 mm inner diameter; 0.18 µm film thickness, temperature program: 50 °C (2 min), followed by heating at 10 °C/min to 340 °C (15 min), pre-pressure: 50 kPa hydrogen, split: 10 mL/min. Calibration was achieved by standard addition of the model compounds. tert-Butylhydroxyanisole (BHA, CAS No. 8003-24-5) and Tinuvin 234 (CAS No. 70321-86-7) were used as internal standards. The concentrations of the very volatile substances acetone and ethyl acetate were estimated from the headspace gas chromatograms (GC–FID): Column: ZB 1;30 m length; 0.25 mm inner diameter.; 0.32 µm film thickness, temperature program: 50 °C (4 min), followed by heating at 20 °C/min to 320 °C (15 min), pre-pressure: 50 kPa helium, split: 10 mL/min. Headspace Autosampler: Oven temperature: 150 °C, needle temperature: 160 °C, transfer line temperature: 170 °C, equilibration time: 1 h, pressurization time: 3 min, injection time: 0.02 min, withdrawal time: 1 min. Concentrations were estimated compared to a neat standard of the substances. The concentrations of the model compounds in the investigated PS sheets are summarized in Table 1.
For each test, 1.0 g of sample material was weighed into a headspace vial and analyzed by headspace GC–FID. Gas chromatograph: Perkin Elmer AutoSystem XL, column: ZB 1; 30 m length; 0.25 mm inner diameter; 0.32 µm film thickness, temperature program: 50 °C (4 min) followed by heating at 20 °C/min to 320 °C (15 min), pre-pressure: 50 kPa helium, split: 10 mL/min. Headspace Autosampler: Perkin Elmer HS 40 XL, oven temperature: 150 °C, needle temperature: 160 °C, transfer line: 170 °C, equilibration time: 1 h, pressurization time: 3 min, injection time: 0.02 min, withdrawal time: 1 min. Quantification of limonene was achieved by external calibration with standards of different concentrations.

2.1.3. Determination of Diffusion Coefficients

Migrations into the gas phase of the spiked model compounds were determined according to [19,20] using an automated method that involved placing sheet samples of 15.6 cm diameter (area 191 cm2) in a migration cell. One sheet per temperature was analyzed. The migration cell was heated up to the measuring temperature and the compounds migrating from the polystyrene sheets were purged out of the extraction cell by a helium stream of 20 mL/min. The migrants were trapped (Carbopack B 20 mm, Supelco) at a trap temperature of –46 °C. Subsequently, the loaded trap was completely desorbed and transferred directly to the connected gas chromatograph (GC) by heating it to 300 °C within about 10 s. Subsequently, a new trapping cycle started. By using this automated method, every 40 min a kinetic point was determined. The migrants were separated during the GC run and quantified during the chromatographic measurements. Calibration was achieved by injection of undiluted standard solutions of the migrants into the migration cell. Gas chromatograph: Column: Rxi 624; 30 m length; 0.32 mm inner diameter; 1.8 µm film thickness, temperature program: 40 °C (2 min), rate 20 °C/min, 270 °C (8 min), pressure 70 kPa helium, detector temperature: 280 °C.
The diffusion coefficients DP were calculated from the area related migration into the gas phase according to Equation (1). Within this equation, mt/A (in µg/cm2) is the mass transfer into gas phase per area A (in cm2) and δ (in g/cm3) is the density of the polymer. The concentration of the migrant at the start of the tests is cP,0 (in mg/kg) and DP (in cm2/s) is the diffusion coefficient in the polymer. The parameter t is the run time (in s) of the experiment.
m t A = 2 π δ c P , 0 D P t

2.2. Sample Materials and Model Compounds for Permeation Testing

Permeation of 1-alcohols was determined through a biaxially oriented GPPS film of 34 ± 1 µm thickness purchased from Goodfellow (Huntingdon, UK). The permeation rates were determined for 1-alcohols from methanol to 1-octanol. The homologous rows of substances with different polarities were chosen in order to establish correlations which might be useful to predict the diffusion behavior of other, non-tested substances.

2.3. Permeation Measurements

The 34 µm GPPS film was clamped in a stainless steel permeation cell between two sealant rings. The surface area of the tested films was 191 cm2. The permeation cell with the film was placed in a climate chamber. One film per temperature was analyzed. The cell has a lower and an upper space separated by the film. The lower space of the permeation cell had a volume of 7667 cm3 and was spiked with the permeants. The starting concentrations (cgas phase) of the investigated permeants (1-alcohols) in the lower space of the permeation cell, their molecular weights and molecular volumes [21] are given in Table 2. The upper space of the permeation cell was rinsed with pure nitrogen (20 mL/min) which moved the permeated substances out of the cell. The nitrogen stream went through a connected enrichment unit and the permeants were trapped on this unit. The enrichment unit was connected to a gas chromatograph with flame ionization detection (GC–FID) and the permeants were directly desorbed into the gas chromatograph. By use of this technique, the permeated amount into the upper space of the permeation cell was analyzed for the applied permeants. During the GC run, the next sample was again trapped on the enrichment unit and subsequently injected into the GC. By use of this method, kinetic points were measured every 45 min. Gas Chromatographic Conditions: Column: Rxi 624; 30 m length; 0.32 mm inner diameter; 1.8 µm film thickness, carrier gas: 120 kPa helium. Temperature program: 40 °C (2 min), rate 20 °C/min to 280 °C hold for 7 min. Pre-trap: substances collected on 20 mm length by 5 mm diameter of Carbopack 107 (Supelco), desorbed at 350 °C. Main trap: substances focused at –46 °C on 20 mm length by 1.4 mm inner diameter of Carbopack B, desorbed at 260 °C. Calibration was performed with injections of known amounts of the applied permeants.
From the experimental data, the permeation rates as well as the lag times of the applied permeants are available. The diffusion coefficient DP of the applied permeants in GPPS was calculated from the lag time tlag (in s) and the thickness l (in cm2) of the film according to Equation (2) [22,23].
D P = l 2 6 t lag

2.4. Calculation of Molecular Volumes

The molecular volume V (in Å3) of the molecules was calculated with the free internet program “molinspiration” [21]. This program calculates the van der Waals volume of organic molecules. The method for calculation of molecule volume developed is based on group contributions.

3. Results and Discussion

Within this study, diffusion coefficients DP of several organic compounds were determined by use of two independent methods: (i) Desorption kinetics from spiked GPPS and HIPS sheets and (ii) permeation kinetics on a thin (34 ± 1 µm) non-spiked GPPS film.

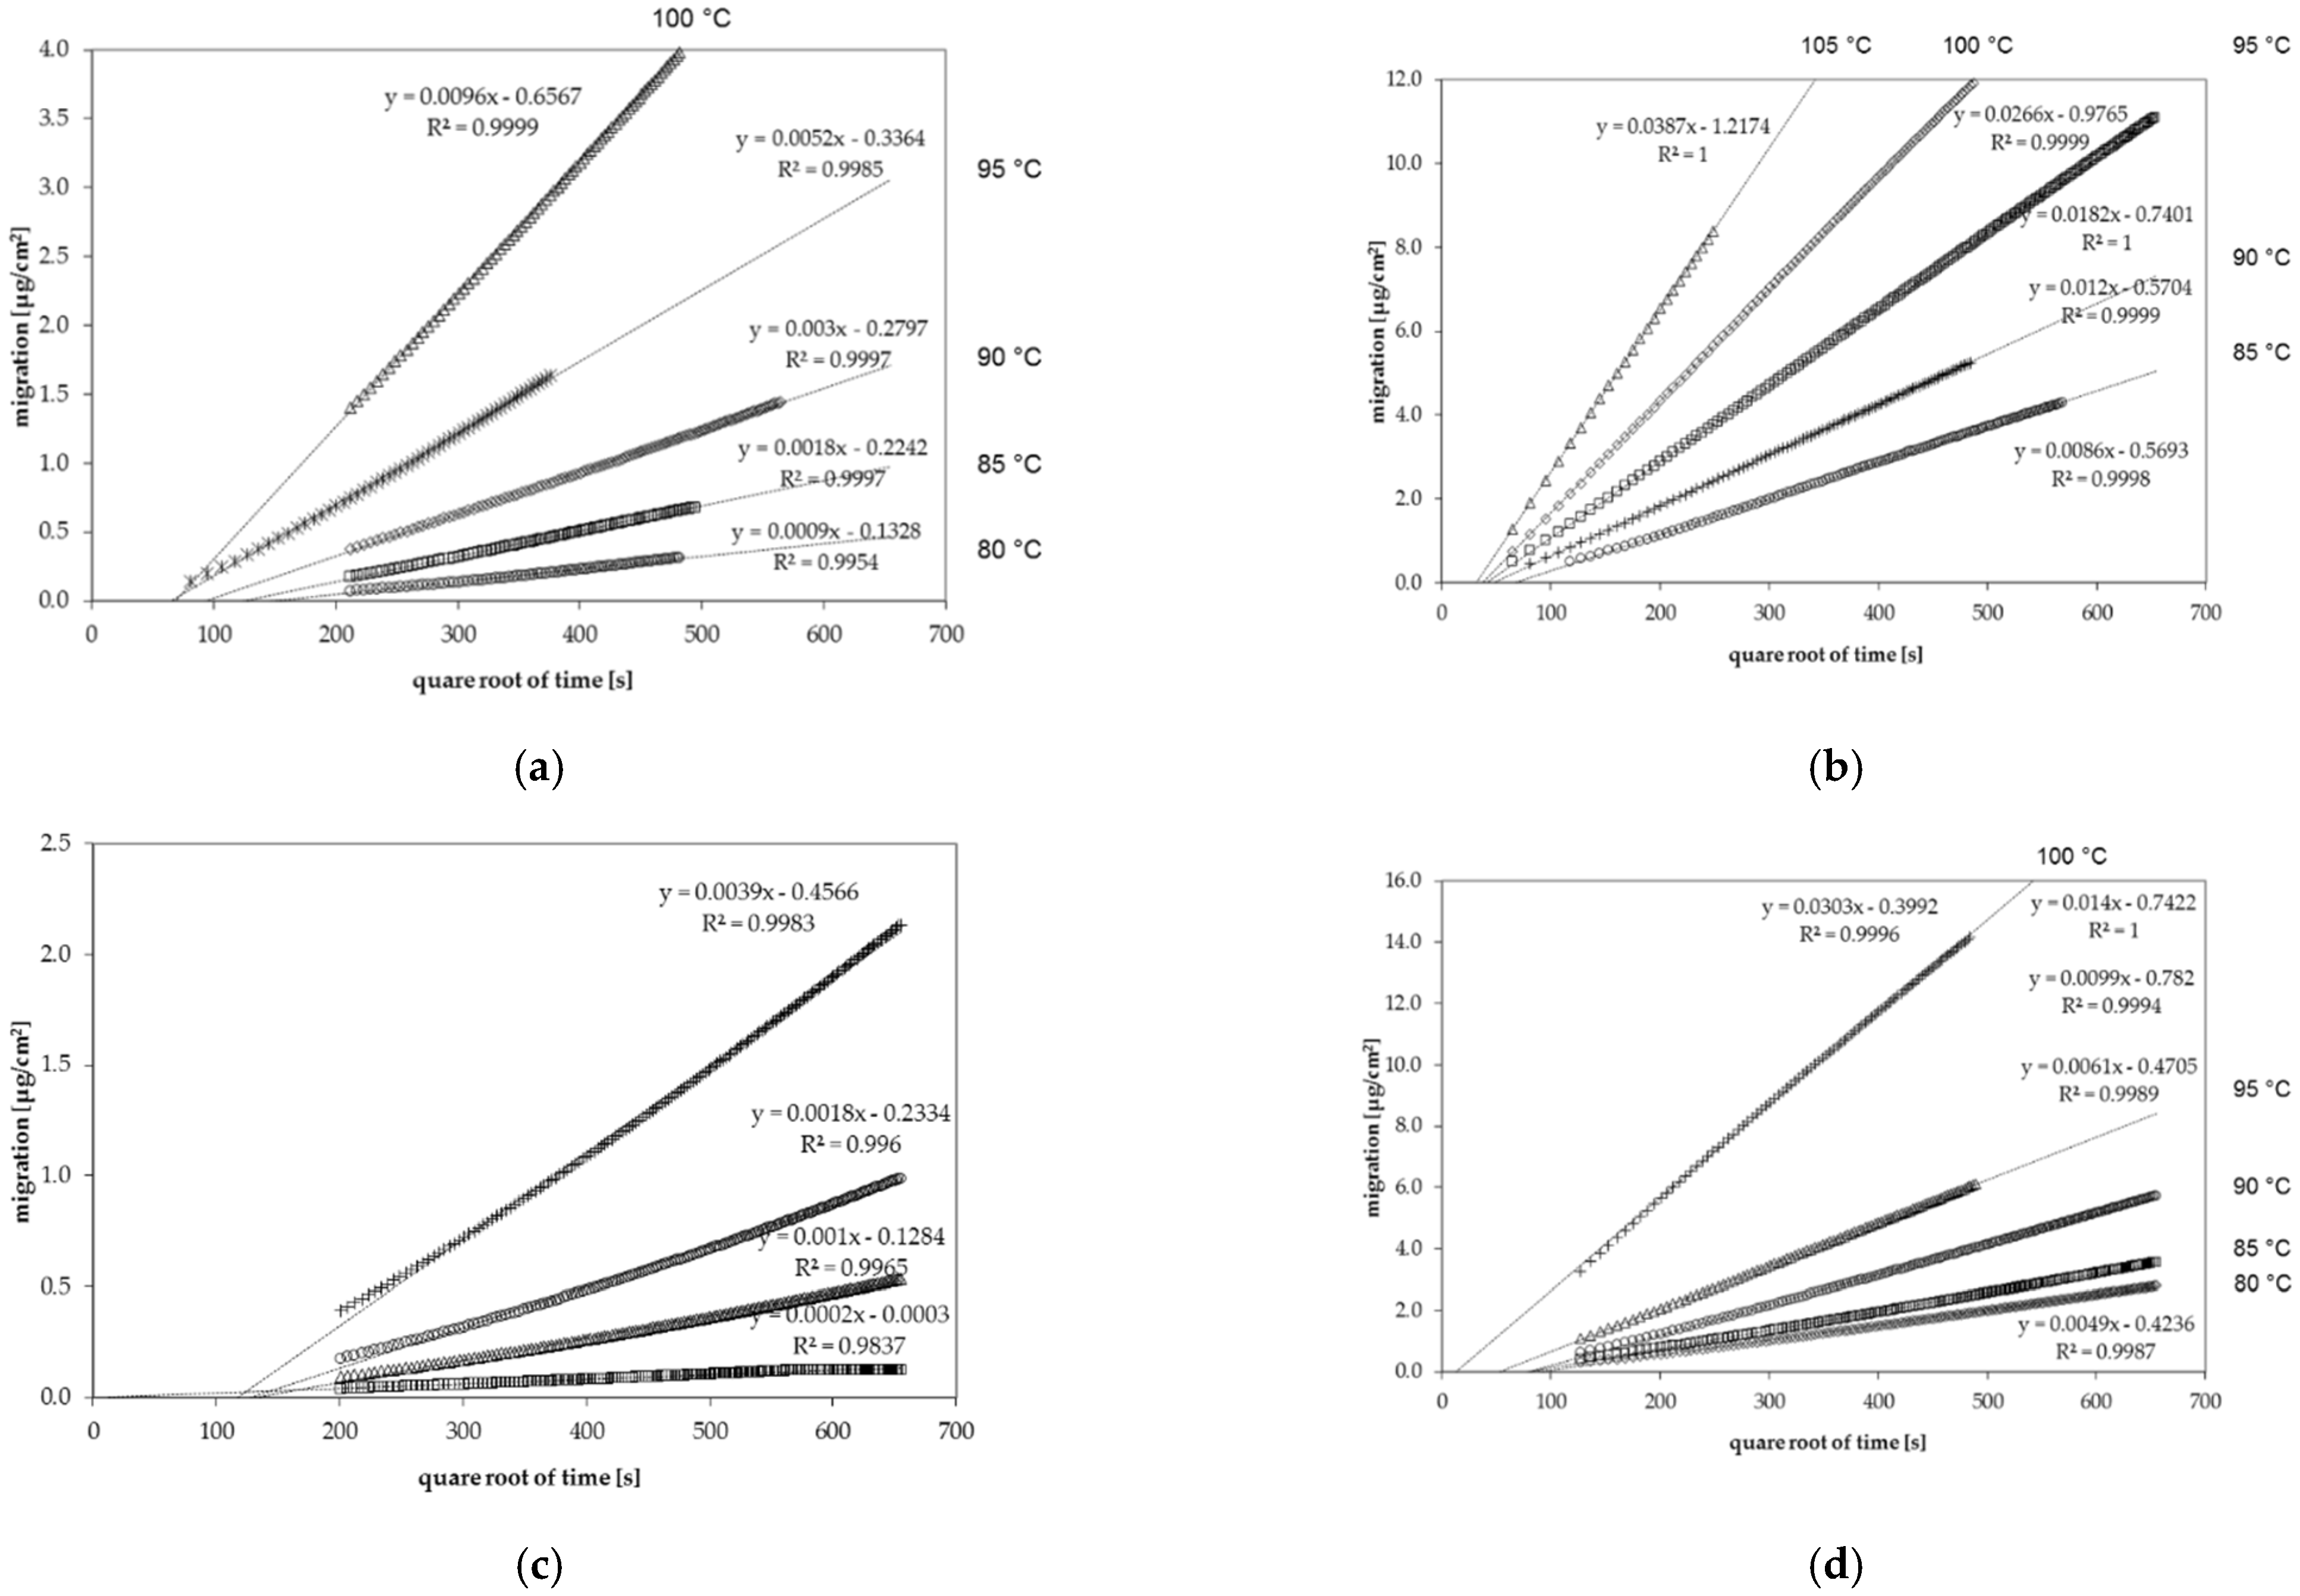
3.1. Diffusion Coefficients from Desorption Kinetics

The applied desorption method determines the migration of spiked substances from PS sheets into the gas phase at elevated temperatures. Diffusion coefficients DP were determined from the slopes of the linear correlation between the square root of time and the area-dependent migration according to Equation (1). By use of this desorption method, several migrants can be determined simultaneously provided the model compounds are distributed homogenously in the spiked PS sheet and separation on the GC column is attained. In order to obtain a homogenous distribution of the migrants in the sheet, the organic substances were spiked into the polymer melt during sheet production. Notably, a proportion of the migrants evaporate during the thermal step of sheet production, especially in case of volatile substances. Thus, compounds of higher volatility are removed in greater amounts during sheet production, leading to lower concentrations in the final spiked PS sheet. It was therefore necessary to analyze the final PS sheets according to their residual concentration of the artificially spiked compounds (Table 1). As a result, the concentrations of the n-alkanes were quantified between 400 and 700 mg/kg. A broader concentration range was determined for the applied solvents like acetone, ethyl acetate, toluene and chlorobenzene with concentrations of 180 mg/kg up to around 800 mg/kg. The substances phenyl cyclohexane and benzophenone were determined at concentrations of 500 to 1200 mg/kg. The concentration of styrene in both sheets was determined in the range of 350 mg/kg up to 600 mg/kg. Styrene was not artificially added, but detectable in polystyrene polymers as residual monomer.
The diffusion coefficients DP derived from the desorption kinetics are summarized in Table 3 (n-alkanes) and Table 4 (other substances with various functional groups and aromatic rings). Examples of the desorption kinetics into the gas phase for n-octane and chlorobenzene in GPPS as well as for n-dodecane and toluene in HIPS are given in Figure 1. Desorption kinetic curves all other applied substances had a similar shape.
The desorption kinetics were determined at temperatures between 75 °C and 115 °C. For all investigated migrant kinetic points, they were determined every 40 min. Therefore, several kinetic points are available for each diffusion coefficient. From this migration, it could be shown that the diffusion process is following Fickian laws of diffusion resulting in a linear correlation between the migrated amount and the square root of time [21]. However, it should be noted that the kinetic curves shown in Figure 1 do not go through the zero point. This is due to the fact that during sheet manufacturing, a portion of the spiked substances are lost from the hot surface of the sheets during sheet production, which reduces slightly the concentration at the surface of the sheets. This leads to a slightly lower desorption at the beginning of the kinetics. Due to the high temperatures during the kinetic tests, the concentration is gradually replenished at the surface of the sheets. Therefore, the lower surface concentration at the beginning of the kinetics has no influence on the measured diffusion coefficients DP, because the slopes after this initial phase were taken into account.
The measured diffusion coefficients were determined in the range of 10−8 cm2/s to 10−16 cm2/s depending on the substance and the applied temperature. As expected, low molecular weight molecules show significantly higher diffusion coefficients DP than high molecular weight substances, especially at low temperatures. The glass transition temperature Tg of polystyrene of around 100 °C is within the measuring interval for both GPPS and HIPS. In the case of GPPS sheet 1 spiked with n-alkanes, five kinetic points were determined below Tg and three kinetic points were determined above Tg (both include the kinetic point at Tg of 100 °C). In case of sheet 1, it was possible to calculate the activation energies of diffusion below as well as above the glass transition temperature. Regarding GPPS sheet 2, only one kinetic point was determined above Tg. Therefore, activation energies of diffusion are not available above the glass transition temperature and the diffusion coefficients at 105 °C were applied to determine the activation energies of diffusion below the glass transition temperature. A similar situation was available for HIPS. Four (sheet 1) and five (sheet 2) kinetic points were available below, whereas two and three kinetic points, respectively, were available above the glass transition temperature. In the case of HIPS, the determination of the activation energies of diffusion was possible below and above the glass transition temperature. However, due to only a couple of kinetic points and the small temperature interval, the activation energies of diffusion above the glass transition temperature are less precise for HIPS compared to GPPS.

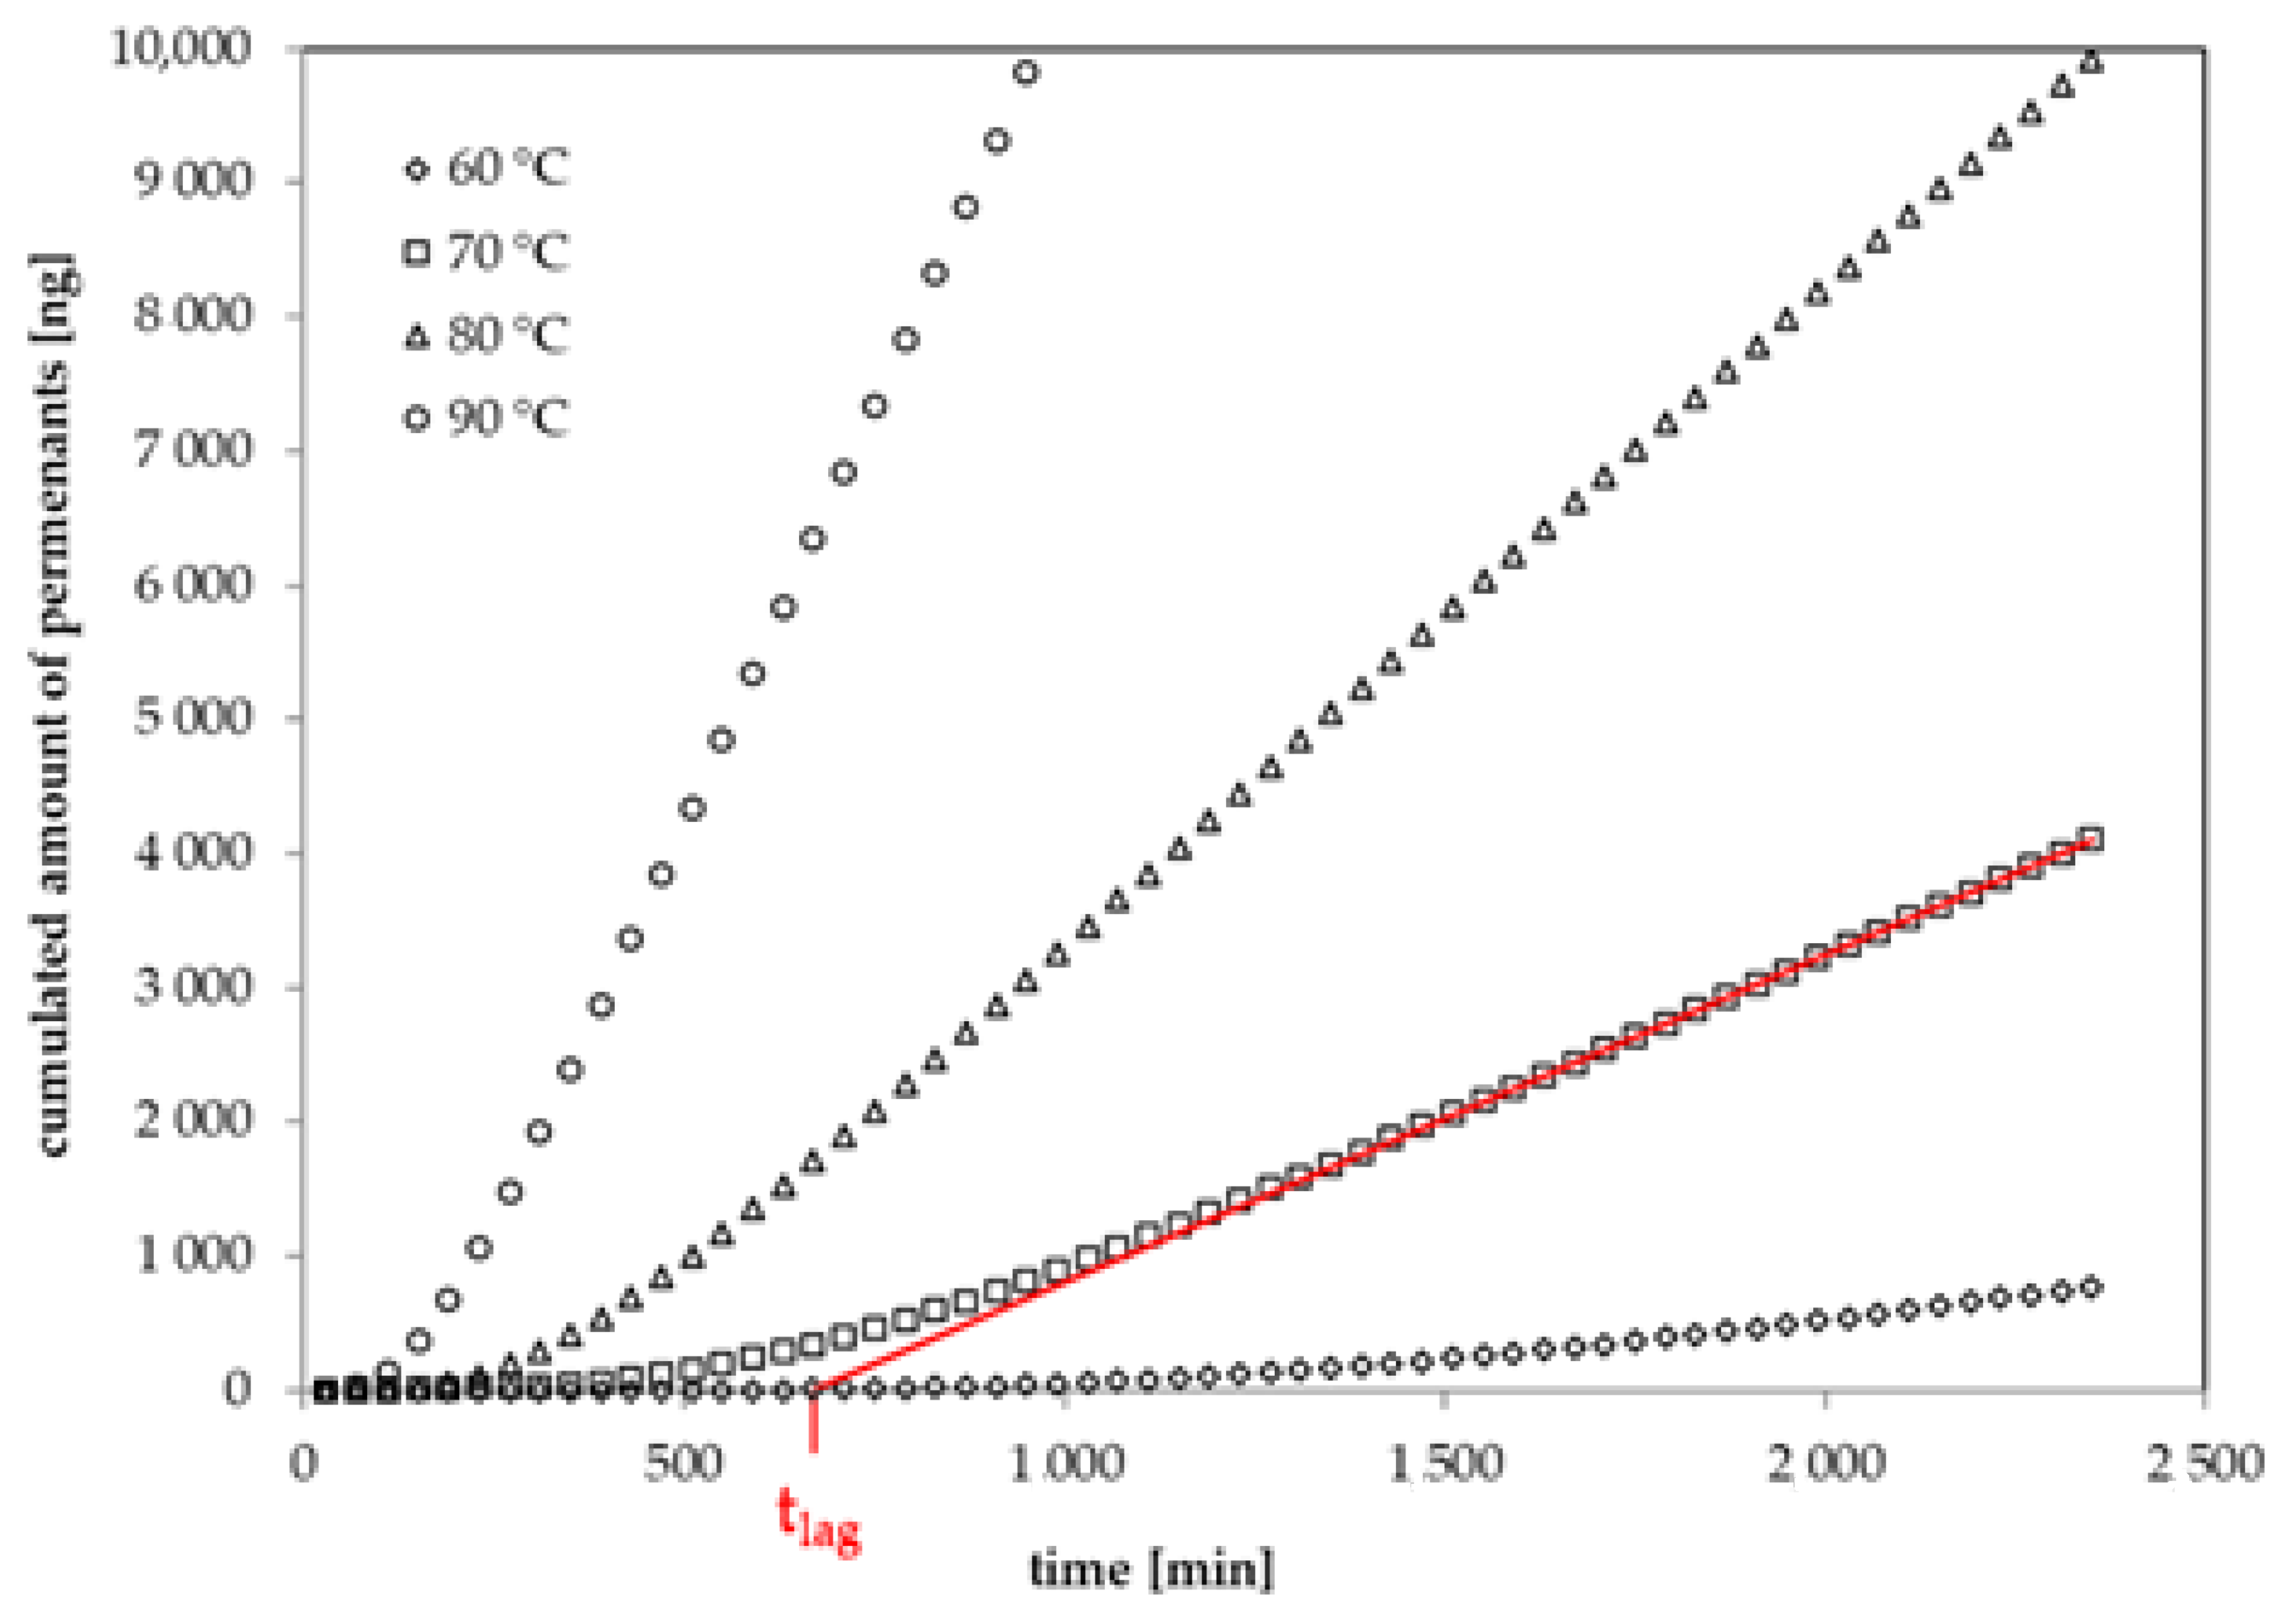
3.2. Diffusion Coefficients from Permeation Kinetics

The permeation curves of six 1-alcohols through a 34 µm biaxially oriented GPPS film were determined in this study. The diffusion coefficients were determined from the lag times of the permeation curves according to Equation (2). The lag time tlag is defined as the intercept of the asymptote to the permeation curve on the time-axis [22]. In previous studies, the same method was applied on thin films of oriented polyamide (PA6) [24], polyethylene terephthalate (PET) [23,25], polyethylene naphthalate (PEN) [26] and ethylene vinyl alcohol copolymer (EVOH) [27]. Examples for the experimental permeation curves for 1-butanol through the investigated GPPS film at temperatures between 60 °C and 90 °C are given in Figure 2. The permeation curves of the other substances measured within this study follow a similar behavior. The diffusion coefficients DP for the applied 1-alcohols are summarized in Table 5. Permeation tests with n-alkanes failed because the film became brittle and broke under the applied temperature and concentration conditions.
The lag times and diffusion coefficients in the biaxially oriented GPPS film were determined at temperatures between 0 °C and 90 °C. However, it was only for methanol and ethanol diffusion that coefficients could be determined at temperatures of 0 °C and 25 °C, because the diffusion coefficients DP of all other 1-alcohols were too low at ambient temperatures. Diffusion coefficients increase significantly with molecular volume and therefore the lag time increases accordingly. For example, given a diffusion coefficient DP of 9.2 × 10⁻¹⁵ cm2/s, which is the expected diffusion coefficient of 1-butanol from the results of this study, a lag time of 6.6 years is predicted according to Equation (2). Raising up the temperature to 30 °C, the lag time is still around 3 years and hard to be measured in a reasonable time. Thinner GPPS films, which will lead to significantly lower lag times for larger molecules, are not available on the market and also the handling with such thin and brittle films is difficult. Therefore, higher temperatures need to be applied for 1-alcohols starting from 1-propanol. It is interesting to note that the diffusion coefficients for methanol are more or less similar in the range of 1 to 3 × 10⁻⁹ cm2/s at all applied temperatures, which indicates that the activation energy of diffusion is virtually zero. The diffusion coefficients of ethanol increase in the same temperature interval from 2.8 × 10⁻¹¹ cm2/s (0 °C) to 1.6 × 10⁻⁹ cm2/s (90 °C) (Table 5).
In the permeation kinetic, the initial concentrations of the permeants in the lower cell (Table 2) were chosen such that they are a factor of approx. 200 below the saturated vapor pressure at each temperature. This avoids condensation of the permeants on the surface of the GPPS film. As a consequence, swelling of the polymer and the associated increase of the diffusion coefficients DP were minimized. Without swelling of the polymer, the determined coefficients can be considered as pure diffusion coefficients in the GPPS polymer. In other trials, the permeation n-alkanes were also tested at similar low concentrations in the gas phase. However, after the contact of the GPPS film with the n-alkanes, the film becomes brittle and a breakthrough of the permeants increased significantly with a non-Fickian diffusion behavior. Therefore, the diffusion coefficients cannot reliably be derived. Diffusion coefficients for n-alkanes are therefore not available from permeation tests on thin GPPS films.

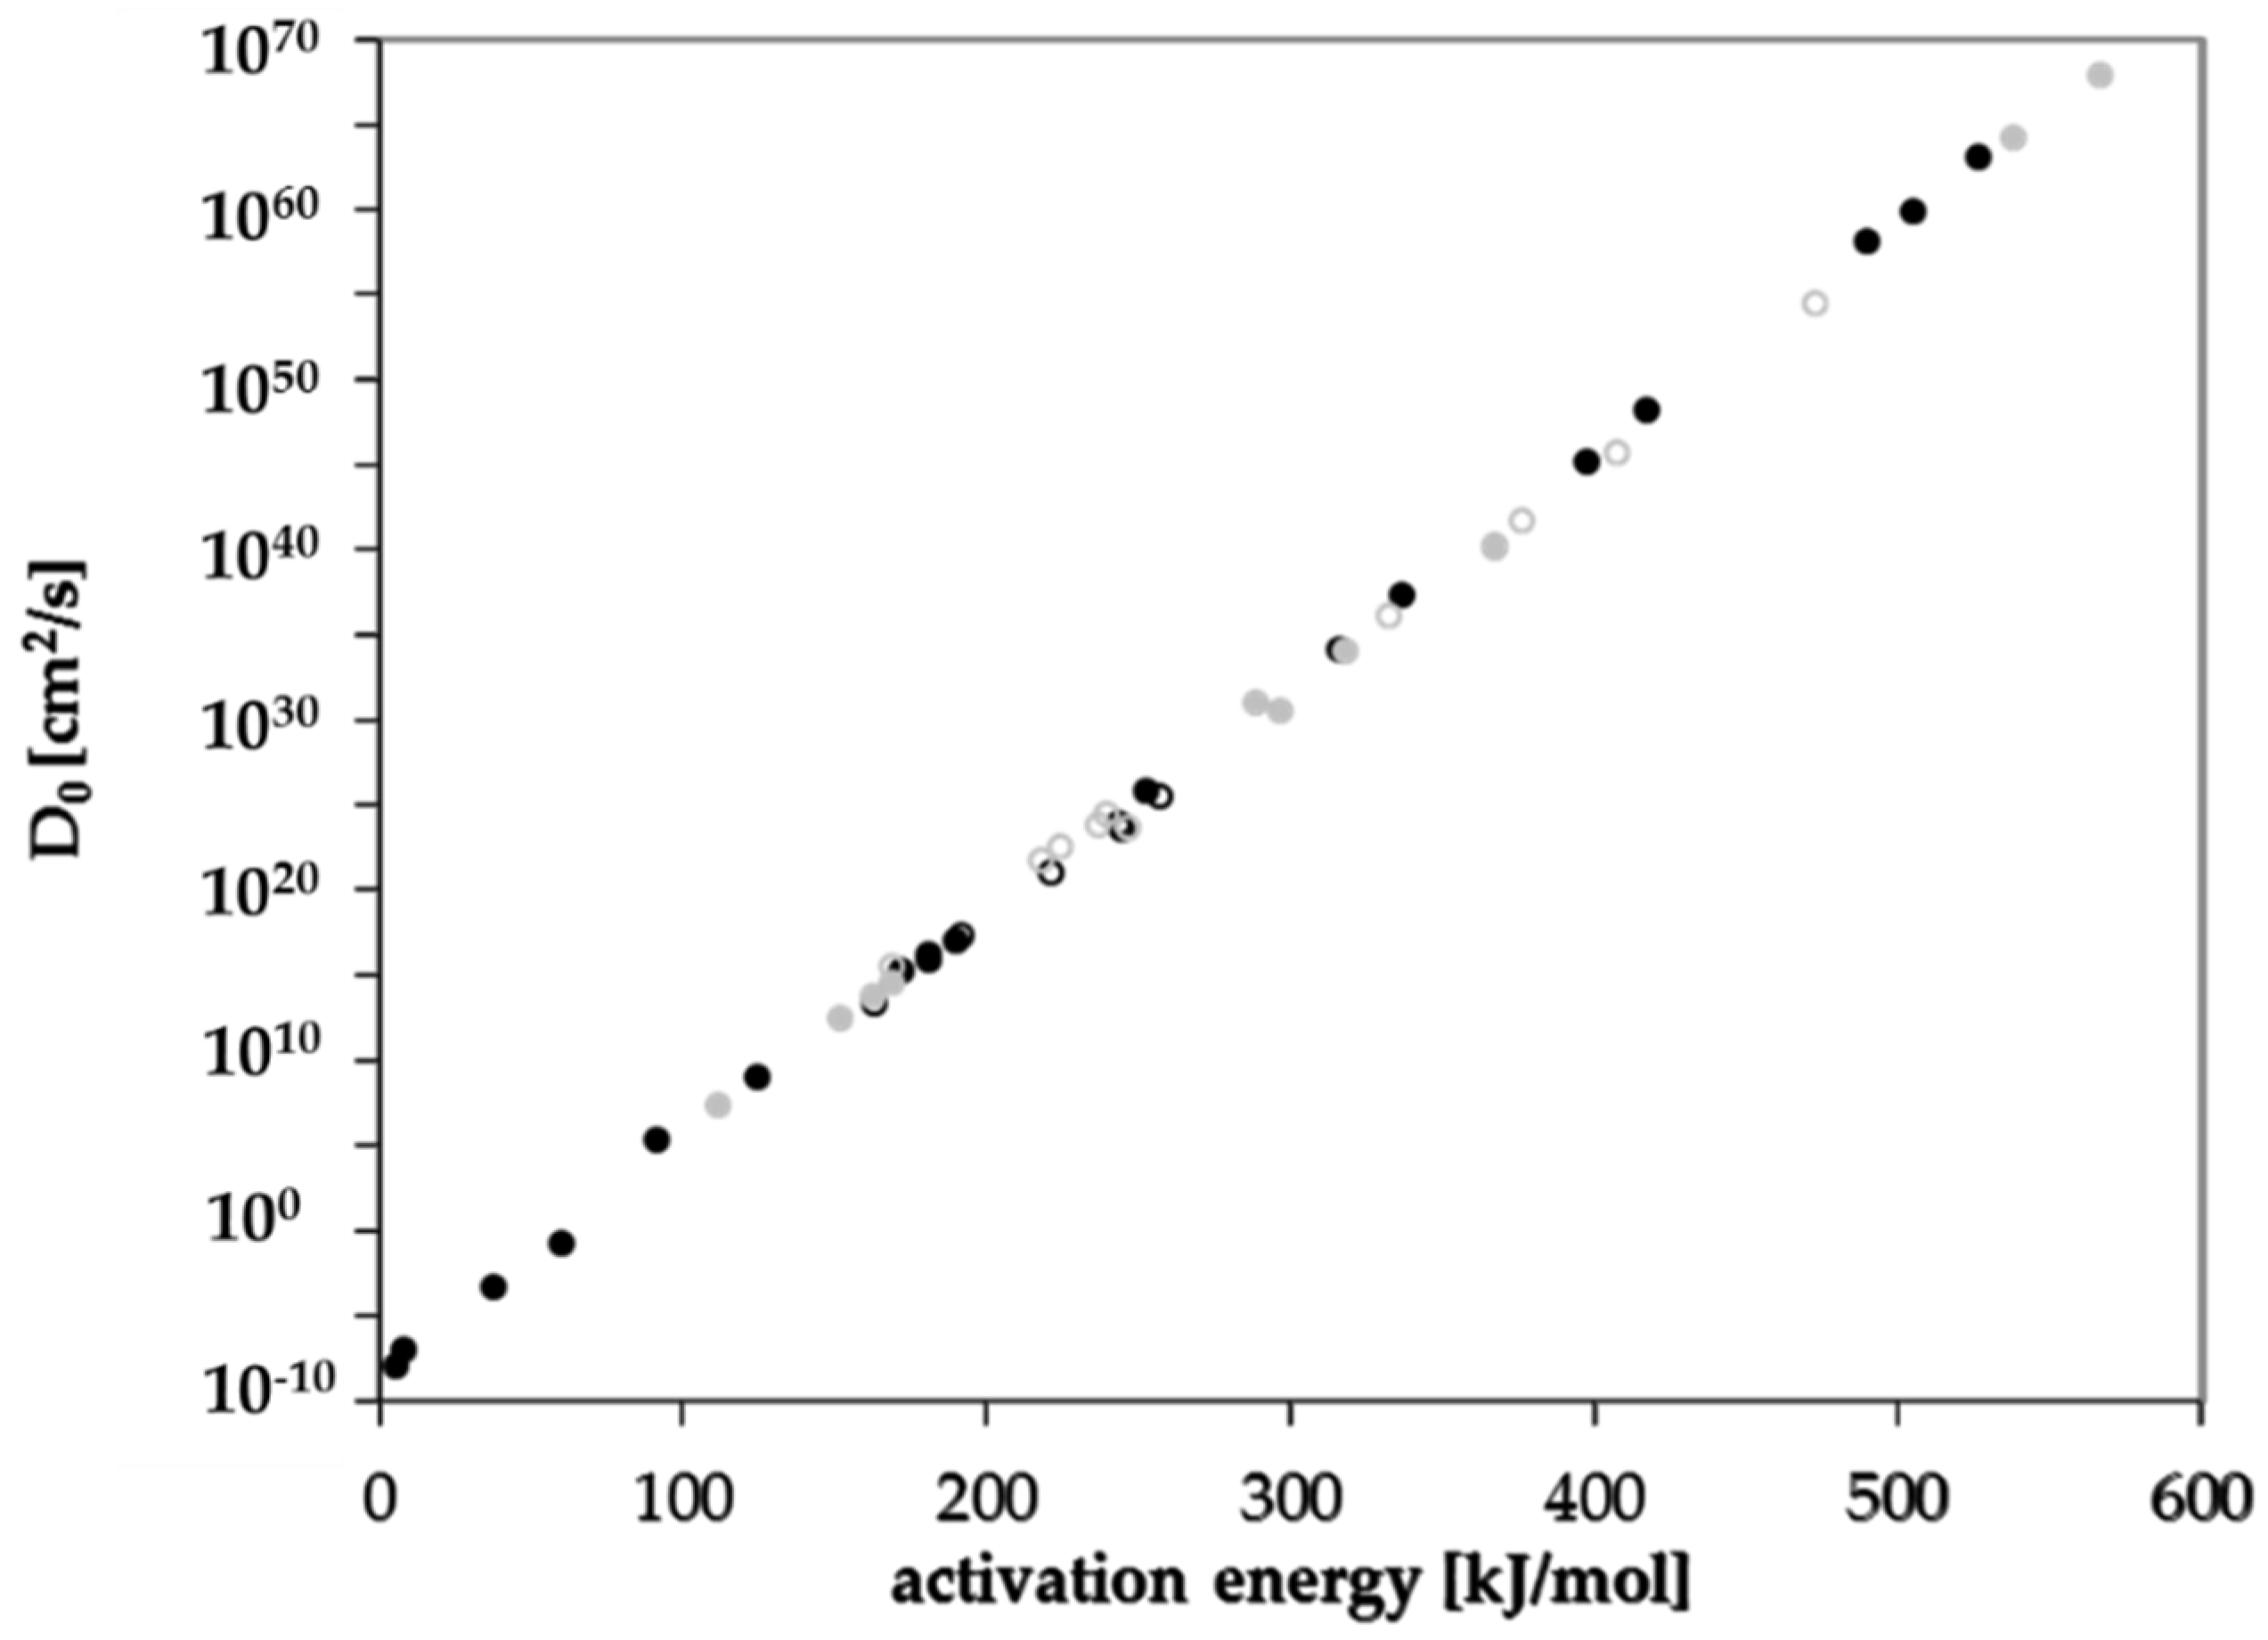
3.3. Activation Energies of Diffusion

Within this study the diffusion coefficients were determined at different temperatures between 75 and 115 °C. The activation energies of diffusion are calculated from the diffusion coefficients according to the Arrhenius approach [28]. In all cases, the Arrhenius plots show good linearity for the investigated substances. This indicates that the diffusion process follows Fickian laws and any swelling of the polymer by the permeants can be neglected under the experimental conditions applied within this study. Activation energies are only calculated when a minimum of four kinetic points are available. This serves to ensure that the values determined are sufficiently precise for using in the parameterization of the prediction parameters.
The determined diffusion coefficients show a strong dependency on the size of the migrating substance, represented by the molecular volume, as well as on temperature. As expected, for larger molecules, the diffusion coefficients are significantly lower when compared to very small molecules like acetone of methanol. In addition, lower temperatures result in lower diffusion coefficients for each individual permeant, which is in agreement with diffusion theory. From the slopes and the intercepts, the activation energies of diffusion EA as well as the pre-exponential factors D0 were calculated. The calculated activation energies of diffusion EA are given in Table 6 (GPPS) and Table 7 (HIPS). The Arrhenius plots and the correlation of the reciprocal temperature versus diffusion coefficient are given in Figure 3.
For n-alkanes and styrene diffusion, coefficients are available below and above the glass transition temperature Tg of 100 °C (Figure 3a). The results show that the diffusion behavior of GPPS and HIPS changes slightly at the glass transition temperature Tg (Figure 3a,b). The activation energies of diffusion EA are lower above Tg compared to the values below Tg, which results in a lower slope of the Arrhenius plot above Tg. The change in the diffusion behavior is more significant for larger molecules compared to smaller molecules. Relatively small sized molecules like styrene and n-octane show only a slight change in the diffusion behavior whereas n-octadecane shows a significant change of the diffusion behavior at the glass transition temperature. In the case of GPPS sheet 2, only one temperature was determined above Tg (Figure 3c). The results indicate that that for larger molecules like phenyl cyclohexane and benzophenone, the activation energy of diffusion EA is also lower above Tg compared to the slopes below Tg, which is in agreement with the results of the n-alkane spiked sheet. However, due to the fact that only one temperature is available, these findings are on a weak basis. However, the results are in agreement with the finding for HIPS (Figure 3d), where three temperatures were measured above Tg. Benzophenone shows a lower activation energy of diffusion EA above Tg.
The diffusion coefficients determined from the permeation test on the 34 µm GPPS film are determined only below the glass transition temperature at temperatures between 0 °C and 90 °C (Figure 3e). Therefore, no conclusion can be drawn regarding the diffusion behavior above Tg from the results of the permeation tests. In a previous study on PET, we found no significant change of the diffusion behavior at the glass transition temperature of 69 °C [19]. However, the tested substance (tetrahydrofuran, THF) is also a relatively small molecule and larger molecules might also show a change of the diffusion behavior of PET. Thus, the results of this study on PS might be consistent with the results of the previous study on PET.

3.4. Prediction of Diffusion Coefficients

Diffusion coefficients at various temperatures were determined in this study from which activation energies of diffusion were derived. Based on these experimentally determined activation energies, a correlation between activation energies of diffusion EA and the molecular volume of the migrant V was established for GPPS and HIPS (Figure 4). Similar correlations between EA and V were found in the literature for other polymers like PET [25], polycycloolefin polymer (COP) [20], polyethylene naphthalate (PEN) [26] and polyethylene vinylalcohol copolymer (EVOH) [27]. All tested compounds follow the correlation between the EA and V nearly independent from chemical nature, functional groups or polarity of the molecules. Therefore, most probably also other organic molecules in PS might follow similar correlations. Due to slight effects of polarity or experimental uncertainties, the correlation of the activation energies of diffusion EA and the molecular volume V shows a slight variance. As expected, the diffusion below and above the glass transition temperature is different, resulting in different correlations between the activation energies of diffusion EA and the molecular volume V. As discussed above, for a given molecular volume V, the activation energies of diffusion EA above Tg are lower than below Tg as indicated for the substances styrene, n-octane, n-decane, n-dodacane, n-tetradecane, and n-hexadecane. As shown in Figure 5, also the pre-exponential factor D0 correlates also with the activation energy EA for GPPS and HIPS, above as well as below the glass transition temperature. The role of the correlation between the pre-exponential factor D0 and the activation energy EA has been discussed in the literature as a so-called “compensation effect” [29] or “Meyer–Neldel rule” [30] and was also found in previous studies [20,25,26,27]. As a consequence of this effect, the activation energy EA and the pre-exponential factor D0 are not independent from each other. This correlation was established over 16 orders of magnitude in the case of PET [25], 29 for COP [20], 23 for PEN [26], 30 for EVOH [27] and 74 orders of magnitude for PS in this study. It is noteworthy that in the case of GPPS and HIPS, the correlation does not significantly change below and above Tg, whereas the correlation between the molecular volume V and the activation energy of diffusion EA is different below and above the glass transition temperature. From the correlations given in Figure 4 and Figure 5, the activation energies of diffusion EA as well as the pre-exponential factor D0 can be predicted for other non-tested substances. From both values, the diffusion coefficients are available at any temperature within the measured temperature intervals. Assuming that the Arrhenius plot is linear over a broader temperature range, diffusion coefficients can also be predicted at lower temperatures, e.g., room temperature. An equation was established combining both correlations and is given in Equation (3). The prediction of diffusion coefficients might be an important tool for the prediction of the mass transfer from PS into contact media, e.g., foodstuffs.
Based on the correlations shown in Figure 4 and Figure 5, the parameters a to d in Equation (3) were derived according to the procedure published in [25]. The parameters a to d for Equation (3) below and above the glass transition temperature are given in Table 8. It should be noted that the parameters for GPPS above the glass transition temperature are derived only from six individual activation energies of diffusion and pre-exponential factors, whereas the correlation below the glass transition temperature is based on 17 activation energies of diffusion. The correlation above the glass transition temperature therefore is associated with a high degree of uncertainty and the values should be used with caution. The parameters for HIPS were derived from ten activation energies of diffusion below and above the glass transition temperature.
The parameter a is the slope of the correlation between the activation energies of diffusion EA and the pre-exponential factor D0 of the Arrhenius equation. When this reciprocal temperature a is reached, the diffusion coefficients reaches its maximum value, which is the factor b. The parameter b is therefore the highest diffusion coefficient, which can be reached in the investigated temperature interval. When the molecular volume reaches the parameter c, the activation energy of diffusion reaches zero and the diffusion coefficients are the same at any temperatures, which is again the parameter b but at the same time also D0 when the molecular volume V is the parameter c. The parameter d is a measure of the extent to which the activation energy of diffusion is influenced by the molecular volume V of the migrant in different polymers.
D P = b ( V c ) a 1 T d
For migration modelling used for food law compliance evaluation, the applied prediction models should be over-estimative, because the predicted migration is in any case higher as the experimentally determined migration [31]. As a consequence, the predicted diffusion coefficients DP needs to be higher as the measured diffusion coefficients for each molecule in any case.
An artificial reduction, e.g., of 20% of the molecular volume seems to sufficient to overestimate the experimentally determined migration in case of PET [25]. These diffusion coefficients might be considered as worst-case diffusion coefficients for food law compliance evaluation. Systematic studies for polystyrene are not available to date, so that the amount of volume reduction needs to part of further investigations. On the other hand, when using migration modelling for the prediction of the decontamination efficiency in PS recycling processes, over-estimation will be the best-case. In this case, the molecular volume should be increased in order to get slightly lower diffusion coefficients DP for the prediction of the worst-case cleaning efficiencies of a recycling process. In conclusion, by use of Equation (3), the diffusion coefficients of other non-tested substances in GPPS and HIPS can be predicted for any temperature between 0 °C and 115 °C if the molecular volume V is known.
Polarity of the substances seems to play a minor role on the correlations in Figure 4. The polarity and the functional groups of the molecules influences the partition coefficient K between the polymer and the gas phase. This is discussed in previous studies [24,26].
It is interesting to note that the very low molecular weight alcohols like methanol and ethanol have molecular volumes V which are smaller or near the volume of parameter c for GPPS. According to Equation (3), molecules with a molecular volume of parameter c result in an activation energy of diffusion of 0 kJ/mol and the diffusion coefficient is equivalent to factor b. For methanol, an activation energy of diffusion of 4.9 kJ/mol was determined which is within the analytical uncertainties in good agreement with Equation (3). For ethanol, an activation energy of diffusion of 37.3 kJ/mol was determined from the permeation tests. The activation energy of acetone was determined to 7.6 kJ/mol, which was also in good agreement with the Equation (3) and the set of parameters given in Table 8 for GPPS.

3.5. Prediction of Migration into Food and Food Simulants

Within this study, the diffusion coefficients were determined from permeation and migration experiments into the gas phase. Therefore, interaction of contact media like sorption and swelling of the polymer were minimized. Since swelling effects of the polymer matrix by sorption of the simulants is thereby negligible, the migration is independent of the simulant and the mass transfer is affected only by the diffusion of the migrant in the polymer. Interactions between contact media and polymers increase the migration which is an important parameter when using GPPS and HIPS in food packaging applications. The phenomena of sorption and swelling are well-known from migration kinetics into food simulants, e.g., the loss of functional barrier properties of PS functional barrier layers [32]. Strong interactions of PS with coconut oil, palm kernel oil, Miglyol, 10% ethanol, 50% ethanol and goat’s milk have been reported [15] in the case of polystyrene (in this publication, it is unclear if it is GPPS or HIPS), which indicate that these foods and simulants can swell the polymer matrix and increase the diffusion of potential migrants into food and simulants. A similar behavior is reported for acrylonitrile butadiene copolymer (ABS) [33]. Interaction between the polymer and the food simulants mainly influences the migration into food, which was also reported for PET [34]. However, real food does not swell the packaging polymer significantly, especially at low temperatures, otherwise packaging polymer might be unsuitable for this purpose. Swelling of food simulants compared to real food is shown for ABS in Lit. [33]. However, for convenience and as specified in regulatory guidelines, food compliance testing is typically performed with simulants like 50% ethanol or iso-octane. This leads to a strong over-estimation of the level of migration [33,34]. In addition, sorption and swelling had an influence also on the diffusion coefficients determined in PS. Genualdi et al. determined the diffusion coefficients of styrene and styrene oligomers into the food simulant 95% ethanol at 40 °C [35]. The diffusion coefficients are significantly higher as predicted from the results of this study, which is most probably due to the swelling effect of 95% ethanol as food simulant. The influence of swelling is also visible in the proposed prediction parameters, if migration data in swollen PS is taken into account [36]. In this recent compilation study, most of the diffusion coefficients were determined under swollen conditions, e.g., PS in neat solvents at high temperature in [37,38,39]. This leads to a strong over-estimation of the diffusion coefficients and therefore also to the derived modelling parameters. Realistic diffusion coefficients as derived from this study might lead to a more realistic prediction of the migration of polymer constituents into food.

4. Conclusions

Within this study, diffusion coefficients and activation energies of diffusion were determined experimentally from desorption kinetics into the gas phase. Activation energies of diffusion for a broad range of molecules below and above the glass transition temperature are not available in the scientific literature, which is the novelty of this study. From experimentally determined activation energies of diffusion, parameters for the prediction of the diffusion coefficients in GPPS and HIPS were established below and above the glass transition temperature of both polymers. These parameters a and b in Equation (3) were derived from the correlation between the pre-exponential factors D0 and the activation energies of diffusion EA. The parameters c and d were derived from the correlation between the activation energies of diffusion EA and the molecular volume V of the investigated substances. From Equation (3) and the parameters a to d the diffusion coefficients DP of other, non-tested organic substances can be predicted. In addition to the desorption kinetics, diffusion coefficients of the homologous row of 1-alcohols were determined by permeation tests through a thin GPPS film. The results of both methods, desorption and permeation kinetics, are in good agreement. Due to the fact that all diffusion coefficients were determined in gas phase kinetics, swelling effects and interactions between solvents and PS can be excluded. Therefore, the prediction parameters established within this study can be considered a pure diffusion coefficients. Most of the diffusion coefficients found in the scientific literature might include also swelling effects of the polymers with simulant media. Pure diffusion coefficients in polystyrene polymers might be useful for the understanding of the diffusion and migration processes. Migration modelling based on experimentally determined activation energies of diffusion, as established within this study, might therefore offer a basis for a more realistic estimation of the migration of polymer constituents into food.

Funding

The study on GPPS was financed by Fraunhofer IVV.

Institutional Review Board Statement

Not applicable.

Informed Consent Statement

Not applicable.

Data Availability Statement

The data presented in this study are available on request from the corresponding author.

Acknowledgments

Thanks are due to Silvia Demiani, Johann Ewender, Anita Gruner, Alexandra Mauer and Norbert Rodler (all Fraunhofer IVV) for experimental contributions to this work. Further thanks are due to Frank Eisenträger (Ineos), Frank Kramer (Ineos) and Mark Pamperton (Systox) for proofreading.

Conflicts of Interest

The author declares no conflict of interest.

References

  1. Block, C.; Brands, B.; Gude, T. Packaging Materials 2. Polystyrene for Food Packaging Applications—Updated Version; International Life Sciences Institute: Brussels, Belgium, 2017; ISBN 9789078637448. [Google Scholar]
  2. Briston, J. Advances in Plastics Packaging Technology; Pira International: Leatherhead, UK, 1992; Chapter 6; pp. 45–47. [Google Scholar]
  3. Ozaki, A.; Kishi, E.; Kaneko, R.; Ooshima, T.; Shimizu, M.; Kawamura, Y. Validation Study on Headspace-GC Analytical Method for Residual Volatile Substances in Food Contact Polystyrene and Its Application for Surveillance (1998–2014). J. Food Hyg. Soc. Jpn. (Shokuhin Eiseigaku Zasshi) 2015, 56, 166–172. [Google Scholar] [CrossRef] [Green Version]
  4. Paraskevopoulou, D.; Achilias, D.S.; Paraskevopoulou, A. Migration of styrene from plastic packaging based on polystyrene into food simulants. Polym. Int. 2011, 61, 141–148. [Google Scholar] [CrossRef]
  5. Ramesh, N.; Duda, J. Predicting migration of trace amounts of styrene in poly(styrene) below the glass transition temperature. Food Chem. Toxicol. 2001, 39, 355–360. [Google Scholar] [CrossRef]
  6. Tawfik, M.S.; Huyghebaert, A. Polystyrene cups and containers: Styrene migration. Food Addit. Contam. 1998, 15, 592–599. [Google Scholar] [CrossRef]
  7. Linssen, J.; Reitsma, J. Comparison of migration of styrene monomer from high impact polystyrene in oil in water emulsions and fatty foods. J. Polym. Eng. 1995, 15, 133–138. [Google Scholar] [CrossRef]
  8. O’Neill, E.T.; Tuohy, J.J.; Franz, R. Comparison of milk and ethanol/water mixtures with respect to monostyrene migration from a polystyrene packaging material. Int. Dairy J. 1994, 4, 271–283. [Google Scholar] [CrossRef]
  9. Begley, T.; Castle, L.; Feigenbaum, A.; Franz, R.; Hinrichs, K.; Lickly, T.; Mercea, P.; Milana, M.R.; O’Brien, A.; Rebre, S.R.; et al. Evaluation of migration models that might be used in support of regulations for food-contact plastics. Food Addit. Contam. 2005, 22, 73–90. [Google Scholar] [CrossRef] [Green Version]
  10. Nakai, M.; Tsubokura, M.; Suzuki, M.; Fujishima, S.; Watanabe, Y.; Hasegawa, Y.; Oyama, K.; Ogura, S. Genotoxicity of styrene oligomers extracted from polystyrene intended for use in contact with food. Toxicol. Rep. 2014, 1, 1175–1180. [Google Scholar] [CrossRef] [PubMed] [Green Version]
  11. Choi, J.O.; Jitsunari, F.; Asakawa, F.; Lee, D.S. Migration of styrene monomer, dimers and trimers from polystyrene to food simulants. Food Addit. Contam. 2005, 22, 693–699. [Google Scholar] [CrossRef] [PubMed]
  12. Klärner, P.; Klenz, R.; Eder, R.; Volz, W.E.; Schnell, H.W.; Leyendecker, D.; Güntner, A.; Nieβner, N.; Morris, C.R.; Christian, M.S. Preparation and Analysis of Styrene Oligomers Containing Migrates from Various Polystyrenes Used in Food Packaging. Drug Chem. Toxicol. 1998, 21, 31–49. [Google Scholar] [CrossRef] [PubMed]
  13. Kawamura, Y.; Nishi, K.; Sasaki, H.; Yamada, T. Determination Method of Styrene Dimers and Trimers in Instant Noodles Contained in Polystyrene Cups. J. Food Hyg. Soc. Jpn. (Shokuhin Eiseigaku Zasshi) 1998, 39, 310–314_1. [Google Scholar] [CrossRef] [Green Version]
  14. Khaksar, M.-R.; Ghazi-Khansari, M. Determination of migration monomer styrene from GPPS (general purpose polystyrene) and HIPS (high impact polystyrene) cups to hot drinks. Toxicol. Mech. Methods 2009, 19, 257–261. [Google Scholar] [CrossRef]
  15. Genualdi, S.; Ntim, S.A.; Begley, T. Suitability of polystyrene as a functional barrier layer in coloured food contact materials. Food Addit. Contam. Part A 2015, 32, 1–8. [Google Scholar] [CrossRef]
  16. Dole, P.; Feigenbaum, A.E.; De La Cruz, C.; Pastorelli, S.; Paseiro, P.; Hankemeier, T.; Voulzatis, Y.; Aucejo, S.; Saillard, P.; Papaspyrides, C. Typical diffusion behaviour in packaging polymers – application to functional barriers. Food Addit. Contam. 2006, 23, 202–211. [Google Scholar] [CrossRef] [PubMed]
  17. Welle, F. Is PET bottle-to-bottle recycling safe? Evaluation of post-consumer recycling processes according to the EFSA guidelines. Resour. Conserv. Recycl. 2013, 73, 41–45. [Google Scholar] [CrossRef]
  18. Welle, F. Simulation of the Decontamination Efficiency of PET Recycling Processes based on Solid-state Polycondensation. Packag. Technol. Sci. 2012, 27, 141–148. [Google Scholar] [CrossRef]
  19. Ewender, J.; Welle, F. Determination of the activation energies of diffusion of organic molecules in poly(ethylene terephthalate). J. Appl. Polym. Sci. 2012, 128, 3885–3892. [Google Scholar] [CrossRef]
  20. Welle, F. Activation energies of diffusion of organic migrants in cyclo olefin polymer. Int. J. Pharm. 2014, 473, 510–517. [Google Scholar] [CrossRef]
  21. The Molecular Volumes Were Calculated from the Free Internet Program Molinspiration. Available online: http://www.molinspiration.com (accessed on 10 May 2018).
  22. Coulson, C.A.; Crank, J. The Mathematics of Diffusion. Math. Gaz. 1958, 42, 165. [Google Scholar] [CrossRef] [Green Version]
  23. Ewender, J.; Welle, F. Determination and Prediction of the Lag Times of Hydrocarbons through a Polyethylene Terephthalate Film. Packag. Technol. Sci. 2014, 27, 963–974. [Google Scholar] [CrossRef]
  24. Ewender, J.; Welle, F. Functional Barrier Performance of a Polyamide-6 Membrane Towards n -Alkanes and 1-Alcohols. Packag. Technol. Sci. 2016, 29, 277–287. [Google Scholar] [CrossRef]
  25. Welle, F. A new method for the prediction of diffusion coefficients in poly(ethylene terephthalate). J. Appl. Polym. Sci. 2013, 129, 1845–1851. [Google Scholar] [CrossRef]
  26. Ewender, J.; Welle, F. Diffusion Coefficients of n-Alkanes and 1-Alcohols in Polyethylene Naphthalate (PEN). Int. J. Polym. Sci. 2019, 2019, 2748649. [Google Scholar] [CrossRef] [Green Version]
  27. Kaiser, K.M.A.; Ewender, J.; Welle, F. Recyclable Multilayer Packaging by Means of Thermoreversibly Crosslinking Adhesive in the Context of Food Law. Polymer 2020, 12, 2988. [Google Scholar] [CrossRef] [PubMed]
  28. Arrhenius, S. Über die Dissoziationswärme und den Einfluss der Temperatur auf den Dissoziationsgrad der Elektrolyte. Zeitschrift für Physikalische Chemie 1889, 4, 96–116. [Google Scholar] [CrossRef] [Green Version]
  29. Overington, A.R.; Wong, M.; Harrison, J.A.; Ferreira, L.B. Estimation of Mass Transfer Rates through Hydrophobic Pervaporation Membranes. Sep. Sci. Technol. 2009, 44, 787–816. [Google Scholar] [CrossRef]
  30. Meyer, W.; Neldel, H. Über die Beziehung zwischen der Energiekonstanten und der Mengenkonstanten a in der Leitwerts-Temperaturformel bei oxydischen Halbleitern. Zeitschrift für Technische Physik 1937, 12, 588–593. [Google Scholar]
  31. Regulation (EU) No 10/2011. Commission Regulation (EU) on Plastic Materials and Articles Intended to Come into Contact with Food. 2011. Available online: https://eur-lex.europa.eu/legal-content/EN/ALL/?uri=CELEX%3A32011R0010 (accessed on 16 April 2021).
  32. Franz, R.; Huber, M.; Piringer, O. Presentation and experimental verification of a physico-mathematical model describing the migration across functional barrier layers into foodstuffs. Food Addit. Contam. 1997, 14, 627–640. [Google Scholar] [CrossRef]
  33. Guazzotti, V.; Ebert, A.; Gruner, A.; Welle, F. Migration from acrylonitrile butadiene styrene (ABS) polymer: Swelling effect of food simulants compared to real foods. J. Consum. Prot. Food Saf. 2021, 16, 19–33. [Google Scholar] [CrossRef]
  34. Gehring, C.; Welle, F. Migration Testing of Polyethylene Terephthalate: Comparison of Regulated Test Conditions with Migration into Real Food at the End of Shelf Life. Packag. Technol. Sci. 2018, 31, 771–780. [Google Scholar] [CrossRef]
  35. Genualdi, S.; Nyman, P.; Begley, T. Updated evaluation of the migration of styrene monomer and oligomers from polystyrene food contact materials to foods and food simulants. Food Addit. Contam. Part A 2014, 31, 723–733. [Google Scholar] [CrossRef] [PubMed]
  36. Martínez-López, B.; Gontard, N.; Peyron, S. Worst case prediction of additives migration from polystyrene for food safety purposes: A model update. Food Addit. Contam. Part A 2017, 35, 563–576. [Google Scholar] [CrossRef] [Green Version]
  37. Bernardo, G.; Choudhury, R.P.; Beckham, H.W. Diffusivity of small molecules in polymers: Carboxylic acids in polystyrene. Polymer 2012, 53, 976–983. [Google Scholar] [CrossRef]
  38. Bernardo, G. Diffusivity of alcohols in amorphous polystyrene. J. Appl. Polym. Sci. 2012, 127, 1803–1811. [Google Scholar] [CrossRef]
  39. Bernardo, G. Diffusivity of alkanes in polystyrene. J. Polym. Res. 2012, 19, 9836. [Google Scholar] [CrossRef]
Figure 1. Gas phase migration kinetics of (a) n-octane from general purpose polystyrene (GPPS) at temperatures between 80 °C and 100 °C, (b) chlorobenzene from GPPS at temperatures between 85 °C and 105 °C, (c) n-dodecane from high impact polystyrene (HIPS) at temperatures between 80 °C and 100 °C and (d) toluene from HIPS at temperatures between 80 °C and 100 °C.
Polymers 13 01317 g001
Figure 2. Experimental permeation curves for 1-butanol at 60 °C, 70 °C, 80 °C and 90 °C (lag time at 70 °C: intercept of the red line on the time-axis).
Polymers 13 01317 g002
Figure 3. Correlation between ln D and reciprocal temperature (Arrhenius-plot) for (a) GPPS for n-alkanes, (b) HIPS for n-alkanes, (c) GPPS for non alkanes, (d) HIPS for non alkanes and (e) GPPS for 1-alcohols from the permeation tests.
Polymers 13 01317 g003
Figure 4. Correlation between the molecular volume V and the activation energy of diffusion EA for (a) GPPS and (b) HIPS below Tg (solid dots) and above Tg (non-solid dots).
Polymers 13 01317 g004
Figure 5. Correlation between the pre-exponential factor D0 and the activation energy of diffusion EA below Tg (solid dots, solid line) and above Tg (non-solid dots, dashed line): black dots GPPS, grey dots HIPS.
Polymers 13 01317 g005
Table 1. Experimentally determined concentrations of model compounds in the spiked polystyrene (PS) sheets.
SheetSubstanceSpiked Concentration (mg/kg)
General Purpose Polystyrene (GPPS)High Impact Polystyrene (HIPS)
sheet 1n-Octane422 ± 5474 ± 37
n-Decane486 ± 4354 ± 4
n-Dodecane518 ± 3610 ± 8
n-Tetradecane531 ± 4692 ± 15
n-Hexadecane538 ± 5709 ± 19
n-Octadecane522 ± 5674 ± 19
Styrene 1627 ± 22354 ± 2
sheet 2Acetone180 2/
Ethyl acetate270 2500 2
Toluene464 ± 3763 ± 11
Chlorobenzene521 ± 4821 ± 13
Phenyl cyclohexane627 ± 61229 ± 33
Benzophenone538 ± 71002 ± 27
Styrene 1595 ± 5363 ± 6
1 residual monomer, not artificially added, 2 estimated from headspace gas chromatography.
Table 2. 1-Alcohols and their upstream concentrations used in permeation testing.
Temperature (°C)Concentration (µg/L)
MethanolEthanol1-Propanol1-Butanol1-Pentanol1-Hexanol
09.1612.89.297.495.653.76
2527.528.327.922.517.011.3
4054.976.755.845.033.945.0
6020128120416512482.8
70330460335270203135
80549767558450339226
909161280929749565376
Table 3. Experimentally determined diffusion coefficients of n-alkanes and styrene in polystyrene GPPS and HIPS (sheet 1) from desorption kinetics.
PolymerTemperatureDiffusion Coefficient (cm2/s)
(°C)n-Octanen-Decanen-Dodecanen-Tetradecanen-Hexadecanen-OctadecaneStyrene
GPPS803.4 × 10−122.8 × 10−133.0 × 10−144.7 × 10−151.5 × 10−151.6 × 10−151.5 × 10⁻¹¹
851.4 × 10−112.2 × 10−124.3 × 10−131.1 × 10−134.1 × 10−141.9 × 10−143.3 × 10⁻¹¹
903.8 × 10−118.6 × 10−122.4 × 10−128.9 × 10−134.3 × 10−132.8 × 10−137.1 × 10⁻¹¹
951.1 × 10−103.3 × 10−111.2 × 10−116.3 × 10−123.4 × 10−121.6 × 10−121.8 × 10⁻¹⁰
1003.8 × 10−101.6 × 10−107.5 × 10−114.2 × 10−112.6 × 10−111.8 × 10−114.1 × 10⁻¹⁰
1058.6 × 10−104.0 × 10−102.1 × 10−101.3 × 10−107.6 × 10⁻¹¹ 9.7 × 10⁻¹⁰
1102.0 × 10−91.1 × 10−96.3 × 10−104.1 × 10−102.6 × 10⁻¹⁰ 1.6 × 10⁻⁹
1154.0 × 10−92.4 × 10−91.5 × 10−99.9 × 10−105.2 × 10⁻¹⁰ 3.3 × 10⁻⁹
HIPS802.5 × 10−12artefacts 18.6 × 10−146.7 × 10−161.8 × 10⁻¹⁶
902.0 × 10⁻¹¹ 1.6 × 10−123.1 × 10−148.1 × 10⁻¹⁵
951.8 × 10⁻¹⁰ 6.5 × 10−121.4 × 10−125.0 × 10⁻¹³
1004.0 × 10−10 3.0 × 10−119.7 × 10−124.6 × 10⁻¹²
1051.9 × 10−9 2.0 × 10−108.2 × 10−114.6 × 10⁻¹¹
1102.9 × 10−9 4.9 × 10−102.3 × 10−101.4 × 10⁻¹⁰
1 not determined due to analytical artefacts.
Table 4. Experimentally determined diffusion coefficients of n-alkanes and styrene in polystyrene GPPS and HIPS (sheet 2) from desorption kinetics.
PolymerTemperatureDiffusion Coefficient (cm2/s)
(°C)AcetoneEthyl AcetateTolueneChlorobenzenePhenyl CyclohexaneBenzophenoneStyrene
GPPS859.8 × 10−91.1 × 10−91.0 × 10−102.0 × 10−102.1 × 10−131.4 × 10−122.9 × 10⁻¹¹
901.1 × 10−81.8 × 10−92.1 × 10−103.9 × 10−101.2 × 10−125.7 × 10−126.4 × 10⁻¹¹
951.2 × 10−83.3 × 10−94.9 × 10−108.8 × 10−109.5 × 10−122.8 × 10−111.5 × 10⁻¹⁰
1001.0 × 10−85.2 × 10−91.1 × 10−91.9 × 10−94.1 × 10−119.6 × 10−113.5 × 10⁻¹⁰
1051.2 × 10−89.8 × 10−92.4 × 10−94.0 × 10−91.2 × 10−101.5 × 10−108.3 × 10⁻¹⁰
HIPS75artefacts 15.1 × 10−102.9 × 10−114.5 × 10⁻¹¹ 1.8 × 10⁻¹¹
80 6.9 × 10−104.6 × 10−116.9 × 10−116.4 × 10−154.5 × 10−142.9 × 10⁻¹¹
85 1.3 × 10−91.2 × 10−101.7 × 10−104.0 × 10−141.7 × 10−137.9 × 10⁻¹¹
90 2.2 × 10−92.4 × 10−103.3 × 10−101.5 × 10−135.5 × 10−134.0 × 10⁻¹¹
100 6.3 × 10−91.1 × 10−91.4 × 10−95.1 × 10−121.0 × 10−118.2 × 10⁻¹⁰
105 1.3 × 10−83.6 × 10−94.2 × 10−93.4 × 10−114.9 × 10−112.7 × 10⁻⁹
110 2.3 × 10−87.8 × 10−98.7 × 10−91.4 × 10−101.1 × 10−106.2 × 10⁻⁹
115 5.4 × 10−82.0 × 10−82.2 × 10−85.3 × 10−102.3 × 10−101.7 × 10⁻⁸
1 not determined due to analytical artefacts.
Table 5. Experimentally determined diffusion coefficients DP in GPPS of 1-alcohols from permeation kinetics.
Temperature (°C)Diffusion Coefficient (cm2/s)
MethanolEthanol1-Propanol1-Butanol1-Pentanol1-Hexanol
01.2 × 10−92.8 × 10−11
252.2 × 10−91.7 × 10−10
403.1 × 10−93.8 × 10−102.5 × 10−112.7 × 10⁻¹²
602.7 × 10−91.0 × 10−91.0 × 10−101.7 × 10⁻¹¹
702.1 × 10−91.0 × 10−92.0 × 10−104.1 × 10−119.3 × 10⁻¹²
802.4 × 10−91.4 × 10−93.5 × 10−108.5 × 10−112.1 × 10−114.2 × 10⁻¹²
902.4 × 10−91.6 × 10−95.6 × 10−101.7 × 10−104.8 × 10−111.3 × 10⁻¹¹
Table 6. Activation energies of diffusion EA and pre-exponential factors D0 for GPPS.
SubstanceMolecular VolumeMolecular WeightTemperature RangeActivation EnergyPre-Exponential Factor D0Method
3)(g/mol)(°C)(kJ/mol)(cm2/s)
Methanol37.232.00–904.91.4 × 10−8Permeation, below Tg
Ethanol54.046.10–9037.35.1 × 10−4Permeation, below Tg
Acetone64.758.185–1057.61.3 × 10−7Desorption
1-Propanol70.860.140–9059.62.2 × 10−1Permeation, below Tg
1-Butanol87.674.140–9091.12.6 × 105Permeation, below Tg
Ethyl acetate90.688.185–105123.91.2 × 109Desorption
Chlorobenzene97.6112.685–105171.31.8 × 1015Desorption
Toluene100.692.185–105180.62.1 × 1016Desorption
Styrene111.8104.280–100180.98.2 × 1015Desorption, below Tg
Styrene111.8104.2100–115162.62.5 × 1013Desorption, above Tg
Styrene111.8104.285–105189.81.3 × 1017Desorption
n-Octane146.6114.280–100252.17.0 × 1025Desorption, below Tg
n-Octane146.6114.2100–115191.32.3 × 1017Desorption, above Tg
Phenyl cyclohexane174.0160.385–105396.81.6 × 1045Desorption
Benzophenone174.4182.285–105315.51.5 × 1034Desorption
n-Decane180.2142.380–100336.72.2 × 1037Desorption, below Tg
n-Decane180.2142.3100–115220.61.2 × 1021Desorption, above Tg
n-Dodecane213.8170.380–100416.41.6 × 1048Desorption, below Tg
n-Dodecane213.8170.3100–115243.18.1 × 1023Desorption, above Tg
n-Tetradecane247.3198.480–100489.11.5 × 1058Desorption, below Tg
n-Tetradecane247.3198.4100–115256.43.4 × 1025Desorption, above Tg
n-Hexadecane281.0226.580–100525.81.4 × 1063Desorption, below Tg
n-Hexadecane281.0226.5100–115244.34.4 × 1023Desorption, above Tg
n-Octadecane314.6254.580–100504.98.5 × 1059Desorption, below Tg
Table 7. Activation energies of diffusion EA and pre-exponential factors D0 for HIPS.
SubstanceMolecular VolumeMolecular WeightTemperature RangeActivation EnergyPre-Exponential Factor D0Method
3)(g/mol)(°C)(kJ/mol)(cm2/s)
Ethyl acetate90.688.175–100111.42.4 × 107Desorption, below Tg
Ethyl acetate90.688.1100–115169.33.1 × 1015Desorption, above Tg
Chlorobenzene97.6112.675–100152.22.6 × 1012Desorption, below Tg
Chlorobenzene97.6112.6100–115218.15.1 × 1021Desorption, above Tg
Toluene100.692.175–100162.86.7 × 1013Desorption, below Tg
Toluene100.692.1100–115224.43.2 × 1022Desorption, above Tg
Styrene111.8104.275–100169.23.7 × 1014Desorption, below Tg
Styrene111.8104.2100–115239.36.9 × 1023Desorption, above Tg
n-Octane146.6114.280–100288.51.0 × 1031Desorption, below Tg
n-Octane146.6114.2100–110236.86.7 × 1023Desorption, above Tg
Phenyl cyclohexane174.0160.380–100367.41.2 × 1040Desorption, below Tg
Phenyl cyclohexane174.0160.3100–115367.71.8 × 1040Desorption, above Tg
Benzophenone174.4182.280–100297.03.4 × 1030Desorption, below Tg
Benzophenone174.4182.2100–115246.33.9 × 1023Desorption, above Tg
n-Dodecane213.8170.380–100318.71.4 × 1034Desorption, below Tg
n-Dodecane213.8170.3100–115233.01.4 × 1036Desorption, above Tg
n-Tetradecane247.3198.480–100538.42.1 × 1064Desorption, below Tg
n-Tetradecane247.3198.4100–110376.15.1 × 1041Desorption, above Tg
n-Hexadecane281.0226.580–100567.29.3 × 1067Desorption, below Tg
n-Hexadecane281.0226.5100–110407.66.3 × 1045Desorption, above Tg
n-Octadecane314.6254.5100–110472.83.7 × 1054Desorption, above Tg
Table 8. Parameters for the prediction of diffusion coefficients according to Equation (3) for GPPS and HIPS below and above Tg.
ParameterGPPSHIPS
below Tgabove Tgbelow Tgabove Tg
a (1/K)2.59 × 10−32.44 × 10−32.55 × 10−32.46 × 10−3
b (cm2/s)7.38 × 10−96.46 × 10−89.21 × 10−92.07 × 10−7
c (Å3)55.7125.5173.2845.00
d (1/K)2.73 × 10−57.55 × 10−52.04 × 10−53.57 × 10−5
Publisher’s Note: MDPI stays neutral with regard to jurisdictional claims in published maps and institutional affiliations.

