
Optimal Design of Steel–Concrete Composite Beams Strengthened under Load


Abstract
:1. Introduction
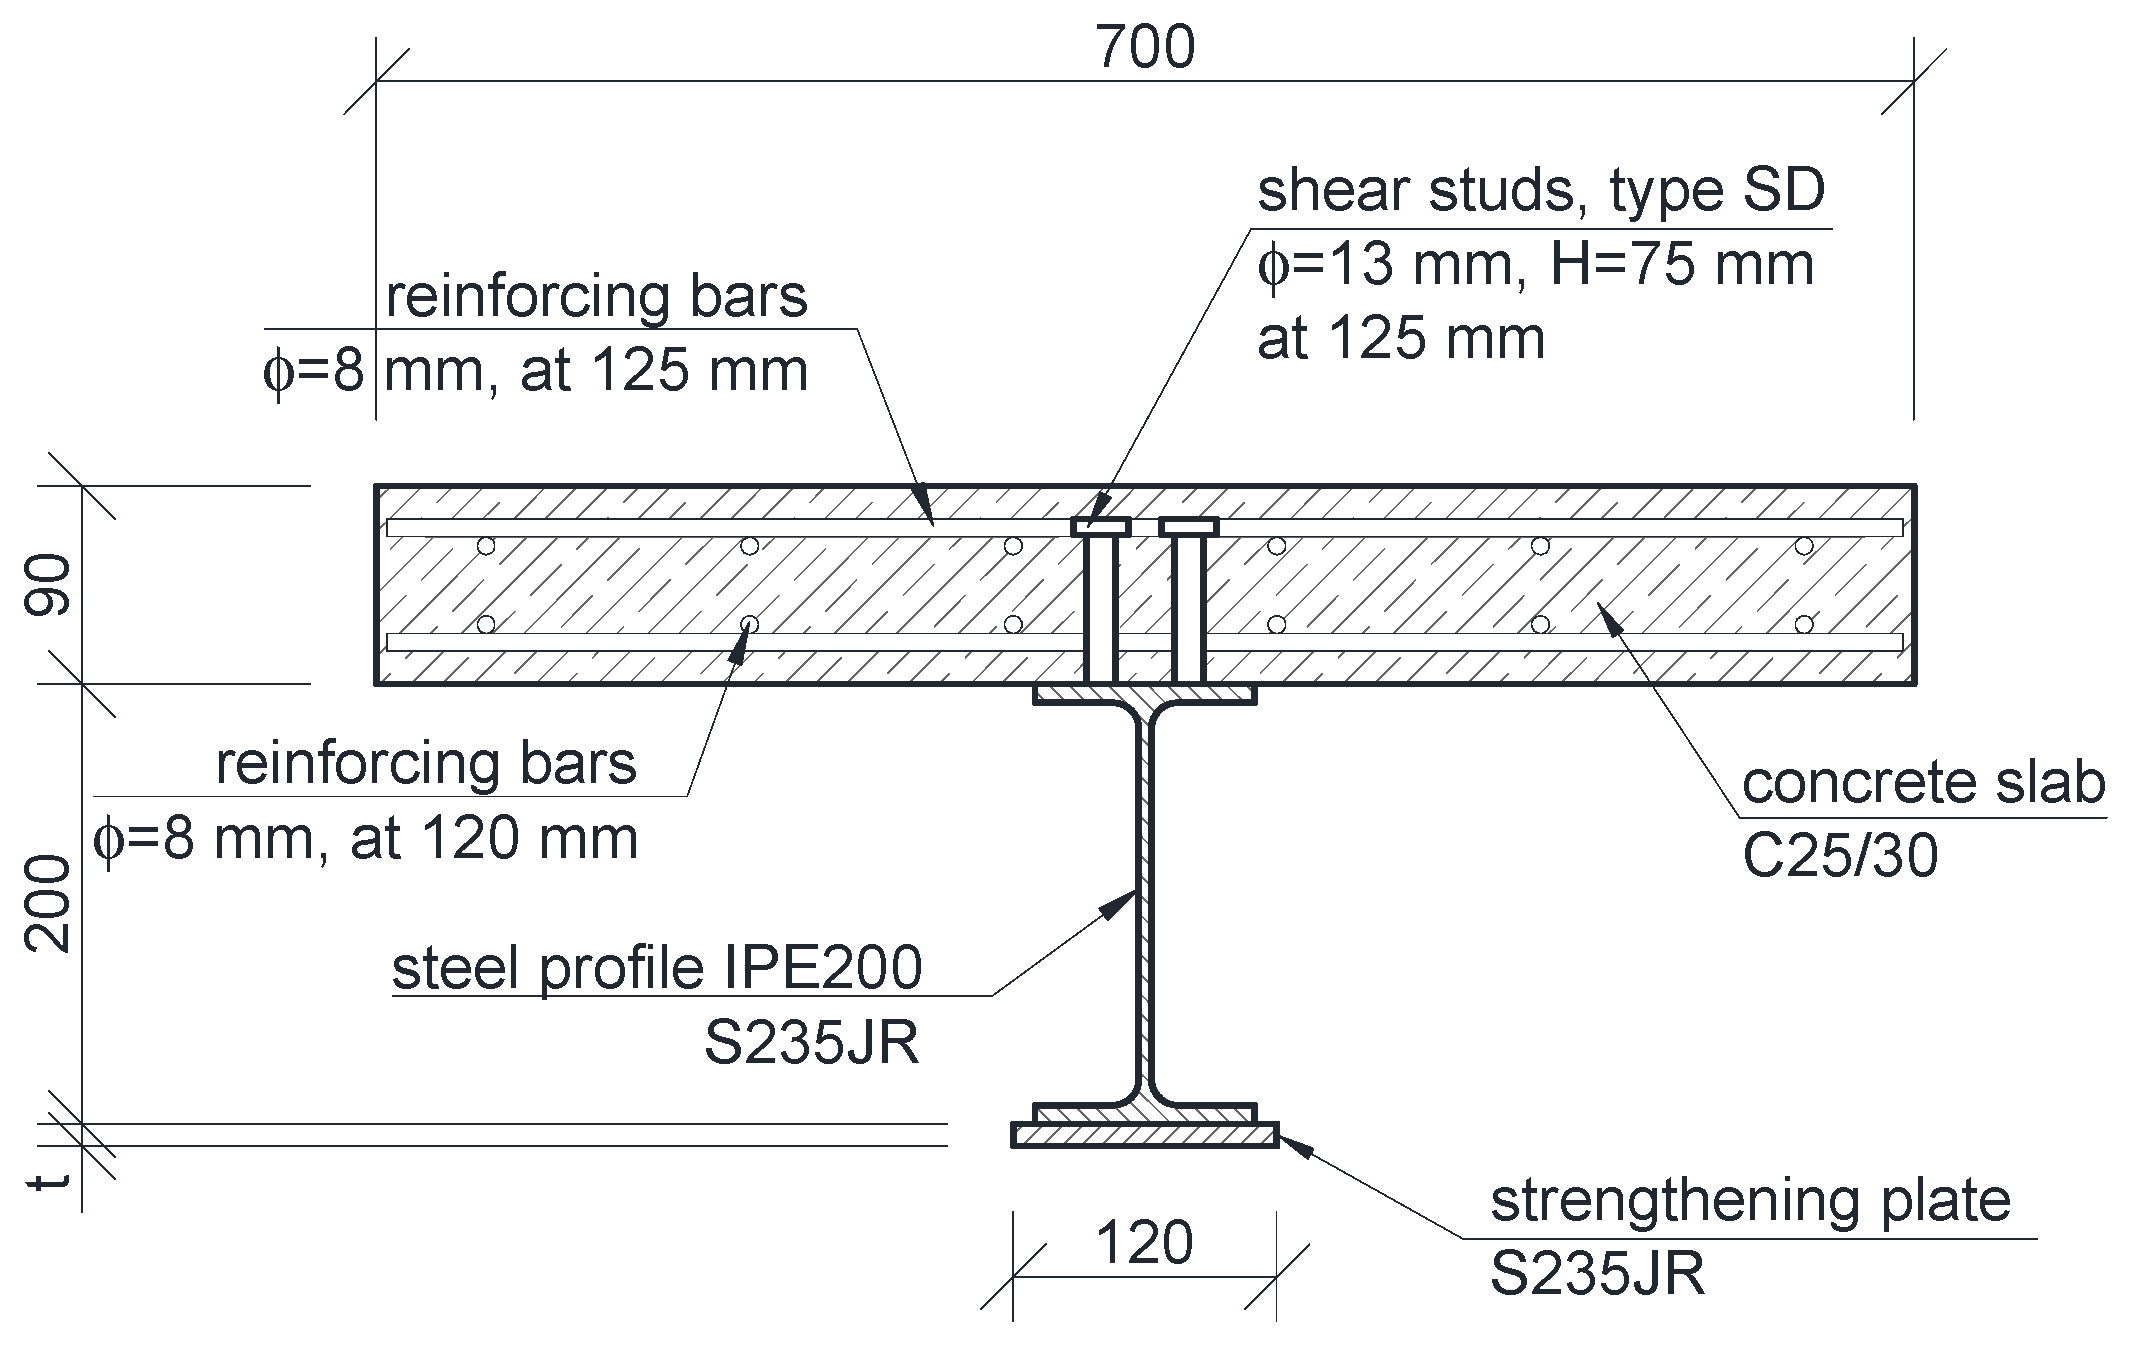
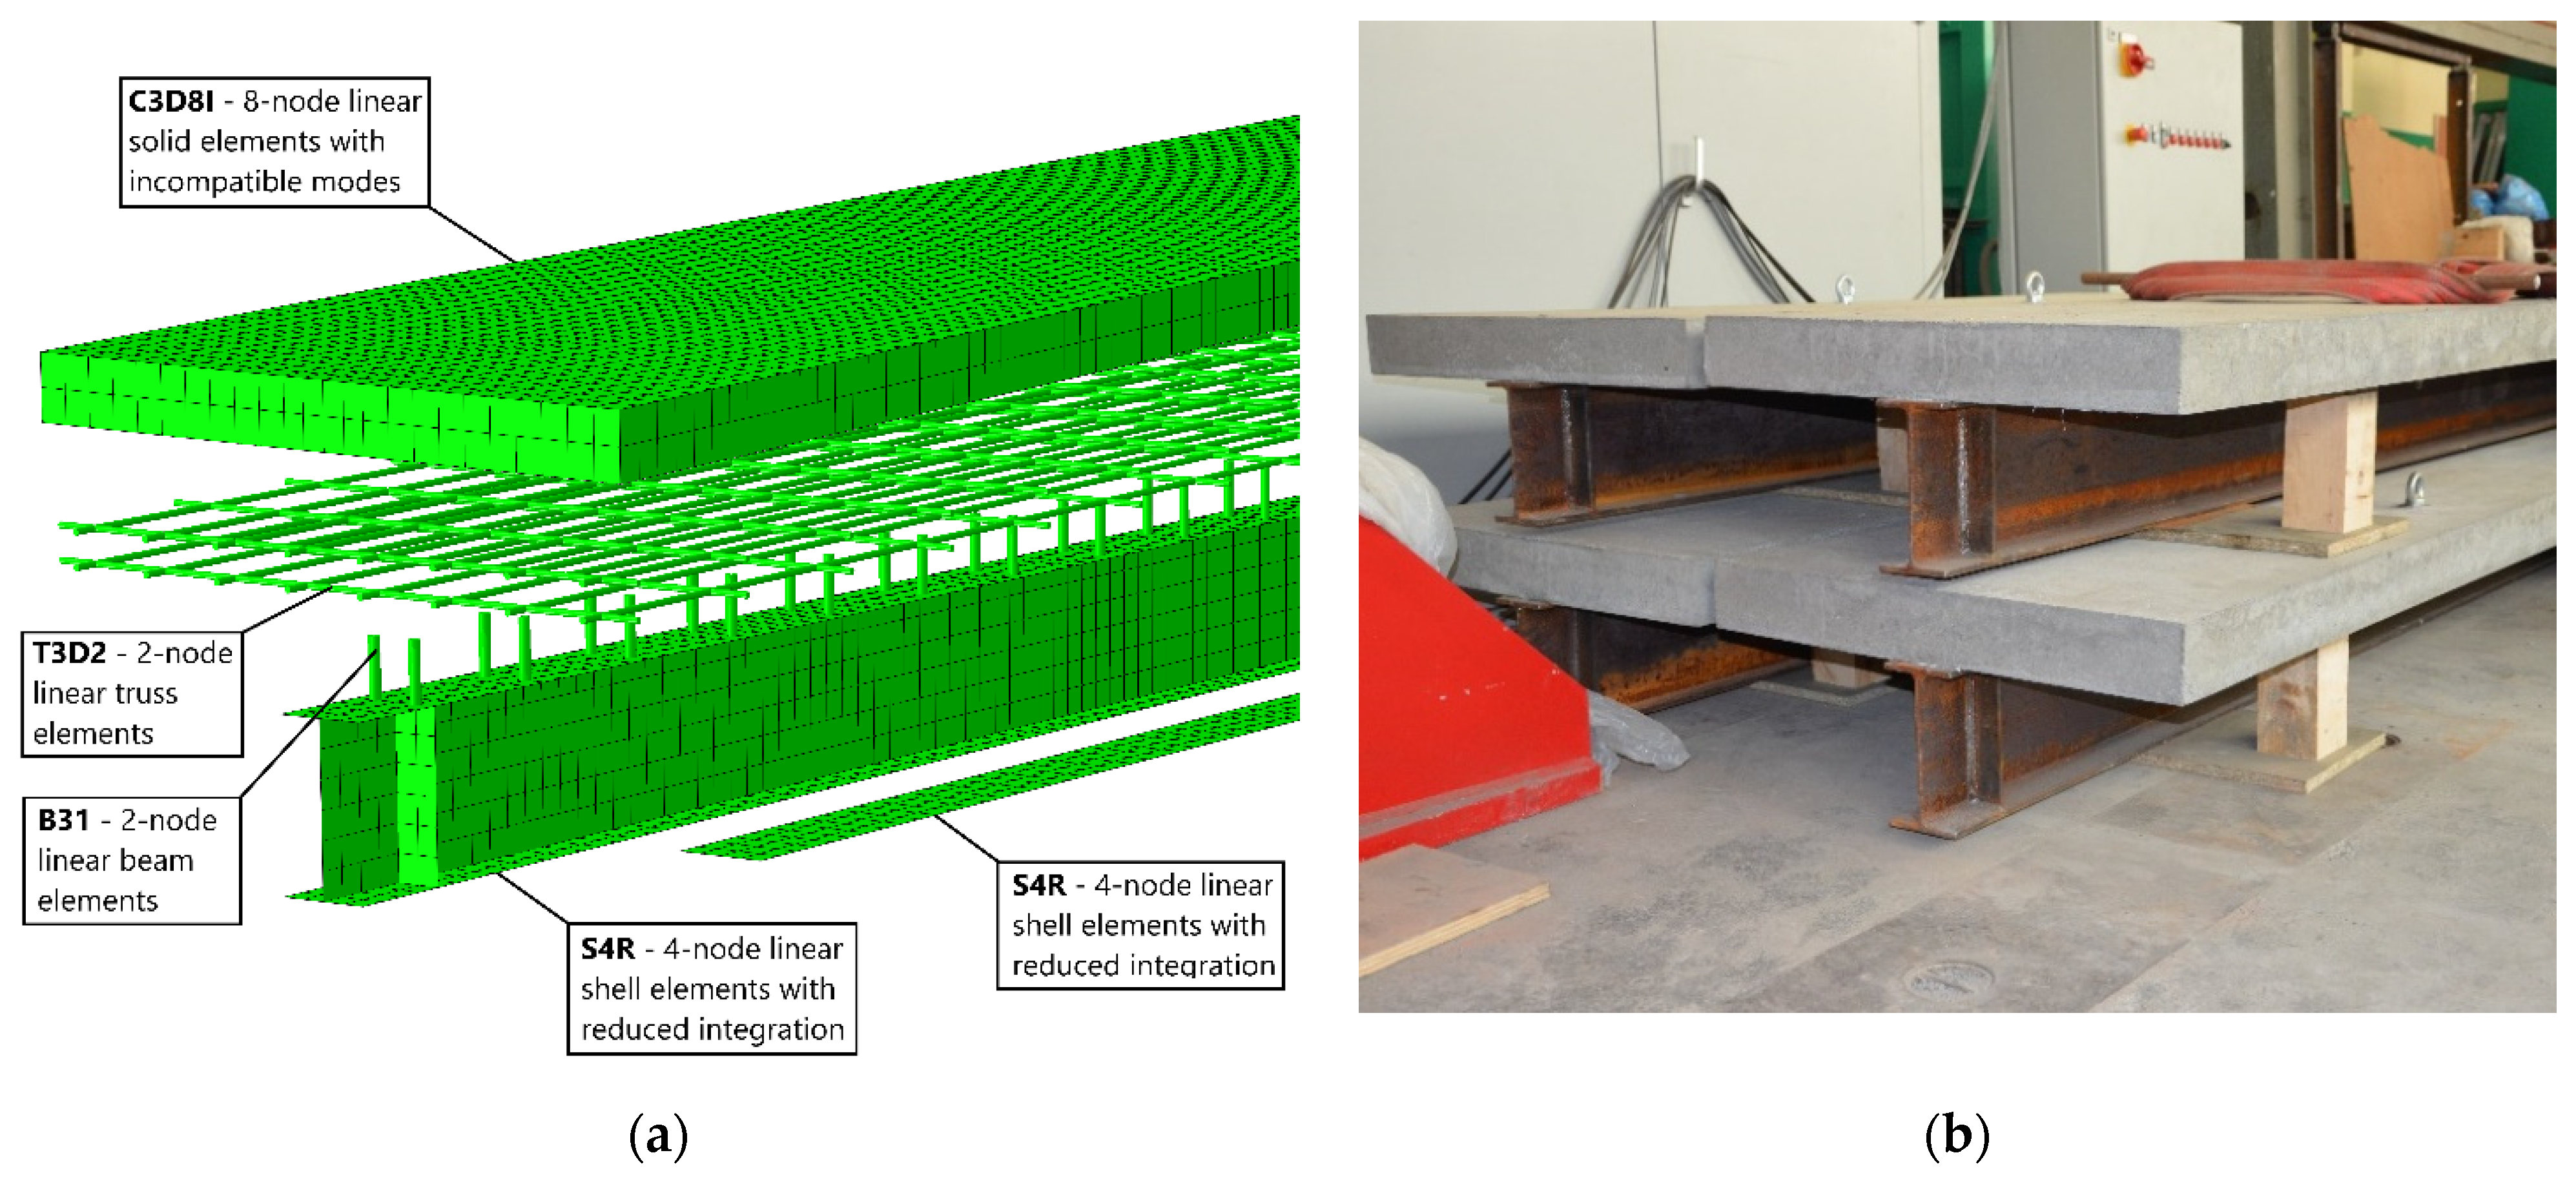
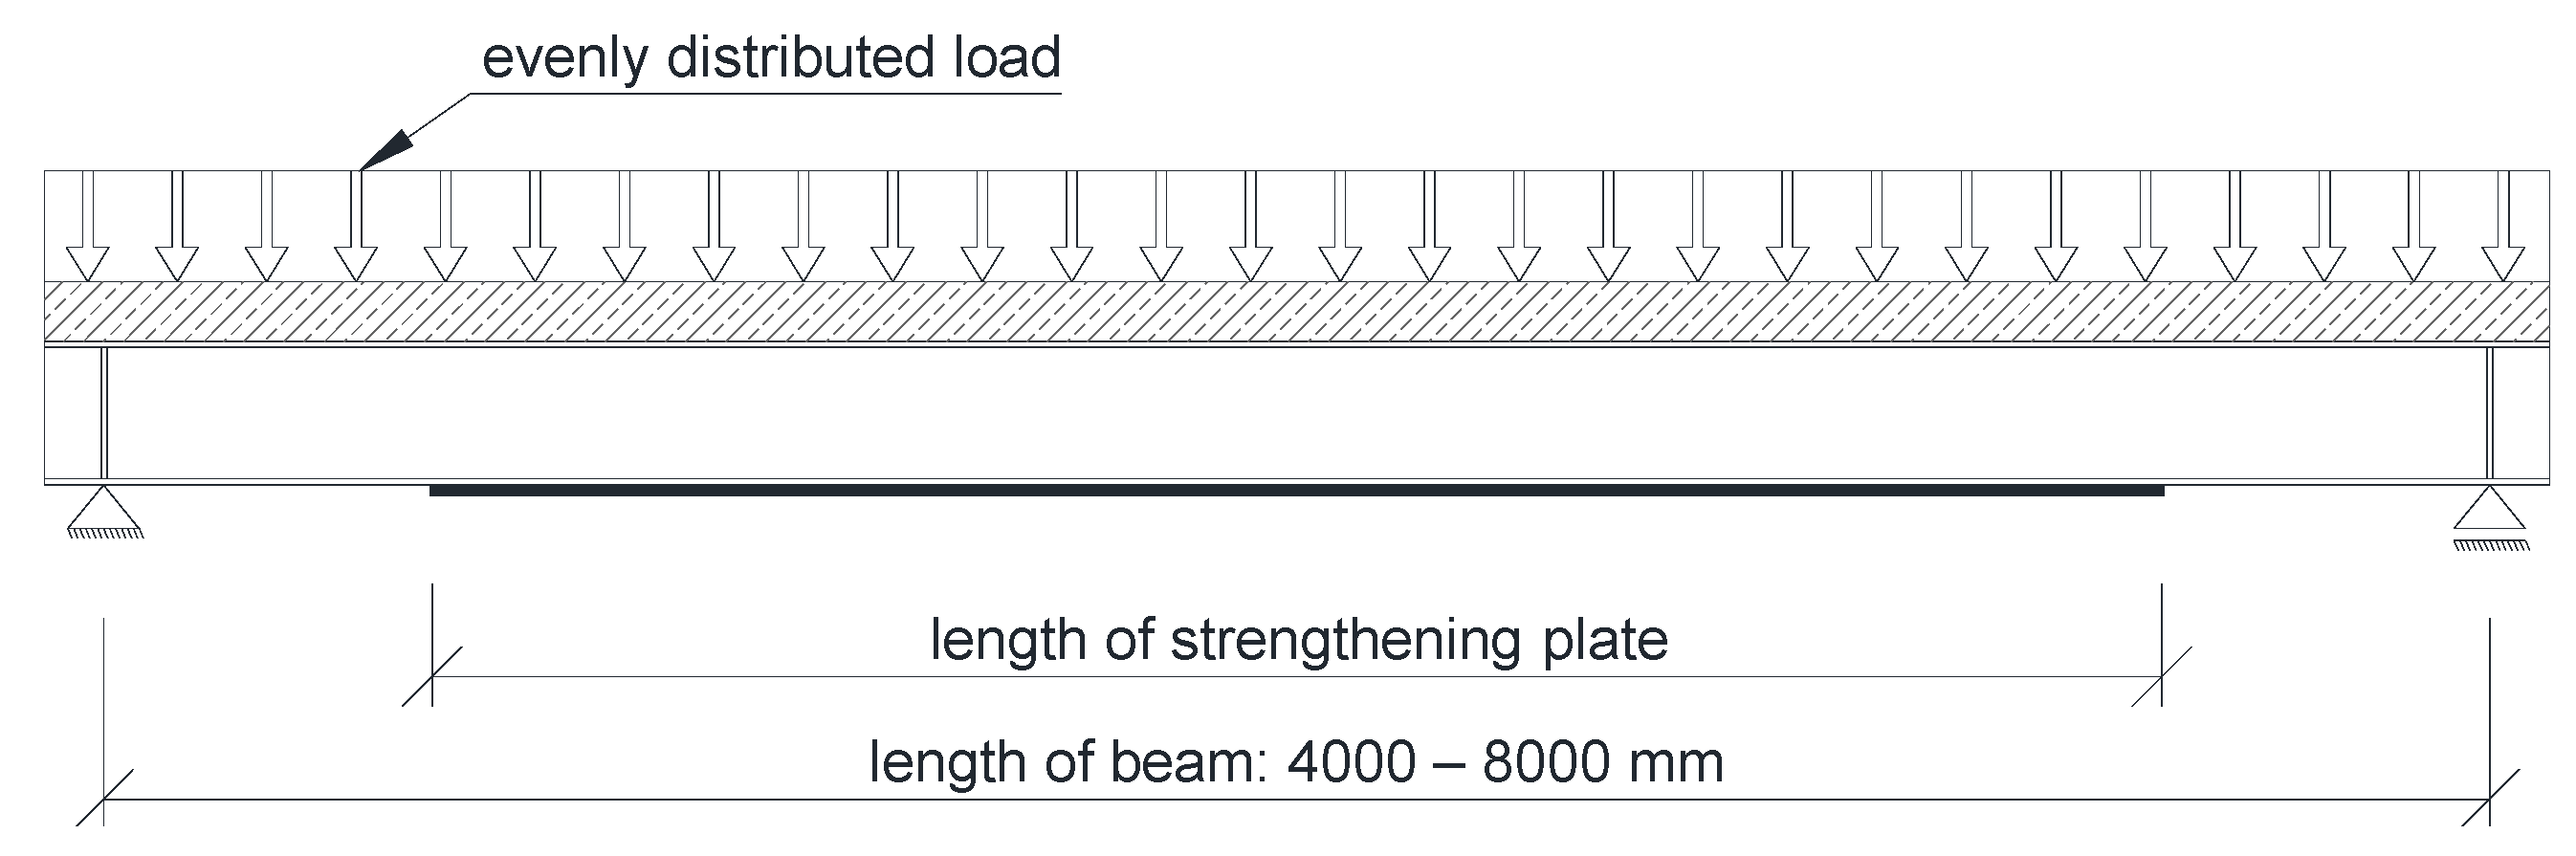
2. Research Models
3. Numerical Analysis
3.1. Introduction
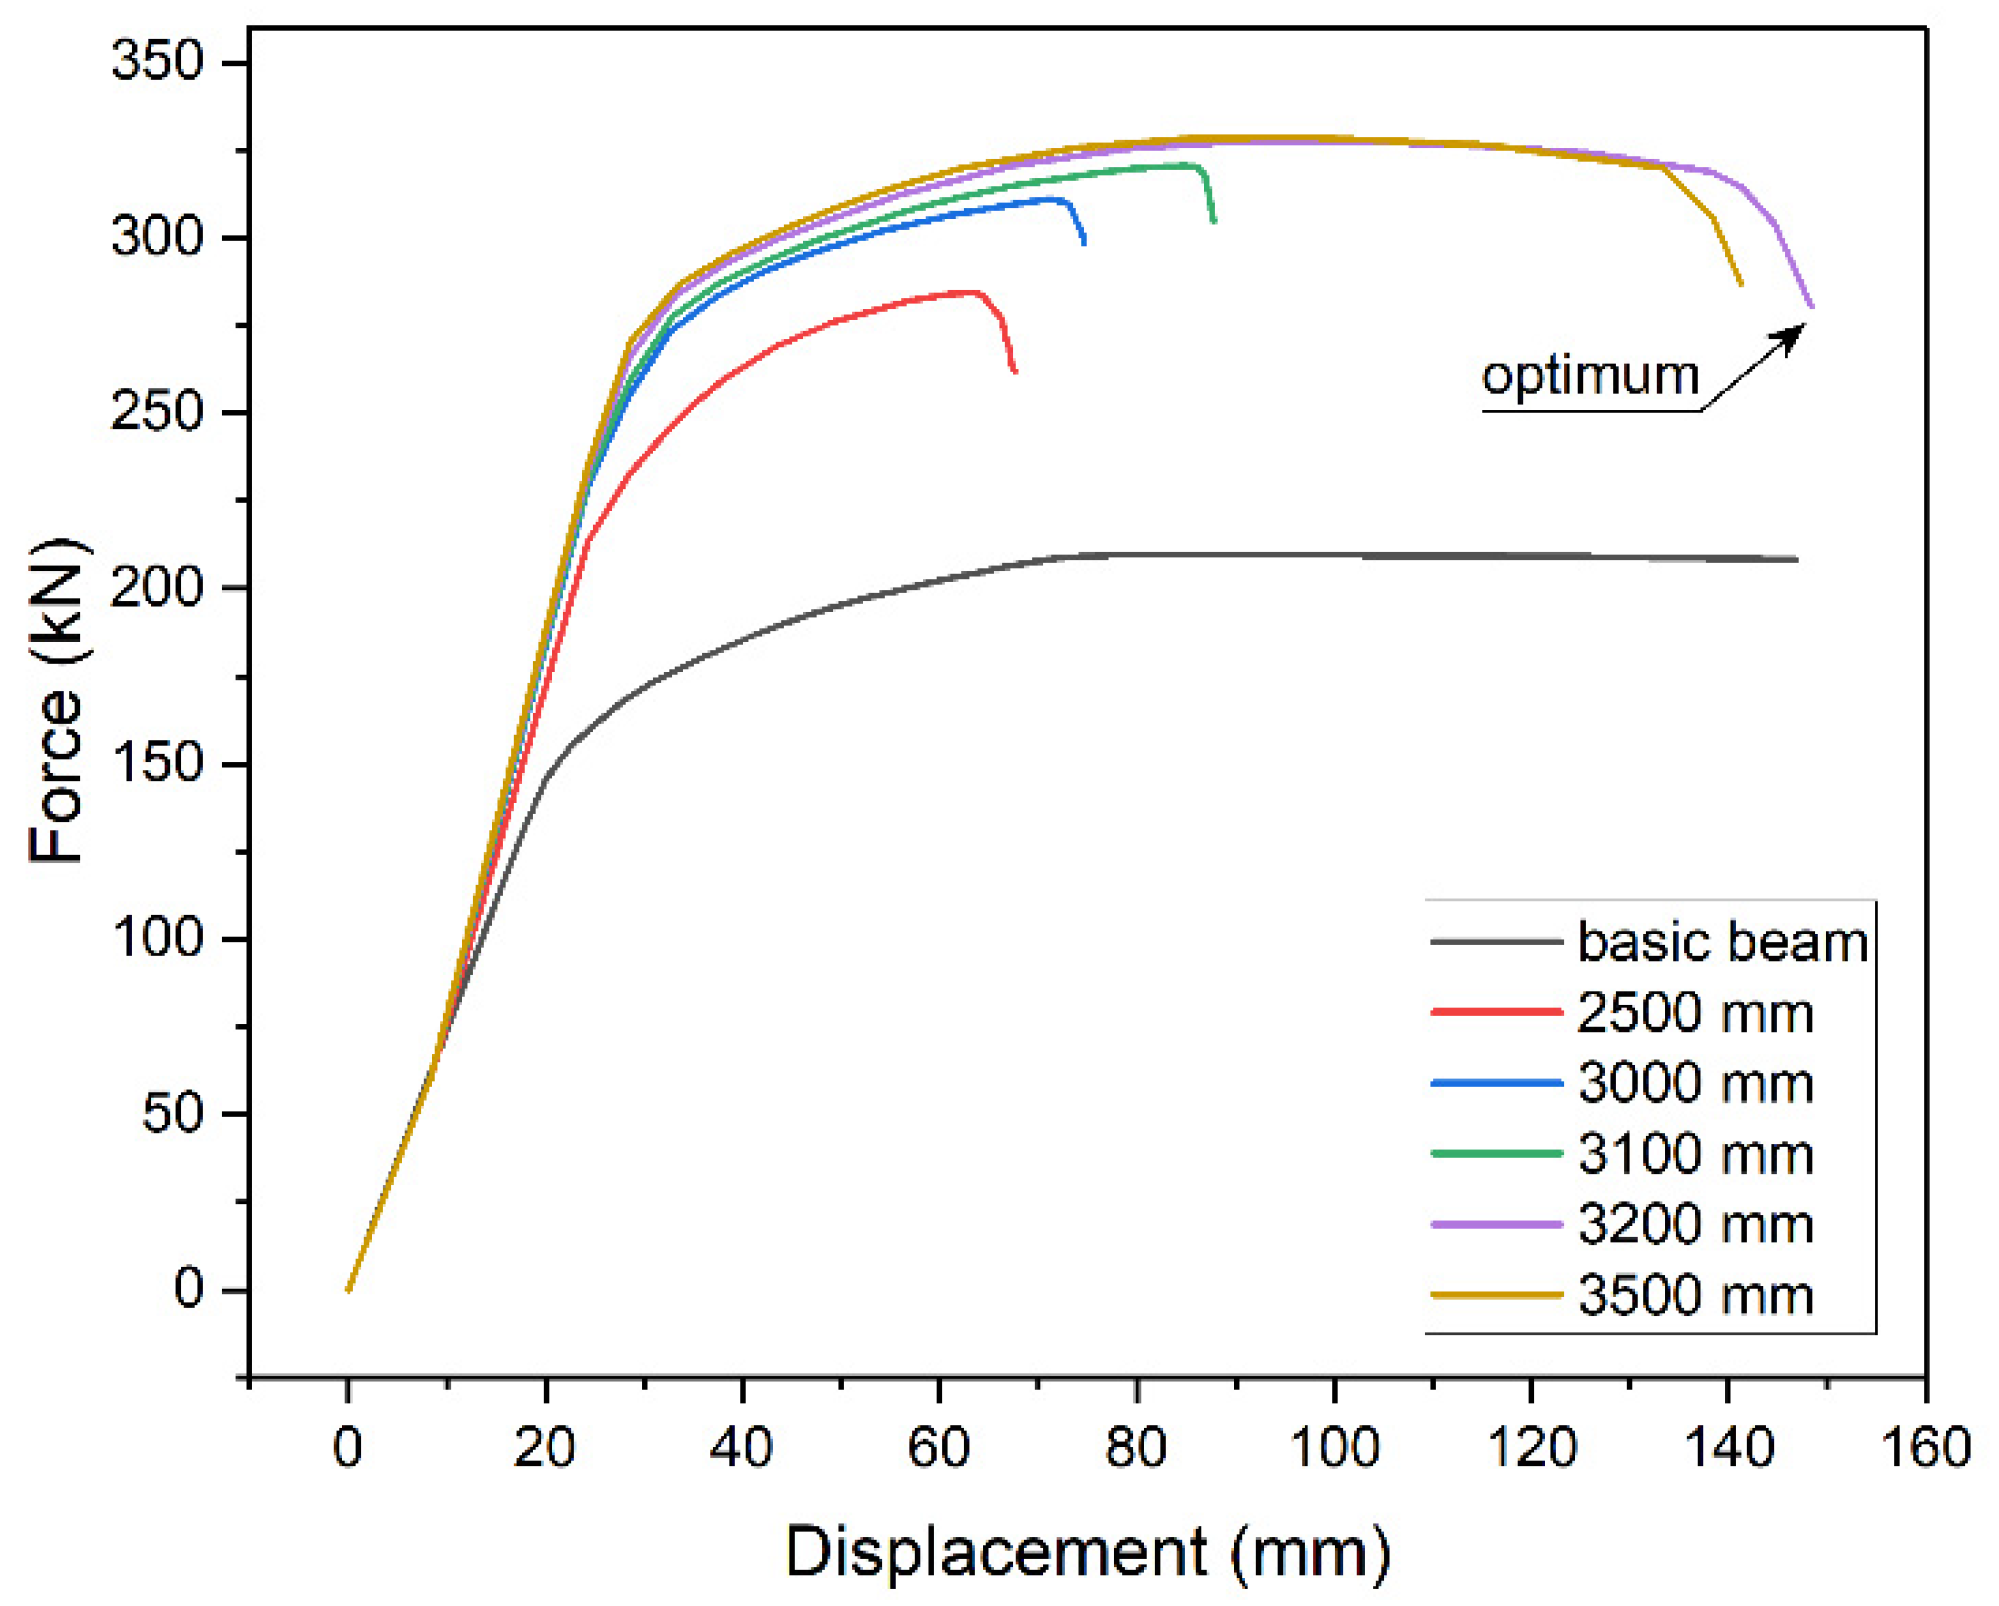
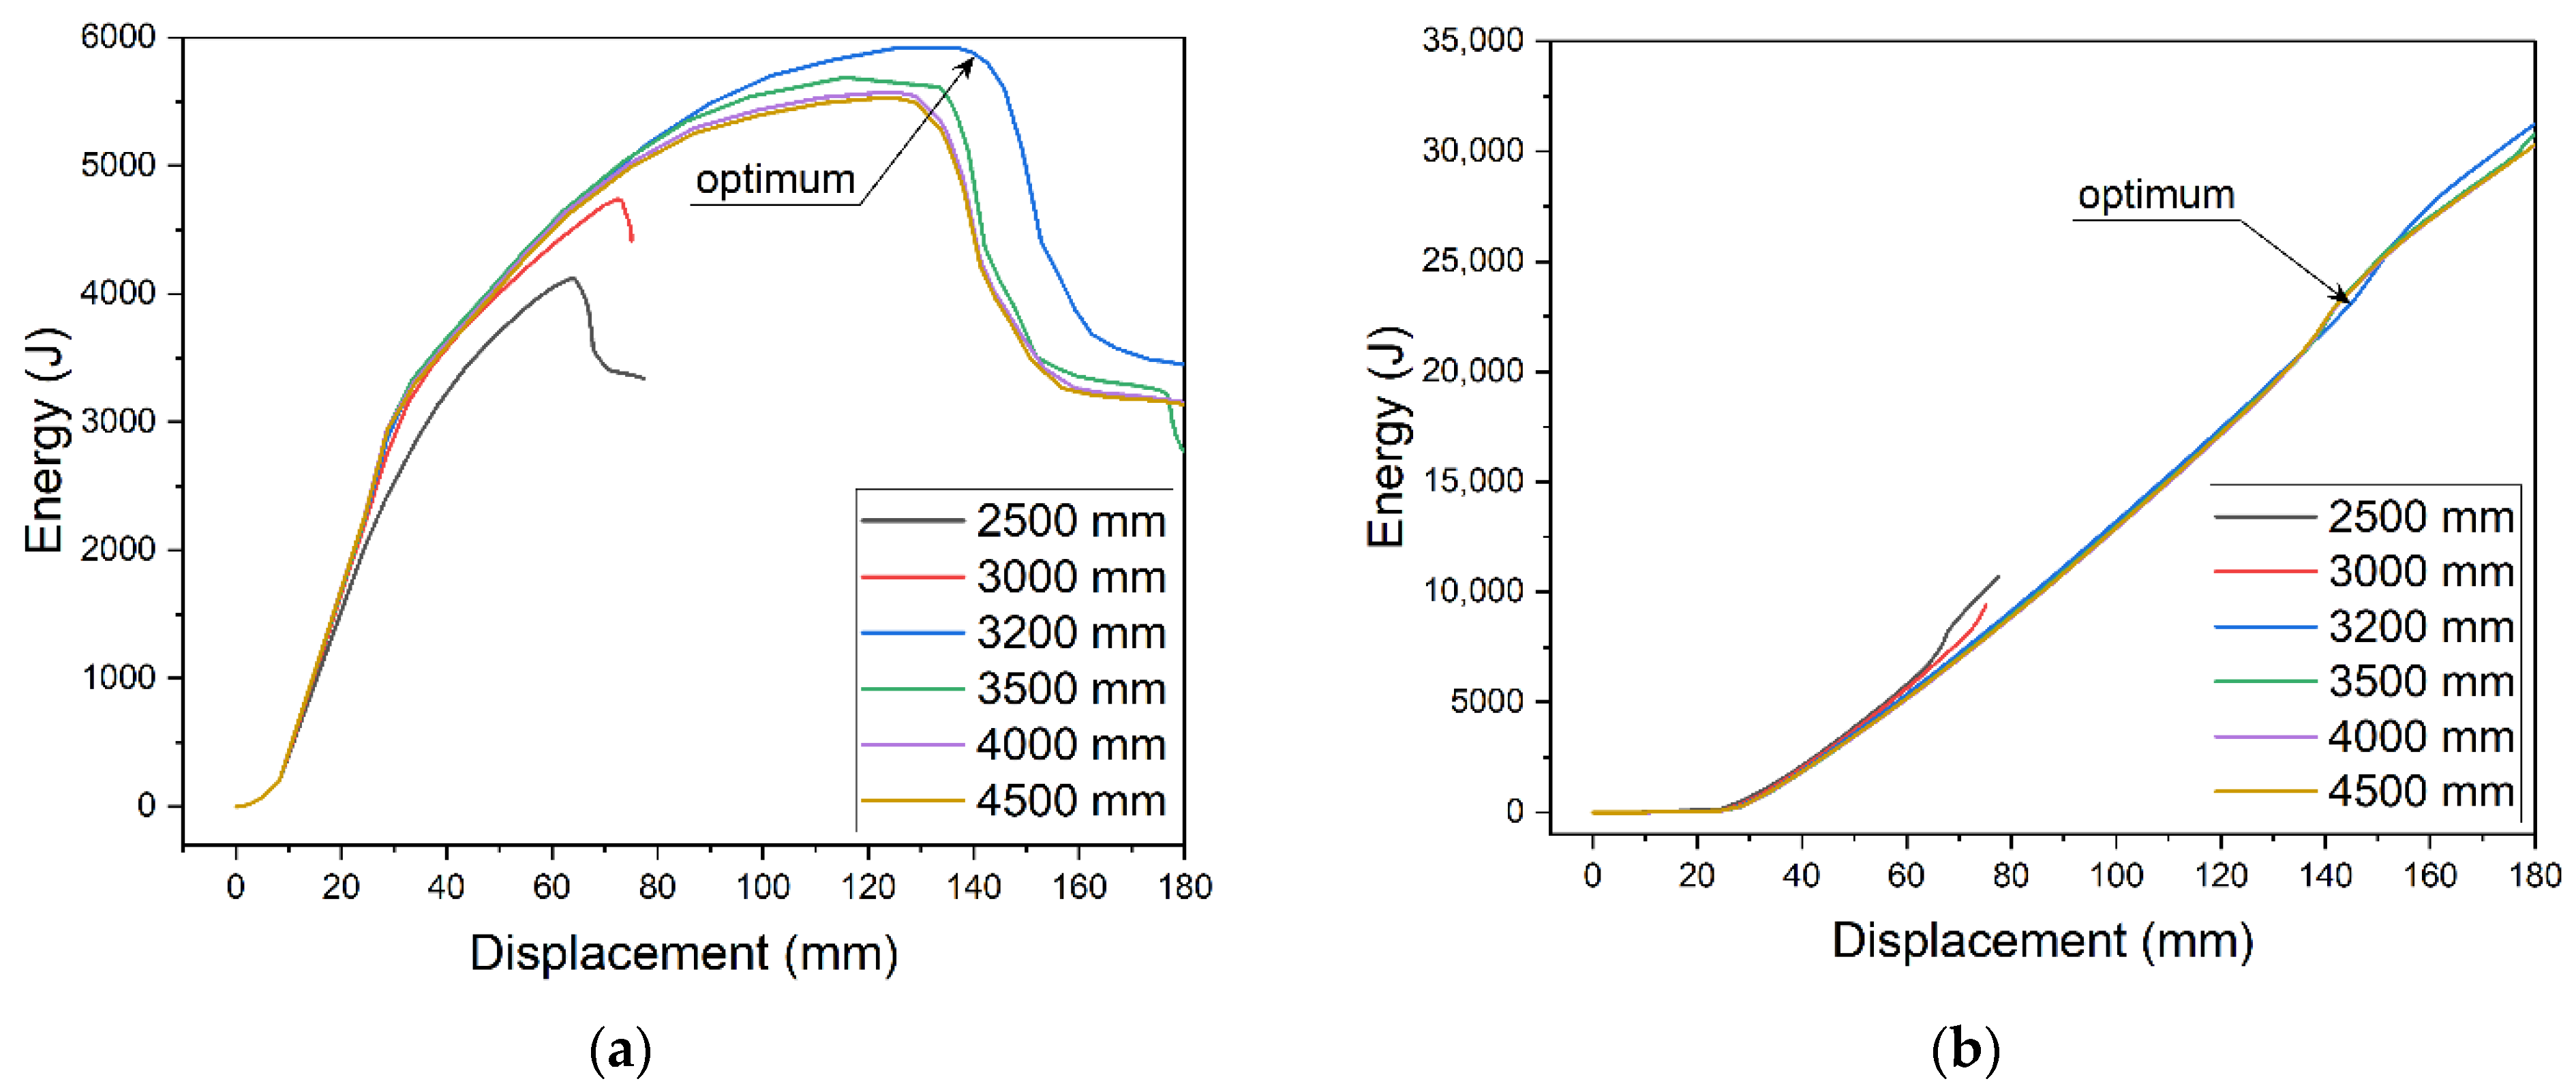
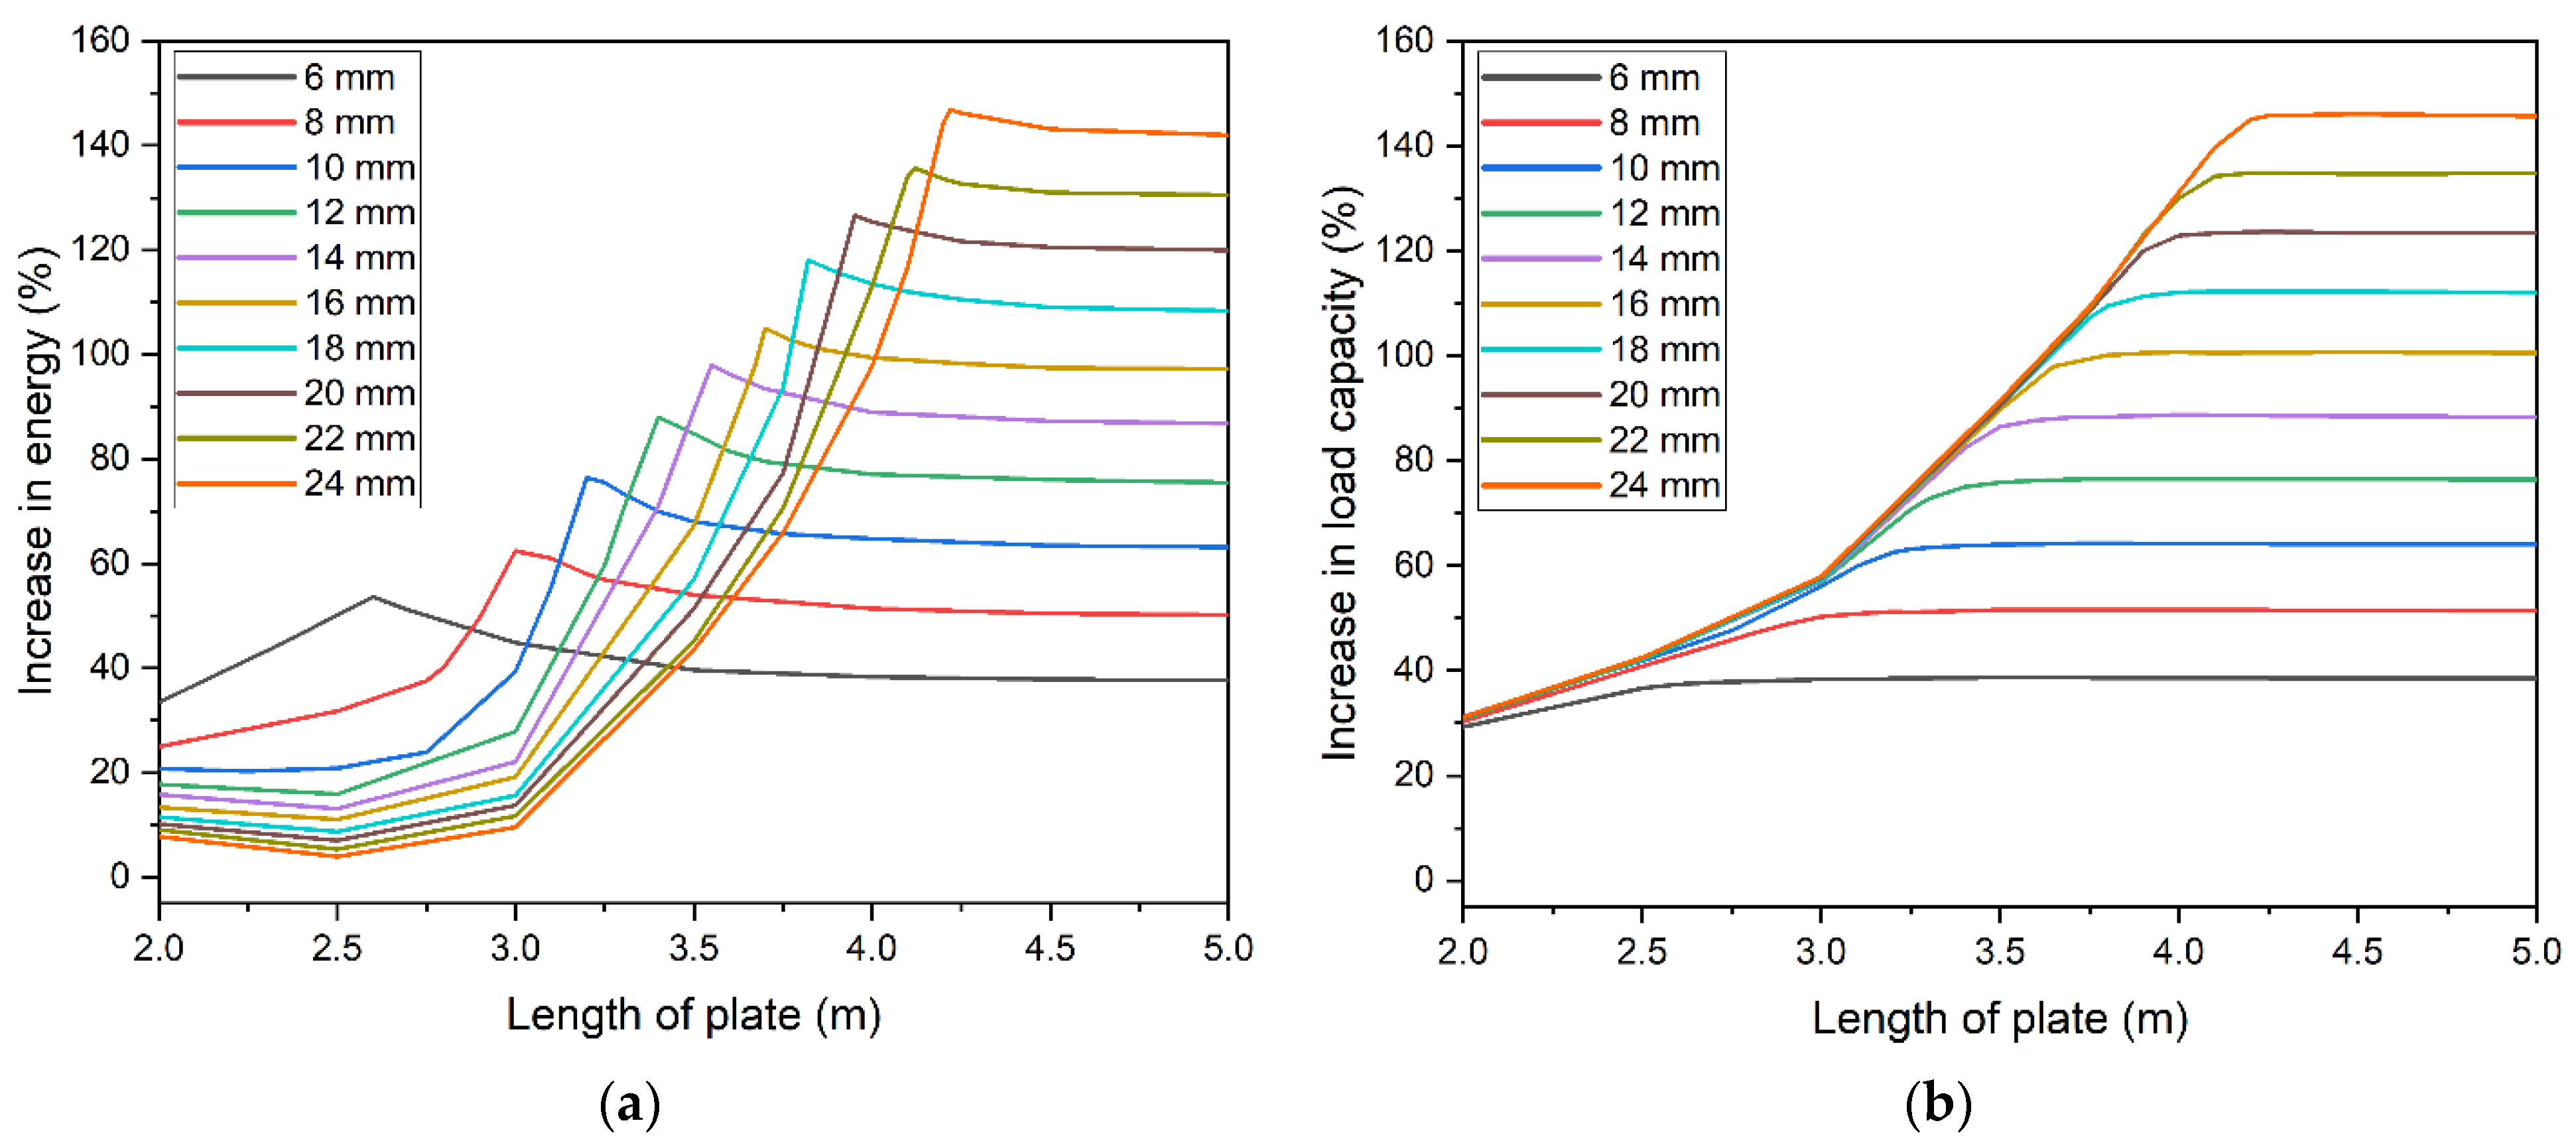
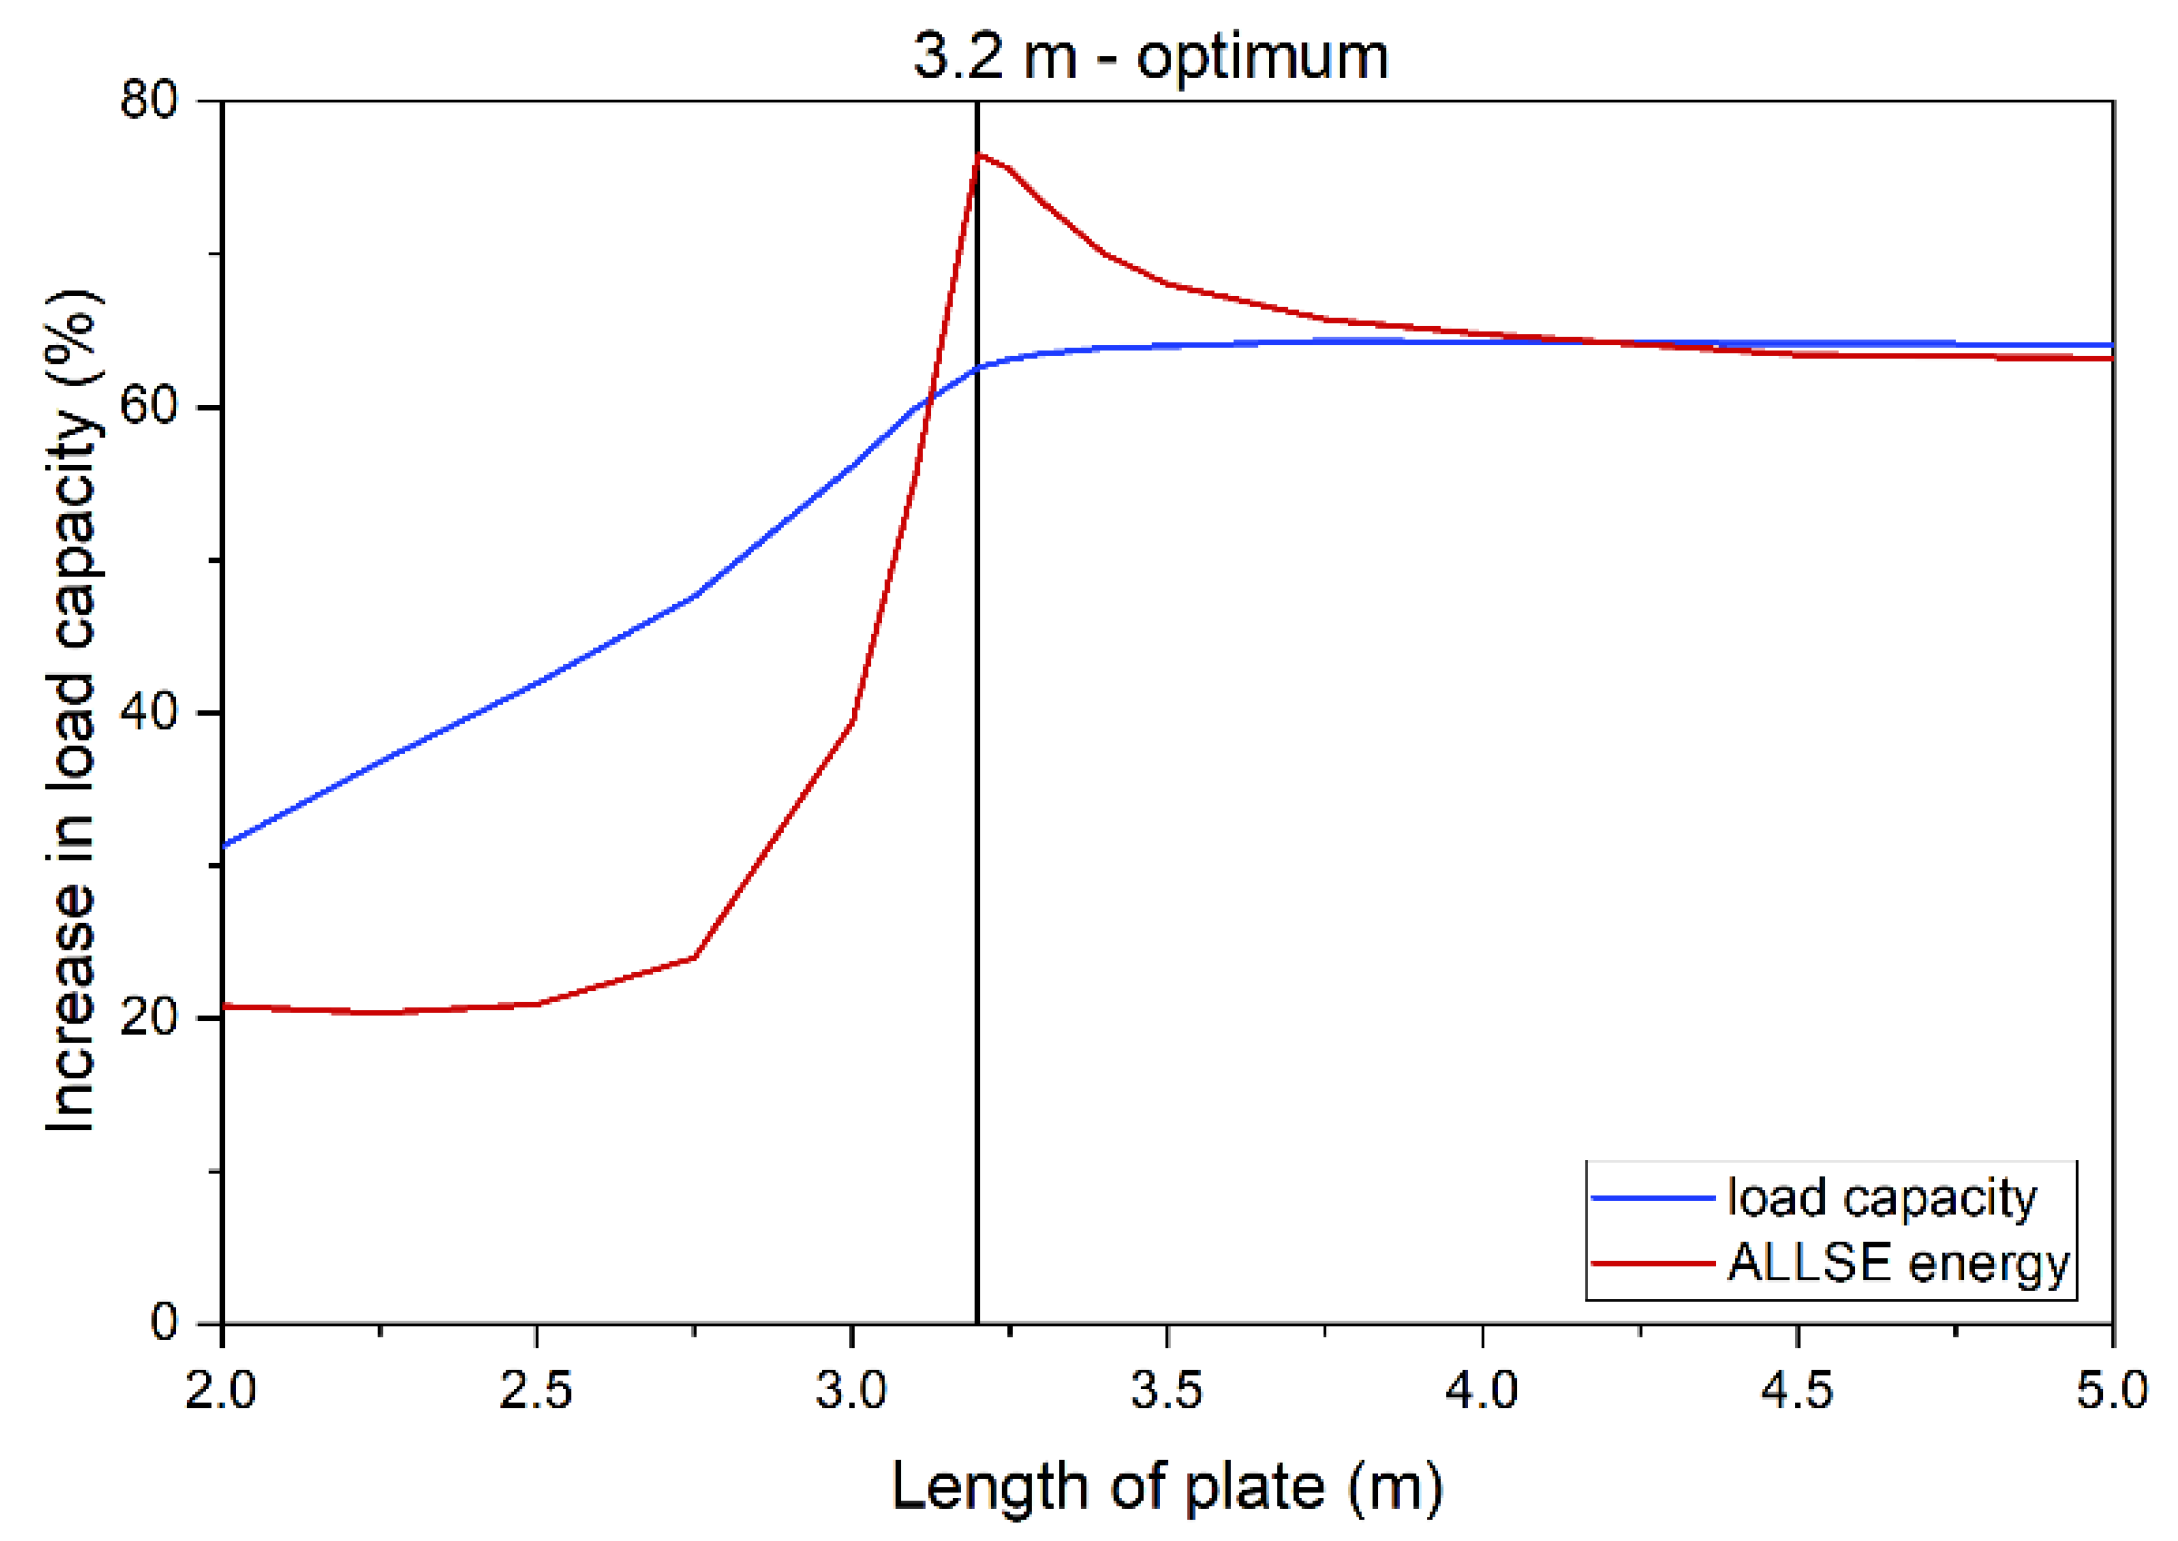
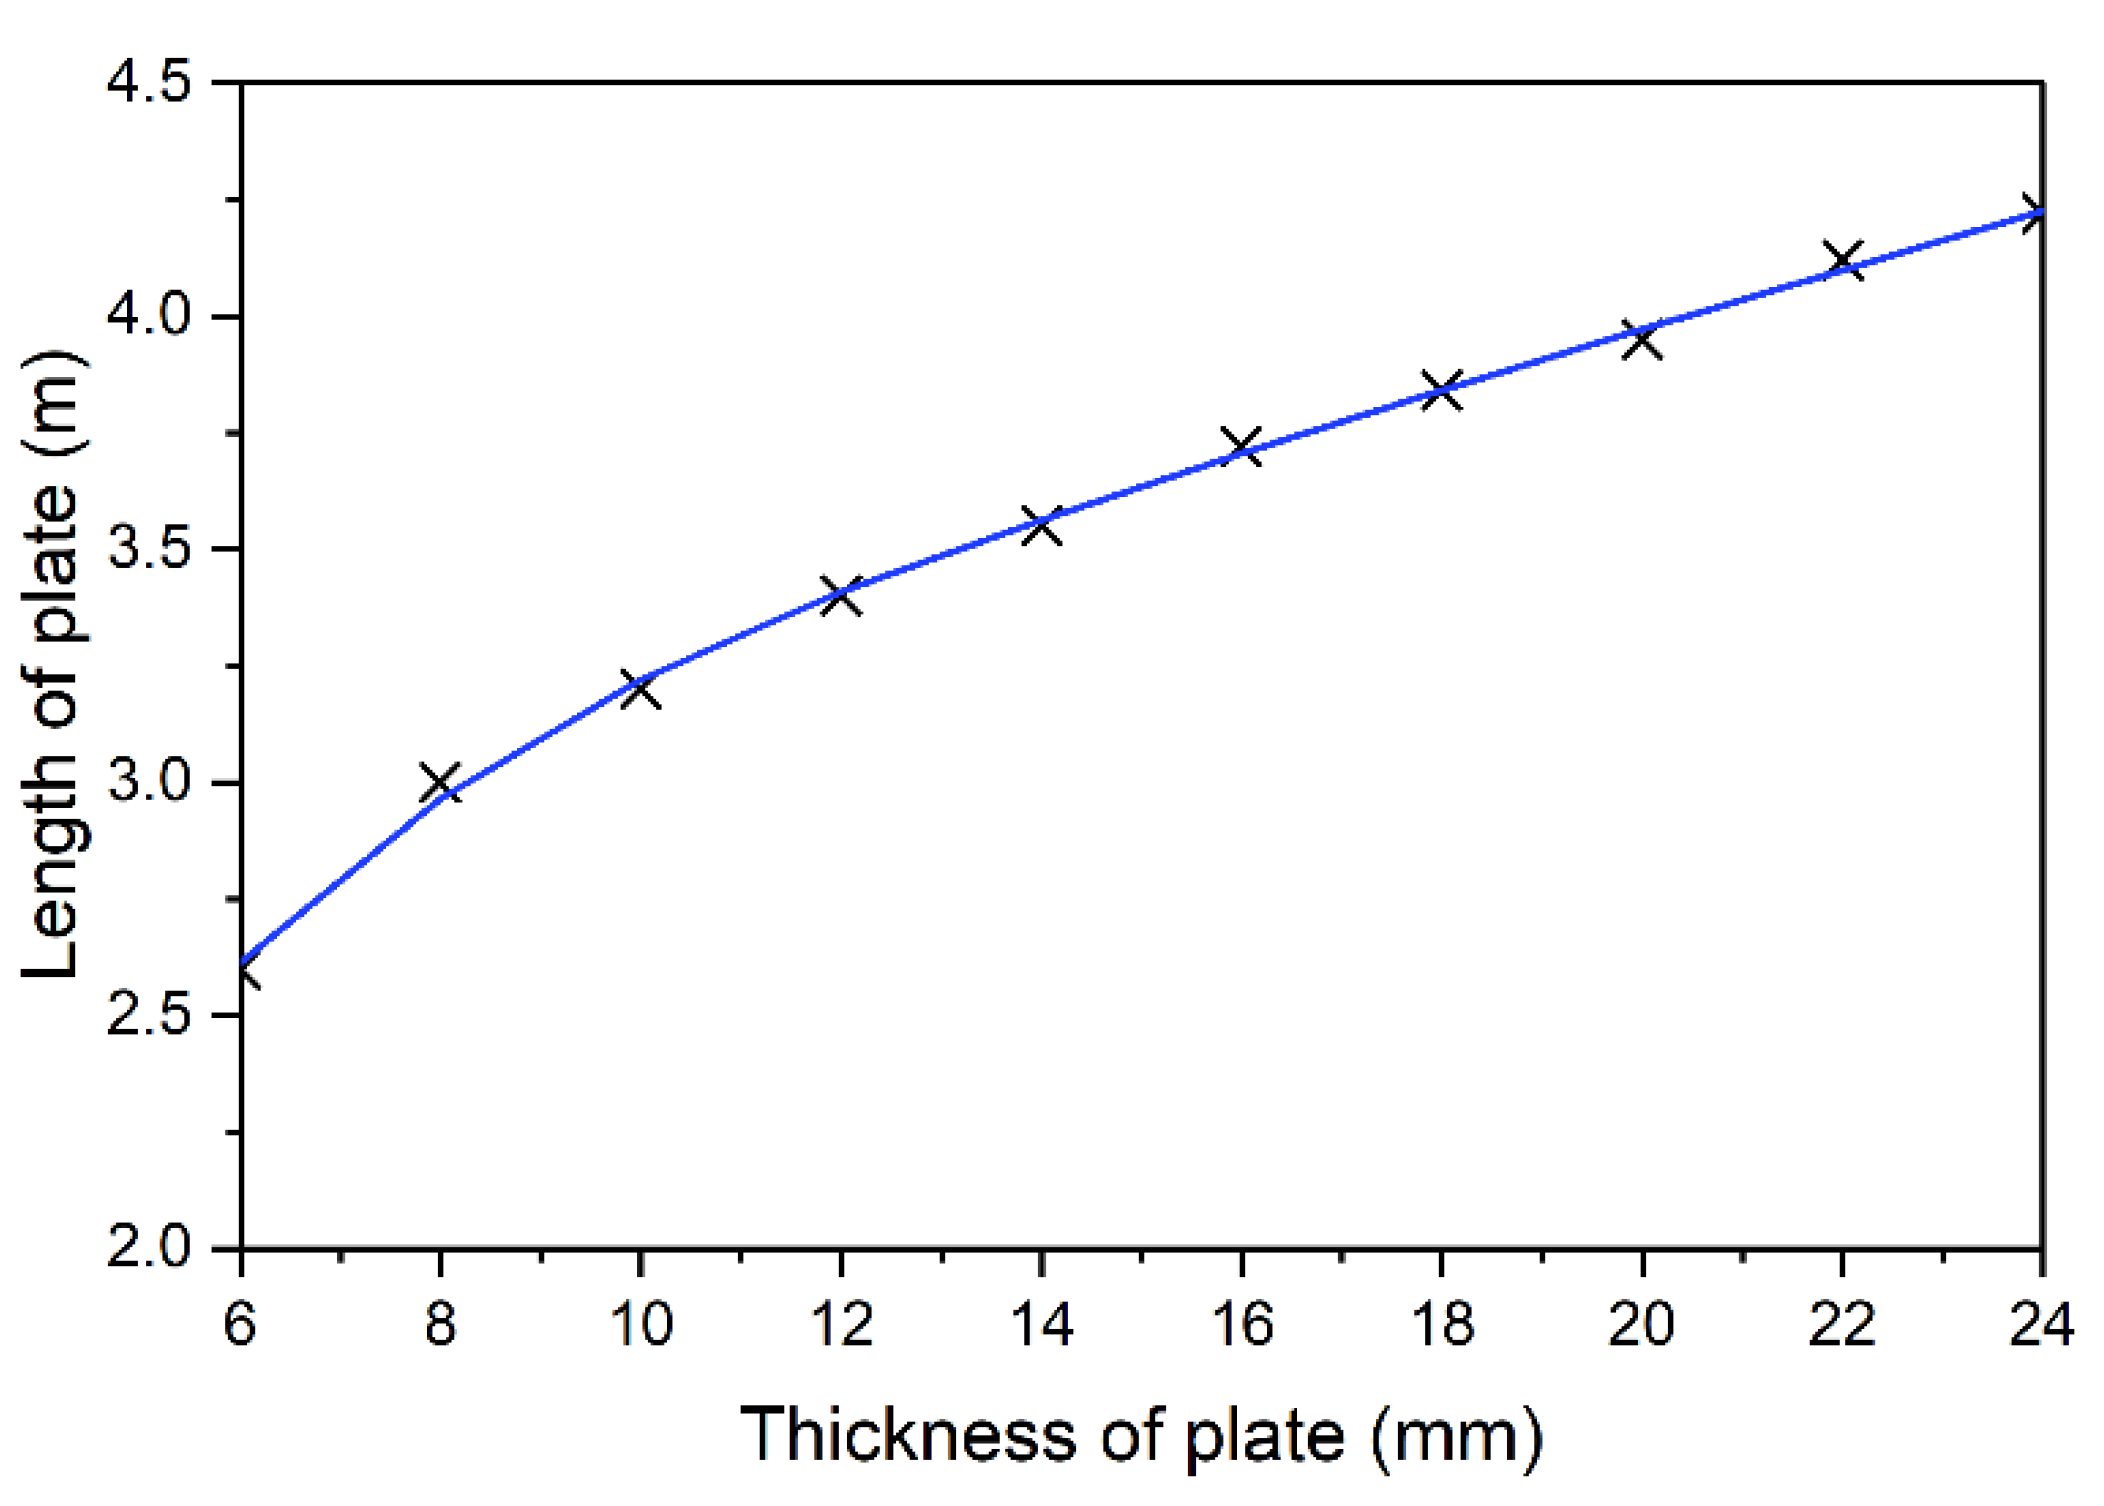
3.2. Finding Optimum
s2 = bf + 20 mm,
6 mm < s3 < 30 mm,
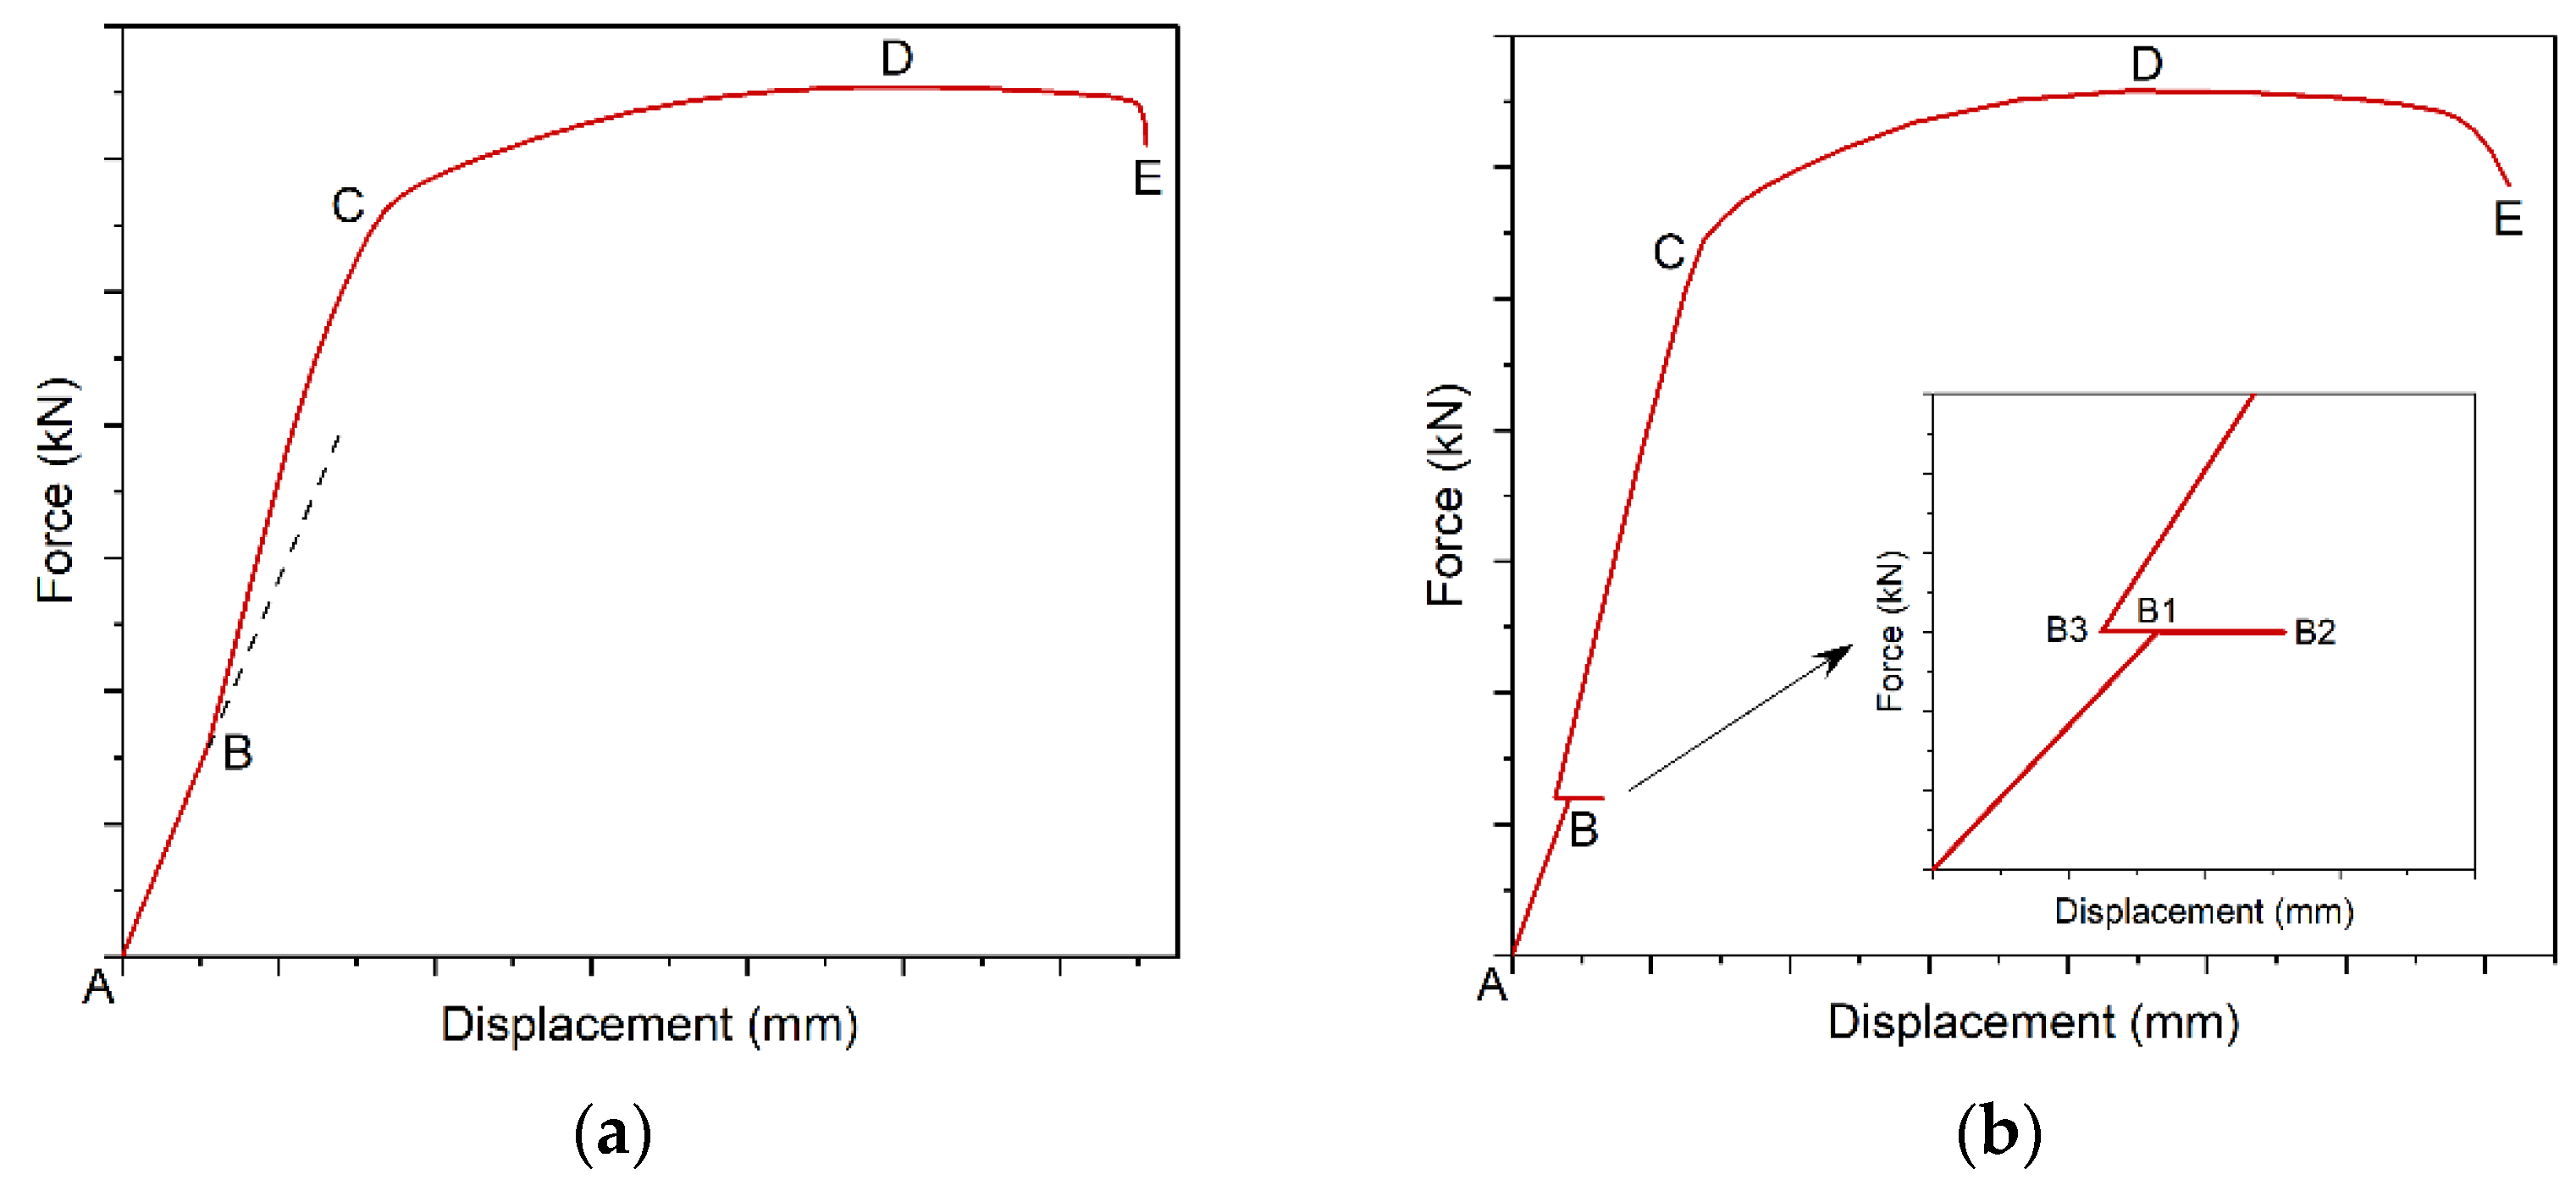
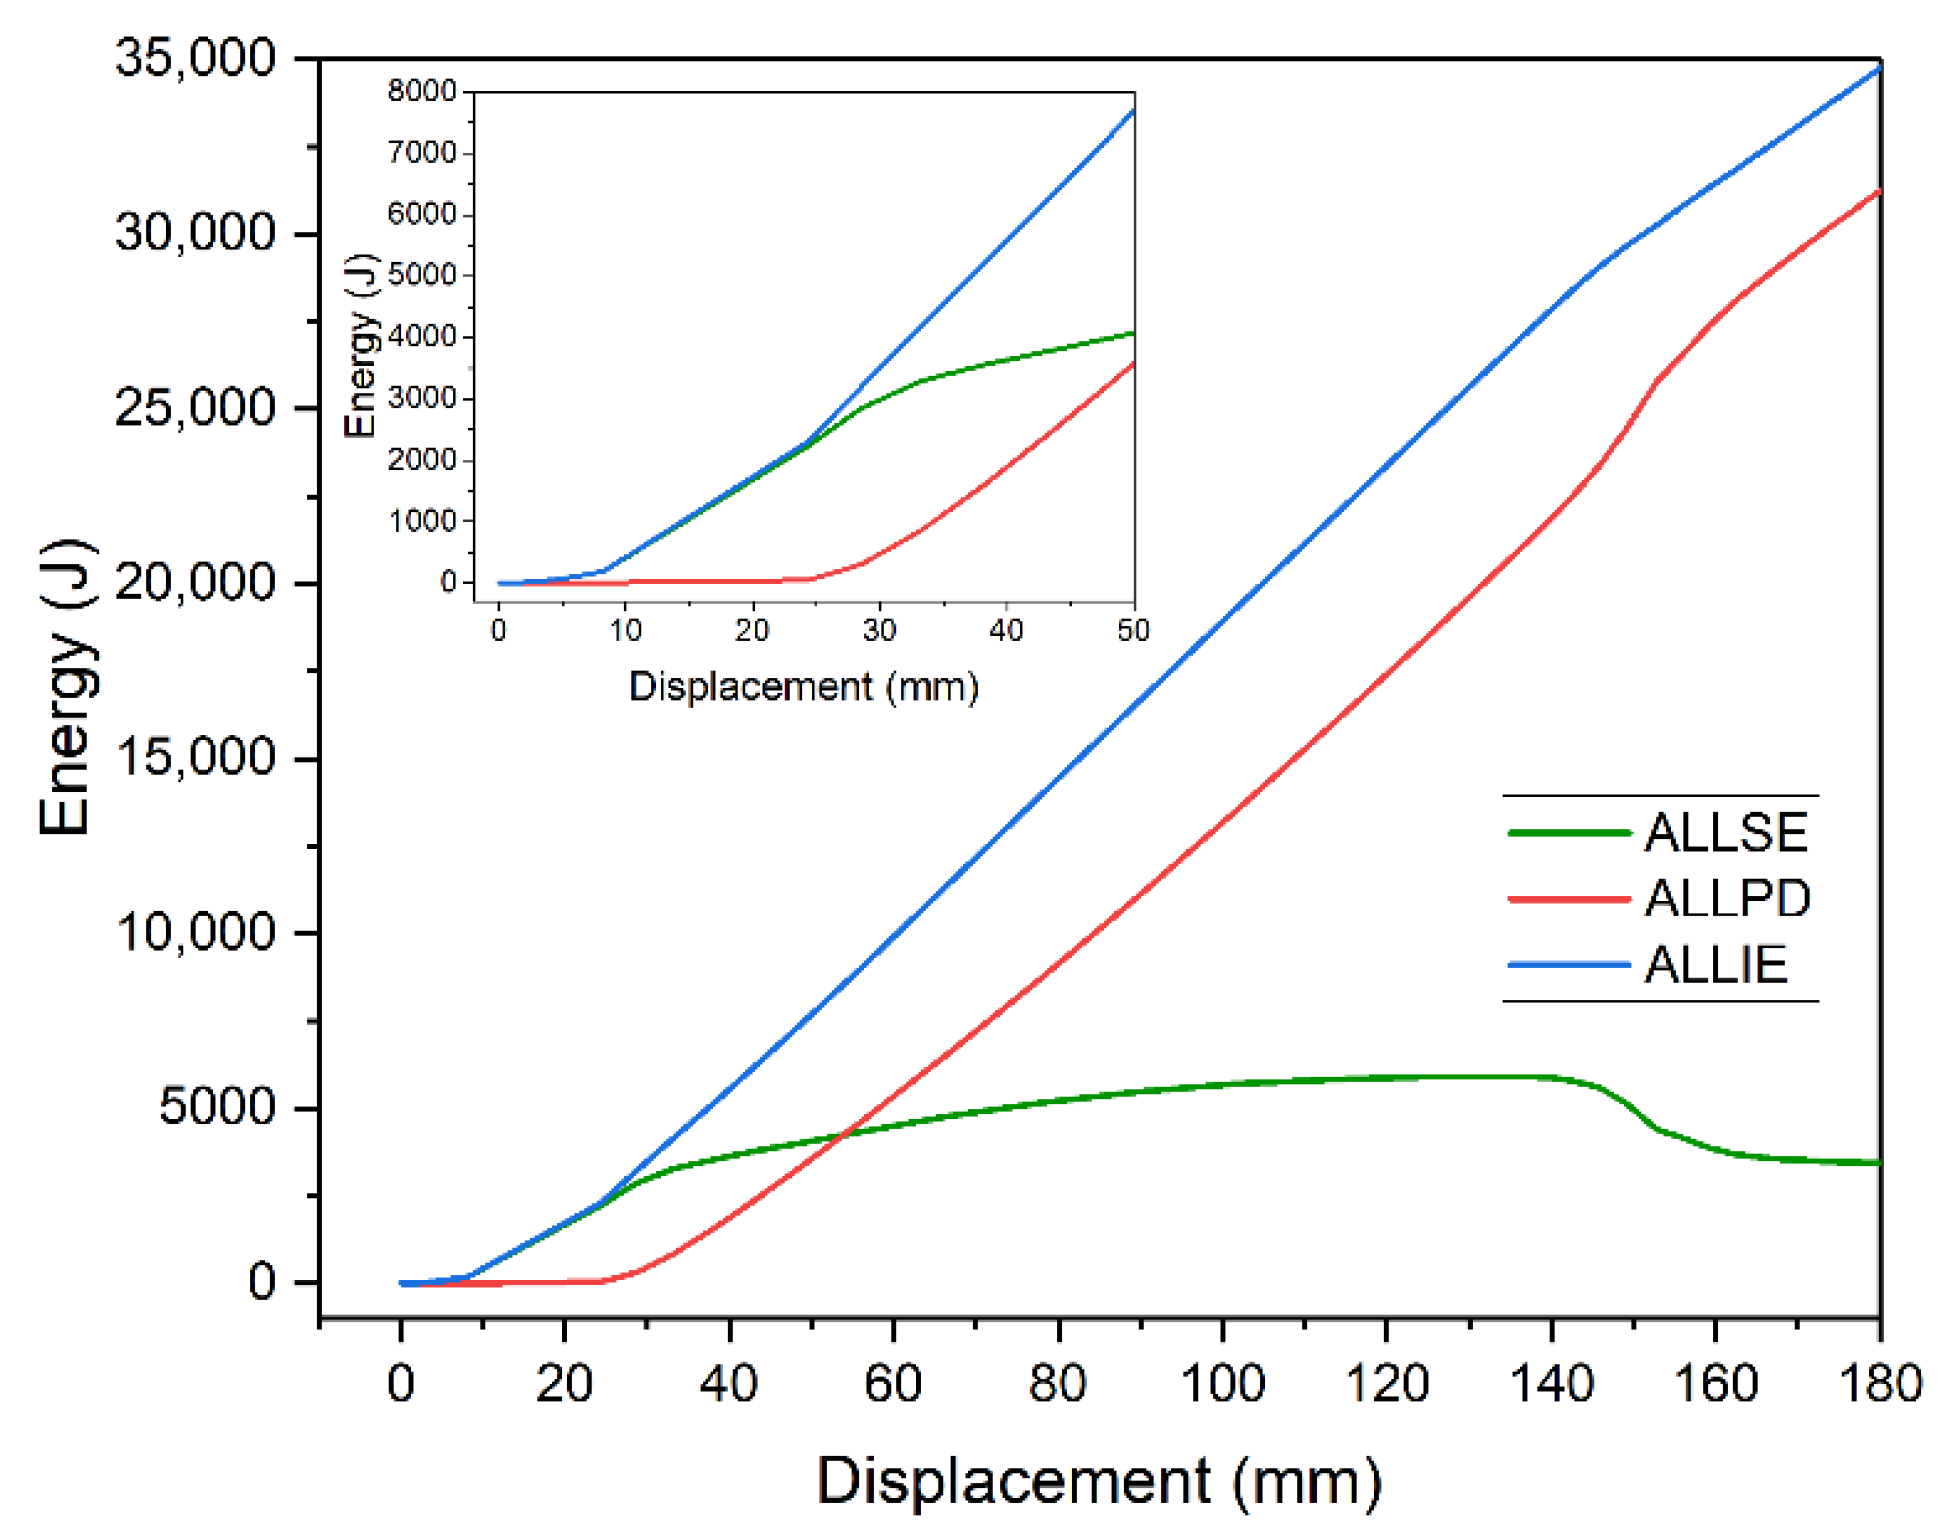
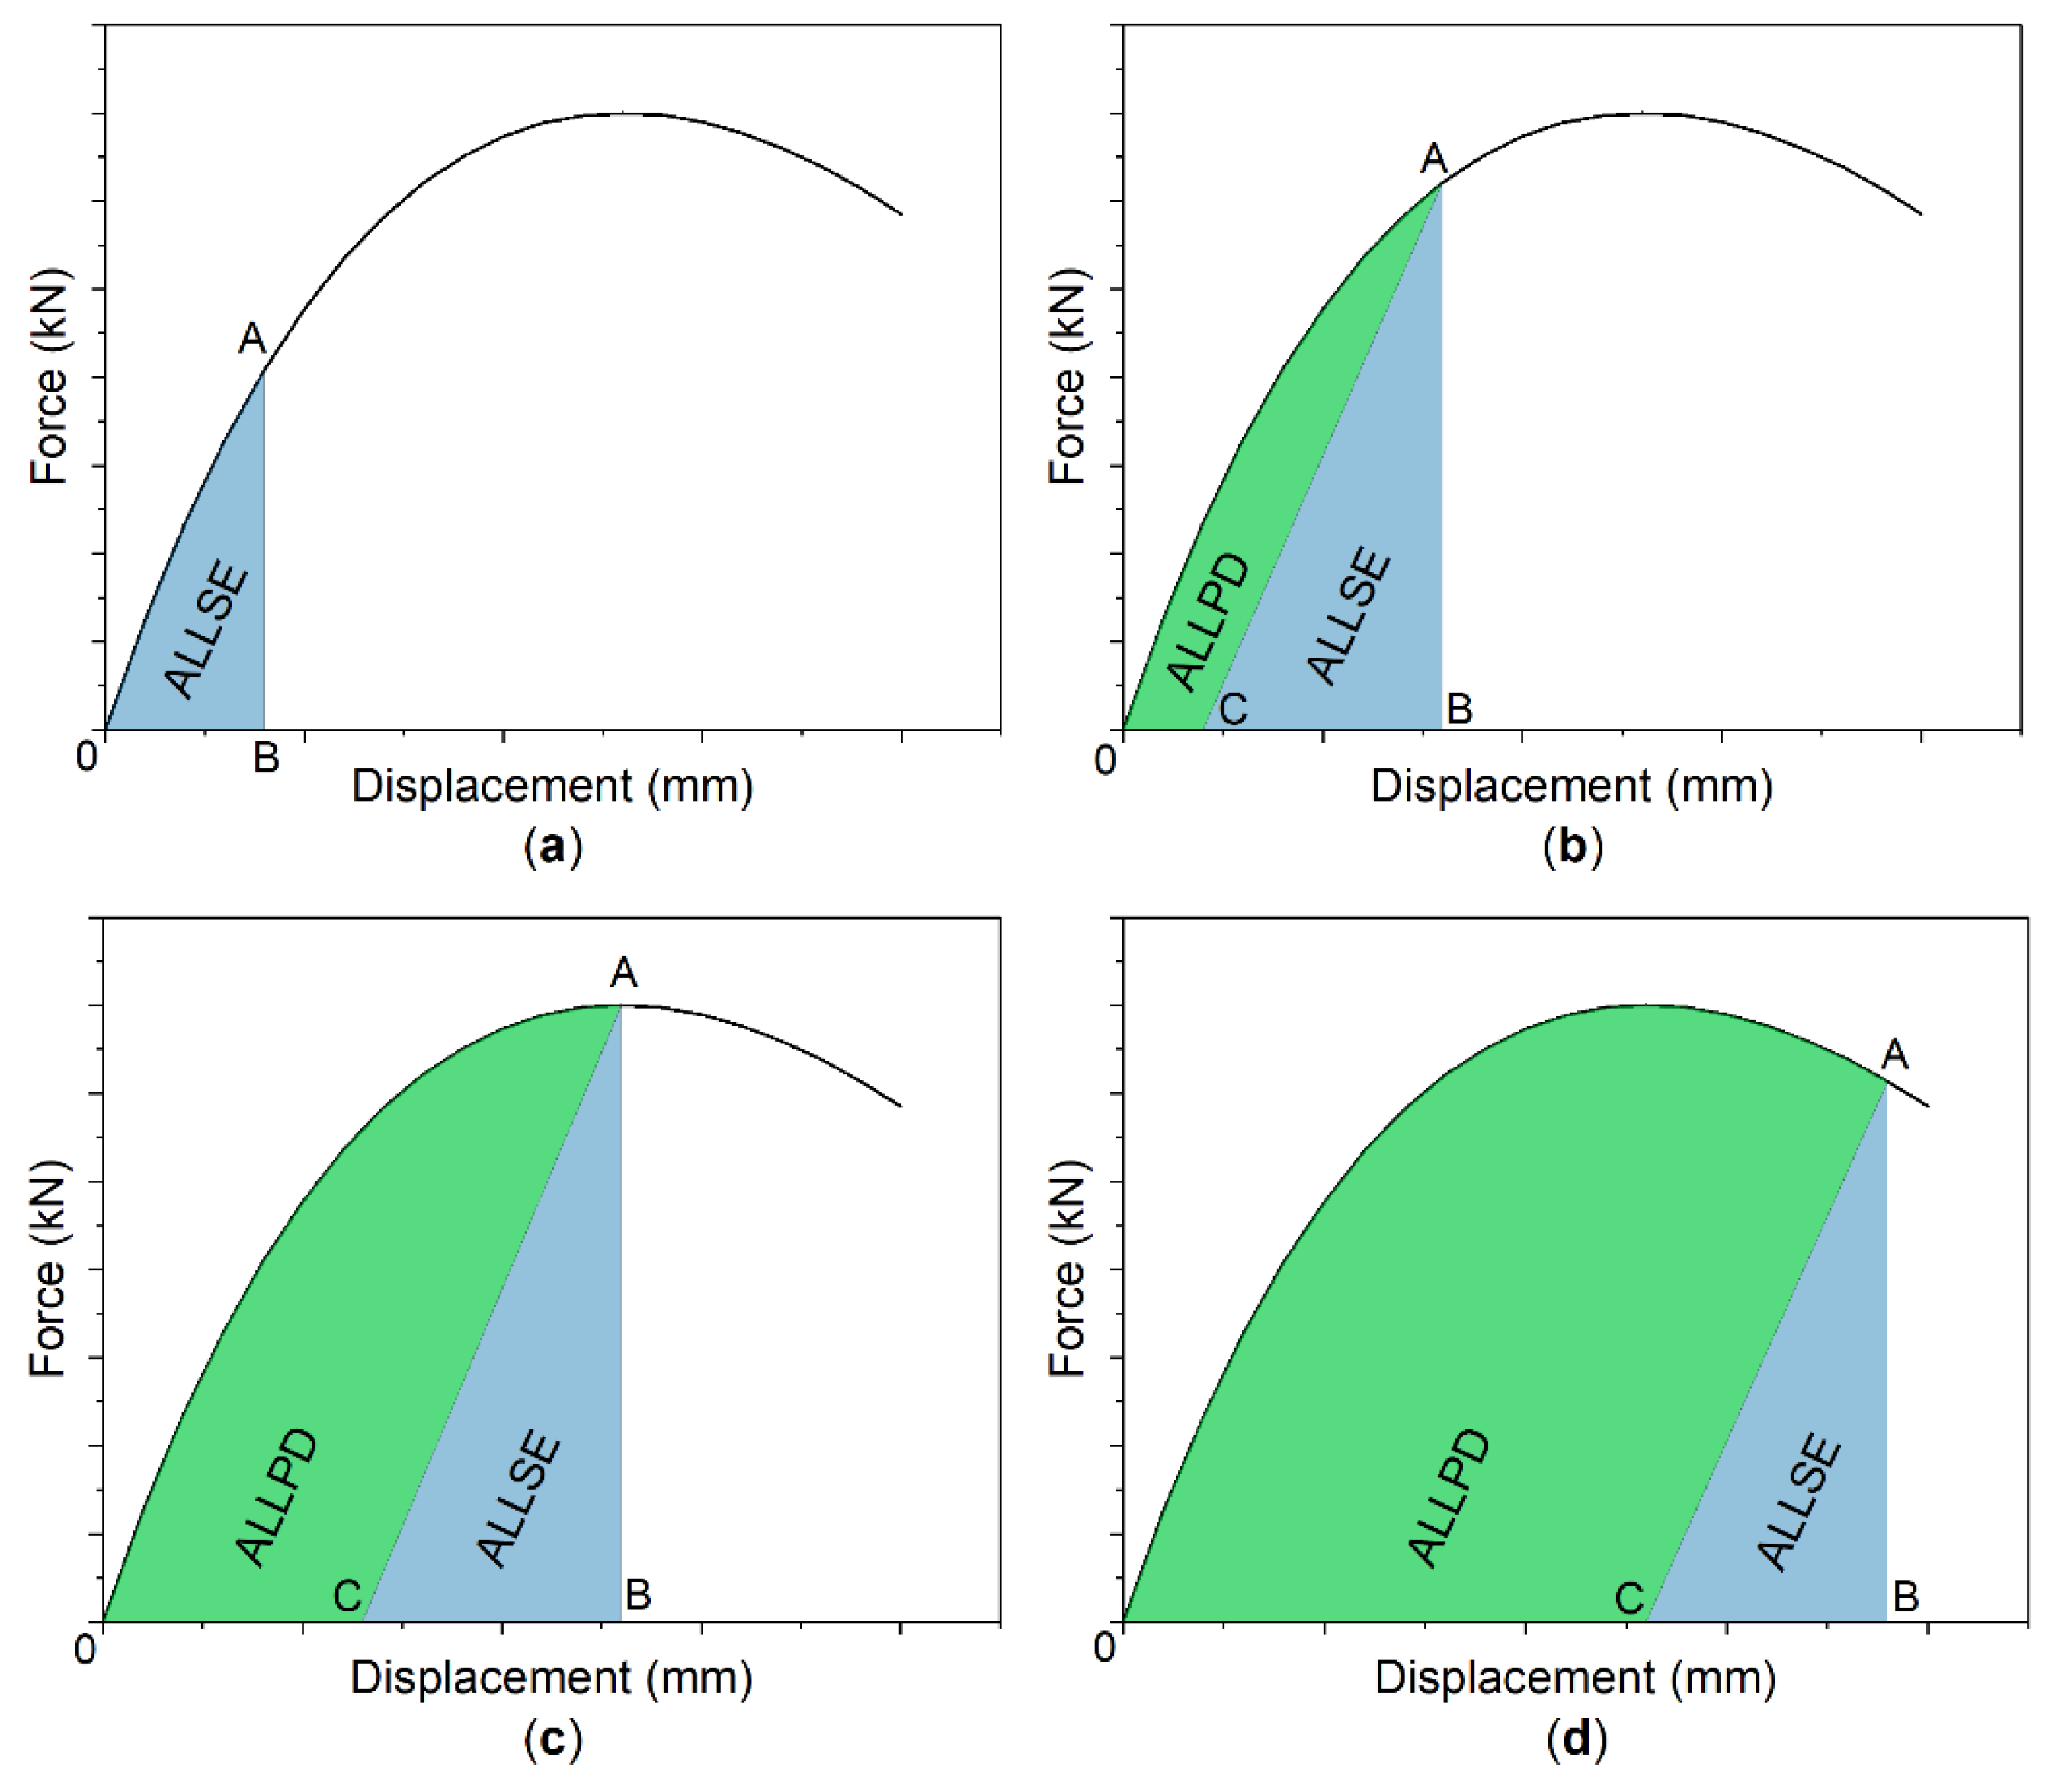
- Recoverable strain energy (ALLSE) is related to elastic strain. It equals the area under the static equilibrium path in the elastic range. It is recoverable, i.e., it is spent when the load is removed and the model goes back to its initial shape. For an undeformed body, it equals zero.
- Energy dissipated by plastic deformation (ALLPD) is dissipated through permanent deformation, which remain permanent even in unloaded conditions.
- Energy dissipated by damage (ALLDMD) is related to damage occurring in the construction. In the analyzed case, it was approximately one thousand times smaller than the energies mentioned above. Its increase correlates with crack propagation in concrete. It occurs in the descending part of static equilibrium path. For these reasons, it was omitted in analysis.
- Total strain energy (ALLIE). It is the sum of ALLSE, ALLPD, and ALLDMD. The latter has a negligible effect on ALLIE.
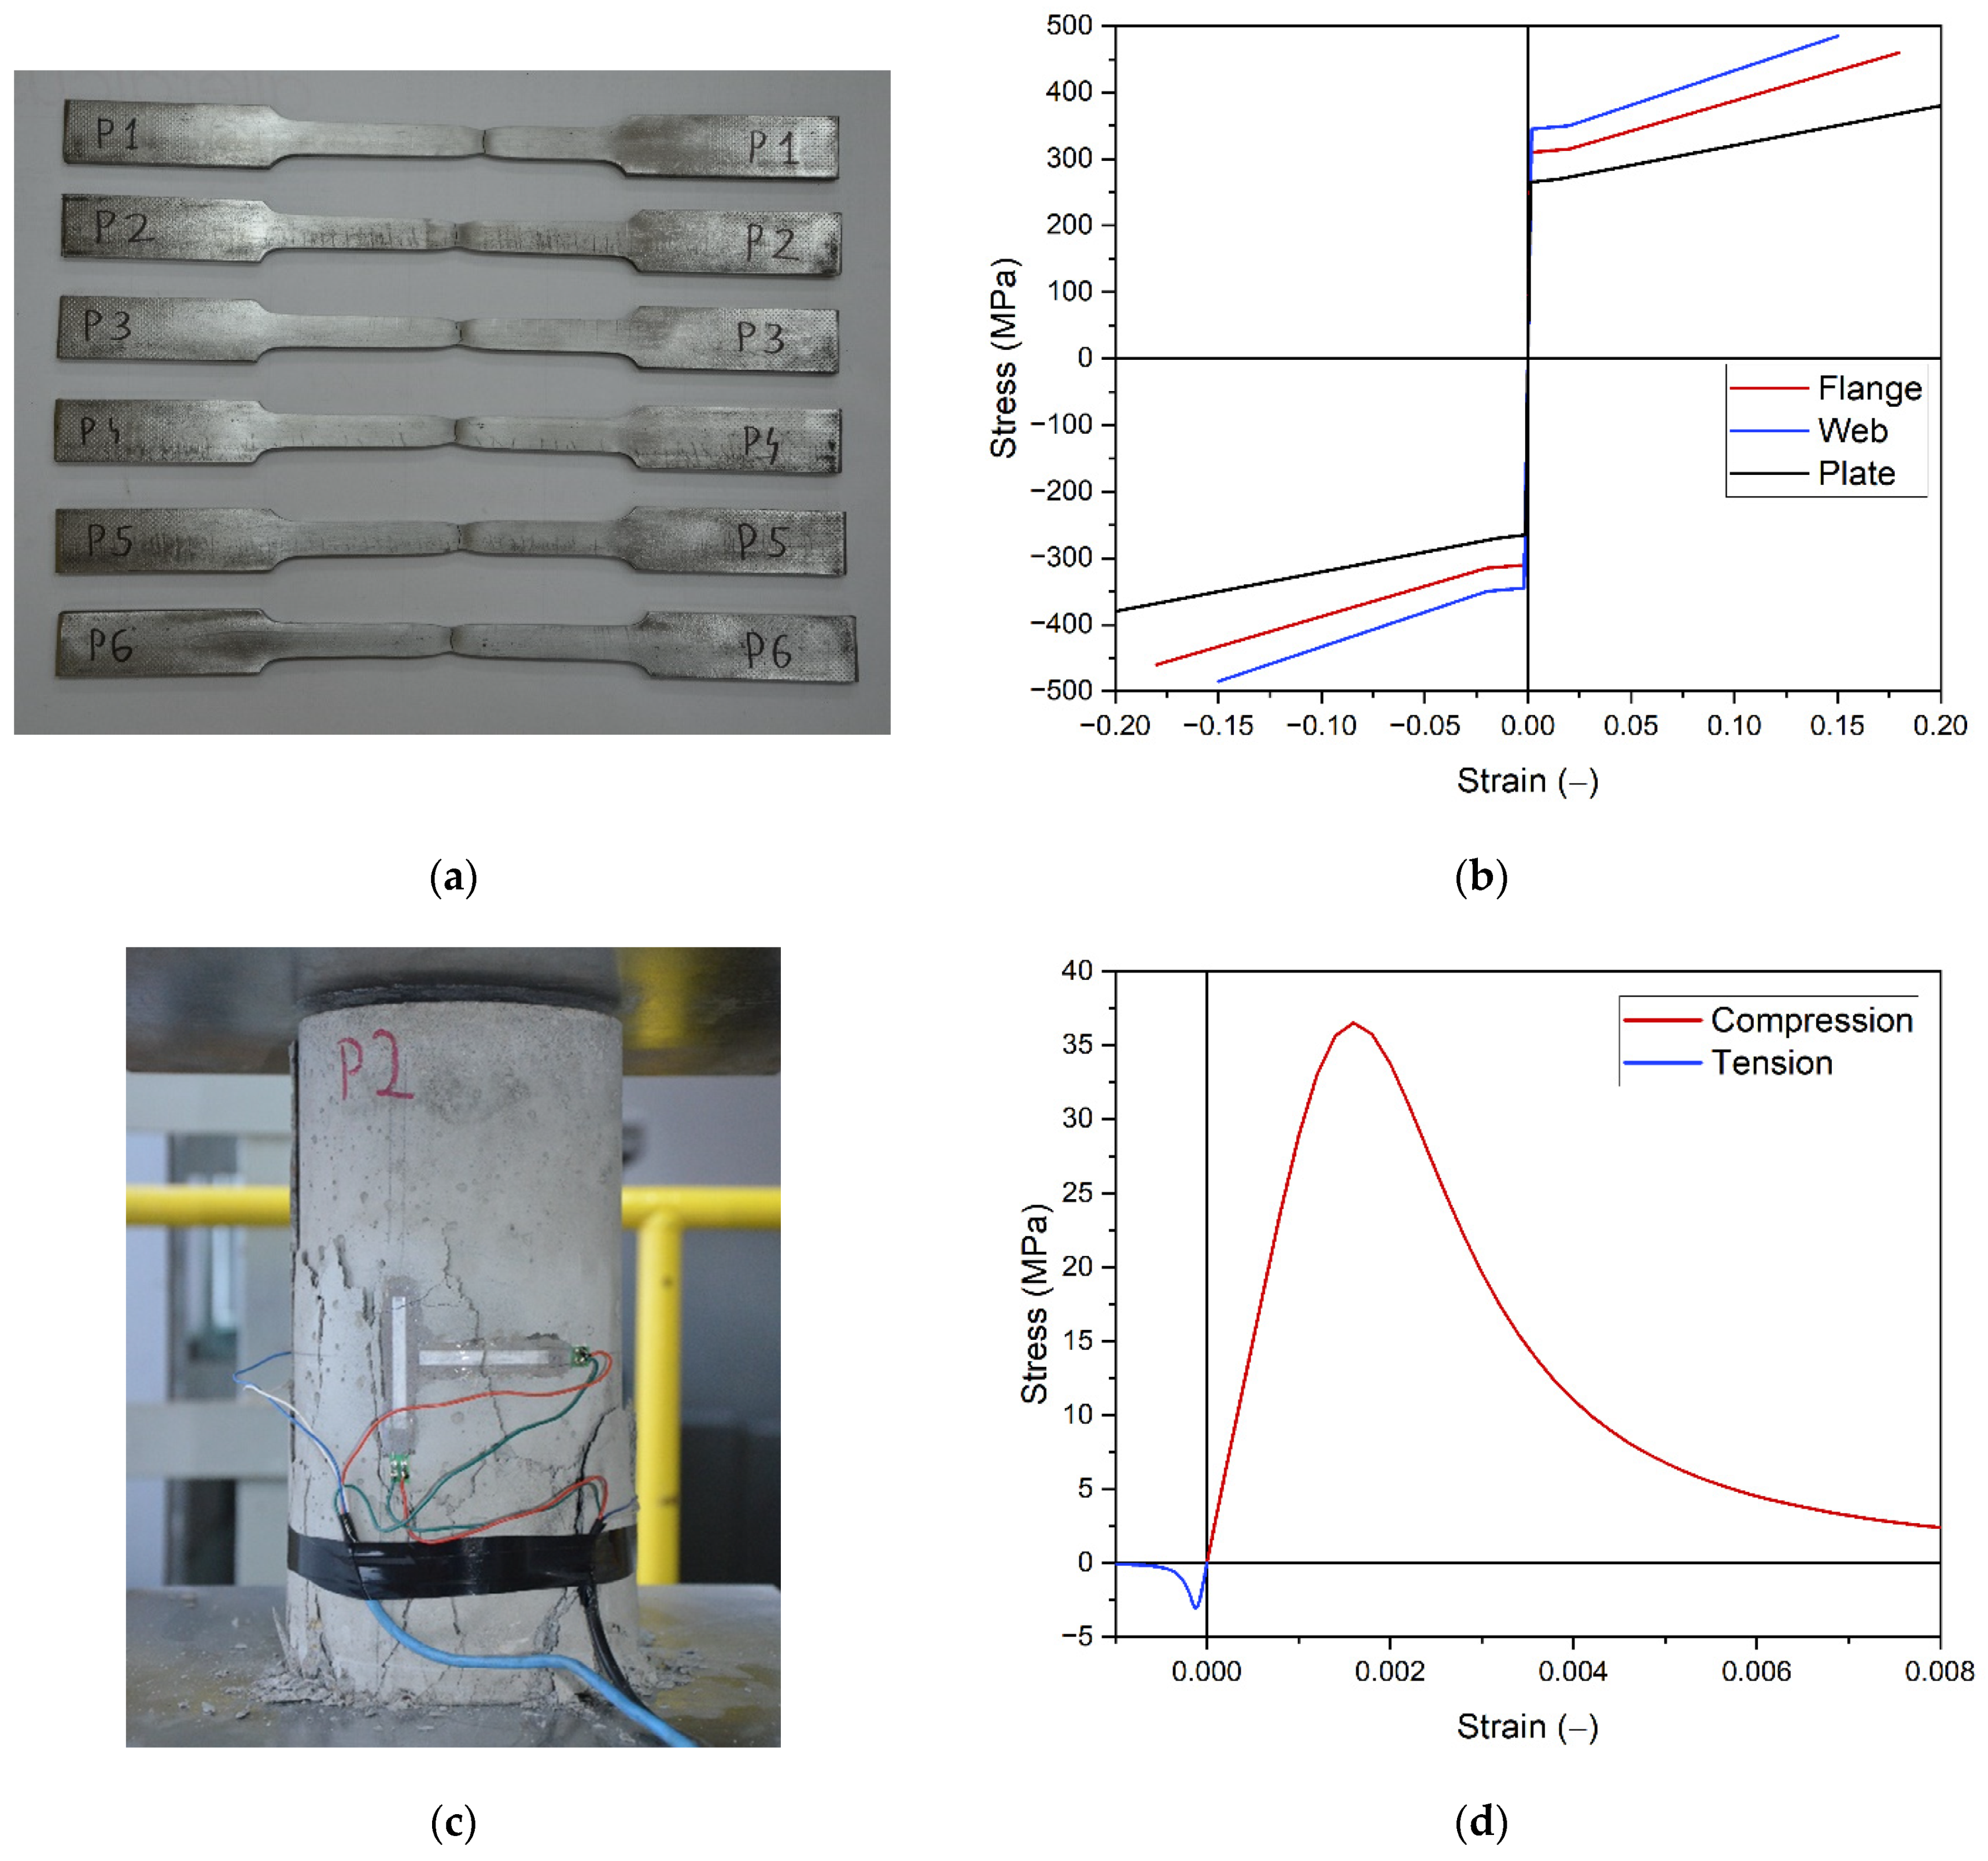
4. Experimental Verification
5. Discussion and Conclusions
Author Contributions
Funding
Institutional Review Board Statement
Informed Consent Statement
Data Availability Statement
Conflicts of Interest
References
- Polus, Ł.; Szumigała, M. An experimental and numerical study of aluminium–concrete joints and composite beams. Arch. Civ. Mech. Eng. 2019, 19, 375–390. [Google Scholar] [CrossRef]
- Chybiński, M.; Polus, Ł. Theoretical, experimental and numerical study of aluminium-timber composite beams with screwed connections. Constr. Build. Mater. 2019, 226, 317–330. [Google Scholar] [CrossRef]
- Saleh, S.M.; Jasim, N.A. Structural Behavior of Timber Aluminum Composite Beams under Static Loads. IJERT Int. J. Eng. Res. Technol. 2014, 3, 1166–1173. [Google Scholar]
- Szumigała, M.; Szumigała, E.; Polus, Ł. Laboratory tests of new connectors for timber-concrete composite structures. Eng. Trans. 2018, 66, 161–173. [Google Scholar]
- Hadigheh, S.A.; McDougall, R.; Wiseman, C.; Reid, L. Evaluation of composite action in cross laminated timber-concrete composite beams with CFRP reinforcing bar and plate connectors using Digital Image Correlation (DIC). Eng. Struct. 2021, 232, 111791. [Google Scholar] [CrossRef]
- Mercedes, L.; Escrig, C.; Bernat-Masó, E.; Gil, L. Analytical approach and numerical simulation of reinforced concrete beams strengthened with different frcm systems. Materials 2021, 14, 1857. [Google Scholar] [CrossRef]
- Subhani, M.; Kabir, M.I.; Al-Ameri, R. Strengthening of steel-concrete composite beams with composite slab. Steel Compos. Struct. 2020, 34, 91–105. [Google Scholar] [CrossRef]
- Simonetti, H.L.; de Assis das Neves, F.; Almeida, V.S. Multiobjective topology optimization with stress and strain energy criteria using the SESO method and a Multicriteria Tournament Decision. Structures 2021, 30, 188–197. [Google Scholar] [CrossRef]
- Bagherinejad, M.H.; Haghollahi, A. Study on Topology Optimization of Perforated Steel Plate Shear Walls in Moment Frame Based on Strain Energy. Int. J. Steel Struct. 2020, 20, 1420–1438. [Google Scholar] [CrossRef]
- Huang, M.; Lei, Y. Bearing Damage Detection of a Reinforced Concrete Plate Based on Sensitivity Analysis and Chaotic Moth-Flame-Invasive Weed Optimization. Sensors 2020, 20, 5488. [Google Scholar] [CrossRef] [PubMed]
- Liu, B.; Guo, D.; Jiang, C.; Li, G.; Huang, X. Stress optimization of smooth continuum structures based on the distortion strain energy density. Comput. Methods Appl. Mech. Eng. 2019, 343, 276–296. [Google Scholar] [CrossRef]
- Zhao, T.; Ramos, A.S.; Paulino, G.H. Material nonlinear topology optimization considering the von Mises criterion through an asymptotic approach: Max strain energy and max load factor formulations. Int. J. Numer. Methods Eng. 2019, 118, 804–828. [Google Scholar] [CrossRef]
- Foster, A.S.J.; Gardner, L.; Wang, Y. Practical strain-hardening material properties for use in deformation-based structural steel design. Thin Walled Struct. 2015, 92, 115–129. [Google Scholar] [CrossRef]
- Li, Z.; Pasternak, H. Experimental and numerical investigations of statistical size effect in S235JR steel structural elements. Constr. Build. Mater. 2019, 206, 665–673. [Google Scholar] [CrossRef]
- Voyiadjis, G.Z.; Taqieddin, Z.N. Elastic Plastic and Damage Model for Concrete Materials: Part I—Theoretical Formulation. Int. J. Struct. Chang. Solids 2009, 1, 31–59. [Google Scholar]
- Lubliner, J.; Oliver, J.; Oller, S.; Oñate, E. A plastic-damage model for concrete. Int. J. Solids Struct. 1989, 25, 299–326. [Google Scholar] [CrossRef]
- Polus, Ł.; Szumigała, M. Laboratory tests vs. FE analysis of concrete cylinders subjected to compression. AIP Conf. Proc. 2019, 2078. [Google Scholar] [CrossRef]
- Jankowiak, T.; Lodygowski, T. Identification of parameters of concrete damage plasticity constitutive model. Found. Civ. Environ. 2005, 6, 53–69. [Google Scholar]
- Gajewski, T.; Garbowski, T. Calibration of concrete parameters based on digital image correlation and inverse analysis. Arch. Civ. Mech. Eng. 2014, 14, 170–180. [Google Scholar] [CrossRef]
- Budziak, M.P.; Garbowski, T. Failure Assessment of Steel-Concrete Composite Column Under Blast Loading. Eng. Trans. 2014, 62, 61–84. [Google Scholar]
- Liu, Y.; Gannon, L. Experimental behavior and strength of steel beams strengthened while under load. J. Constr. Steel Res. 2009, 65, 1346–1354. [Google Scholar] [CrossRef]
- Liu, Y.; Gannon, L. Finite element study of steel beams reinforced while under load. Eng. Struct. 2009, 31, 2630–2642. [Google Scholar] [CrossRef]
- Wang, Y.Q.; Zong, L.; Zhu, R.X.; Liu, X.Y.; Shi, Y.J. Behavior of I-section steel beam welding reinforced while under load. J. Constr. Steel Res. 2015, 106, 278–288. [Google Scholar] [CrossRef]
- Vild, M.; Bajer, M. Strengthening under Load: The Effect of Preload Magnitudes. Procedia Eng. 2016, 161, 343–348. [Google Scholar] [CrossRef]
- Al Ali, M.; Kvočák, V.; Platko, P. Stress State of Steel Column Strengthened under Load. Procedia Eng. 2017, 190, 632–636. [Google Scholar] [CrossRef]
- Pasternak, H.; Kubieniec, G. Implementation of longitudinal welding stresses into structural calculation of steel structures. J. Civ. Eng. Manag. 2016, 22, 47–55. [Google Scholar] [CrossRef]
- Deng, D.; Kiyoshima, S. Numerical simulation of welding temperature field, residual stress and deformation induced by electro slag welding. Comput. Mater. Sci. 2012, 62, 23–34. [Google Scholar] [CrossRef]
- Perić, M.; Garašić, I.; Nižetić, S.; Dedić-Jandrek, H. Numerical Analysis of Longitudinal Residual Stresses and Deflections in a T-joint Welded Structure Using a Local Preheating Technique. Energies 2018, 11, 3487. [Google Scholar] [CrossRef] [Green Version]
- Liu, H.; Zhao, Y.; Chen, Z.; Dong, X. Axial-compression mechanical properties of square steel columns strengthened by welding under high load. J. Constr. Steel Res. 2021, 176, 106390. [Google Scholar] [CrossRef]
- Liu, H.; Hu, J.; Yang, Y.; Chen, Z.; Wang, L. Circular steel tubes strengthened by welding angle steel under preloading condition. J. Constr. Steel Res. 2021, 184, 106816. [Google Scholar] [CrossRef]
- Szewczyk, P.; Szumigała, M. Welding deformation in a structure strengthened under load in an empirical-numerical study. In Proceedings of the Advances in Mechanics: Theoretical, Computational and Interdisciplinary Issues—3rd Polish Congress of Mechanics (PCM) and 21st International Conference on Computer Methods in Mechanics (CMM), Gdansk, Poland, 8–11 September 2015; CRC Press: Boca Raton, FL, USA, 2016. [Google Scholar]
- Garsteckl, A. Optimal Redesign of Elastic Structures in the State of Initial Loading. J. Struct. Mech. 1984, 12, 279–301. [Google Scholar] [CrossRef]
- Garstecki, A.; Glema, A. Sensitivity analysis and optimal redesign of columns in the state of initial distortions and prestress. Struct. Optim. 1991, 3, 141–148. [Google Scholar] [CrossRef]
- Szewczyk, P.; Szumigała, M. Strengthening of steel-concrete composite beams in experimental study. Mod. Trends Res. Steel Alum. Compos. Struct. 2021, 242–248. [Google Scholar] [CrossRef]
Publisher’s Note: MDPI stays neutral with regard to jurisdictional claims in published maps and institutional affiliations. |
© 2021 by the authors. Licensee MDPI, Basel, Switzerland. This article is an open access article distributed under the terms and conditions of the Creative Commons Attribution (CC BY) license (https://creativecommons.org/licenses/by/4.0/).
Share and Cite
Szewczyk, P.; Szumigała, M. Optimal Design of Steel–Concrete Composite Beams Strengthened under Load. Materials 2021, 14, 4715. https://doi.org/10.3390/ma14164715
Szewczyk P, Szumigała M. Optimal Design of Steel–Concrete Composite Beams Strengthened under Load. Materials. 2021; 14(16):4715. https://doi.org/10.3390/ma14164715
Chicago/Turabian StyleSzewczyk, Piotr, and Maciej Szumigała. 2021. "Optimal Design of Steel–Concrete Composite Beams Strengthened under Load" Materials 14, no. 16: 4715. https://doi.org/10.3390/ma14164715
APA StyleSzewczyk, P., & Szumigała, M. (2021). Optimal Design of Steel–Concrete Composite Beams Strengthened under Load. Materials, 14(16), 4715. https://doi.org/10.3390/ma14164715