Article

Spatial Pattern of the Vitality of Chinese Characteristic Towns: A Perspective from Nighttime Lights

1
School of Geography, Liaoning Normal University, Dalian 116029, China
2
Postdoctoral Station of Geography, Liaoning Normal University, Dalian 116029, China
3
Centre for Marine Economy and Sustainable Development Research, Liaoning Normal University, Dalian 116029, China
*
Author to whom correspondence should be addressed.
Land 2022, 11(1), 85; https://doi.org/10.3390/land11010085
Submission received: 7 December 2021 / Revised: 4 January 2022 / Accepted: 4 January 2022 / Published: 6 January 2022
(This article belongs to the Topic Climate Change and Environmental Sustainability)

Abstract

:
Nighttime light images are valuable indicators of regional economic development, and nighttime light data are now widely used in town monitoring and evaluation studies. Using the nighttime light data acquired through Luojia1-01 and the geographic information system spatial analysis method, this study analyzed the spatial vitality pattern of 402 characteristic towns in six geographic divisions of China. The average DN (Digital Number) value of Guzhen, having the highest vitality level, was 0.05665221, whereas that of Xin’an, having the lowest vitality level, was 0.00000186. A total of 89.5% of towns have a low level of vitality. The regional differences were significant; high vitality towns are concentrated in economically developed coastal areas, mainly in two large regions of east China and south central. The average lighting densities of the towns in east China and south central were 0.004838 and 0.003190, respectively. The lighting density of the towns in west central was low, and the vitality intensity was generally low. A spatially significant positive correlation of small-town vitality was observed, and “high–high” agglomeration was primarily distributed in the Yangtze River Delta, Pearl River Delta, and Fujian coastal areas in east and south China. The towns with high vitality intensity had similarities in their geographical location, convenient transportation conditions, and profound historical heritage or cultural accumulation along with many industrial enterprises. This research empirically demonstrates the feasibility of using the 130-m-high resolution of the nighttime lighting data of Luojia1-01 to evaluate the vitality at the town scale, and the vitality evaluation focuses on the spatial attributes of the town, which is meaningful to guide the development of the town in each region given the vast area of China and the large differences in the development of different regions.

1. Introduction

Since the beginning of the 21st century, urbanization in China has been increasing at an accelerated pace, and the urbanization rate has increased from 36.22% in 2000 to 63.89% in 2020. An increasing number of people are migrating to cities, resulting in increased traffic congestion, housing tension, environmental pollution, heat challenges [1], and other urban problems. Further, a vast number of rural areas and small townships are not sufficiently dynamic; their development is encountering bottlenecks, and the gaps between urban and rural areas and the rich and poor are widening. In this context, China released its first urbanization plan—the New Urbanization Plan (2014–2020)—in 2014, aiming to promote the healthy and sustainable development of large, medium, and small cities; small towns; and villages. The development of small towns has become an important topic in the study of new urbanization. In this context, characteristic towns are spatial platforms with evident industrial characteristics, cultural connotations, tourism, and certain community functions, and are relatively independent from urban areas. They are important in promoting urbanization and economic development, narrowing the gap between urban and rural areas, and eliminating the gap between the rich and the poor. In 2016, China’s National Development and Reform Commission, the Ministry of Finance, and the Ministry of Housing and Construction decided to conduct a nationwide construction of characteristic towns. They announced the first and second batches of 403 characteristic towns in China in October 2016 and August 2017, distributed in 31 provinces, cities, autonomous regions, and Xinjiang Construction Corps of China (Hong Kong, Macao, and Taiwan were not selected at that time). In 2021, the “Fourteenth Five-Year Plan for National Economic and Social Development of the People’s Republic of China and the Outline of the Vision 2035” was released. It clearly proposed, “according to the location conditions, resource endowment, and development basis, small towns should be developed according to local conditions, and standardized and healthy development of characteristic towns should be promoted.” As an important path for exploring new urbanization in China and a spatial carrier for extending the rural revitalization strategy, Chinese characteristic towns have received wide attention from all domains.
Current domestic and international research on Chinese characteristic towns focuses on the following aspects: qualitative descriptions of the development mode [2,3,4,5,6], planning of design [7,8], formation mechanism [9], evaluation system [10], and the cultural construction [11] of the characteristic town; these have been conducted from the macro concept perspective. Empirical studies on characteristic towns have been conducted from the perspective of combining theory and practice, such as a series of case studies on sports and leisure characteristic towns, agricultural characteristic towns [9], hot spring towns, cultural characteristic towns, and tourism characteristic towns [12,13]. In addition, some scholars have also used spatial analysis techniques and quantitative methods to study the characteristics of spatial distribution patterns, influencing factors [14,15,16,17,18,19], and the economic efficiency of small towns [20], and the results of their research have been relatively fruitful.
However, with the rapid promotion of characteristic towns, some towns have been built without much consideration, with insufficient developmental planning, disorderly town space expansion, imperfect supporting facilities, indistinct characteristics, and unstable population issues. The following construction does not achieve the goal of stable and healthy development of the town; instead, how to correctly measure the development vitality of the town and recognize the current situation of the town’s development vitality becomes an urgent task to complete. Vitality is the key to assessing the quality of a town’s development. The development vitality of a characteristic town determines whether the town can develop sustainably and attractively in the long run. Research on town vitality can provide a clear understanding of the town’s development status and can be an important supplement in the evaluation of economic development indicators.
The concept of vitality was originally proposed by the scholar Jane Jacobs (1961) in her book “The Death and Life of Great American Cities” wherein she argued that vitality is defined as an intensive concentration of people caused by well-organized urban spaces that promote social activity, emphasizing the role of human activity in urban vitality. Since then, the concept or the theory of urban vitality has undergone continuous refinement. For example, Kevin Lynch [21], in his book “Good City Form”, portrayed urban vitality as one of the five basic performance indicators of urban spatial form and defined vitality as the degree to which a settlement form supports vital functions, ecological requirements, and human capabilities. Jiang Difei [22], in his “The Theory of Urban Form Vitality”, proposed that economic vitality, social vitality, and cultural vitality constitute the urban vitality system. Among them, economic vitality and social vitality provide some inspiration for the conduct of this study.
Domestic research started late, and the number of research results only gradually increased in the 21st century. Local research has focused on the use of statistical data. By constructing models, establishing indicator systems, and using factor analysis and hierarchical analysis, researchers have tried to determine ways to evaluate research content primarily based on the definition of the concept of vitality, vitality components, vitality evaluation, and countermeasures to enhance the vitality of the proposal and other perspectives [23,24,25,26,27,28,29,30]. In contrast, international research includes a broader perspective. For example, studies on Jane Jacobs’ viewpoint [31,32,33]; studies from specific spatial perspectives, such as neighborhoods [34,35,36,37], subway hubs [38], underground spaces [39,40], waterfront spaces [41], and cities [42]; and a selection of large spatiotemporal data [43,44,45,46], Wi-Fi hotspots [47], and other emerging data sources. Additionally, studies comparing and analyzing the differences between different cities’ vitality from a comparative perspective [48,49], and studies from the perspective of interconnections between other elements, such as town vitality and population [50,51], urban built environment [52], and urban culture [53] have been conducted. Based on DMSP/OLS nighttime lighting data, and combined with statistical and point of interest data, Zhang analyzed and evaluated urban vitality from two spatial scales, national and urban, and empirically demonstrated the feasibility of using nighttime lighting remote sensing data to evaluate urban vitality [54]. Since then, other researchers have included nighttime lighting data in their urban vitality studies [24,55,56].
Night light remote sensing is an optical remote sensing technology that can detect nighttime shimmering light. As most of the stable bright light at night originates from artificial light sources, such as that generated by residential areas, traffic flow, and roads, the different intensities of light can intuitively reflect the activity of the local economy and the intensity of human activities at night, with certain economic and social aspects; therefore, it is feasible to use night light brightness to characterize the level of regional vitality. Research conducted on the application of the remote sensing data of nighttime lights to estimate the urban socioeconomic index primarily focused on the national, provincial, and municipal scales, whereas at the district, county, and other smaller township scales, the research results were not sufficiently accurate because of the low spatial resolution of remote sensing images, which resulted in relatively low relevant application research. Luojia1-01, the world’s first professional nighttime light remote sensing satellite released in 2018, has a considerably better spatial, temporal, and radiometric resolution than DMSP-OLS (Defense Meteorological Satellite Program/Operational Linescan System) and NPP-VIIRS (NPOESS Preparatory Project/Visible infrared Imaging Radiometer). Its high-resolution nighttime light remote sensing images provide more opportunities to engage in research on finer scale areas. Currently, the nighttime lighting data of Luojia1-01 have been widely used locally and internationally for the identification and extraction of urban built-up areas [57,58], urban spatial expansion [59,60], GDP estimation [61], population estimation [62], housing vacancy rate estimation [63,64], urban thermal environment [65], and comparative analysis with NPP-VIIRS nighttime lighting data [66,67]. Although there have been more productive research results, few studies are available on the township-scale development dynamics under the microscopic view using satellite remote sensing data of Luojia1-01.
This paper aimed to answer the following three concerns: Measuring the degree of vitality of Chinese characteristic towns, the characteristics of the spatial distribution pattern of the dynamism of Chinese characteristic towns, and the driving forces of high-vitality towns. To resolve these three problems, this study selected 402 characteristic towns in six geographic subdivisions of China as the research objects. The remote sensing image data of Luojia1-01 were used as the basis. Using the geographical information system spatial analysis method, the average light value of each town was calculated, following which the towns were reclassified and defined based on the vitality of the characteristic towns. The internal laws and the mechanism of the difference in the vitality of Chinese characteristic towns were also assessed.

2. Materials and Methods
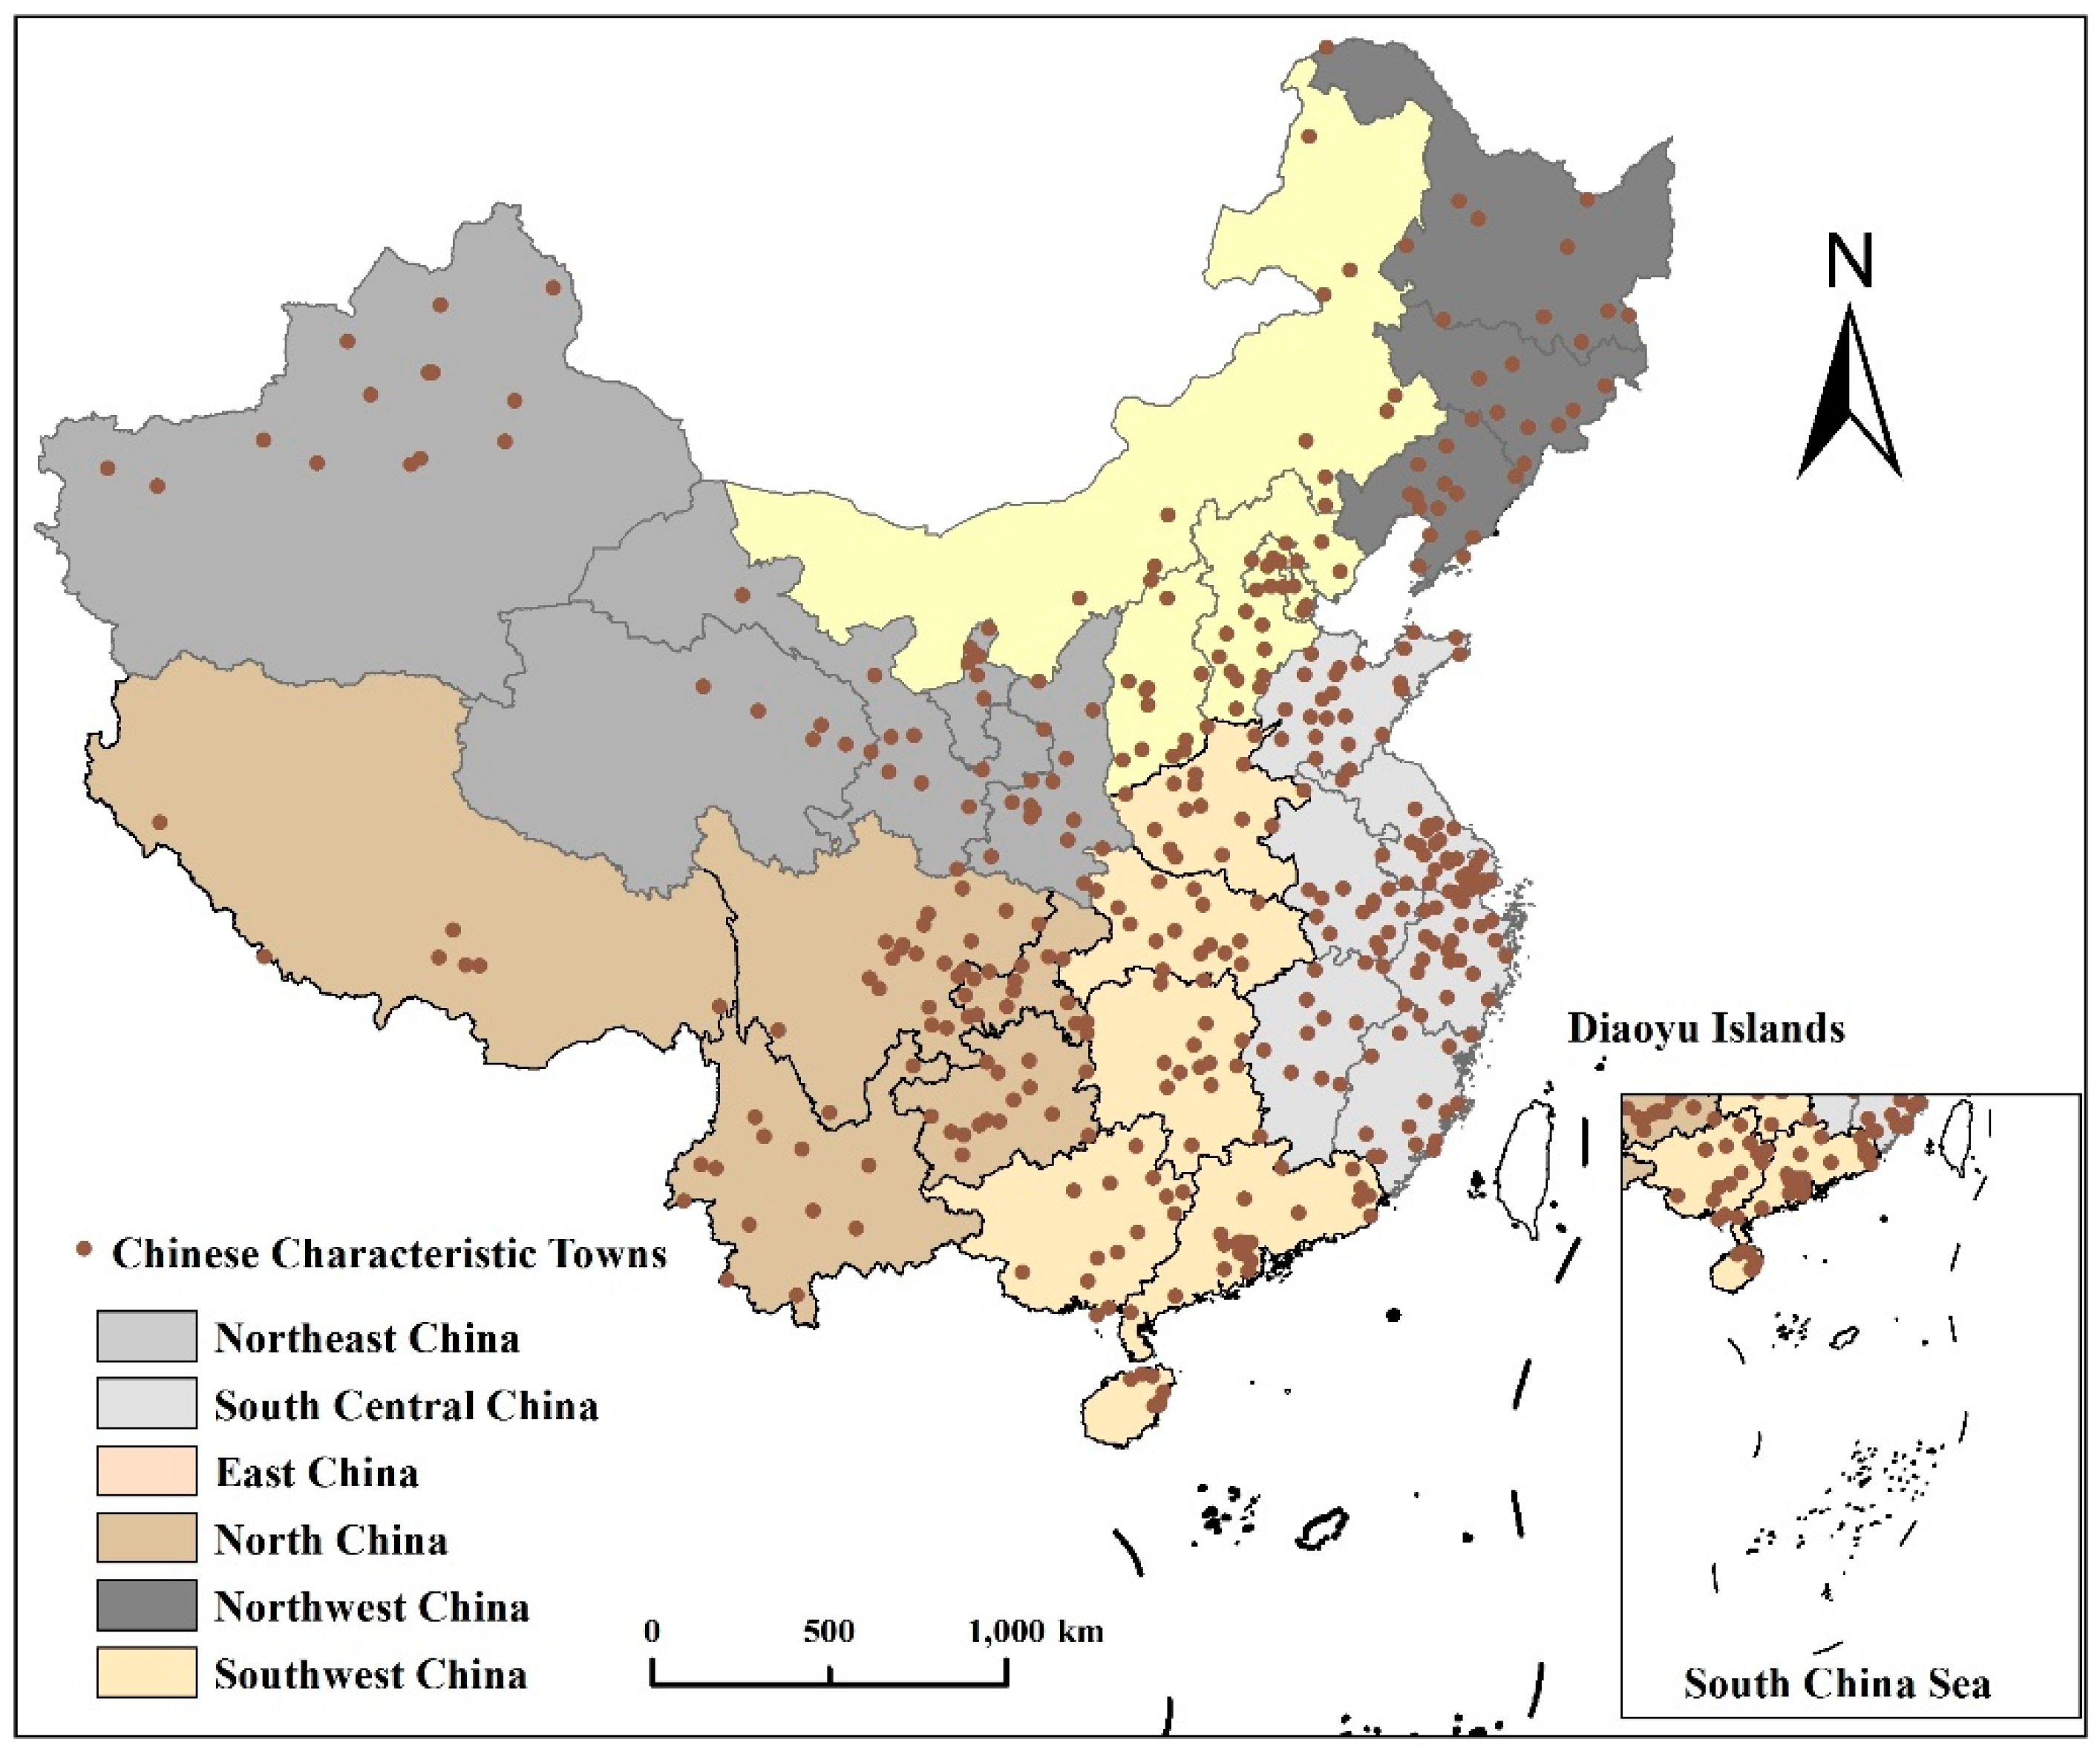
2.1. Study Area

Among the 403 characteristic towns in China, the data of Shahe town in Alar city of Xinjiang Construction Corps were missing; therefore, 402 characteristic towns in China, barring Shahe town, were considered in this study. Figure 1 shows the geographical location of the 402 characteristic towns.

2.2. Data Sources

The main data used in this study were nighttime lighting data, administrative district data, and statistical data. Details are shown in Table 1.

2.3. Methods

2.3.1. DN Value Calculation

In general, the light intensity of an area can be represented by the element brightness value (DN) of a remote sensing image; the DN is derived from radiometric brightness conversion [68]. Based on the nighttime lighting data of Luojia1-01, ArcGIS software was used to crop the boundaries of each town in the administrative division vector map of Chinese townships, and the raster calculator tool was used to calculate the lighting values of each town. The calculated lighting values were superimposed with the area to derive the average DN value of each town to reflect the characteristics of the vitality of each town.
The product radiation brightness conversion of Liaojia1-01 star can be calculated as follows:
L = D N 3 2 × 10 10
where L is the absolute radiation correction after the radiation brightness value in W ( m 2 · sr · μ m ) and DN is the image gray value.

2.3.2. Natural Interruption Point Grading Method

The natural discontinuity grading method is a statistical method for grading and classification according to the law of numerical statistical distribution, which can divide the research objects into groups with similar properties and maximize the difference between classes [69]. There are natural turning points in any statistical series with which the objects under study can be grouped into clusters of similar nature, such that the cleavage points themselves are good bounds for grading. Using the classification tool of ArcGIS software, the average DN value of Chinese characteristic towns was classified and defined as the vitality level according to the natural discontinuity grading method, and the vitality level of 402 characteristic towns was classified into the following five levels: lowest, low, medium, high, and highest, based on the inherent distribution law of data. Details are shown in Table 2.

2.3.3. Global Moran’s I Tool

In spatial autocorrelation analysis, the most commonly used statistic is Global Moran’s I, which is mainly used to describe the average degree of association of all the spatial units with their surrounding areas over the whole region. It is a widely used measure of global spatial autocorrelation [70,71], and measures the spatial autocorrelation based on element locations and element values. Given a set of elements and associated attributes, the tool assesses whether the expressed pattern is clustered, discrete, or random. The tool assesses the significance of this index by calculating the Moran’s I index value, Z-score, and p-value. The Moran’s I statistic for spatial autocorrelation can be expressed as follows:
I = n S 0 × i = 1 n j = 1 n w i , j z i z j i = 1 n z i 2
where z i is the deviation of the attribute of element i from its mean ( x i X ¯ ), w i , j is the spatial weight between elements i and j, n is the total number of elements, and S 0 is the aggregation of all spatial weights.
Moran’s I index is usually interpreted as a correlation coefficient with values in the range (0,1). A Moran’s I value greater than 0 indicates that the data exhibit a spatially positive correlation, with larger values being more clearly spatially correlated, while a Moran’s I value less than 0 indicates that the data exhibit a spatially negative correlation, with smaller values being more spatially different. Further, a Moran’s I value of 0 indicates that the data are spatially randomly distributed. When interpreting the Moran’s I index, it is necessary to analyze it along with the p-value and Z-score. The p-value indicates the probability; when the value of p is small, the observed spatial patterns have a high probability of clustering. The Z-score is a multiple of standard deviation, which can reflect the degree of dispersion of the data set.

2.3.4. Anselin Local Moran’s I

Global autocorrelation is used to describe the overall distribution of a phenomenon and to determine whether there are aggregation characteristics of this phenomenon in space, but it does not precisely indicate the areas in which the aggregation is located [42,72]. Given a set of elements and an analysis field, the Anselin Local Moran’s I analysis tool identifies spatial clusters and spatial outliers for elements with high or low values, facilitating the detection of spatial heterogeneity between data. Anselin Local Moran’s I is generally used to measure local spatial autocorrelation. It can be calculated as follows:
  I i = x i X ¯ S i 2 j = 1 , j i n w i , j ( x j X ¯ )
where x i is the attribute of element i, X ¯ is the average of the corresponding attributes, and w i , j is the spatial weight between elements i and j. S i 2 can be calculated as follows:
  S i 2 = j = 1 , j i n ( x j X ¯ ) 2 n 1
where n is the total number of elements, and a positive value of I i indicates that the elements have a spatial clustering of neighboring elements that contain the same high or low (high–high or low–low) attribute values. A negative value of I i indicates that the elements have a spatial clustering of neighboring elements that contain different (High–Low or Low–High) attribute values.

3. Results

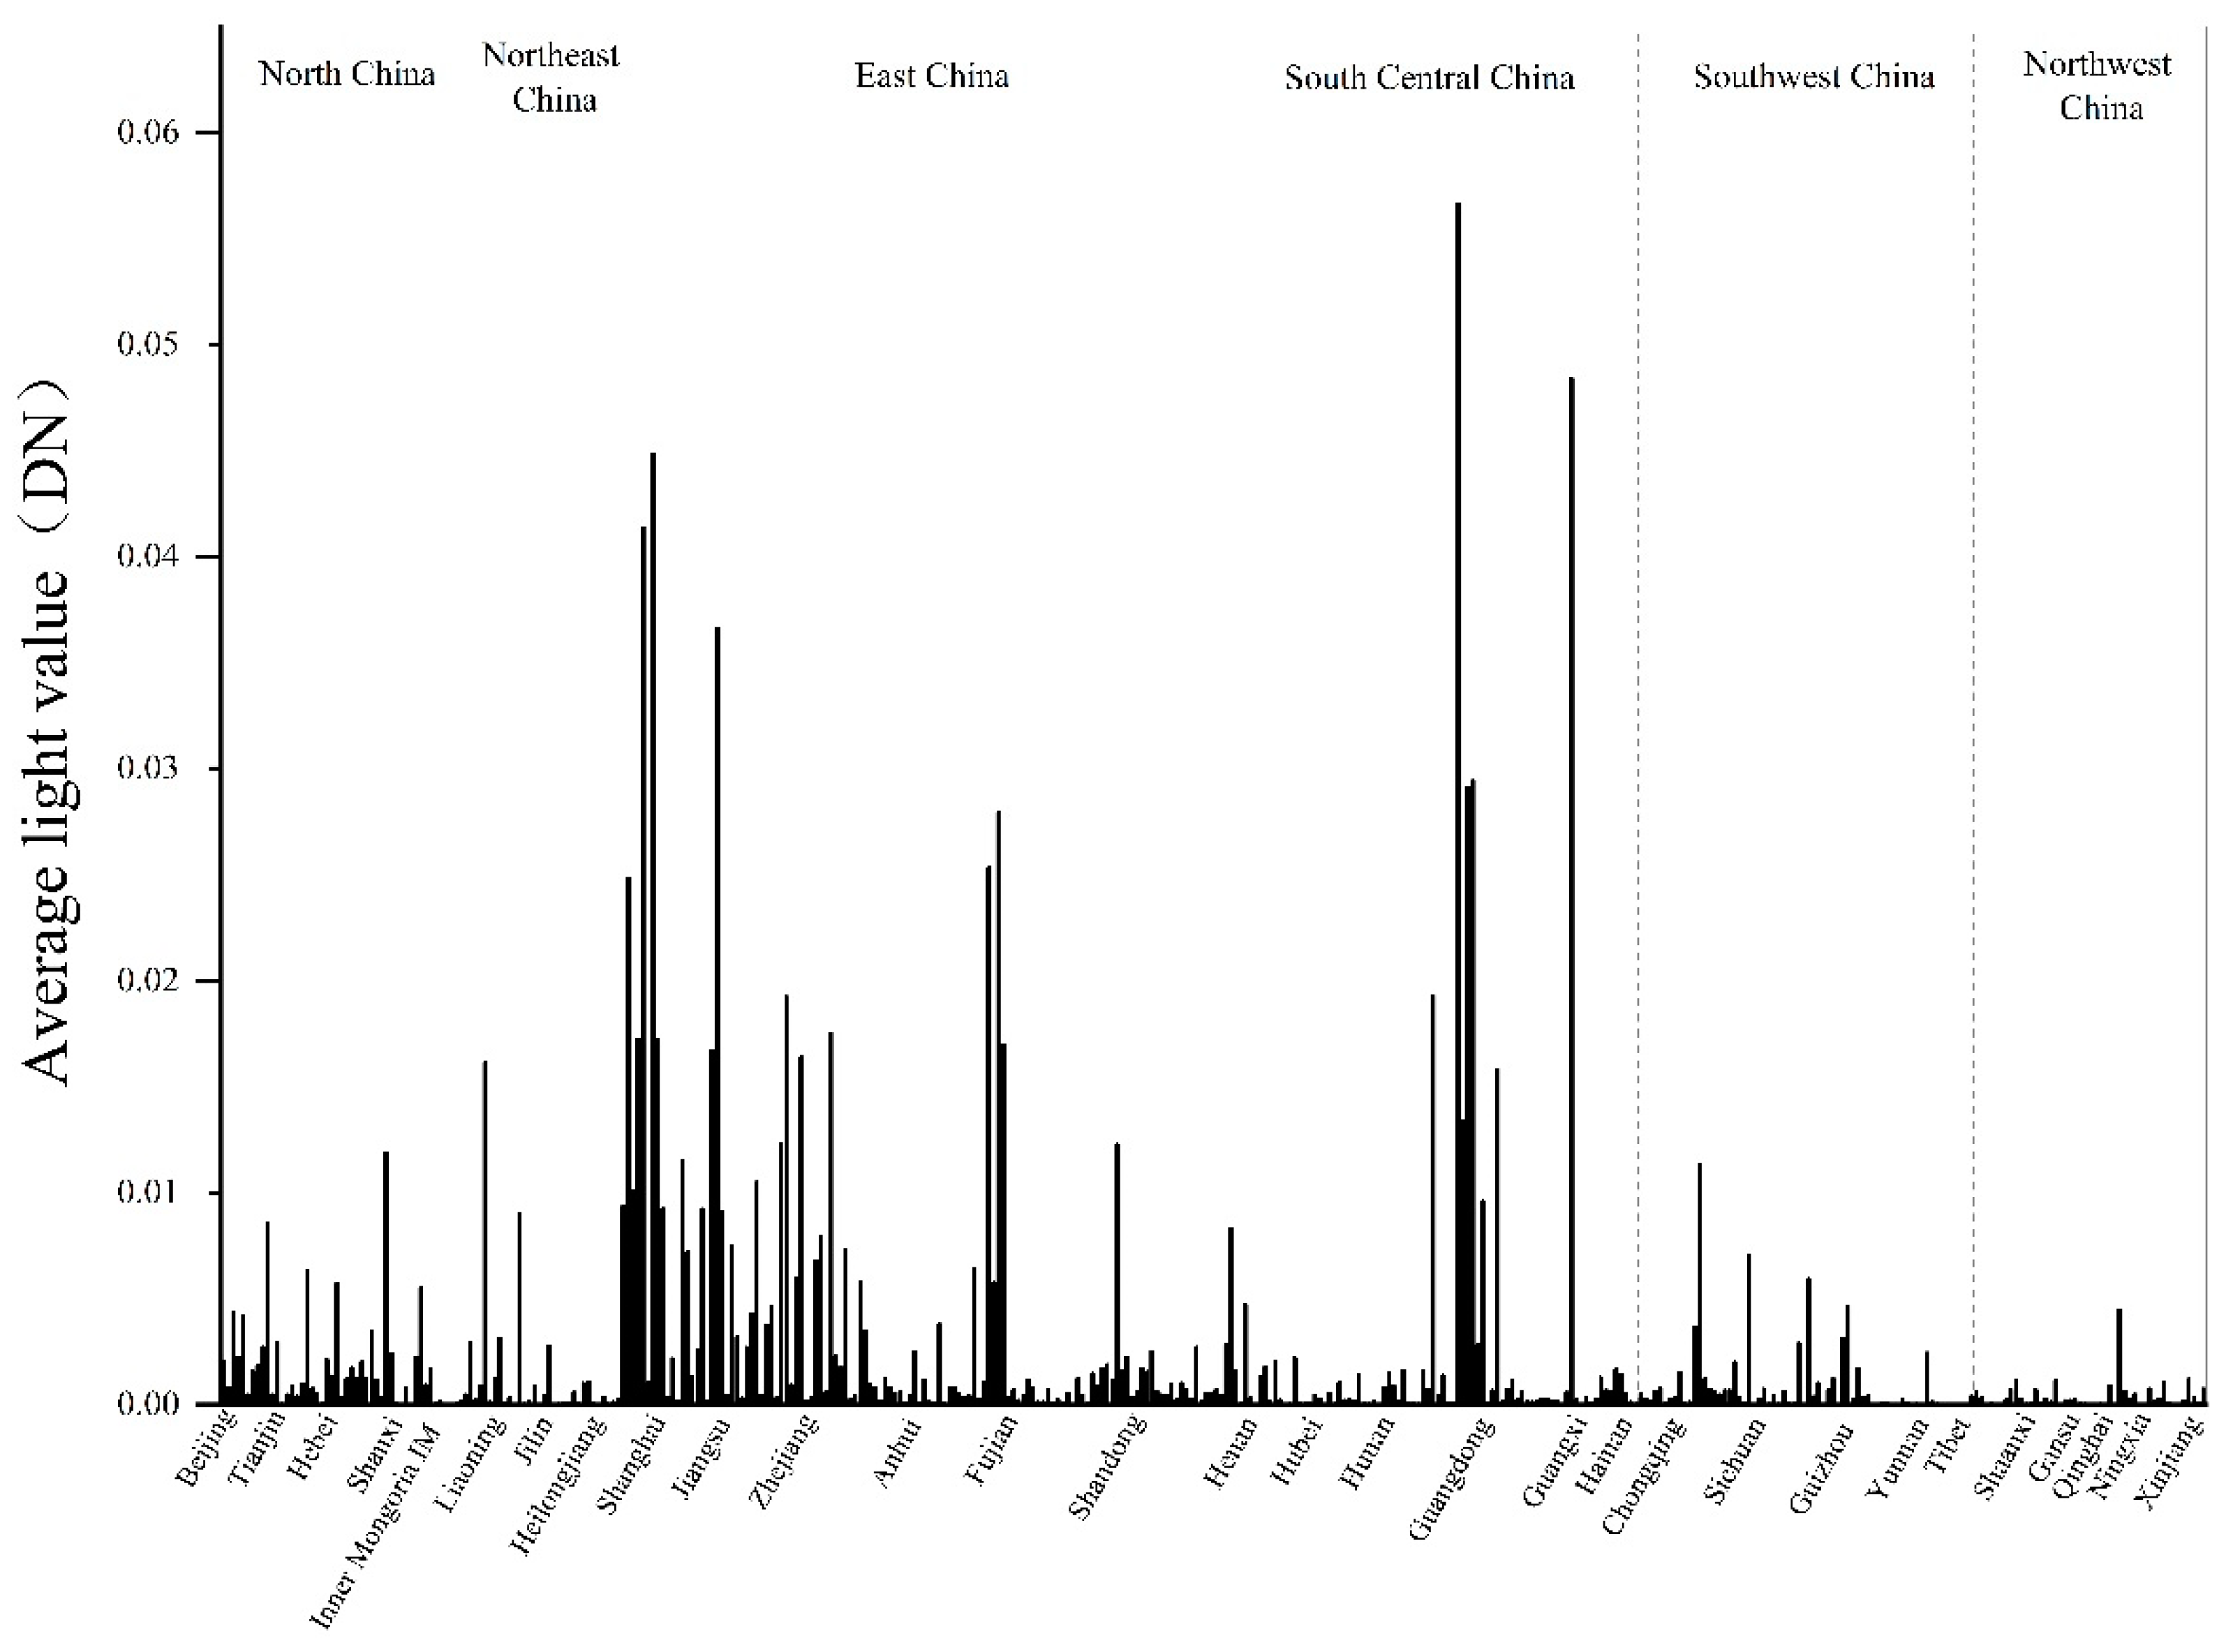
3.1. Current Situation of Town Vitality

According to the calculated average DN value of each town and the results of the classification of the vitality intensity level, the vitality intensity of Chinese characteristic towns varied significantly. The towns with the highest vitality intensity were Guzhen, Zhongshan City, and Guangdong Province (light density value 0.05665221), whereas the light density of Xin’an Town, Changde City, and Hunan Province was the lowest (0.00000186), with the difference between the two being approximately 30,458×. The difference in the intensity of vitality reflects the result of the combined effect of various factors, such as the level of economic development, location advantages, and tourism resources of different towns.
In addition, the overall vitality of Chinese characteristic towns was low. Among the 402 towns, the number of towns with medium, high, and highest vitality was 42, accounting for only approximately 1/10th of all the characteristic towns. Except for the above 42 towns, the remaining towns fell in the category of low vitality, and 360 towns had low grades, the number of which was more than 90% of the total number of Chinese characteristic towns.

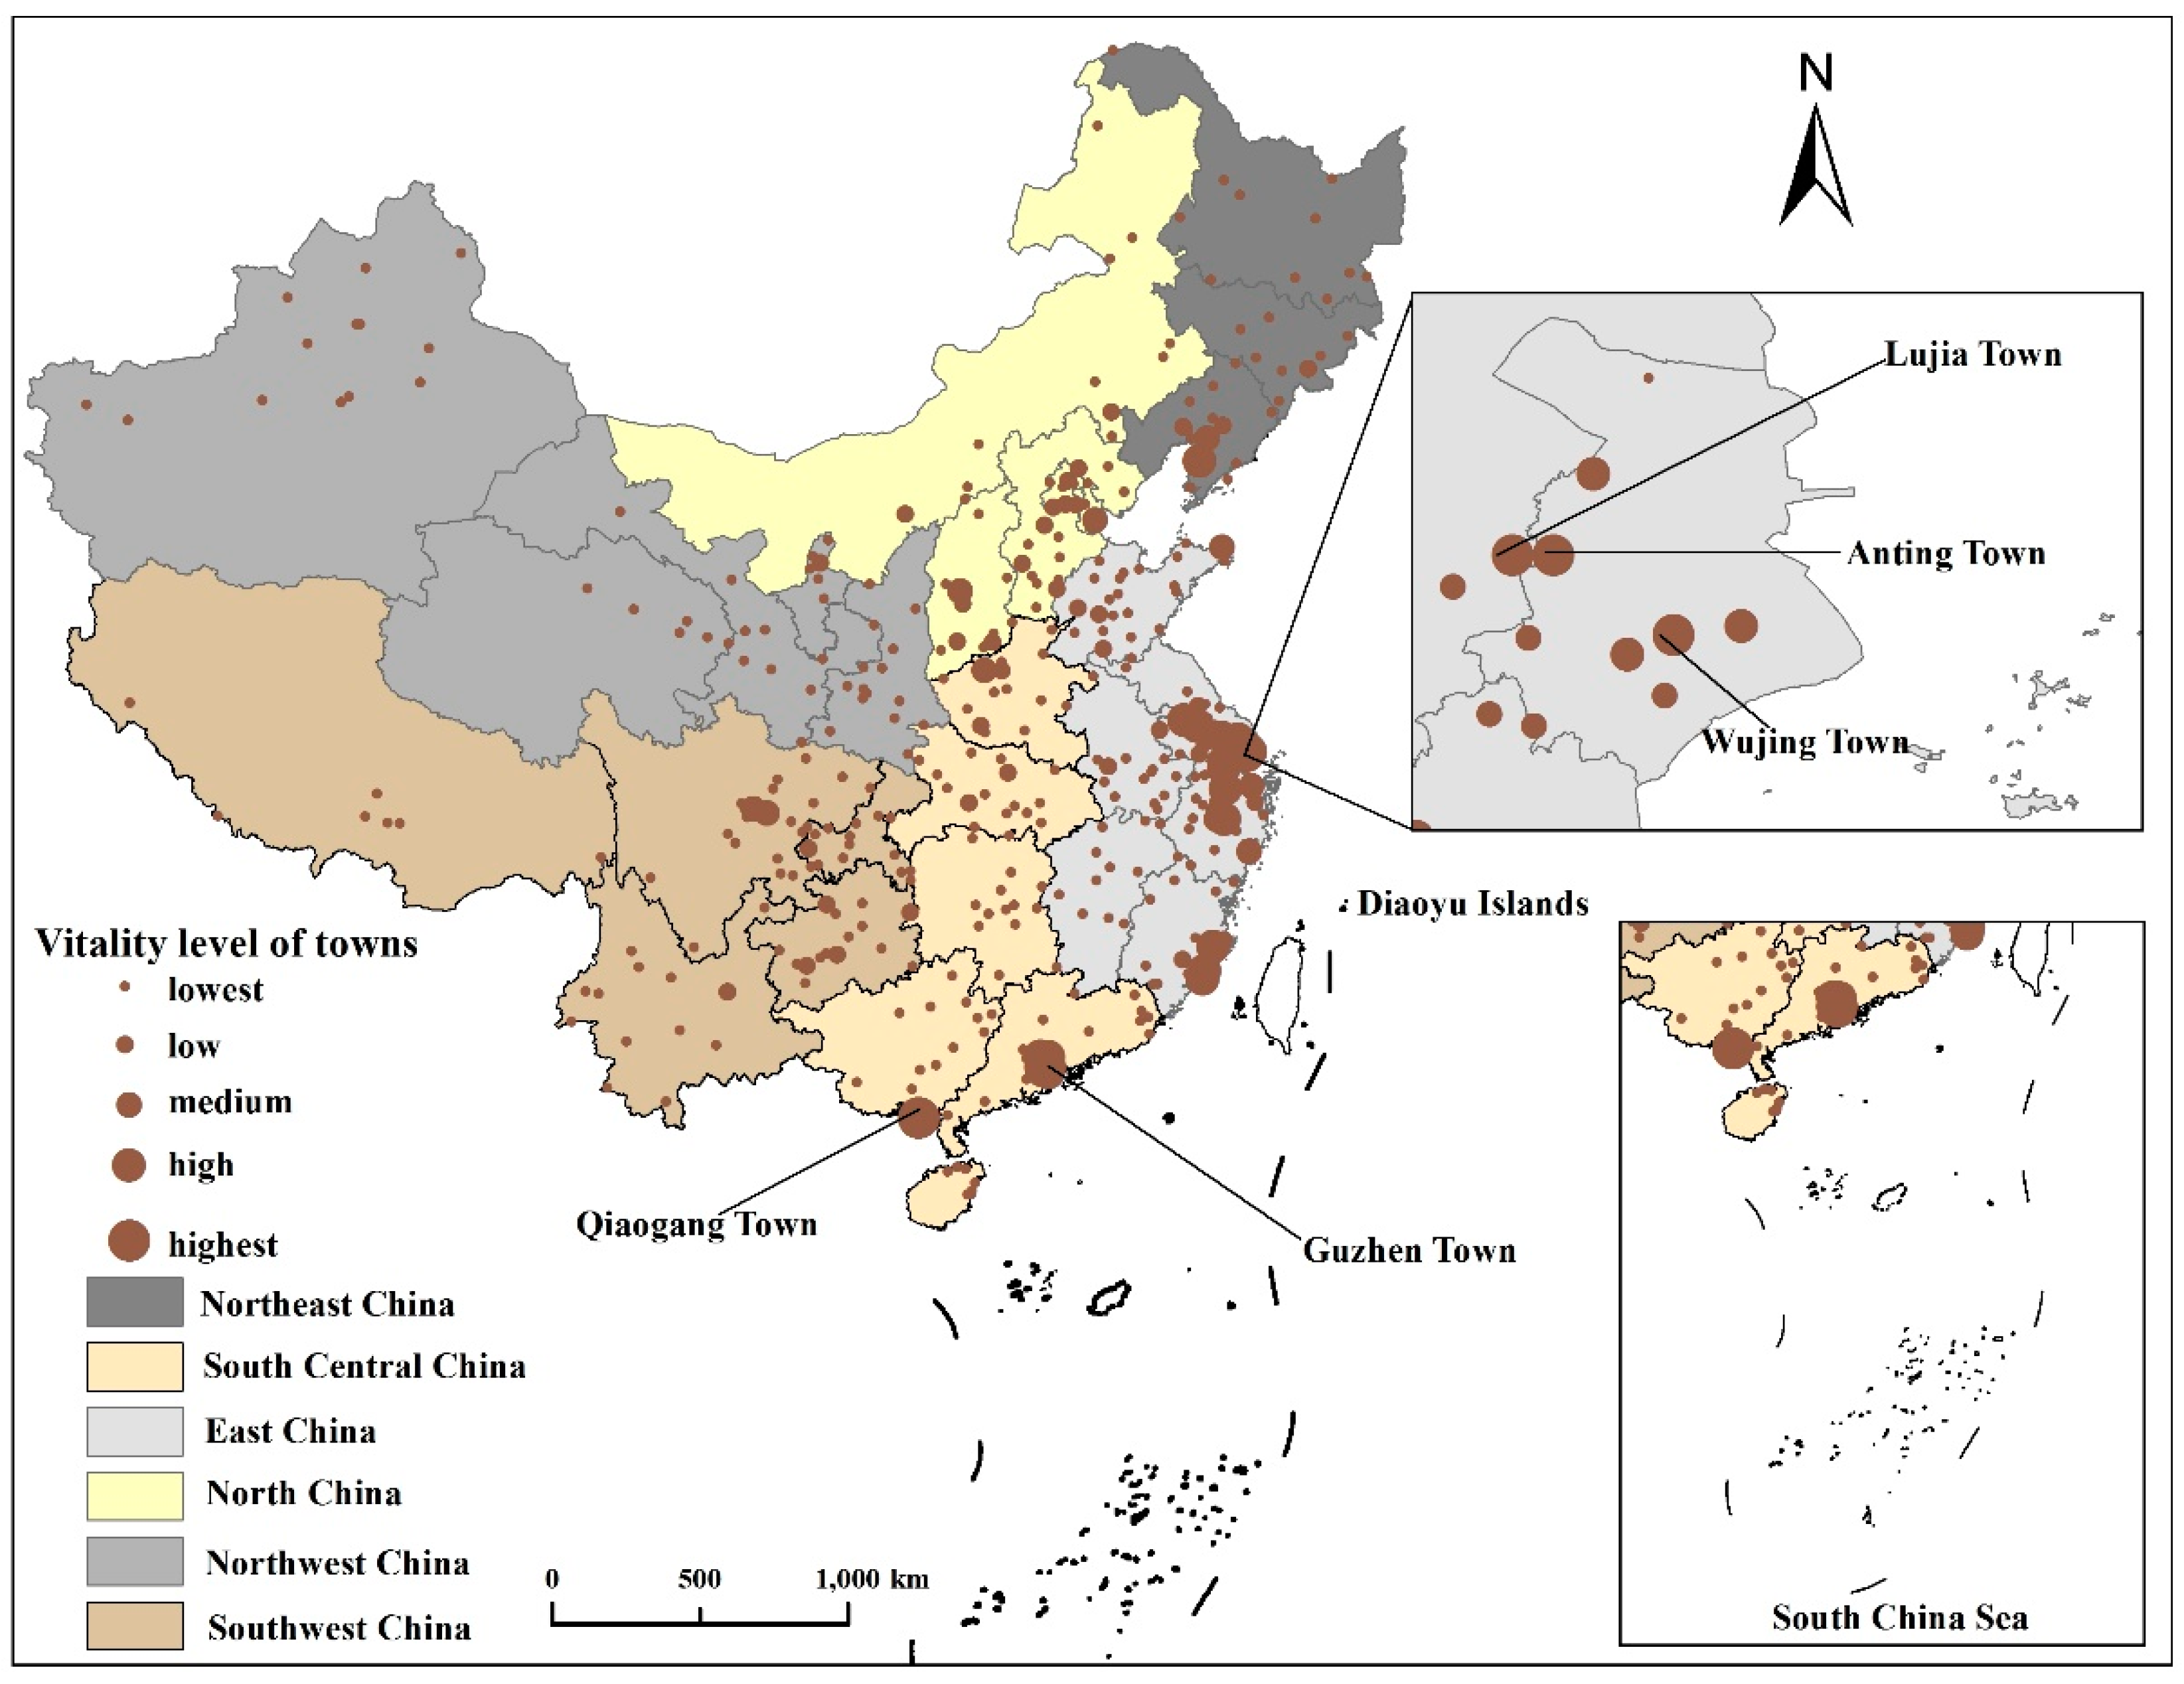
3.2. Spatial Distribution Characteristics

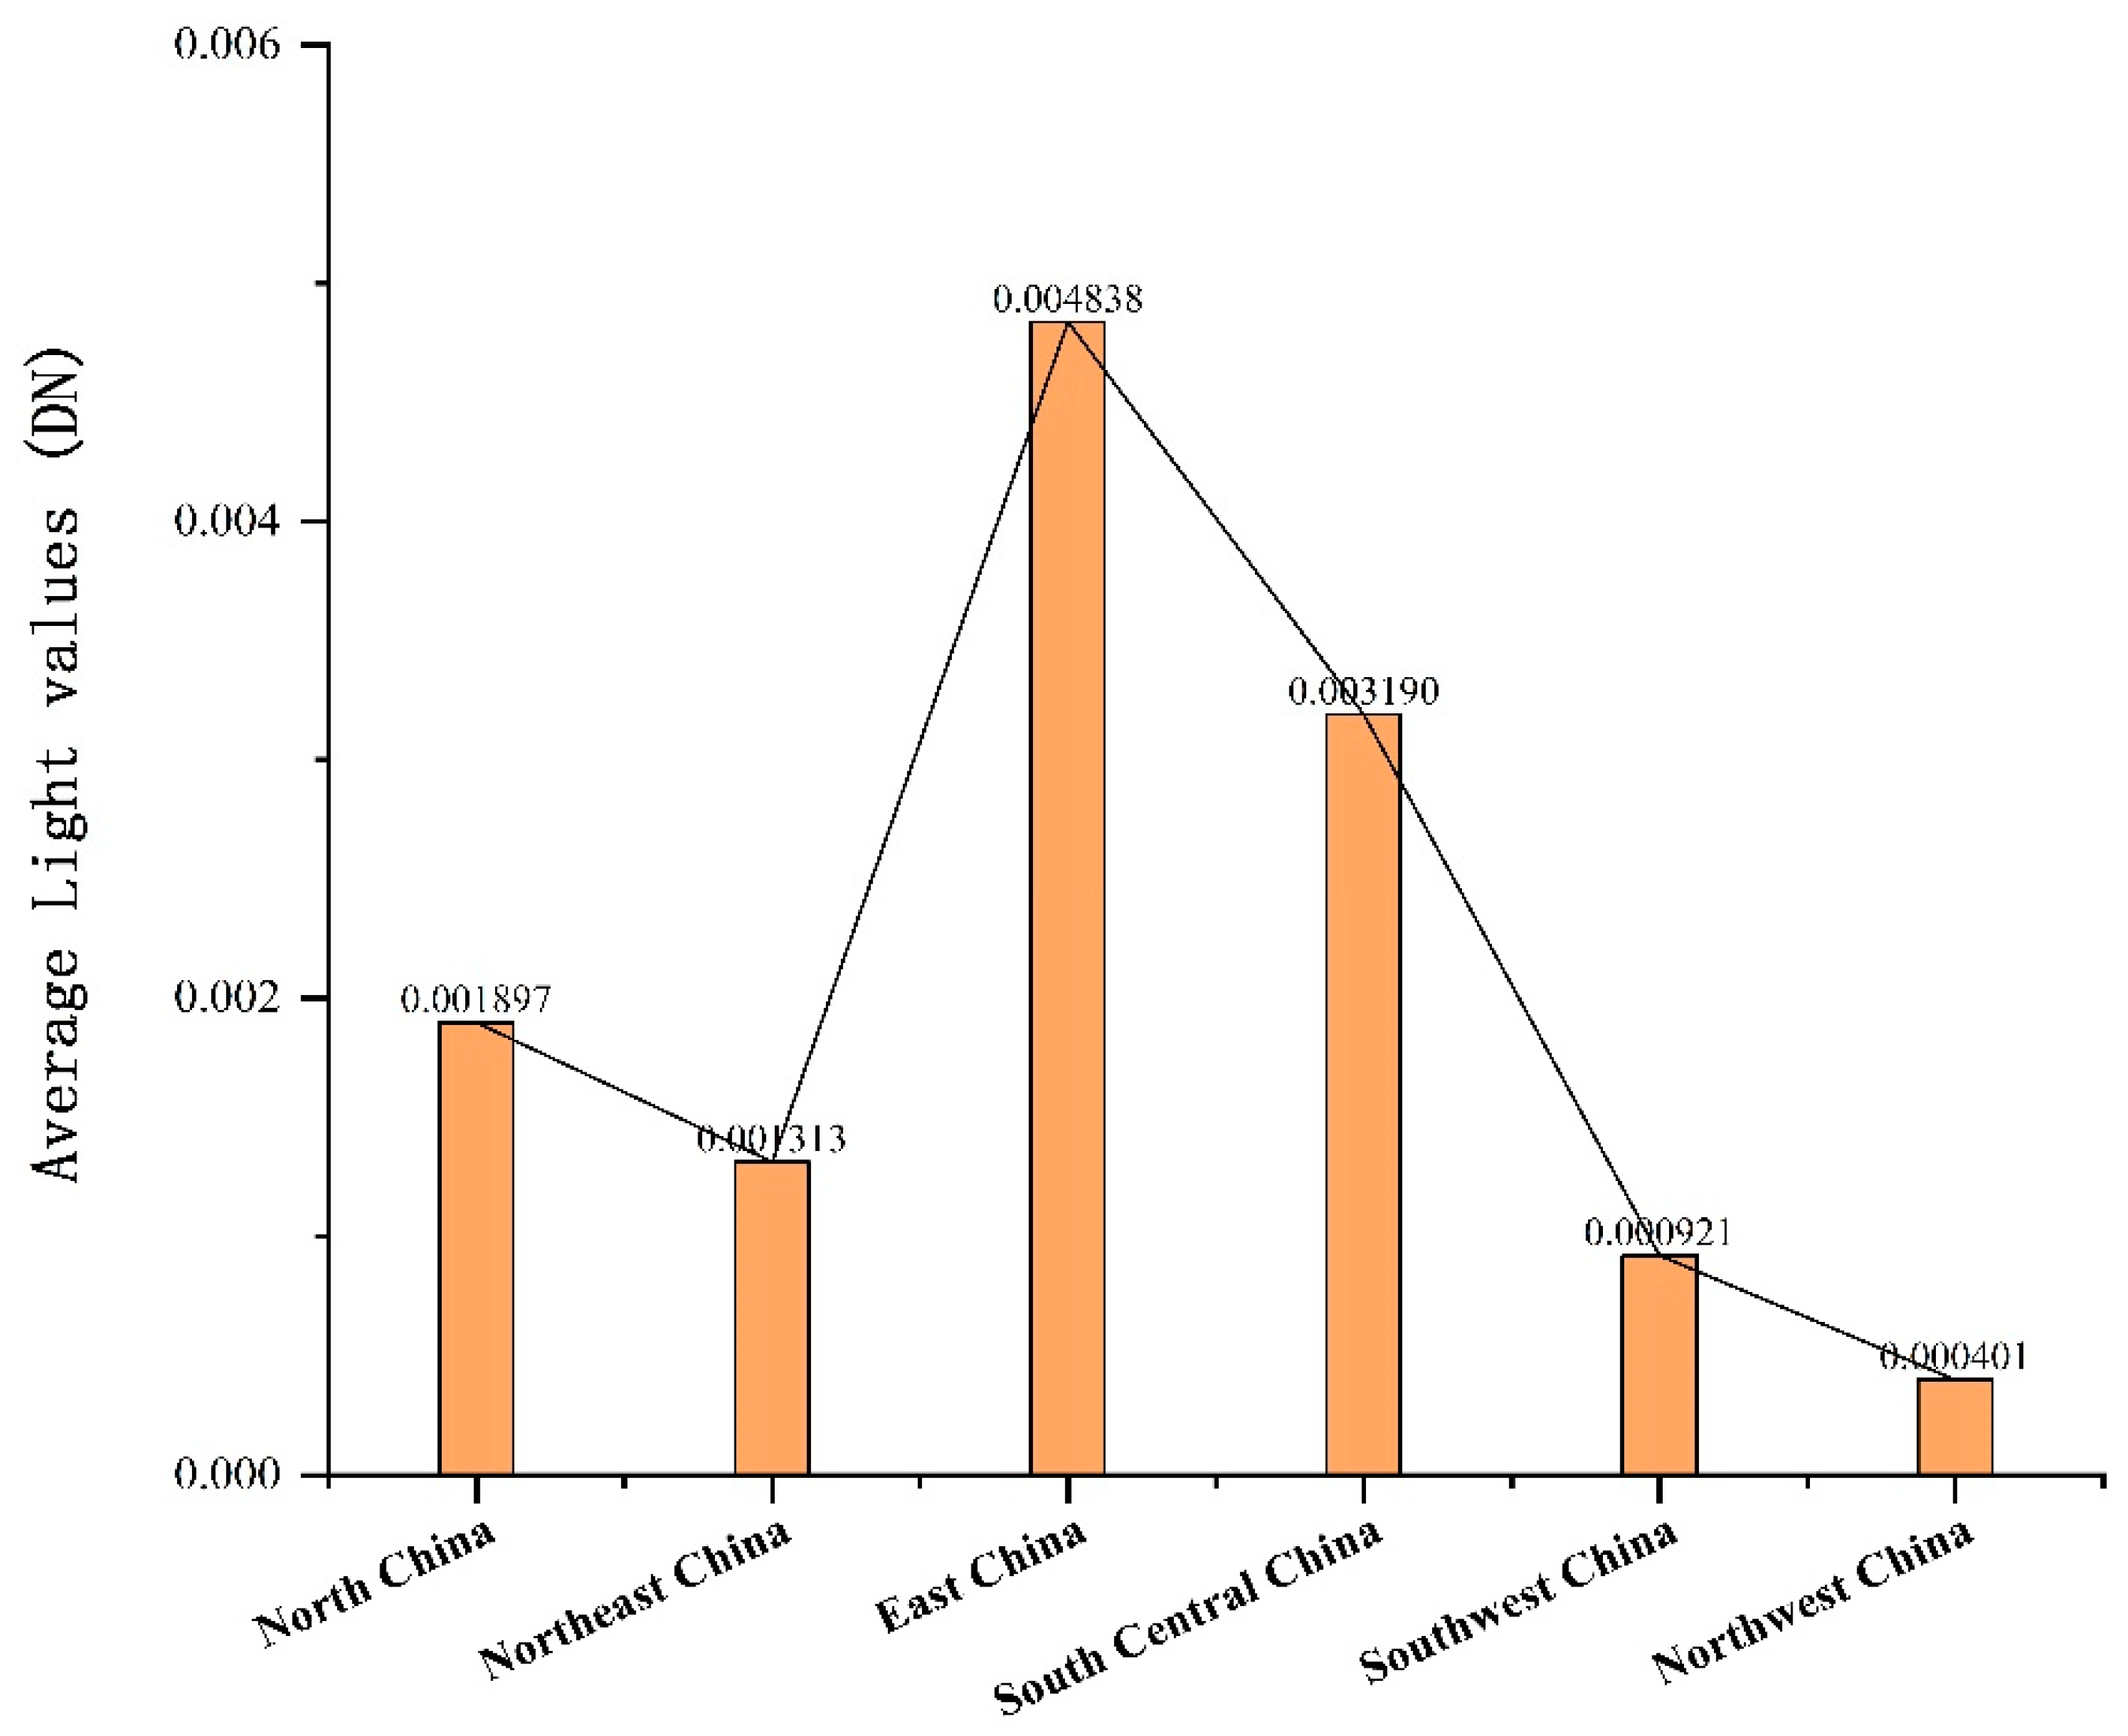
3.2.1. Overall Spatial Pattern

The overall spatial pattern of the vitality of Chinese special towns is shown in Figure 2. The towns with a high level of vitality were primarily clustered in the economically developed coastal areas, mostly concentrated in the two major regions of east and south China, the Yangtze River Delta and Pearl River Delta being the most evident ones. The light density of small towns in the central and western regions was lower, and their vitality was generally low to medium; the vitality of small towns gradually decreased from the southeast coast to the northwest inland regions. This reveals vitality’s relatively similar spatial characteristics with China’s population density and economic development level.
The towns with the highest ranking of vitality intensity included Guzhen Town, Qiaogang Town, Wujing Town, Anting Town, and Lujia Town. All of these towns are located in the economically developed and densely populated coastal areas. whereas the characteristic towns in some extensive and sparsely populated areas, such as Kashgar in northwest China, Hulunbeier in north China, and Ali in southwest China, had low average light values because of their relatively backward economic development and vast land area.

3.2.2. Local Spatial Pattern

Figure 3 presents a comparison of the vitality values of the six geographic regions in China. Two regions, east China and south-central China, had high values of vitality, and Shanghai, Guangdong, Fujian, Jiangsu, and Zhejiang were more evident in displaying these results. In contrast, the other four regions had a large gap between east and south-central China, and the spatial distribution of the vitality was uneven.
In addition, by calculating the average DN value of each region (Table 3, Figure 4), the lighting density ranking of each region, from high to low, was as follows: east China, south-central China, north China, northeast China, southwest China, and northwest China. The region with the highest activity was east China, with an average light density value of 0.004838, followed by south-central China with a value of 0.003190. North China and northeast China had overall medium activity, whereas southwest and northwest China had a large gap compared to the above regions, ranked at the end of the position. Based on Figure 2 and Figure 3, the overall light brightness distribution of Chinese characteristic towns displayed the strongest spatial pattern in the east, followed by the central regions. The weakest vitality was noted in the west, which is roughly consistent with the distribution patterns of China’s population density or GDP.

3.3. Spatial Analysis of the Vitality of Chinese Characteristic Towns

3.3.1. Global Spatial Autocorrelation Analysis

Based on the average DN values of the 402 Chinese characteristic towns, a global correlation analysis was performed using the ArcGIS software. Table 4 shows the Moran’s I index, p-value, and Z-score. The Moran’s I index was positive, the p-value of Moran’s I index test was <0.01, and the Z-score was >2.58, indicating a more significant positive spatial correlation among the towns. Thus, the vitality level of each town was significantly influenced by the neighboring towns.

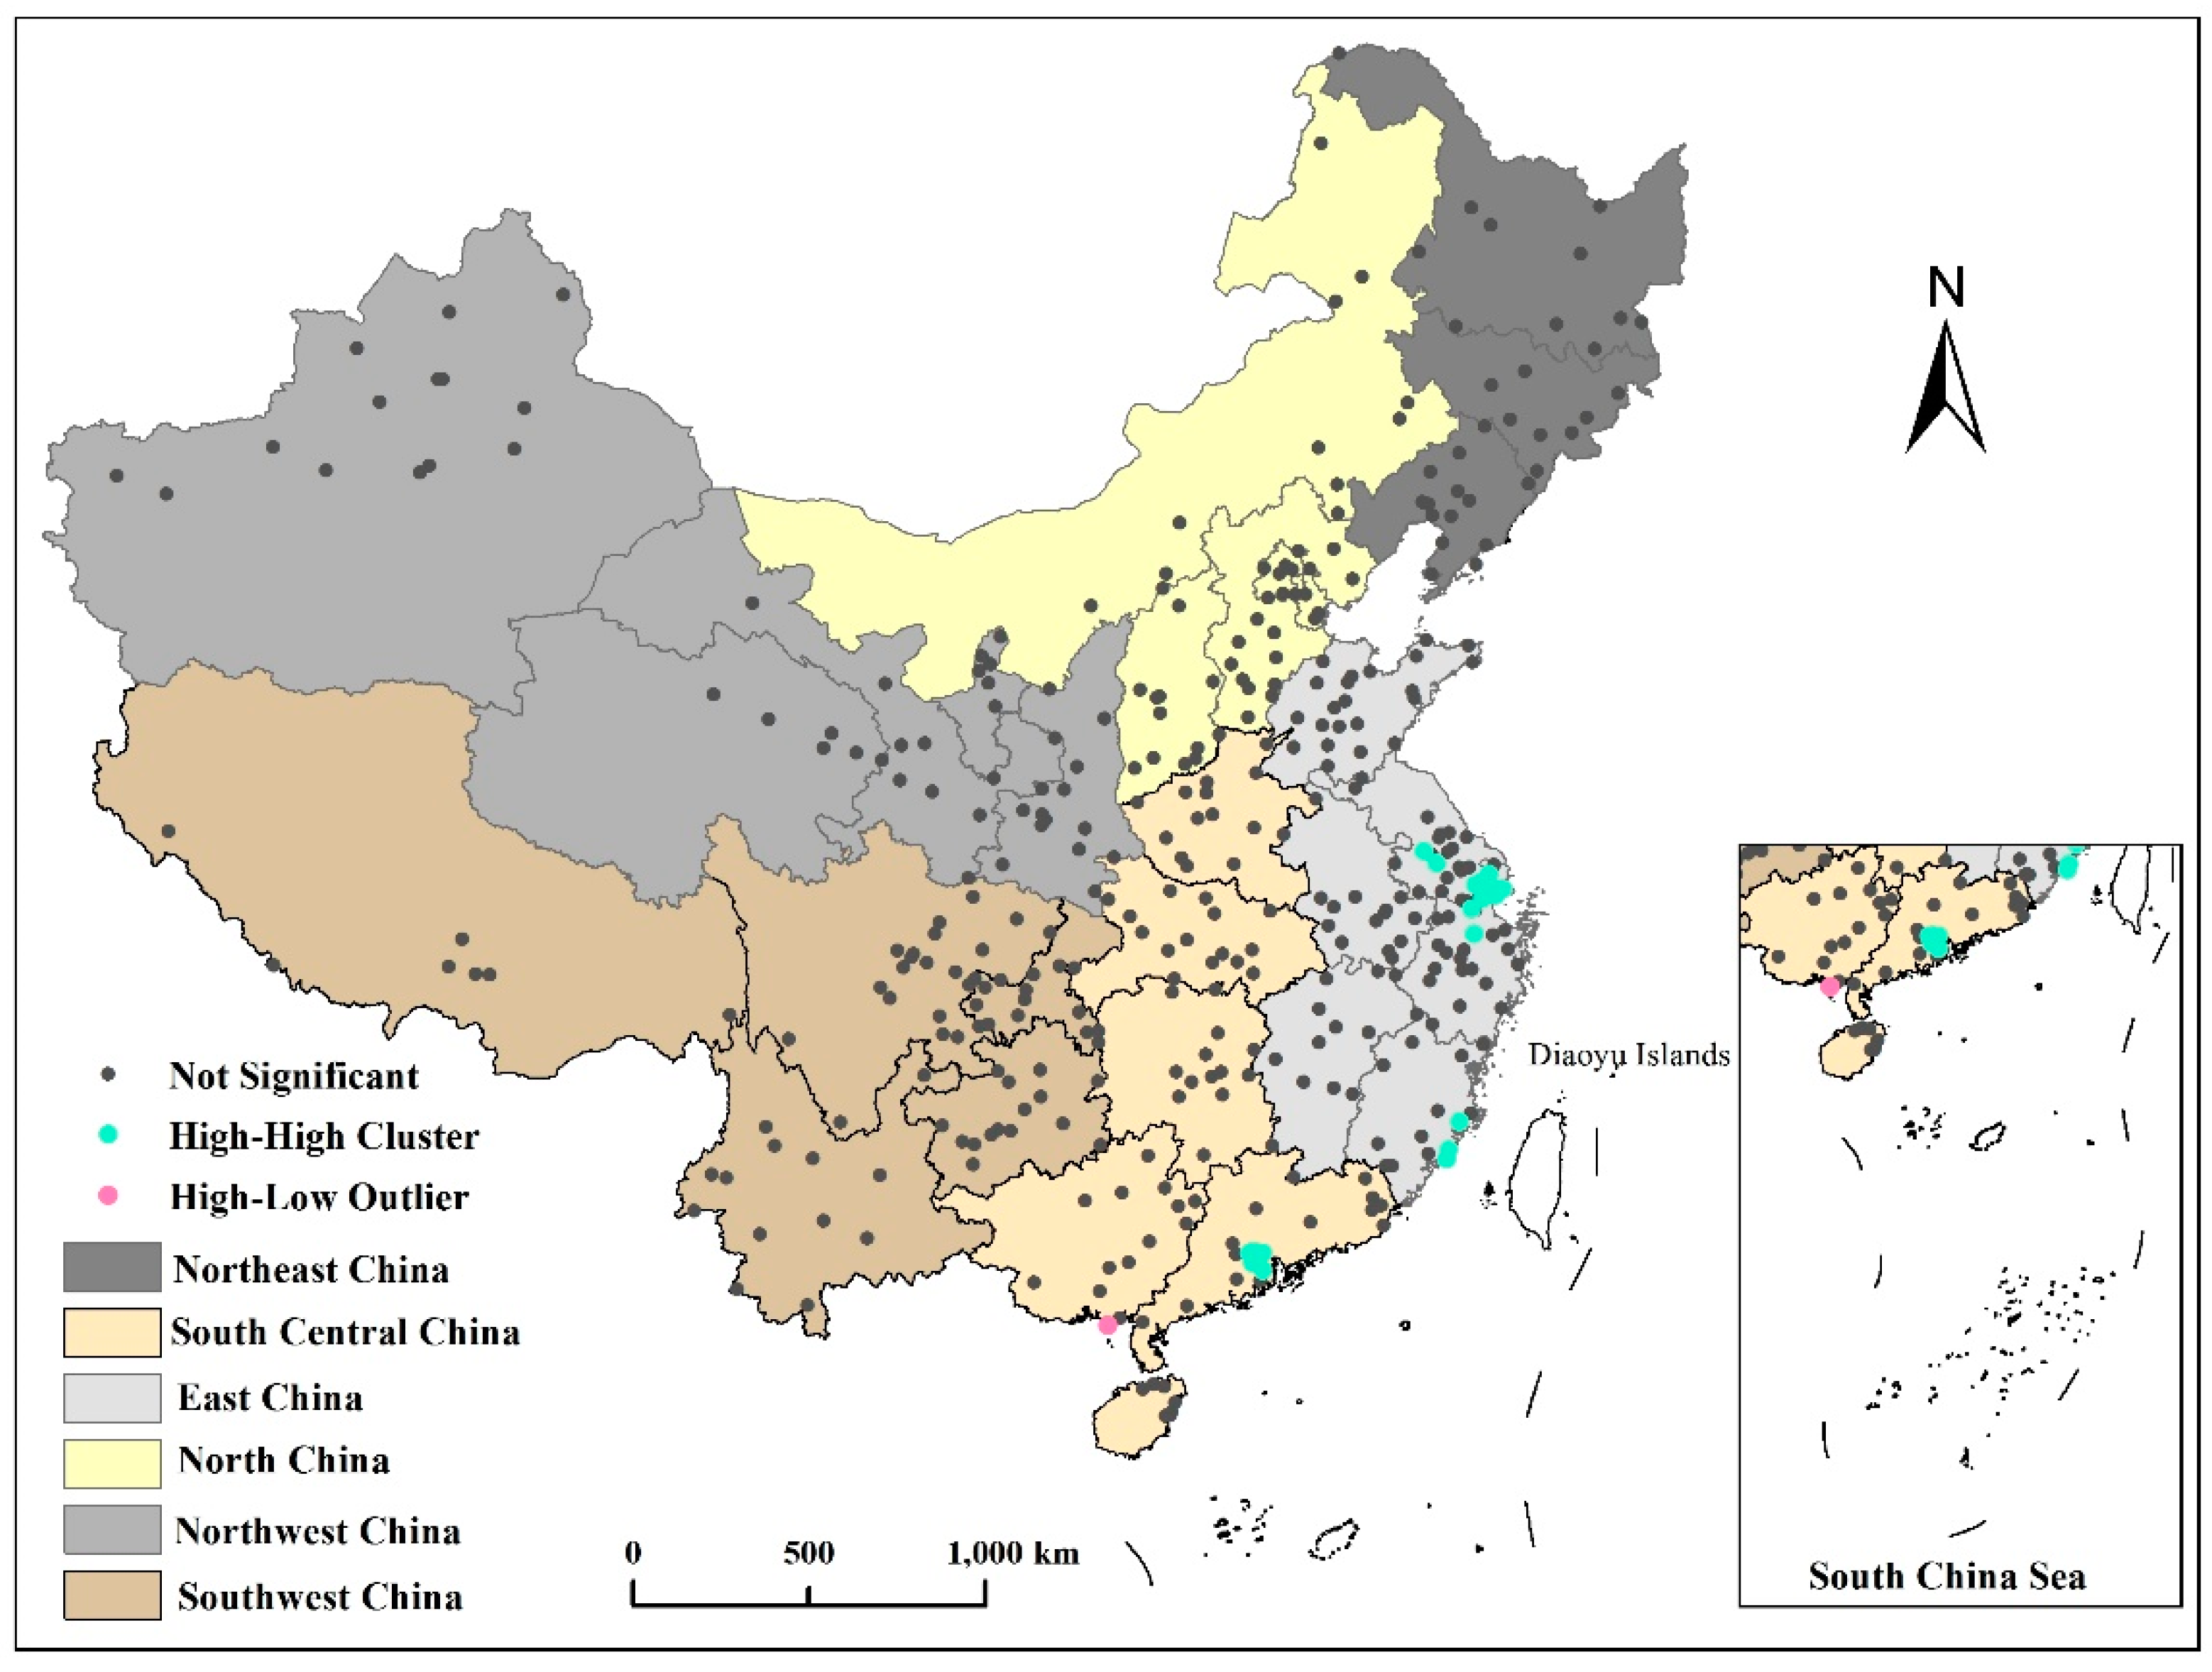
3.3.2. Local Space Autocorrelation Analysis

The Global Moran’s I index measures the presence of clustering or an outlier of the vitality of Chinese characteristic towns, i.e., the overall spatial correlation, but does not reveal where the clustering or anomalies occur. Therefore, local spatial autocorrelation analysis was used to explore the local distribution characteristics of town vitality. Table 5 and Figure 5 present the detailed results.
In terms of distribution characteristics, the “high–high” agglomerations were primarily located in east and south-central China, including the Yangtze River Delta, the Pearl River Delta, and the coastal areas of Fujian. These areas were characterized by high town vitality and were surrounded by areas with high town vitality. Geographically, the districts located in the “high–high” agglomeration are adjacent to each other, forming a mutually supportive linkage area that reflects a clear spatial diffusion effect. The only town in the “high–low” agglomeration was Qiaogang, Guangxi, which has a high level of vitality but is surrounded by towns with relatively low levels of vitality. The remaining towns showed insignificant clustering with no “low–high” and “low–low” types.

3.4. Analysis of the Drivers of High-Vitality Towns

The difference between the towns with the highest and lowest vitality was 30,458×. It is important to recognize the gap between the towns and understand the development status of the towns with high vitality to provide reference for the towns with low vitality and promote the coordinated and sustainable development of China’s new urbanization. The top five towns in the ranking of the 402 Chinese characteristic towns in terms of vitality were Guzhen, Qiaogang, Anting, Wujing, and Lujia, which belong to the first echelon of vitality ranking and are geographically located in eastern and southern central China on the southeast coast of China (marked in Figure 2). Guzhen Town, Guangdong, has a high level of economic development, with a public revenue of USD 129.38 million in 2018, 12,690 industrial enterprises under its jurisdiction, an active individual and private economy, accounting for >95% of the total economy, and 155 stores or supermarkets with an area of >50 m2 in its 52 km2 jurisdiction. This reflects the strong purchasing power of its residents. The lighting industry is the pillar industry of Guzhen, and lighting products are sold both locally and abroad. Guzhen is known as the “lighting capital of China”, with an average DN value of 0.05665, ranking first among all towns. Shanghai is one of the cities with the highest level of economic development in China, all the towns under its jurisdiction have exhibited a high level of vitality. Anting Town and Wujing Town, despite their administrative division as town-level units, have been influenced by the extremely strong radiation of Shanghai, and their industries and infrastructure are comparable to some small cities in China. Furthermore, the town has industrial parks that meet its own development characteristics. In Anting Town, for example, there were 222 industrial enterprises under its jurisdiction in 2018, and the annual main business revenue of each enterprise exceeded USD 3 million; therefore, the level of vitality was high. In addition, it could be observed that Anting and Wujing towns can, respectively, rank only third and fourth due to the industrial specificity of Guzhen town and the historical heritage of Qiaogang town. However, among the nine Chinese characteristic towns in Shanghai, eight towns, except Dongping town, rank among the top 30 out of the 402 towns, which signifies an obvious positive correlation between economic development and the town vitality level. The Suzhou Kunshan perennial ranking of China’s top 100 counties can be described as China’s richest county-level cities, its per capita public revenue being even higher than that of most first-tier cities in China. Lujia Town is located in this region, and depending on “Goodbaby”, a pregnancy and infant enterprise, the town will become a well-known “children’s town” both nationally and internationally. Notably, Guangxi is a province with an overall low level of vitality, but the town of Qiaogang shows an extremely high level of vitality. Due to its historical inheritance, Qiaogang was especially established by the state to settle the Chinese citizens that returned from overseas. Despite its small area of only approximately 2 km2, it has a high level of economic development, an extremely efficient GDP output, with a gross regional product close to USD 47 million, and a busy nighttime economic activity, making it rank second among all towns.
From a comprehensive perspective, the top-ranked towns in terms of vitality have the following similarities: They are located in China’s southeastern coastal region, and they have favorable geographical locations, convenient transportation conditions, profound historical heritage or cultural accumulation, large number of industrial enterprises, and complete industrial structure. Further, their development models and construction experience can provide some reference for towns with lower vitality.

4. Discussion

4.1. Night Lighting Data Perspective of Town Vitality

This study used lighting image data to preliminarily explore the vitality of characteristic towns. Previous studies revealed that traditionally, the most common method for evaluating the vitality of a region is to characterize the vitality of a town by constructing an index evaluation system using statistical data [73,74,75]. This approach makes it convenient to obtain data and calculate and compare the results, but the method is limited by the accuracy of statistical data and the evaluation results lack objectivity. Moreover, each researcher has a different understanding of vitality and will choose to construct a different evaluation system based on different perceptions; therefore, different scholars may obtain different results. With the continuous progress of science and technology, some scholars have made a series of innovations from the research perspective [42,50,51,52], data sources [27,28,44,45,46], research space [34,35], and research methods [54] of vitality. The research results have been enriched and the vitality research system has been improved. Based on previous research, this study developed an innovative method by not constructing an index evaluation system to characterize the specific vitality value of each town. However, it used the nighttime lighting data as a reference, established a numerical relationship between nighttime lighting and the area of each town, adopted the method of the ratio of the DN value of the nighttime lighting of the town and the area, and obtained the lighting density value of each town. Additionally, based on the natural interruption point grading method, it determined the lighting density of 402 towns. The light density of the 402 towns was classified according to the natural intermittent point grading method, which made the difference in town light intensity clear and intuitive.
Nighttime lighting data have been widely used in the fields of urban spatial structure analysis, urban habitat environment, socioeconomic index estimation, and public safety, specifically in the identification of urban built-up areas [76], urban expansion [77,78] and urban contraction [79] during urbanization, urban wind, and thermal environments [80], GDP estimation [81], population estimation [82], tourism activities [83], poverty identification [84], carbon emissions [85], and energy consumption [86]. Scholars have achieved enhanced research results in increased macroscopic spatial scale perspectives, such as cities and countries; however, they are limited by the accuracy of spatial resolution, which makes it difficult to engage in small-scale research from a microscopic perspective. Among the results of studies using nighttime light data for urban vitality [24,55,56], despite their respective unique research contributions, DMSP-OLS and NPP-VIIS nighttime light data were used, which still have limitations in the accuracy of spatial resolution. The data used in this study were nighttime light images of Luojia1-01, the spatial resolution of which was approximately 130 m, and their accuracy was considerably higher than that of DMSP-OLS and NPP-VIIS, thereby making it possible to study nighttime light remote sensing data at a more refined town-scale. Research on the vitality of the characteristic town in this study confirmed the feasibility of using the nighttime lighting data of Luojia1-01 for town-scale research. In addition, ever since DMSP-OLS and NPP-VIIS nighttime light remote sensing data were released, these data have been widely researched in various fields and have yielded fruitful results. By providing nighttime light data with a high resolution and better quality, Luojia1-01 can accordingly facilitate research studies in many of the fields mentioned above, and it is believed that more accurate research results could be obtained.

4.2. Limitations

Although this paper innovatively conducted a study on the town’s vitality level by combining the nighttime lighting data of Luojia1-01, there are still some limitations to this study. First, because of the generally high summer temperature in China, all places can perform nighttime economic activities, and the town is relatively active at this time; in winter, the northern regions are affected, the nighttime economic activities are weaker, and the difference in nighttime economic activity between the south and the north is significant at this time. To avoid the influence of this seasonal difference, the nighttime light images selected in this study included all the imaging data captured between July and August 2018, to assist in the evaluation of the difference in town vitality intensity in different spaces during the same season. Nevertheless, weather conditions vary from place to place in the same season, and cloudy and rainy weather, among others, may influence the calculation results. In this study, we intended to use the nighttime light images of Luojia1-01 under weather conditions of <5% cloud cover, but these conditions could not be acquired via screening on the official website of Luojia1-01; we could only select image data with better quality by visual interpretation. This may have had some influence on the calculation results. Second, the updated official data of Luojia1-01 has a certain lag, with an average lag time of approximately 2 years, and the imaging data selected in this study were from 2018. This may have affected the suitability of this study. Moreover, Luojia1-01 temporarily cannot provide data on long time series, which is not conducive to the study of vitality intensity changes, from an evolutionary perspective. On the other hand, DMSP-OLS and NPP-VIIS nighttime light remote sensing data include long-term data despite their low resolution. From this perspective, Luojia1-01 is at a disadvantageous position. In addition, although Luojia1-01 is already the most accurate night light remote sensing satellite available, its resolution of 130 m still has certain limitations in conducting research in a smaller area, town, or at an even finer scale.
In the future, we will further improve research on the vitality intensity of characteristic towns in response to these limitations. First, we will develop the means of acquiring research data, combining multiple sources of data, such as Luojia1-01 nighttime light images and other large data, to provide more reliable data support for the research. Second, we will use the updated Luojia-1 nighttime light data to conduct research on the vitality of characteristic towns from the perspective of temporal evolution. In addition, we will further evaluate the interactions between the development of characteristic towns and the society, economy, and environment; provide scientific suggestions for the coordination of environmental protection and economic development of characteristic towns; and improve the research result system of the characteristic town in China.

5. Conclusions

After 2016, the Chinese government supported the development of characteristic towns, and the enthusiasm of local applications for the establishment of national characteristic towns escalated. A total of 403 national characteristic towns were established during 2016–2017. Owing to policy support, the development and construction of characteristic towns around the world are faced with problems such as insufficient development planning, disorderly expansion of town space, imperfect support, lack of distinctive characteristics, insufficient development momentum, and lack of vitality. This calls for a review and reflection on the development effectiveness of characteristic towns. The present study analyzes the spatial differences and factors influencing the vitality of national characteristic towns from the perspective of town vitality and provides new perspectives and methods for the study of Chinese characteristic towns, besides providing decision-making references for their further development and construction. The research content of this study was formulated with attention to the spatial attributes of small towns, which are of guiding significance for the development of small towns in various regions, in the context of the vast size of China and the drastic variation in development in different regions.
In this study, we used the professional nighttime light remote sensing satellite data of Luojia1-01 with higher accuracy. We used the ArcMap raster calculator tool to convert the brightness and superimpose the total amount of lights and area of each town. We also used the calculated average light value to characterize the vitality of the town, which proved that the 130-m resolution of the Luojia1-01 nighttime light data was feasible for evaluating town vitality. The following conclusions could be made:
(1) The difference in the vitality level of the Chinese characteristic towns was significant. The average light density value of Guzhen Town in Zhongshan City, which has the highest vitality level, was 0.05665221. The lowest light density was noted in Xin’an Town in Changde, Hunan Province, with a level of 0.00000186, yielding a 30,458× difference. In addition, the overall level of vitality intensity of the Chinese characteristic towns was low, with 42 towns having medium-to-high levels of vitality intensity, accounting for only approximately 1/10th of all the characteristic towns, whereas 360 towns had low levels of vitality intensity.
(2) The spatial pattern of the highest vitality was observed in the eastern part, followed by the central part, and the lowest vitality was noted in the western part of China. The average light density of the characteristic towns in east China was 0.004838, and the average light density in south-central China was 0.003190, both of which were high. In contrast, the average light densities of the towns in northwest China and southwest China were 0.000401 and 0.000921, respectively, which were low and demonstrated the uneven spatial distribution of vitality.
(3) The results of the spatial correlation analysis showed that the vitality of the Chinese characteristic towns showed a more significant positive spatial correlation, and the town vitality was influenced by the surrounding areas. The “high–high” agglomerations were primarily located in the Yangtze River Delta, Pearl River Delta, and Fujian coastal areas in east and south-central China. These areas were characterized and surrounded by towns with high vitality. Only “high–low” agglomerations were observed in Qiaogang Town, Guangxi, which had a high level of vitality but was surrounded by towns with a relatively low vitality; the remaining towns showed insignificant clustering.
(4) The driving forces of the towns with higher vitality had high similarity; they were towns with a superior geographical location, high levels of economic development, rich tourism resources, long historical heritage, and rich cultural deposits. In addition to having a larger number of industrial enterprises and a more complete industrial structure, their construction experience could provide some reference for towns with lower vitality.
In summary, the nighttime light density and the regional economic development level showed a more significant positive correlation; hence, with the help of nighttime light data, the economic development of an area can be measured in terms of vitality, and these results can then be used to supplement some economic indicators. However, Liaojia1-01 lacks data of long time series, and unfortunately a temporal-spatial evolution study cannot be conducted for the time being. In the future, the latest images of the long time series will be combined to further analyze the spatial growth of vitality values and the changes of vitality.

Author Contributions

Y.Z. contributed to all aspects of this work; K.S. wrote the main manuscript text, Z.S. performed the experiments and analyzed the data, H.W. and X.L. provided modifications for this study. All authors have read and agreed to the published version of the manuscript.

Funding

This research was funded by Social Science Foundation of Liaoning Province (L21BJY028).

Institutional Review Board Statement

Not applicable.

Informed Consent Statement

Not applicable.

Data Availability Statement

The data in this article were mainly acquired from the High-resolution Earth Observation System Hubei Data and Application Center (http://59.175.109.173:8888/index.html) accessed on 10 September 2021, Water Meridian Micro Chart (http://www.rivermap.cn) accessed on 10 September 2021, and the Statistical Yearbook Sharing Platform (https://www.yearbookchina.com) accessed on 10 September 2021.

Acknowledgments

The author of this article thanks the School of Geography of Liaoning Normal University for their assistance in developing this research.

Conflicts of Interest

The authors declare no conflict of interest.

References

  1. He, B.; Zhao, D.; Xiong, K.; Qi, J.; Ulpiani, G.; Pignatta, G.; Prasad, D.; Jones, P. A framework for addressing urban heat challenges and associated adaptive behavior by the public and the issue of willingness to pay for heat resilient infrastructure in Chongqing, China. Sustain. Cities Soc. 2021, 75, 103361. [Google Scholar] [CrossRef]
  2. Huang, C.; Wu, W.; Hu, X. Development Paths of Characteristic Towns in Underdeveloped Areas in Central China-A Case Study of Yichun, Jiangxi. Asian Agric. Res. 2018, 10, 30–32. [Google Scholar] [CrossRef]
  3. Wu, Y.; Chen, Y.; Deng, X.; Hui, E.C.M. Development of characteristic towns in China. Habitat Int. 2018, 77, 21–31. [Google Scholar] [CrossRef]
  4. Bowen, C.; Zhenwei, P. Connotation and Path of Characteristic Development of Small Towns under Supply-Side Reform:Cases of the First Batch of Chinese Characteristic Small Towns in Yangtze River Delta Region. Urban Plan. Forum. 2018, 73–82. [Google Scholar] [CrossRef]
  5. Fu, X.; Jiang, Y. Discussion on the Development Model of Characteristic Towns in China from the Perspective of Embeddedness. China Soft Sci. 2017, 8, 102–111. [Google Scholar]
  6. Jifu, Z. The path and mode of charismatic small town construction--Take Datong city of Shanxi province for example. Chin. J. Agric. Resour. Reg. Plan. 2017, 38, 145–151. [Google Scholar] [CrossRef]
  7. Luo Xiang, S.J. Thoughts and Measures for Characteristic Town Planning From Supply-side Structural Reform Viewpoint. Planners 2017, 33, 38–43. [Google Scholar]
  8. Wang Boya, Z.C.C.Y. Reconsiderationon the Positioning and Function of Characteristic Towns: An important carrier for the integrated development of urbanand rural areas. J. Beijing Norm. Univ. (Soc. Sci.) 2020, 140–147. Available online: https://kns.cnki.net/kcms/detail/detail.aspx?dbcode=CJFD&dbname=CJFDLAST2020&filename=BJSF202001012&uniplatform=NZKPT&v=mHHseh397NWbN7OLu9vhd_imqZePAYSWb4EnQBAb6SqZM_lttlnDeemPZP4kpPKu (accessed on 6 December 2021).
  9. Dongmei, L.; Linfeng, Z.; Sainan, L.; Xi, Y.; Shemei, Z.; Fang, W. Study on the Formation Mechanism and Path Optimization of Agricultural Characteristic Towns—Case Analysis Based on Chengdu Model. China Soft Sci. 2018, 79–90. Available online: https://kns.cnki.net/kcms/detail/detail.aspx?dbcode=CJFD&dbname=CJFDLAST2018&filename=ZGRK201805008&uniplatform=NZKPT&v=XbsIuo4Cje9ZqeuEBFoF5y3vk1gp_B-oXaao2So8Ia9zQoeJcVStH0688nM0xI1l (accessed on 6 December 2021).
  10. Yizhou, W.; Qianhu, C.; Xiaohong, Z. Indices System and Evaluation Method of Characteristic Town Development. Planners 2016, 32, 123–127. [Google Scholar] [CrossRef]
  11. Chengxin, W. Research on Cultural Development of Characteristic Towns in China. World J. Soc. Sci. Res. 2017, 4, 237–242. [Google Scholar] [CrossRef] [Green Version]
  12. Hua, Z. Analysis on the Innovation and Exploration of the Tourist Characteristic Town. Econ. Probl. 2017, 104–107. [Google Scholar] [CrossRef]
  13. Li Xinjian, F.L.S.S. The Endogenous Development and Path of Tourism Characteristic Towns. Tour. Trib. 2018, 33, 7–9. [Google Scholar] [CrossRef]
  14. Fang, H.; Jiancheng, L. A research on features of characteristic towns in Hangzhou. Urban Plan. Forum 2017, 78–84. [Google Scholar] [CrossRef]
  15. Pei, L.; Jinhe, Z.; Chang, W.; Lin, Z. Classification and Spatial Distribution Features of Characteristic Towns in China. Econ. Geogr. 2020, 40, 52–62. [Google Scholar] [CrossRef]
  16. Hong, X.; Yinghao, L.; Youyi, W. Influencing Factors and Spatial Distribution of the Characteristic Towns in Zhejiang Province. Sci. Geogr. Sin. 2018, 38, 1283–1291. [Google Scholar] [CrossRef]
  17. Cao, S.; Li, T.; Gao, H. Research on “Static-Dynamic” Development of Characteristic Towns in China Based on Space and Type: A Big Data Analysis. Am. J. Ind. Bus. Manag. 2019, 9, 1639–1652. [Google Scholar] [CrossRef] [Green Version]
  18. Haonan, S.; Yang, X. Spatial distribution characteristics of national characteristic towns. J. Arid. Land Resour. Environ. 2019, 33, 39–44. [Google Scholar] [CrossRef]
  19. Yelin, F.; Zhenfang, H.; Jinglong, L.; Fang, W. Spatial distribution of characteristic towns and their industrial characteristics in China. J. Nat. Resour. 2019, 34, 1273–1284. [Google Scholar] [CrossRef]
  20. Yin, X.; Wang, J.; Li, Y.; Feng, Z.; Wang, Q. Are small towns really inefficient? A data envelopment analysis of sampled towns in Jiangsu province, China. Land Use Policy 2021, 109, 105590. [Google Scholar] [CrossRef]
  21. Lynch. Good City Form; MIT Press: Cambridge, MA, USA, 1981. [Google Scholar]
  22. Difei, J. The Theory of Urban Form Vitality; Southeast University Press: Jiangsu, China, 2007. [Google Scholar]
  23. Li, L.; Yilun, X.; Shanhu, J.; Qingming, W. Evaluation of urban vitality based on fuzzy matter-element model. Geogr. Geo-Inf. Sci. 2010, 26, 73–77. [Google Scholar]
  24. Qiong, W. Difference and Factor Analysis of Urban Vitality of 19 National-Level New Areas. Master’s Thesis, South China University of Technology, Guangzhou, China, 2019. [Google Scholar]
  25. Ying, Z. Research on the Measurement and Influence Mechanism of Urban block Vitality—Taking the Main City of Wuhan as an Example. Master’s Thesis, Wuhan University, Wuhan, China, 2019. [Google Scholar]
  26. Yujia, M.; Yong, L.; Jiasong, Z. Vitality assessment of mountainous cities based on multi—Source data: A case of Chongqing Municipality, China. Resour. Sci. 2020, 42, 710–722. [Google Scholar] [CrossRef]
  27. Ta Na, Z.Y.Z.Q. Relationship between built environment and urban vitality in Shanghai downtown area based on big data. Sci. Geogr. Sin. 2020, 40, 60–68. [Google Scholar] [CrossRef]
  28. Sangzhaxi, L.; Feng, Z. How to evaluate public space vitality based on mobile phone data: An empirical analysis of Nanjing’s parks. Geogr. Res. 2019, 38, 1594–1608. [Google Scholar]
  29. Fan, D. Quantifying Urban Vitality and Its Growth Strategy Using Spatio-Temporal Big Data. Master’s Thesis, Wuhan University, Wuhan, China, 2019. [Google Scholar]
  30. Tingting, Z.; Wei, T.; Yang, Y.; Chen, Z.; Tianhong, Z. Sensing urban vibrancy using geo-tagged data. Acta Geod. Cartogr. Sin. 2020, 49, 365–374. [Google Scholar]
  31. Delclòs-Alió, X.; Miralles-Guasch, C. Looking at Barcelona through Jane Jacobs’s eyes: Mapping the basic conditions for urban vitality in a Mediterranean conurbation. Land Use Policy 2018, 75, 505–517. [Google Scholar] [CrossRef]
  32. Fuentes, L.; Miralles-Guasch, C.; Truffello, R.; Delclòs-Alió, X.; Flores, M.; Rodríguez, S. Santiago de Chile through the Eyes of Jane Jacobs. Analysis of the Conditions for Urban Vitality in a Latin American Metropolis. Land 2020, 9, 498. [Google Scholar] [CrossRef]
  33. Delclòs-Alió, X.; Gutiérrez, A.; Miralles-Guasch, C. The urban vitality conditions of Jane Jacobs in Barcelona: Residential and smartphone-based tracking measurements of the built environment in a Mediterranean metropolis. Cities 2019, 86, 220–228. [Google Scholar] [CrossRef]
  34. Xia, C.; Yeh, A.G.; Zhang, A. Analyzing spatial relationships between urban land use intensity and urban vitality at street block level: A case study of five Chinese megacities. Landsc. Urban Plan. 2020, 193, 103669. [Google Scholar] [CrossRef]
  35. Ye, Y.; Li, D.; Liu, X. How block density and typology affect urban vitality: An exploratory analysis in Shenzhen, China. Urban Geogr. 2018, 39, 631–652. [Google Scholar] [CrossRef]
  36. Li, X.; Qian, Y.; Zeng, J.; Wei, X.; Guang, X. The Influence of Strip-City Street Network Structure on Spatial Vitality: Case Studies in Lanzhou, China. Land 2021, 10, 1107. [Google Scholar] [CrossRef]
  37. Jalaladdini, S.; Oktay, D. Urban Public Spaces and Vitality: A Socio-Spatial Analysis in the Streets of Cypriot Towns. Procedia-Soc. Behav. Sci. 2012, 35, 664–674. [Google Scholar] [CrossRef] [Green Version]
  38. Yang, J.; Cao, J.; Zhou, Y. Elaborating non-linear associations and synergies of subway access and land uses with urban vitality in Shenzhen. Transp. Res. Part A Policy Pract. 2021, 144, 74–88. [Google Scholar] [CrossRef]
  39. Xu, Y.; Chen, X. Quantitative analysis of spatial vitality and spatial characteristics of urban underground space (UUS) in metro area. Tunn. Undergr. Space Technol. 2021, 111, 103875. [Google Scholar] [CrossRef]
  40. Dong, Y.; Peng, F.; Guo, T. Quantitative assessment method on urban vitality of metro-led underground space based on multi-source data: A case study of Shanghai Inner Ring area. Tunn. Undergr. Space Technol. 2021, 116, 104108. [Google Scholar] [CrossRef]
  41. Niu, Y.; Mi, X.; Wang, Z. Vitality evaluation of the waterfront space in the ancient city of Suzhou. Front. Archit. Res. 2021, 10, 729–740. [Google Scholar] [CrossRef]
  42. Shi, J.; Miao, W.; Si, H.; Liu, T. Urban Vitality Evaluation and Spatial Correlation Research: A Case Study from Shanghai, China. Land 2021, 10, 1195. [Google Scholar] [CrossRef]
  43. Yang, Y.; Ma, Y.; Jiao, H. Exploring the Correlation between Block Vitality and Block Environment Based on Multisource Big Data: Taking Wuhan City as an Example. Land 2021, 10, 984. [Google Scholar] [CrossRef]
  44. Kim, Y. Data-driven approach to characterize urban vitality: How spatiotemporal context dynamically defines Seoul’s nighttime. Int. J. Geogr. Inf. Sci. IJGIS 2020, 34, 34–1235. [Google Scholar] [CrossRef]
  45. Jin, X.; Long, Y.; Sun, W.; Lu, Y.; Yang, X.; Tang, J. Evaluating cities’ vitality and identifying ghost cities in China with emerging geographical data. Cities 2017, 63, 98–109. [Google Scholar] [CrossRef]
  46. He, Q.; He, W.; Song, Y.; Wu, J.; Yin, C.; Mou, Y. The impact of urban growth patterns on urban vitality in newly built-up areas based on an association rules analysis using geographical ‘big data’. Land Use Policy 2018, 78, 726–738. [Google Scholar] [CrossRef]
  47. Kim, Y. Seoul’s Wi-Fi hotspots: Wi-Fi access points as an indicator of urban vitality. Comput. Environ. Urban Syst. 2018, 72, 13–24. [Google Scholar] [CrossRef]
  48. Yue, W.; Chen, Y.; Thy, P.T.M.; Fan, P.; Liu, Y.; Zhang, W. Identifying urban vitality in metropolitan areas of developing countries from a comparative perspective: Ho Chi Minh City versus Shanghai. Sustain. Cities Soc. 2021, 65, 102609. [Google Scholar] [CrossRef]
  49. Zeng, C.; Song, Y.; He, Q.; Shen, F. Spatially explicit assessment on urban vitality: Case studies in Chicago and Wuhan. Sustain. Cities Soc. 2018, 40, 296–306. [Google Scholar] [CrossRef]
  50. Lan, F.; Gong, X.; Da, H.; Wen, H. How do population inflow and social infrastructure affect urban vitality? Evidence from 35 large- and medium-sized cities in China. Cities 2020, 100, 102454. [Google Scholar] [CrossRef]
  51. Poot, J.; Pawar, S. Is Demography Destiny? Urban Population Change and Economic Vitality of Future Cities. J. Urban Manag. 2013, 2, 5–23. [Google Scholar] [CrossRef]
  52. Mouratidis, K.; Poortinga, W. Built environment, urban vitality and social cohesion: Do vibrant neighborhoods foster strong communities? Landsc. Urban Plan. 2020, 204, 103951. [Google Scholar] [CrossRef]
  53. Montgomery, J. Editorial Urban Vitality and the Culture of Cities. Plan. Pract. Res. 1995, 10, 101–110. [Google Scholar] [CrossRef]
  54. Mengqi, Z. Analysis and Evaluation of Urban Vitality. Master’s Thesis, Wuhan University, Wuhan, China, 2018. [Google Scholar]
  55. Shuiling, L. Research on Evaluation and Influencing Factors Analysis of Urban Vitality in Wuhan Metropolitan Area. Master’s Thesis, Wuhan University, Wuhan, China, 2020. [Google Scholar]
  56. Wang Na, W.J.L.S. Spatial Features of Urban Vitality and the Impact of Built Environment on Them Based on Multi-Source Data: A Case Study of Shenzhen. Trop. Geogr. 2021, 41, 1280–1291. [Google Scholar] [CrossRef]
  57. Quanyi, L.; Qingming, Z.; Jiansong, L.; Chen, Y.; Wen, L. Extracting Built-up Areas Using Luojia-1A Nighttime Light Imageries in Wuhan, China. Geomat. Inf. Sci. Wuhan Univ. 2021, 46, 30–39. [Google Scholar] [CrossRef]
  58. Xiang, L.; Jiang, Z.; Xiangdong, Y.; Jiangchun, Y.; Huang, C.; Mitao, L. Mapping construction land of Guangzhou based on Luojia No.1 nightlight data. J. Geo-Inf. Sci. 2019, 21, 1802–1810. [Google Scholar] [CrossRef]
  59. Chang, S.; Wang, J.; Zhang, F.; Niu, L.; Wang, Y. A study of the impacts of urban expansion on vegetation primary productivity levels in the Jing-Jin-Ji region, based on nighttime light data. J. Clean Prod. 2020, 263, 121490. [Google Scholar] [CrossRef]
  60. Yin, Z.; Li, X.; Tong, F.; Li, Z.; Jendryke, M. Mapping urban expansion using night-time light images from Luojia1-01 and International Space Station. Int. J. Remote Sens. 2020, 41, 2603–2623. [Google Scholar] [CrossRef]
  61. Qianxiang, L.; Han, Z.; Guo, Z.; Xueyao, G.; Weiling, L. Analysis of Luojia1-01 Index Based on Nighttime Light Imagery. J. Geomat. 2020, 45, 8–15. [Google Scholar] [CrossRef]
  62. Hang, G. High-Resolution Population Spatialization Based on Multi-Source Data and Random Forests Model—A Case Study in Changsha. Master’s Thesis, Hunan Normal University, Changsha, China, 2020. [Google Scholar]
  63. Dong, Z.; Deping, L.; Liang, Z.; Man, G.; Hang, G. High precision space estimation of housing vacancy rate using high resolution image and Luojia-1. Bull. Surv. Mapp. 2021, 41–46. [Google Scholar] [CrossRef]
  64. Shi, L.; Wurm, M.; Huang, X.; Zhong, T.; Leichtle, T.; Taubenböck, H. Urbanization that hides in the dark—Spotting China’s “ghost neighborhoods” from space. Landsc. Urban Plan. 2020, 200, 103822. [Google Scholar] [CrossRef]
  65. Yang, J.; Wang, Y.; Xiu, C.; Xiao, X.; Xia, J.; Jin, C. Optimizing local climate zones to mitigate urban heat island effect in human settlements. J. Clean. Prod. 2020, 275, 123767. [Google Scholar] [CrossRef]
  66. Wang, C.; Chen, Z.; Yang, C.; Li, Q.; Wu, Q.; Wu, J.; Zhang, G.; Yu, B. Analyzing parcel-level relationships between Luojia 1-01 nighttime light intensity and artificial surface features across Shanghai, China: A comparison with NPP-VIIRS data. Int. J. Appl. Earth Obs. 2020, 85, 101989. [Google Scholar] [CrossRef]
  67. Ou, J.; Liu, X.; Liu, P.; Liu, X. Evaluation of Luojia 1-01 nighttime light imagery for impervious surface detection: A comparison with NPP-VIIRS nighttime light data. Int. J. Appl. Earth Obs. 2019, 81, 1–12. [Google Scholar] [CrossRef]
  68. Zhang Yuxin, L.X.S.Y. Urban Spatial Form Analysis of GBA Based on “LJ1-01”Nighttime Light Remote Sensing Images. J. Appl. Sci. 2020, 38, 466–477. [Google Scholar] [CrossRef]
  69. Xueling Zhang, T.W. Study on the spatial differentiation pattern of China’s provincial digital economy development. World Surv. Res. 2019, 34–40. [Google Scholar] [CrossRef]
  70. Goodchild, M.F. What Problem? Spatial Autocorrelation and Geographic Information Science. Geogr. Anal. 2009, 4, 411–417. [Google Scholar] [CrossRef] [Green Version]
  71. Ord, A.G.A.J. The Analysis of Spatial Association by Use of Distance Statistics. Geogr. Anal. 1992, 24, 189–206. [Google Scholar] [CrossRef]
  72. Zhi, S.C.; Xiaolu, Y.; Jingqiu, Z. Evaluation of the landscape patterns vulnerability and analysis of spatial correlation patterns in the lower reaches of Liaohe River Plain. Acta Ecol. Sin. 2014, 34, 247–257. [Google Scholar] [CrossRef]
  73. Shenglan, W.; Ding, L.; Ye, X.; Qiang, C.; Xiaorong, J. Fuzzy comprehensive evaluation on the urban vitality—A case of the main cities in Hubei Province. J. Cent. China Norm. Univ. (Nat. Sci.) 2013, 47, 440–445. [Google Scholar] [CrossRef]
  74. YanJie, J. Study on Urban Economic Vatality Index in China. Sci. Geogr. Sin. 2007, 27, 9–16. [Google Scholar] [CrossRef]
  75. Mingyang, L. The Construction and Evaluation for the City Vigor Index System. Master’s Thesis, Dongbei University of Finance and Economics, Dalian, China, 2011. [Google Scholar]
  76. Feng, Z.; Peng, J.; Wu, J. Using DMSP/OLS nighttime light data and K–means method to identify urban–rural fringe of megacities. Habitat Int. 2020, 103, 102227. [Google Scholar] [CrossRef]
  77. Xin, X.; Liu, B.; Di, K.; Zhu, Z.; Zhao, Z.; Liu, J.; Yue, Z.; Zhang, G. Monitoring urban expansion using time series of night-time light data: A case study in Wuhan, China. Int. J. Remote Sens. 2017, 38, 6110–6128. [Google Scholar] [CrossRef]
  78. Zheng, Y.; He, Y.; Zhou, Q.; Wang, H. Quantitative Evaluation of Urban Expansion using NPP-VIIRS Nighttime Light and Landsat Spectral Data. Sustain. Cities Soc. 2021, 76, 103338. [Google Scholar] [CrossRef]
  79. Yang, Y.; Wu, J.; Wang, Y.; Huang, Q.; He, C. Quantifying spatiotemporal patterns of shrinking cities in urbanizing China: A novel approach based on time-series nighttime light data. Cities 2021, 118, 103346. [Google Scholar] [CrossRef]
  80. Guo, A.; Yang, J.; Sun, W.; Xiao, X.; Xia Cecilia, J.; Jin, C.; Li, X. Impact of urban morphology and landscape characteristics on spatiotemporal heterogeneity of land surface temperature. Sustain. Cities Soc. 2020, 63, 102443. [Google Scholar] [CrossRef]
  81. Liang, H.; Guo, Z.; Wu, J.; Chen, Z. GDP spatialization in Ningbo City based on NPP/VIIRS night-time light and auxiliary data using random forest regression. Adv. Space Res. 2020, 65, 481–493. [Google Scholar] [CrossRef]
  82. You, H.; Yang, J.; Xue, B.; Xiao, X.; Xia, J.; Jin, C.; Li, X. Spatial evolution of population change in Northeast China during 1992–2018. Sci. Total Environ. 2021, 776, 146023. [Google Scholar] [CrossRef]
  83. Krikigianni, E.; Tsiakos, C.; Chalkias, C. Estimating the relationship between touristic activities and night light emissions. Eur. J. Remote Sens. 2019, 52, 233–246. [Google Scholar] [CrossRef] [Green Version]
  84. Shi, K.; Chang, Z.; Chen, Z.; Wu, J.; Yu, B. Identifying and evaluating poverty using multisource remote sensing and point of interest (POI) data: A case study of Chongqing, China. J. Clean. Prod. 2020, 255, 120245. [Google Scholar] [CrossRef]
  85. Shi, K.; Shen, J.; Wu, Y.; Liu, S.; Li, L. Carbon dioxide (CO2) emissions from the service industry, traffic, and secondary industry as revealed by the remotely sensed nighttime light data. Int. J. Digit. Earth 2021, 14, 1514–1527. [Google Scholar] [CrossRef]
  86. Sun, Y.; Wang, S.; Zhang, X.; Chan, T.O.; Wu, W. Estimating local-scale domestic electricity energy consumption using demographic, nighttime light imagery and Twitter data. Energy 2021, 226, 120351. [Google Scholar] [CrossRef]
Figure 1. Geographical location of 402 characteristic towns.
Land 11 00085 g001
Figure 2. Vitality profile diagram of the Chinese characteristic towns.
Land 11 00085 g002
Figure 3. Comparison of the vitality of different regions.
Land 11 00085 g003
Figure 4. Overview of the vitality of the six regional characteristic towns.
Land 11 00085 g004
Figure 5. Distribution of clustering types of Chinese characteristic towns.
Land 11 00085 g005
Table 1. Data sources and description.
DateDataSourceDetailsPurpose
2018Luojia1-01 nighttime light dataHigh-resolution Earth Observation System Hubei Data and Application Center
(http://59.175.109.173:8888/index.html) accessed on 10 September 2021
Total of 402 images,
Raster data
Light
extraction
2018Administrative division dataWater Meridian Micro Chart
(http://www.rivermap.cn) accessed on 10 September 2021
Vector dataMap of study area
2018Statistical DataStatistical Yearbook Sharing Platform
(https://www.yearbookchina.com) accessed on 10 September 2021
Township articlesTo acquire
statistics
Table 2. Average DN value and the corresponding vitality level.
CategoriesNumber of TownsAverage DN RangeVitality Level
13120.000002–0.001912lowest
2480.002023–0.06446low
3220.006819–0.013408medium
4150.015813–0.029433high
550.036620–0.056652highest
Table 3. Average light density of the six regional characteristic towns.
RankRegionAverage DN
1East China0.004838
2South-central China0.003190
3North China0.001897
4Northeast China0.001313
5Southwest China0.000921
6Northwest China0.000401
Table 4. Global spatial autocorrelation analysis index of Chinese characteristic towns.
IndexValue
Moran’s I0.464942
p-value16.269162
Z-value0.000000
Table 5. Distribution of clustering types of Chinese characteristic towns.
Towns
HHFengjing, Chedun, Zhujiajiao, Xinchang, Wujing, Anting, Luojing, Zhuanghang, Luzhi, Hangji, Lujia, Menghe, Puyuan, Dongpu, Hanjiang, Jinjing, Sanjiangkou, Beijiao, Guzhen, Xiqiao, Shawan, Lecong, Tangxia, and Dayong
HLQiaogang
LH
LL
Note: “—” means no data.
Publisher’s Note: MDPI stays neutral with regard to jurisdictional claims in published maps and institutional affiliations.

