
Numerical Modeling of Seawater Intrusion in Wadi Al-Jizi Coastal Aquifer in the Sultanate of Oman


1
Civil & Architectural Engineering Section, Engineering Department, University of Technology and Applied Sciences, Muscat P.O. Box 74, Oman
2
School of Engineering, University of Petroleum and Energy Studies, Dehradun 248007, Uttarakhand, India
3
Department of Civil and Architectural Engineering, Sultan Qaboos University, Muscat P.O. Box 33, Oman
4
Centre for Interdisciplinary Research and Innovation (CIDRI), University of Petroleum and Energy Studies, Dehradun 248007, Uttarakhand, India
5
Institute of Liberal Arts and Sciences, Tohoku University, Sendai 980-8577, Japan
*
Author to whom correspondence should be addressed.
Hydrology 2022, 9(12), 211; https://doi.org/10.3390/hydrology9120211
Submission received: 6 October 2022
/
Revised: 3 November 2022
/
Accepted: 24 November 2022
/
Published: 27 November 2022
(This article belongs to the Section Surface Waters and Groundwaters)
Abstract
:The Sultanate of Oman is an arid country in the Arabian Peninsula suffering from insufficient freshwater supplies and extremely hot weather conditions. The only source of recharge is rainfall, which is scarce and varies with space and time, for the aquifers being overexploited for the last few decades. This has led to depleting groundwater levels and seawater intrusion into coastal aquifers. In the present study, Ground Modeling System (GMS) was employed in Wadi Al-Jizi, which is one of the important aquifers in the Al Batinah coastal plain that caters to the needs of the country’s 70% agriculture. MODFLOW and MT3DMS were used to simulate the groundwater levels and solute transport, respectively. These models were calibrated under steady and transient conditions using observed data from twenty monitoring wells for a period of seventeen years (year 2000–2016). After validation, the model was utilized to predict the salinity intrusion due to changes in groundwater abstraction rates and sea level rise owing to climatic change. These predictions show that, by the year 2040, salinity intrusion (TDS > 12,800 mg/L) will transgress by 0.80 km inland if the current abstraction rates are allowed to be maintained. Further deterioration of groundwater quality is anticipated in the following years due to the increased pumping rates. The models and the results from the present study may be utilized for the effective management of groundwater resources in the Wadi Al-Jizi aquifer.
1. Introduction
One-third of the world’s land surface is classified as arid or semi-arid, putting several regions under severe and increasing water stress due to expanding population, rapid urbanization, increasing water consumption, and limited available water resources. The world’s population has increased four times over the last 150 years, and it may quadruple in the next 30 years [1]. Over the past few centuries, the quality of groundwater and surface water has drastically declined in many regions of the world as a result of increased industrialization, urbanization, and agricultural activities [2,3,4,5,6]. Surface water sources, such as open channels and other water bodies, are relatively easier to monitor for contamination than underground sources, which makes restoring aquifers for clean water supplies a difficult task, as the subsurface pollution cannot be seen instantly [7].
The majority of the Arabian Peninsula’s small- to medium-sized exploitable fossil aquifer systems will hit maximum depletion by 2050, and in 60–90 years, the complete depletion of groundwater supplies in all aquifer systems could occur [8]. The direct relationship between water, energy, and food makes tackling this problem and controlling seawater intrusion vital to the economic and social development of a country. The exploration and management of groundwater thus become necessary for the sustainable development in such areas [9]. In the existing water shortage scenarios, the problems are accentuated by the expected temperature rise and the decline in precipitation, which would reduce the amount of recharge for renewable water supplies [8]. During the dry season, even relatively lower withdrawal of groundwater may result in seawater intrusion and, consequently, the chances of seawater intrusion remain higher during the dry season as compared with the rainy season [10]. The abstraction rate in response to population increase was found to be the most crucial factor as compared with other variables (such as rainfall, temperature, and evaporation). As the population increases, salinity intrusion moves further inland due to the over-extraction of water from the subsurface in the absence of proper replenishment in arid or semi-arid regions, which further emphasizes the need for the environmental impact mitigation.
Some of the previous legislative measures taken in the Al-Batinah region of Oman to decrease the intrusion of seawater were: (1) the installation of fresh groundwater wells was banned and (2) recharge dams were constructed on the chosen wadis in the region. The 1999 salinity study showed that the water quality improved downstream of the recharge dams replenishing groundwater aquifers. An additional intervention to enhance the region’s water quality requires a deeper knowledge of the issue of salinity intrusion. The use of a numerical model not only fulfills this objective, but it can also be served as a management instrument for making choices about pumping patterns and building fresh recharge facilities in the study region [11]. A reduction in the pumping rate is the simplest, most efficient, and most cost-effective, but temporary, method for preserving groundwater equilibrium in aquifers and managing SWI (Sea Water Intrusion) problems, apart from establishing surface and subsurface physical barriers in front of the intruding seawater body; Abstraction, Desalination, and Recharge (ADR); and Aquifer Storage and Recovery (ASR) [6].
The quality of the groundwater varies based on the distance from the shoreline and the depth below the seawater level [12]. If the transient conditions are not considered, coastal aquifers in semi-arid locations with inadequate groundwater recharge and salinity intrusion due to groundwater abstraction pumping could be underestimated. The pumping rates and locations, as well as aquifer characteristics, such as hydraulic conductivity and porosity, length-to-height relationship of an aquifer, density contrast between freshwater and saltwater, and recharge conditions, all influence seawater intrusion induced by freshwater abstraction from coastal aquifers [13]. It has been reported that there has been a rise in the water level in the groundwater observation wells due to the recharge dams constructed in the region of Al Batinah. This also resulted in slightly lower salinity in some of the wadis (dry river channels or dry riverbeds) [14]. However, due to the overexploitation of aquifers near coastal areas, salinity intrusion occurred landward [15]. On the other hand, it was revealed that the groundwater from the wadi bed or recharge dam infiltration had a negligible effect on the groundwater and did not affect the water balance [16].
Salinity intrusion in the Al-Batinah region is a severe concern, because it has a detrimental impact on food security and the economy. It is imperative to create and execute sufficient and effective groundwater reclamation policies and strategies to prevent additional salinization and to manage and monitor groundwater salinity to protect agricultural lands and natural ecosystems [15]. The objective of the present study was to model the groundwater flow and quality using well-known numerical models (MODFLOW and MT3DMS). The results of the present study may help decision-makers in the effective management of water resources in the Al-Batinah region.
2. Study Area
The Sultanate of Oman is situated on the southeastern corner of the Arabian Peninsula and is considered to be the second-largest country, having a coastline of around 2100 km. At the foot of the Western Hajar Mountains lies the coastal plain of Al Batinah in the Sultanate of Oman, which is the most densely populated region (1.25 million according to the 2020 census) in the country after Muscat (capital city).
According to an estimate, more than half of the Sultanate of Oman’s cultivated land is located in this region, which has fertile soil and is crucial to the country’s agricultural economy [11]. The Wadi Al-Jizi catchment. located in the Al Batinah region, was selected as the study area (located between latitudes 2,685,288.72 m N and 2,702,809.30 m N and longitudes 445,120.53 m E and 474,236.85 m E, covered in the topographic map (Figure 1)). The Sea of Oman lies in the north of the study area, and the Western Al-Hajar mountains are in the south. The total area of the Wadi Al-Jizi watershed is 1154 km2. The eastern part of the aquifer system was studied, which has an area of approximately 123 km2, extending from the sea toward the mountain region. This region of the aquifer was chosen because it is home to the majority of agricultural operations, pumping and observation wells, and salinity monitoring wells.
The Al Batinah coastal plain stretches northwest of the capital city Muscat for nearly 300 km along the west shore of the Gulf of Oman. It ranges in width from 10 to 30 km, extending inland to the foothills of Northern Oman Mountain [17]. Approximately one-third of the population of the country lives in the Al Batinah region, which accounts for about 4% of the area of the country. High evapotranspiration rates and a dry climate characterize the eastern coastal plain [18]. It is characterized by a warm winter with low humidity, a very hot and sometimes humid summer, and low and erratic levels of rainfall. In the coastal area, the average annual air temperature is 28.5 °C, and that in the mountains is 17.8 °C. In the southern high region, high rainfall (300 mm per year) has been reported relative to the coastal region [19].
The Sultanate of Oman falls under the category of an arid region because it receives only about 100 mm of rainfall on average in a year. The ‘normal’ weather characteristics are clear, bright skies, and light wind for over 90% of the year. The winter is pleasantly warm and dry, and the summer is hot and dry. The Al Batinah aquifers’ primary source of freshwater replenishment is mountain rainfall [20]. A major part of the precipitation (80%) evaporates because of high prevalent temperatures, 5% flows to the sea through ‘wadis’ (seasonal watercourses or dry riverbeds), and the remaining 15% infiltrates to recharge the aquifers. It is generally accepted that most recharges occur along the ‘wadis’ in the upstream area of the alluvial fans adjacent to the mountains [21]. The groundwater from here moves slowly toward the ocean through the aquifers. The direct rainfall on the gravel plains between the shoreline and the hills does not seem to be the main cause of the recharge, as the quantity is comparatively low and most of it is absorbed by the ground and then lost to evaporation. The rain gauges in the Eastern Al Batinah were classified into the coastal, valley, and highland areas, and the mean annual rainfalls for these areas were found to be 68 mm/year, 90 mm/year, and 174 mm/year, respectively [18]. This variation is regarded to be mainly due to the impact of the topography. The water deficit in Oman is more than 300 MCM per year, according to the projections by the Ministry of Regional Municipalities, Environment and Water Resources (MRMEWR) [22]. For this reason, the intrusion of seawater is imminent in the coastal aquifers where the majority of the population is located. From 1983 to 1999, the ministry conducted detailed salinity measurements covering over 1000 wells in the Al Batinah region [23].
The primary rainfall season in the Northern Oman occurs between December and April, mostly in the winter, representing 58 to 83% of the annual rainfall. The greatest rainfall in February and March represents 35 to 42% of the annual rainfall. The analysis of rainfall data from 1977 to 2003 found that the year with the highest annual average rainfall was 1997 and the year with the lowest annual average rainfall was 2001 [24]. Long-term measurements show mean average precipitation values in the upstream Hajar Mountain of up to 350 mm/year and around 50 mm/year along the coastline. The fluctuation of rainfall with respect to time and location is incredibly high; during years with high rainfall, there are comparatively moist intervals that are followed by protracted dry periods [25]. It was reported that the highest average record of 608 mm was in 1997, with continuous dry years up to 2010 in Southern Al Batinah, except in 2007. The average numbers of rainy days per year are 9.1 for the coastal plain of Al Batinah and 13 per year for the mountains of northern Oman [26].
The topography of the Al Batinah region varies from 1700 m above MSL at the southern mountain front to large flat areas near the coast. In the upstream watersheds near the Jabal Al Akhdar mountains (part of the Al-Hajar mountain range), the topography rises to up to 3000 m above MSL, whereas the coastal plain near the coastline varies from 100 and 0 m (above MSL) [26]. The Al Batinah region hydrogeology is regarded to be a significant factor in the occurrence of groundwater. The plain was formed by rainfall due to the natural weathering process. The Al Batinah region could generally be divided into two primary areas, distinguished by their rock type and geological environments, namely a mountainous region, consisting primarily of hard rocks, mainly ophiolite and calcareous rocks, and the lowland and coastal plain regions, consisting primarily of coarse gravel and boulders with occasionally cemented beds. The latter is the key aquifer, with a total thickness of over 300 m in the north and over 600 m in the south.
3. Literature Review
3.1. Salinity Intrusion
Saline water intrusion often occurs when fresh groundwater abstraction from coastal aquifers lowers the groundwater table, allowing saline water to move laterally or vertically, thereby degrading the quality of the groundwater [27]. Due to over-pumping for the past few decades, seawater intrusion has taken place, rendering many agricultural farmlands abandoned and wells non-operative [12,28]. Although natural brines, leachate from landfills, and irrigation can all contaminate water, the sea is a common source of saltwater [29,30,31,32].
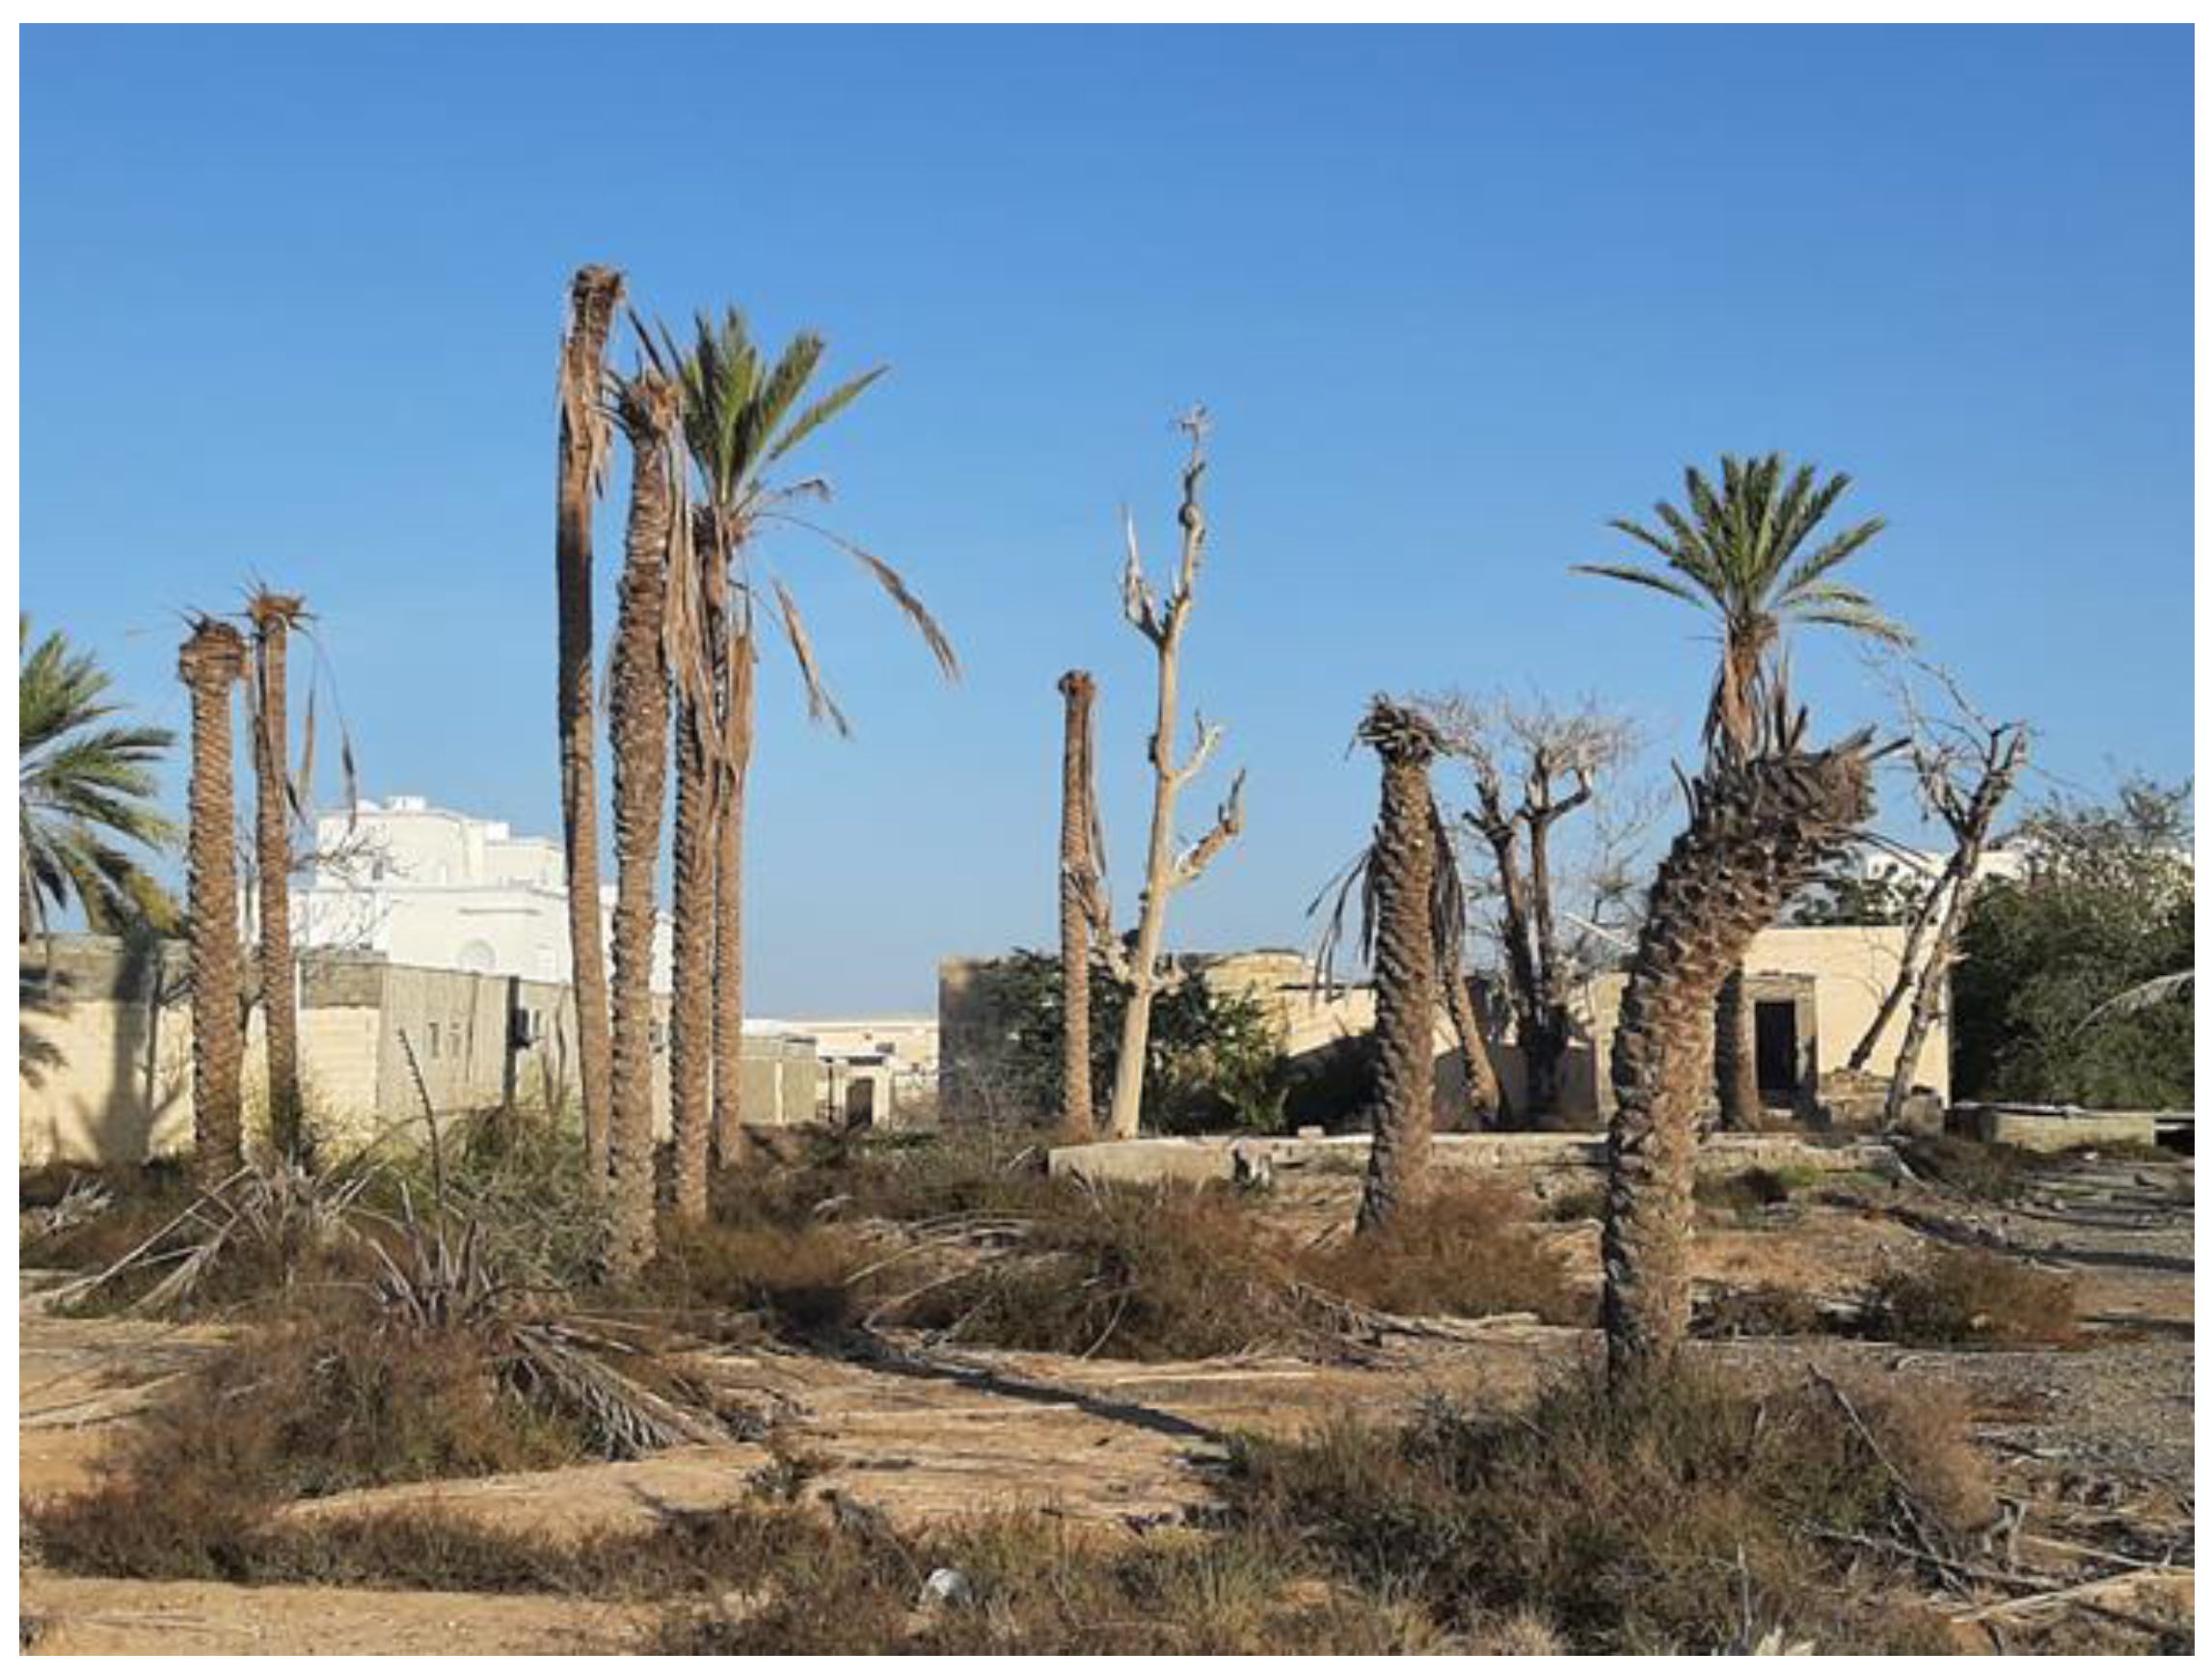
In numerous locations, groundwater overdraft led to seawater intrusion up to 15 km inland. Many countries around the world, including the Sultanate of Oman, had to close hundreds of wells along the coastline [33,34]. The problem of seawater intrusion in Oman is most pronounced along the Al Batinah coastal plain and Salalah, where cultivation occurs over large areas. Owing to the seawater intrusion for more than two decades, precious agricultural land has become unfit for cultivation [30]. The infiltration of seawater persists because of a continuous shortfall brought on by excessive pumping in the area. As a result, several farms are currently in danger and a number of them have been abandoned (Figure 2). Due to saline intrusion, some 6000 hectares of agricultural land have been abandoned, while another 5000 hectares suffer moderate salinity effects. In rural regions, this has had a negative impact on livelihoods. These significant coastal aquifers were drained by excessive water abstraction and subsequent seawater intrusion. Using an 8% discount rate, saline intrusion has been estimated to cause a loss of US$ 288 million (net present value) over a 25-year period. Crop production causes numerous losses, including the drying up of historical irrigation channels known as ‘aflaj’, losses to domestic consumers, increases in energy demand, and irreversible aquifer depletion [35].
The quality of the groundwater is highly diverse in the Al Batinah region. The water quality in the hilly region is very good (<1500 mg/L); in the flat and lowland regions [26], the water quality reduces (1500–6500 mg/L) as groundwater dissolves salts (primarily calcium carbonate) on its way to the ocean. Salinity in water is normally measured and expressed in terms of Electrical Conductivity (EC) and Total Dissolved Solids (TDS). The values of EC are always expressed at a standard temperature of 25 °C to enable the comparison of readings taken under varying climatic conditions. Electrical Conductivity (EC) is the ability of a substance to conduct an electrical current. Water becomes a better conductor of electricity as its TDS increases. The TDS can be estimated from the EC using available empirical relationships The groundwater salinity classes are shown in Table 1.
The Japan International Cooperation Agency (JICA), in 1982, started a five-year project to establish a hydrological observation network in the Al Batinah area and carried out detailed hydrological and hydro-geological surveys [36]. Increasing use and growing demand for irrigation water have been discovered to result in increased salinity in coastal aquifers. In that study, several mitigation measures were suggested. Three in-depth surveys were carried out between 1982 and 1984 by the Public Authority for Water Resources (PAWR) utilizing 345 coastal wells spread out from As-Seeb to Shinas, and they revealed a major salinity intrusion issue [37]. The groundwater quality along the Al Batinah beach deteriorated between 1983 and 1986 [38]. In the coastal region of Al Batinah, Hydroconsult conducted a preliminary soil and groundwater study in cooperation with the Ministry of Agriculture and Fisheries (MAF). It was found that the Al Batinah coastal plain experienced an annual water shortage of roughly 47 MCM [39]. The Ministry of Water Resources acknowledged the necessity for thorough technical studies at various places between the years of 1992 and 1995 in a report on salinity surveys. A sizable monitoring network of 1100 wells in the area has been utilized for this purpose [21]. In a later report from the Ministry of Water Resources, which spanned the years 1997 to 1999 and examined 1033 monitoring wells, it was revealed that the Al Batinah coastal plain aquifer had widespread groundwater scarcity. The Ministry staff collects water samples from the observation and production wells using a pump, and these samples are sent to the water quality laboratory for chemical analysis. When compared with the findings of the 1997 study, the salinity typically increased in the most impacted areas, which were located from Barka to As-Suwayq. The wells in Wadi Ahin (Saham) and Wadi Al Jizi (Sohar), which are situated on the downstream side of the dams, showed groundwater retrieval [23].
A significant decline in the quality of water in the Al Batinah region has been mentioned in earlier studies [14]. This was indicated by a decrease of 7% in the regions of appropriate agricultural water (2000–6000 μS/cm), reflecting a loss of 2714 hectares of irrigated land. Additionally, in the Wadi Al Taww Barka region, the saline interface was recorded to be 12 km inland. A saltwater wedge, stretched over several kilometers inland, lies beneath the freshwater aquifer in the coastal area. The interface between seawater and freshwater is progressing in all areas of Al Batinah, indicating the over-exploitation of the aquifer. As studied by the Ministry of Regional Municipalities and Water Resources (MRMWR), saline water intrusion in Wadi Al Taww and Wadi Al Maawil could not be reduced, despite the exceptionally heavy rainfall from 1995 to 1997. The Ministry has imposed a ban on the entablement of new pumping wells and recharge dams in the region were planned to be constructed to aid in surface water infiltration and increase water heads. From 1998 to 2004, low average rainfall and wadi flow resulted in the further deterioration of groundwater quality [40]. Table 2 shows a summary of the observed salinity values in groundwater in the countries of the Arabian Peninsula, highlighting that salinity intrusion is not an unusual phenomenon in the region.
3.2. Numerical Modeling
Numerical models are very effective for analyzing the prevailing conditions and then managing and protecting coastal aquifers from salinity intrusion [50,51,52]. Groundwater models can provide real-time analysis and visualization of two- and three-dimensional flow and transport phenomena. User-friendly graphical interfaces make it easier for models to be used [51]. MODFLOW [53,54] is probably one of the most popular three-dimensional flow groundwater models for steady or transient flow conditions in the saturated zone in confined or unconfined aquifer systems. MT3DMS [55] is a three-dimensional multi-species transport model for the simulation of advection and solute transport. These models were effectively used to construct a regional representative 3D numerical groundwater flow and solute transport model for studying fluctuations in groundwater head and salinity intrusion in the Al Batinah aquifer and Salalah plain aquifers. These studies aimed at the implementation, calibration, and validation of MODFLOW for groundwater flow and MT3D for seawater intrusion in the aquifers of the Al Batinah and Salalah regions [11,56].
A 3D groundwater model (MODFLOW) was employed to simulate the complex multi-layer aquifer located in the Wadi Samail catchment in the Al Batinah region [57]. A four-layer conceptual model was used to represent the heterogeneous multi-layer aquifer. The study results revealed a major impact of unregistered pumping wells on groundwater levels and insisted on maintaining an inventory of uncounted pumping wells for proper water management. Another study used MODFLOW and MT3DMS to investigate the impact of climate change on the Samail Lower Catchment aquifer and Jamma aquifer in the Al Batinah region, Oman [58]. The watershed seemed to defy the seawater intrusion by maintaining groundwater flow toward the sea, but the Jamma aquifer was found to be stressed, severely affected, and vulnerable to saline intrusion. By using MODFLOW and MT3DMS, the groundwater and seawater intrusion pattern was investigated in the Eastern Al Batinah coastal plain. For the provided set of data, both models were run to replicate steady-state and transient conditions. Additionally, two scenarios to reduce seawater intrusion were simulated using the calibrated model: (1) a reduction in the pumping rate and (2) an artificial recharge of treated wastewater with continuous pumping. The model runs’ outputs indicated that altering the pumping rate and artificial recharge would be a successful management strategy in the eastern Al Batinah coastal plain to fend against seawater intrusion [40]. Another study was conducted on seawater intrusion in the Eastern Al-Batinah catchments and their unconfined aquifers in the Sultanate of Oman [59]. A numerical model (SUTRA) and an analytical solution (Dupuit–Forchheimer) were used. It was inferred that the seawater intrusion could be mitigated by pumping saltwater from the intruded portion of the aquifer. A numerical groundwater model was used by [16] for the existing conditions of the coastal region in Oman. The study included an extension of the numerical simulation software OpenGeoSys using a numerical scheme to simulate the flow of fresh and saltwater in unconfined aquifers. The model was validated against a laboratory saltwater intrusion experiment and further calibration was carried out for a heterogeneous regional-scale model to simulate saltwater intrusion in a coastal aquifer. The groundwater modeling (MODFLOW and MT3DMS) and chemical results of the Salalah plain aquifer wells suggested that, if irrigation and domestic abstractions continue to increase, the freshwater zone will contract significantly over the coming years. Owing to the lack of annual rainfall, the outflow of freshwater to the sea is declining, allowing the seawater to intrude inland by more than 2 km. The deficit has been projected to increase in the coming years [30]. Shammas and Thunvik (2009) used a GMS (Groundwater Modeling System) that included MODFLOW and MT3DMS to represent the 3D groundwater flow and solute transport in Salalah, Oman. The current and future groundwater quality conditions were determined by predicting seawater intrusion for the next 15 years. The results obtained by the model were helpful in predicting aquifer responses under various water management methods. Shammas (2007) investigated the 1998 proposal to stop saline intrusion by artificially introducing cleaned sewage effluents to the Salalah plain aquifer in Oman. To stop the seawater intrusion, sewage collection and treatment were implemented, and the groundwater recharge program began in April 2003. The results showed that the artificial recharge of treated wastewater was effective to combat seawater intrusion and pushed back the saline front by 700 m.
FEFLOW has also been used to model the encroachment of saltwater in different layers of the multilayer aquifer system in the Pingtung Plain in Taiwan [60]. The model results revealed all layers of the aquifer were affected by the intrusion, but the top and bottom are affected more than the middle one. Another study used FEFLOW to model the pumping of brackish water from the intrusion zone to regulate the aquifer’s seawater intrusion in Wadi Ham, U.A.E. [61]. Different simulation scenarios were run to achieve optimal pumping locations and rates. The findings showed a rise in groundwater salinity concentration under the non-pumping scenario when compared with the pumping scenario. SEWAT-2000, a paired MODFLOW-2000 and MT3DMS 5.2, was used by [62] to simulate 3D varying density subsurface water flow and multi-species transport in a coastal aquifer in Karnataka, India. A study was conducted for seawater intrusion in the lower alluvial plain of the Wadi Ham catchment, located in the Fujairah Emirate in the UAE, by using the finite element-based flow and solute transport model (SUTRA), in which artificial recharge is used for managing the infiltration of seawater into coastal aquifer systems, thus preventing the further deterioration of the quality of groundwater [63]. Using a newly established multi-layered system, the Nile Delta aquifer was simulated to obtain clearer knowledge of the intrusion of saltwater into the aquifer scheme by collecting all fresh information on an aquifer’s heterogeneity and hydrochemistry by using the SEWAT program [64]. MODFLOW and MT3D were utilized to model the flow of groundwater and analyze the issue of seawater intrusion in Wadi Ham and potential mitigation schemes [12]. The developed model was used to study the effects of pumping and artificial recharge on seawater intrusion. The model results indicated that, by reducing the pumping from the Kalba well field, the seawater intrusion in the south-eastern part of the aquifer can be slowed. The experimental and numerical methods were used to study the sub-surface water quality in the central part of the Nile Delta, which was fertile agricultural land and densely populated. Considering the unsteady and three-dimensional flow, MODFLOW and MT3DMS were used for modeling [65]. A study on the Wadi Ham aquifer used FEFLOW to simulate the intrusion of seawater under transient conditions [28]. It was evident from the study that a reduction of 50% in the pumping rates will have a decisive impact and will help in reducing saltwater intrusion and improving the quality of groundwater. Conversely, any increase in the rate of water abstraction would enhance the rate of salinity intrusion and would cause the quality of the groundwater to deteriorate further. The SUTRA model was employed to study the effect of climate change and SLR on the salinity intrusion in the coastal groundwater system of South Korea [66]. The findings revealed that, for an accurate assessment of climate change’s impacts on seawater intrusion in coastal groundwater systems, both the freshwater recharge rates and Sea Level Rise (SLR) should be taken into account.
A case study was performed in the northern karst aquifer, Qatar, utilizing MODFLOW 2000 [67]. The number, positions, and distribution of pilot points in the results of model calibration were studied. The findings showed that, given the same number of points and uniform placement, the pilot points performed better than randomly placed points. Visual MODFLOW was employed to study the depleting level of groundwater of the Saq aquifer located in the Qasim area in Saudi Arabia [68]. The model results emphasized that the runoff, which was wasted previously, could be stored in the existing pond due to artificial recharge, which would also help in boosting the aquifer’s life by 3%. If no preventive measure is taken and pumping continues, the water head in the region will drop by more than 65.0 m in the next three decades. MODFLOW was also used to conduct groundwater modeling of the Saq Aquifer, Saudi Arabia. Water demands have been increasing continuously in the Buraydah area, due to which the pumping of groundwater and the number of drilled wells has increased to an alarming situation, resulting in the depletion of the water head by 1.10 m per year. It was concluded that, if the current pumping rates increased by 10% per 10-year period, the water table would deplete by 33.5 m in the next 27 years [69].
4. Methodology
4.1. Conceptual Model
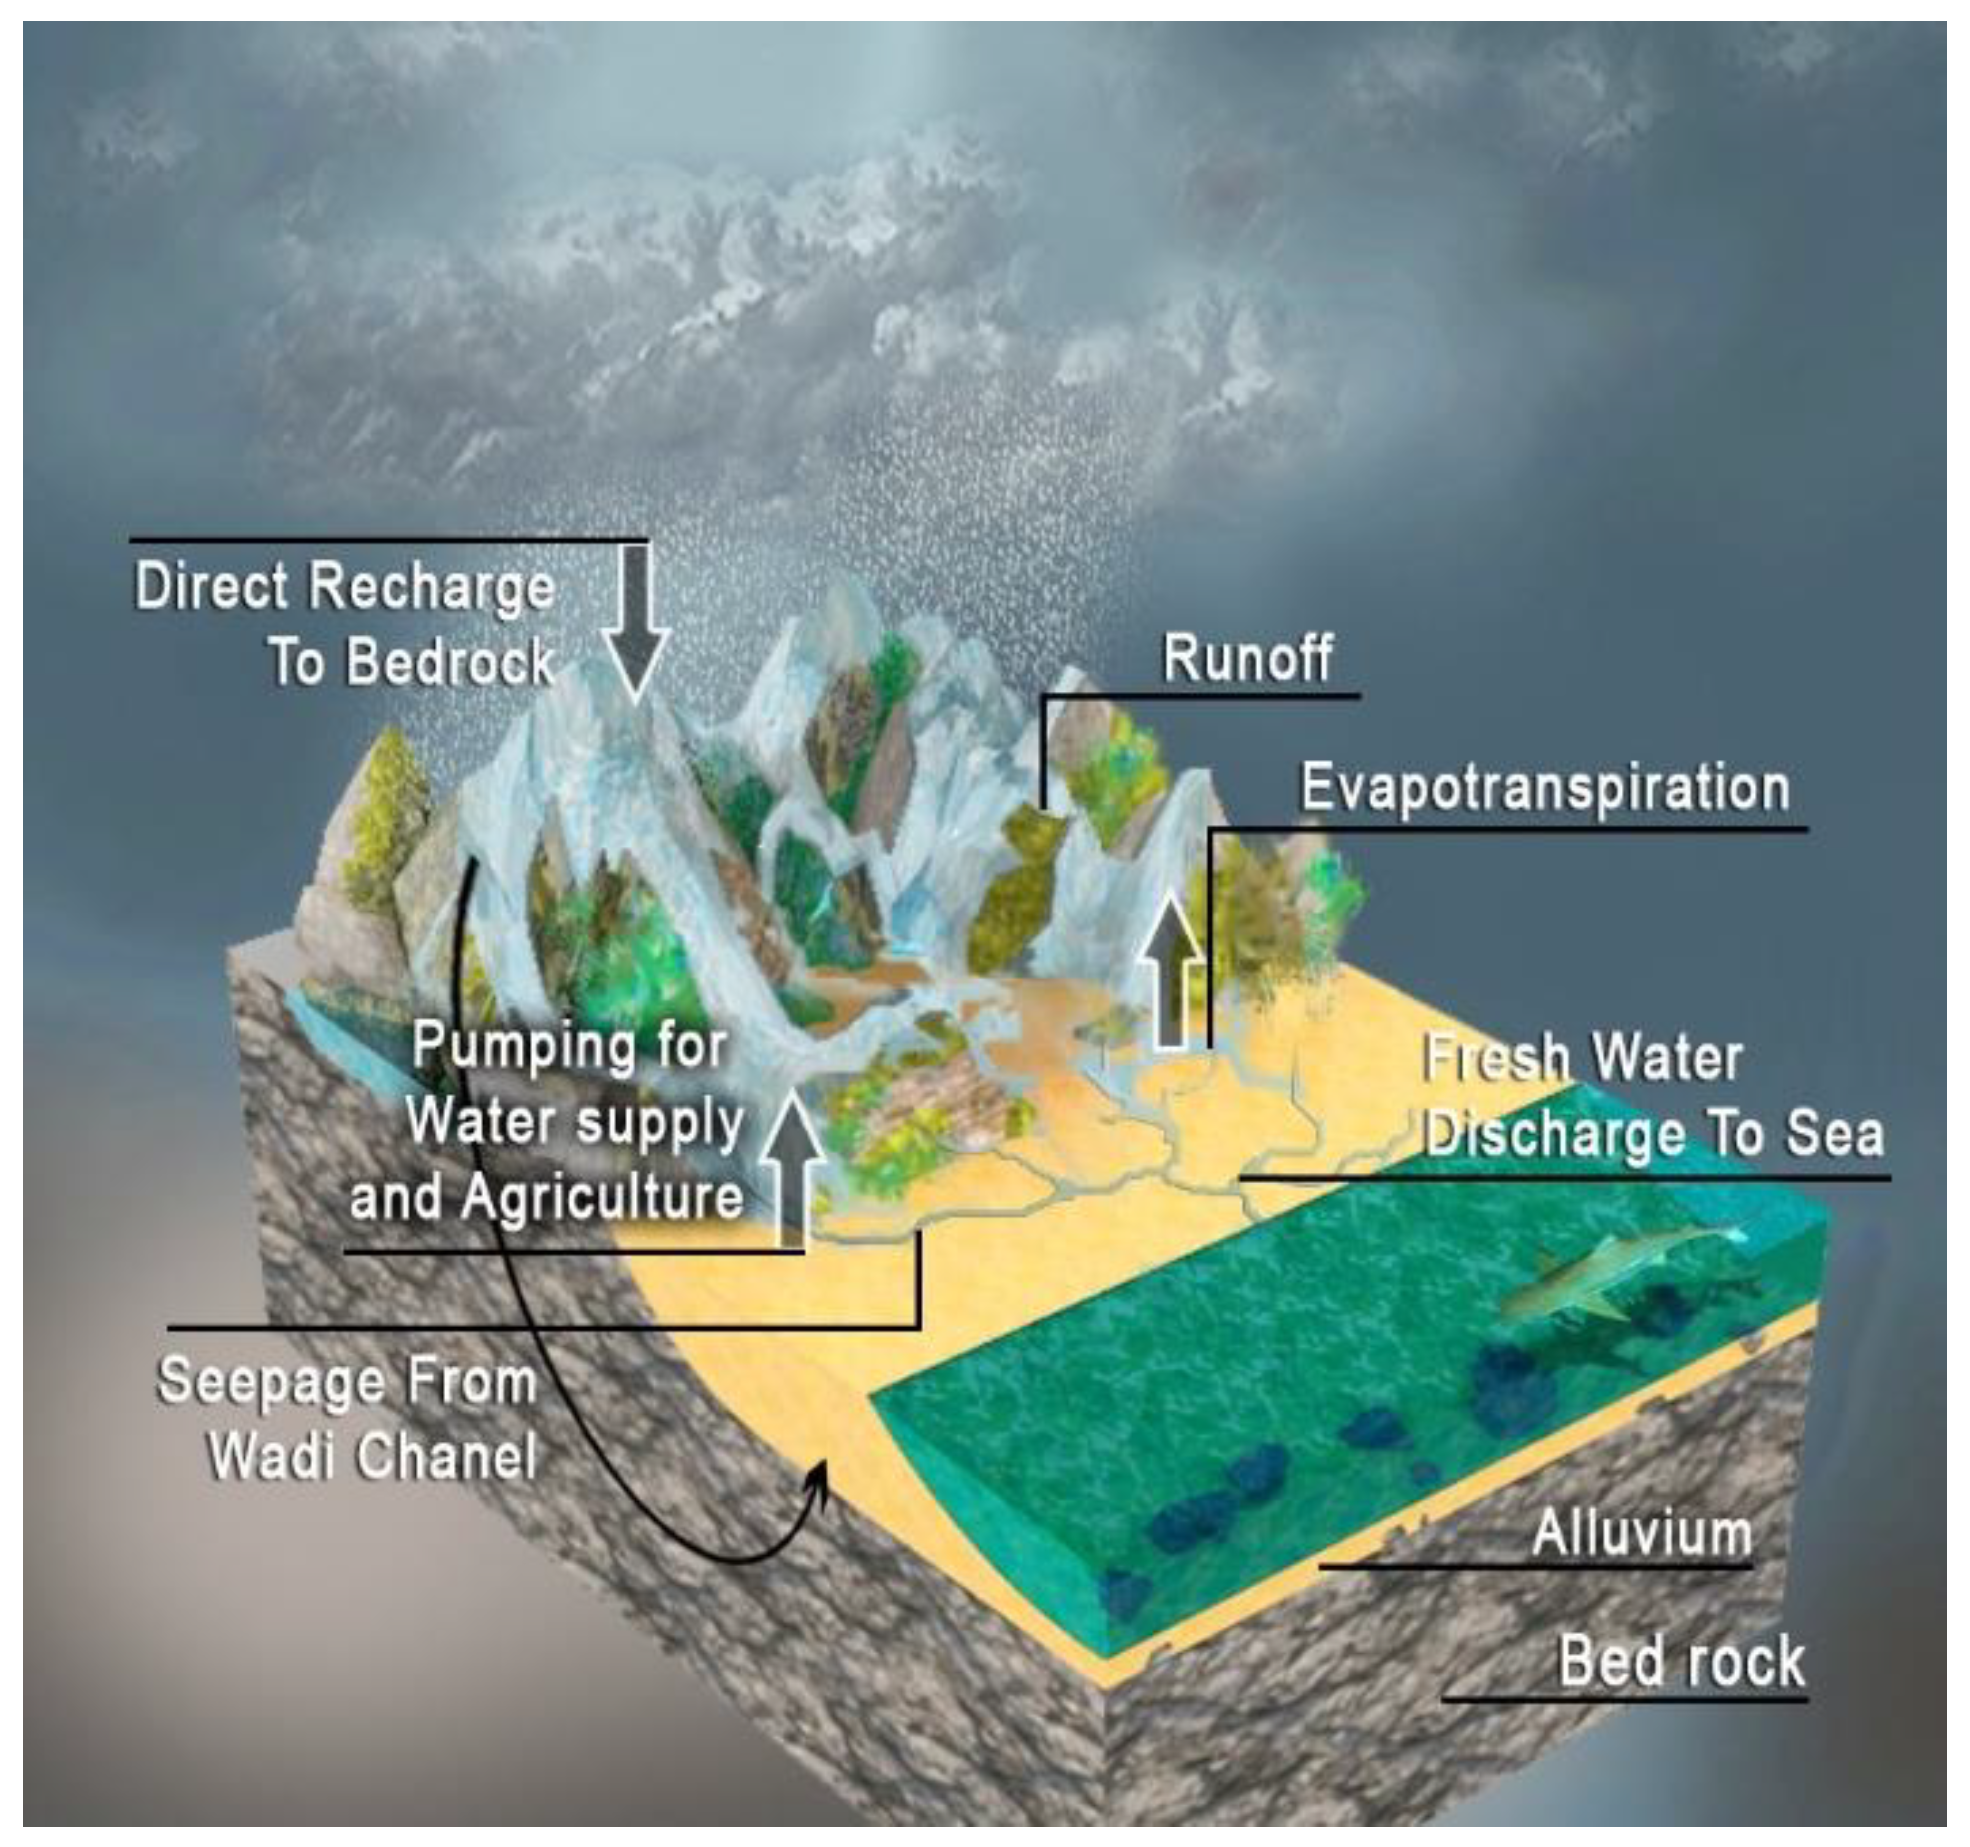
A conceptual model can be created by utilizing the geological and hydrogeological data of the aquifer under study and is an idealized representation of our hydrogeological understanding of the important flow processes of a system [56]. The groundwater flow system was represented in three dimensions using a two-layered conceptual model that considered the geological and hydrogeological information available for the study area (Figure 3).
Only 43% of rain is thought to directly replenish aquifers; the remainder either evaporates or runs off as surface runoff into the ocean. Much of the recharge of the groundwater system for model simulation comes from precipitation infiltration. The recharge rate for a steady state was calculated to be 0.0013581 m/day using the rainfall in the year 2000, based on the water balance of the study area [70]. There was a total of 22 pumping wells that encompassed the model domain. There were no publicly accessible records for the private pumping wells in the study region that could be used to estimate their pumping rates. However, the Public Authority for Water (PAW), Oman, which oversees the Sohar Development Office (SDO), had some information from the domestic water supply wells [70].
4.2. Numerical Model
The Groundwater Modeling System (GMS), which contains MODFLOW and MT3DMS for the processes of groundwater flow and solute transport, respectively, was employed in the current work. The governing equation in MODFLOW is shown in Equation (1).
where Kxx, Kyy, and Kzz are values of hydraulic conductivity (LT−1) along the x, y, and z coordinate axes (assumed to be parallel to the major axes of hydraulic conductivity); h is the potentiometric head (L); W is a volumetric flux per unit volume (T−1) representing the sources and/or sinks of water, with W < 0.0 for outflow from the groundwater system and W > 0.0 for inflow; Ss is the specific storage of the porous material (L−1); and t is time (T). This equation, combined with appropriate boundary and initial conditions, describes transient 3D groundwater flow in a heterogeneous and anisotropic medium, provided that the principal axes of hydraulic conductivity are aligned with the coordinate directions.
Details about the model and information regarding the studies that utilized MODFLOW can be found in [71,72]. The results obtained from MODFLOW for groundwater flow characteristics can be used to run MT3DMS. which is an advanced version of the 3D Mass Transport Model, MT3D, developed by [73]. The model is capable of modeling advection in steady and transient flow fields, anisotropic dispersion, first-order decay and production reactions, and linear and nonlinear sorption. MT3DMS is based on the general equation of mass transport, as shown in Equation (2):
where C is the concentration of solute (salinity in the present case) (ML−3); Dxx, Dyy, and Dzz are the dispersion coefficients (L2T−1) in the x, y, and z directions, respectively; V is the average pore water velocity (LT−1); qs is the volume flowrate per unit volume of the aquifer, which is positive for fluid sources and negative for sinks (T−1); Cs is the concentration of the fluid source or sink (ML−3); R is the retardation factor; and µ is the decay coefficient. For the simulation of salinity by MT3DMS, the decay constant is equal to zero; therefore, µRC = 0.
5. Results and Discussion
5.1. Steady-State Groundwater Flow Simulation
The groundwater flow model was calibrated primarily under steady-state conditions for the year 2000. The observed groundwater elevations are available every month (most of the time). Here, the average value over the year 2000 was used for steady-state calibration. For the steady-state model, trial-and-error modifications of hydraulic conductivity values were used until the observed and computed values matched in a subset of nine observation wells scattered across the model domain. In the observation wells, a difference of ±1.5 m between the observed and simulated values for the water level was deemed acceptable. More details about the model calibration can be found in [70]. Table 3 shows the calibrated results in the steady state for the year 2000 with a Root-Mean-Square Error (RMSE) of 0.65.
5.2. Transient-State Model Calibration and Validation
Based on the initial conditions of the steady-state results, the transient model simulation was carried out from 2000–2017. Details about the transient model calibration and validation can be found in [73]. After the calibration and validation of the groundwater flow model, it was used for various prediction scenarios of the pumping rate increments and reductions and the sea level rise due to climatic changes [70].
5.3. Transient State Solute Transport Model Calibration and Validation
The transient model was calibrated and validated from 2000–2016, comparing the observed salinity values with the calculated values for selected 20 monitoring wells in the study area. Salinity data from the monitoring wells operated by the Ministry of Regional Municipality, Environment, and Water Resources (MRMEWR) were used. Figure 4 shows the locations of the selected salinity monitoring wells in the model domain. To mimic the actual variation in the model parameters, the model domain was divided into a number of zones and the model parameters were assigned to each zone separately. The model domain was divided into five zones (Zone 1 to Zone 5) for groundwater modeling (MODFLOW). Zone 1 and Zone 2 were adjacent to the coastline and more susceptible to the salinity intrusion, and were sub-divided into three parts each to obtain a clear picture of salinity intrusion. Zone 1 was divided into three parts (1A, 1B, and 1C) with average widths of 592 m, 678 m, and 515 m, respectively. Meanwhile, Zone 2 was also divided into three subdivisions (2A, 2B, and 2C) with average widths of 731 m, 653 m, and 840 m, respectively.
Calibration was performed by trial and error to achieve the appropriate degree of correlation between the observed and the model’s measured average concentrations by changing the aquifer’s initial concentration, porosity, and longitudinal dispersity. Initial estimates of these values were based on the soil type and the available literature. The hydrological parameters porosity, longitudinal dispersivity, ratio of transverse dispersivity to longitudinal dispersivity, and ratio of vertical dispersivity to longitudinal dispersivity were calibrated by the trial-and-error method. The calibration led up to 0.6 for porosity and up to 14,000 for longitudinal dispersivity near the coast, and lower values moving toward the upper reaches. Table 4 highlighted the calibrated geo-hydrological parameters, such as the porosity, longitudinal dispersivity, ratio of horizonal dispersivity to the longitudinal dispersivity, and ratio of vertical transmissivity to the longitudinal dispersivity, used for the transient simulation. A total of 17 stress periods were used, with 12 time steps in each month and a multiplier of 1, resulting in 6209 days. Validation involved the simulation of longitudinal dispersivity, along with the pumping and recharge rate.
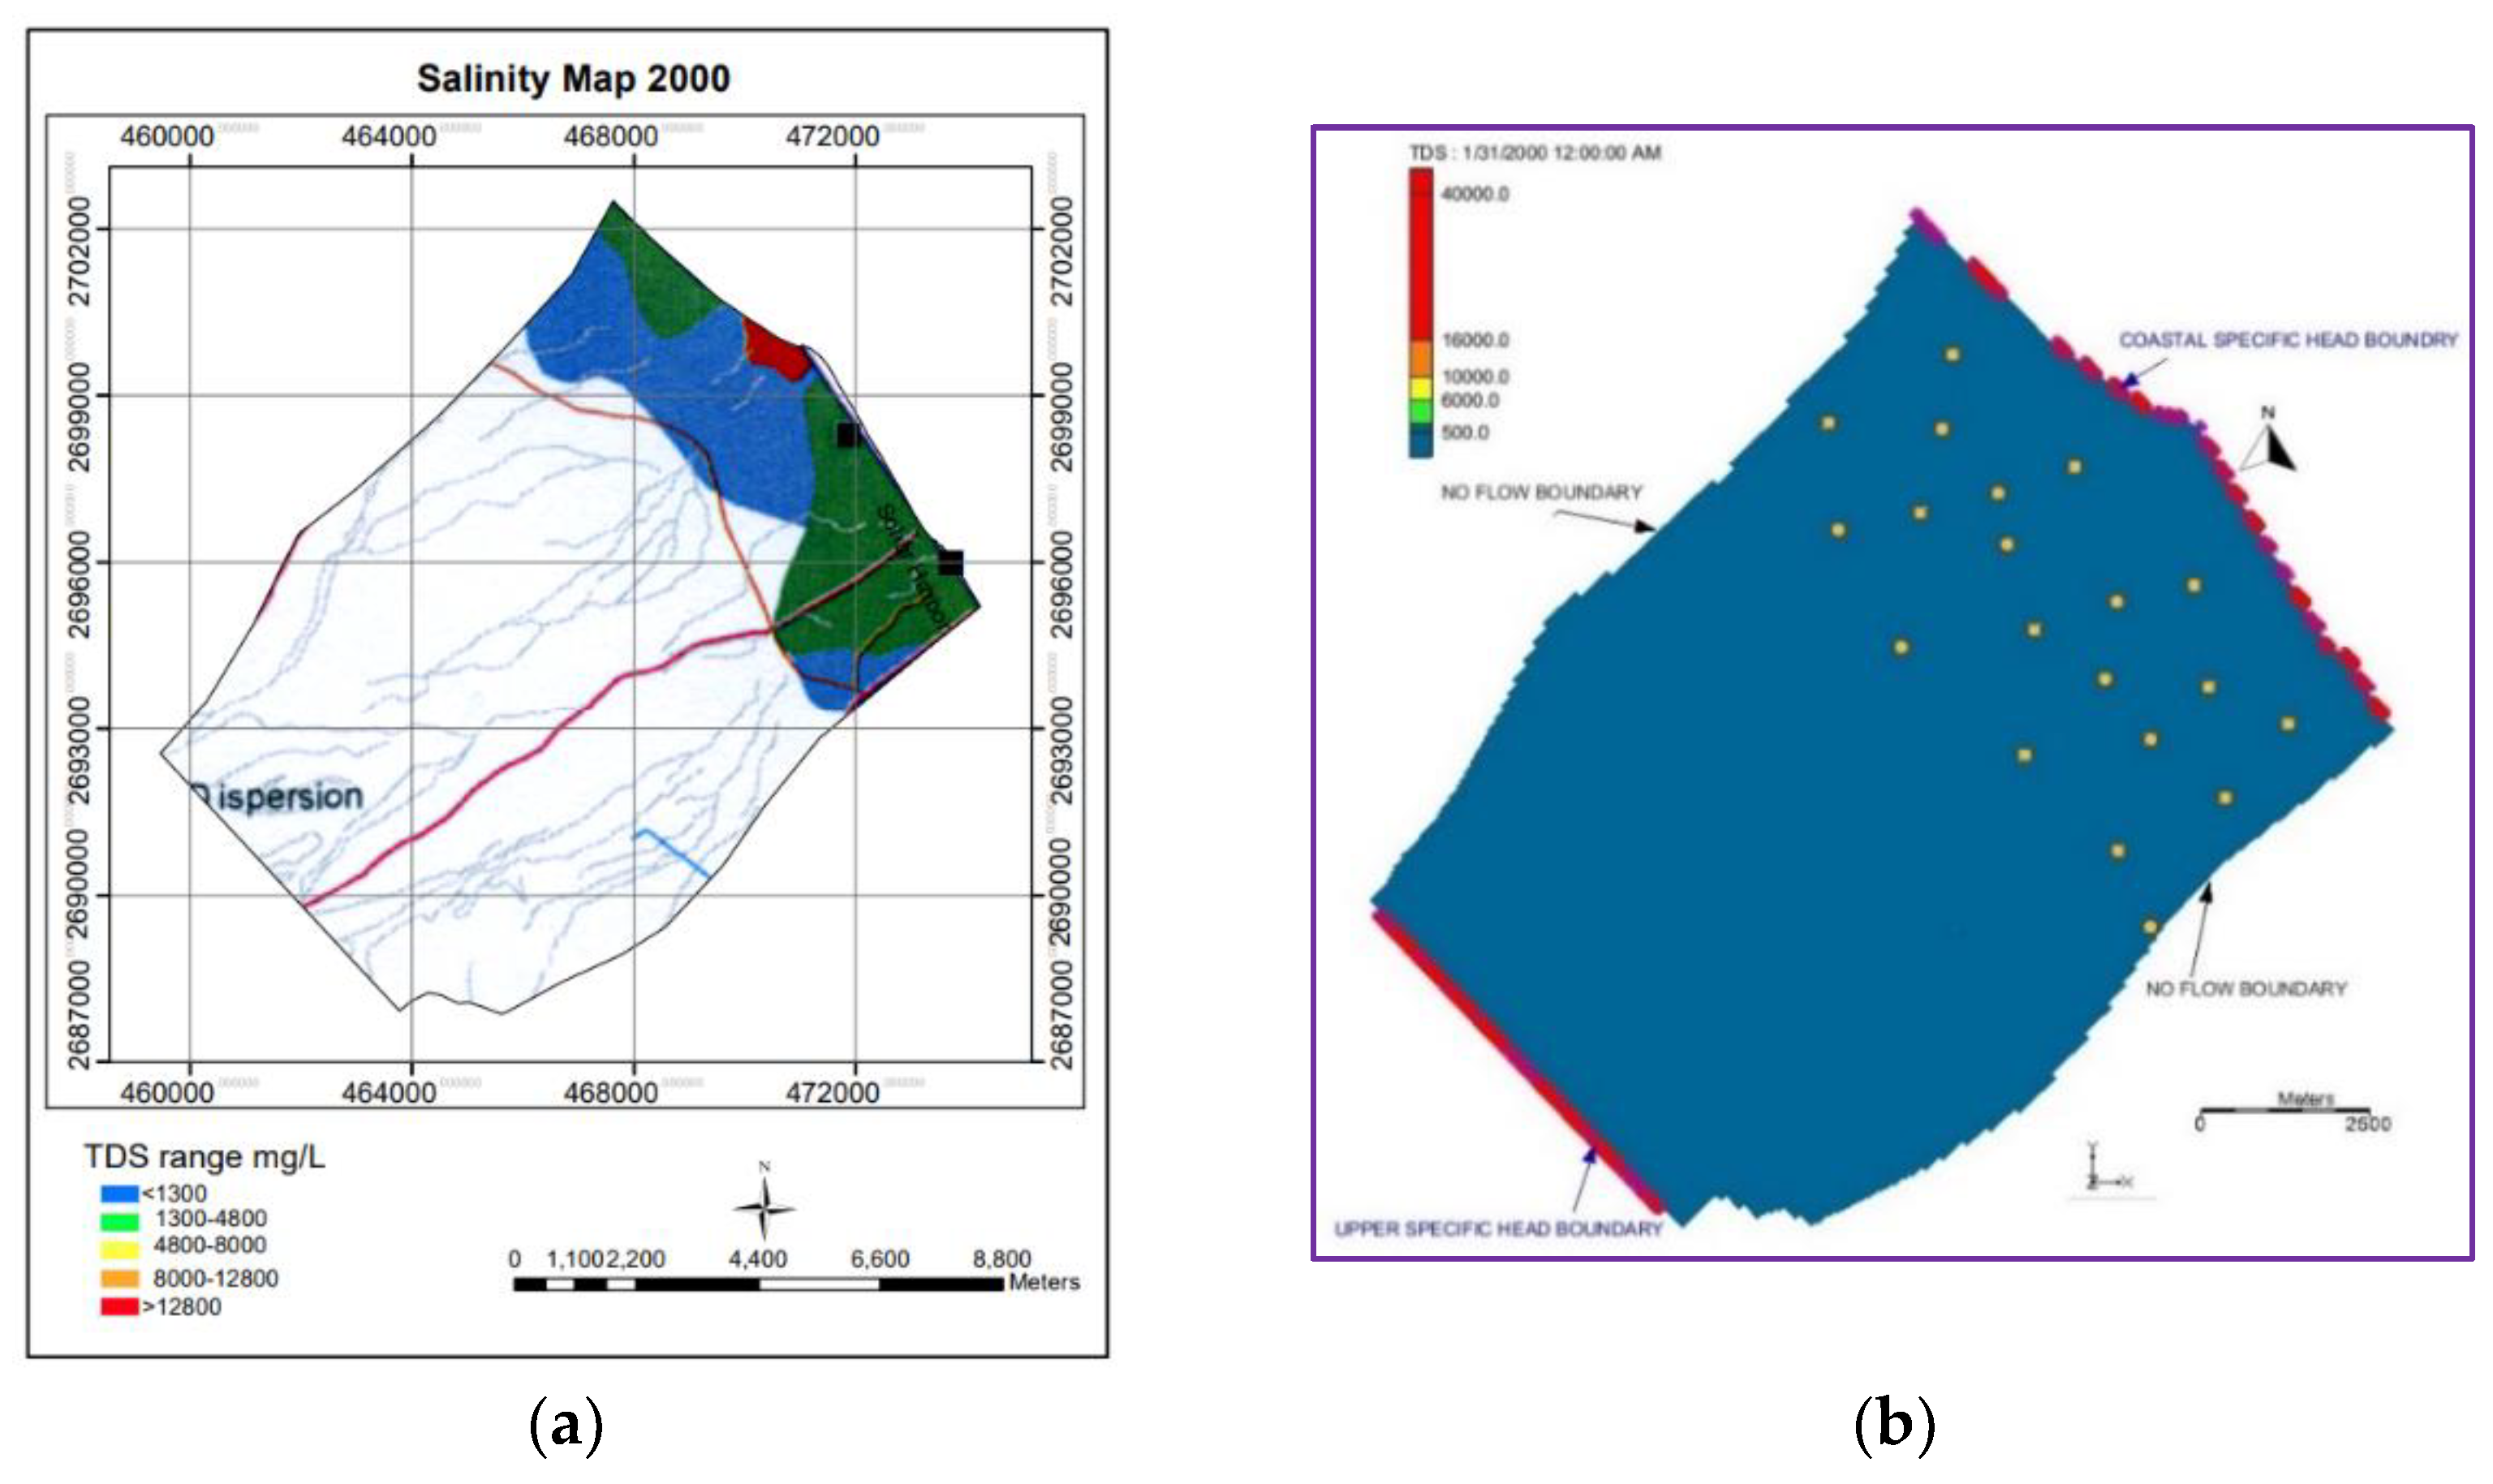
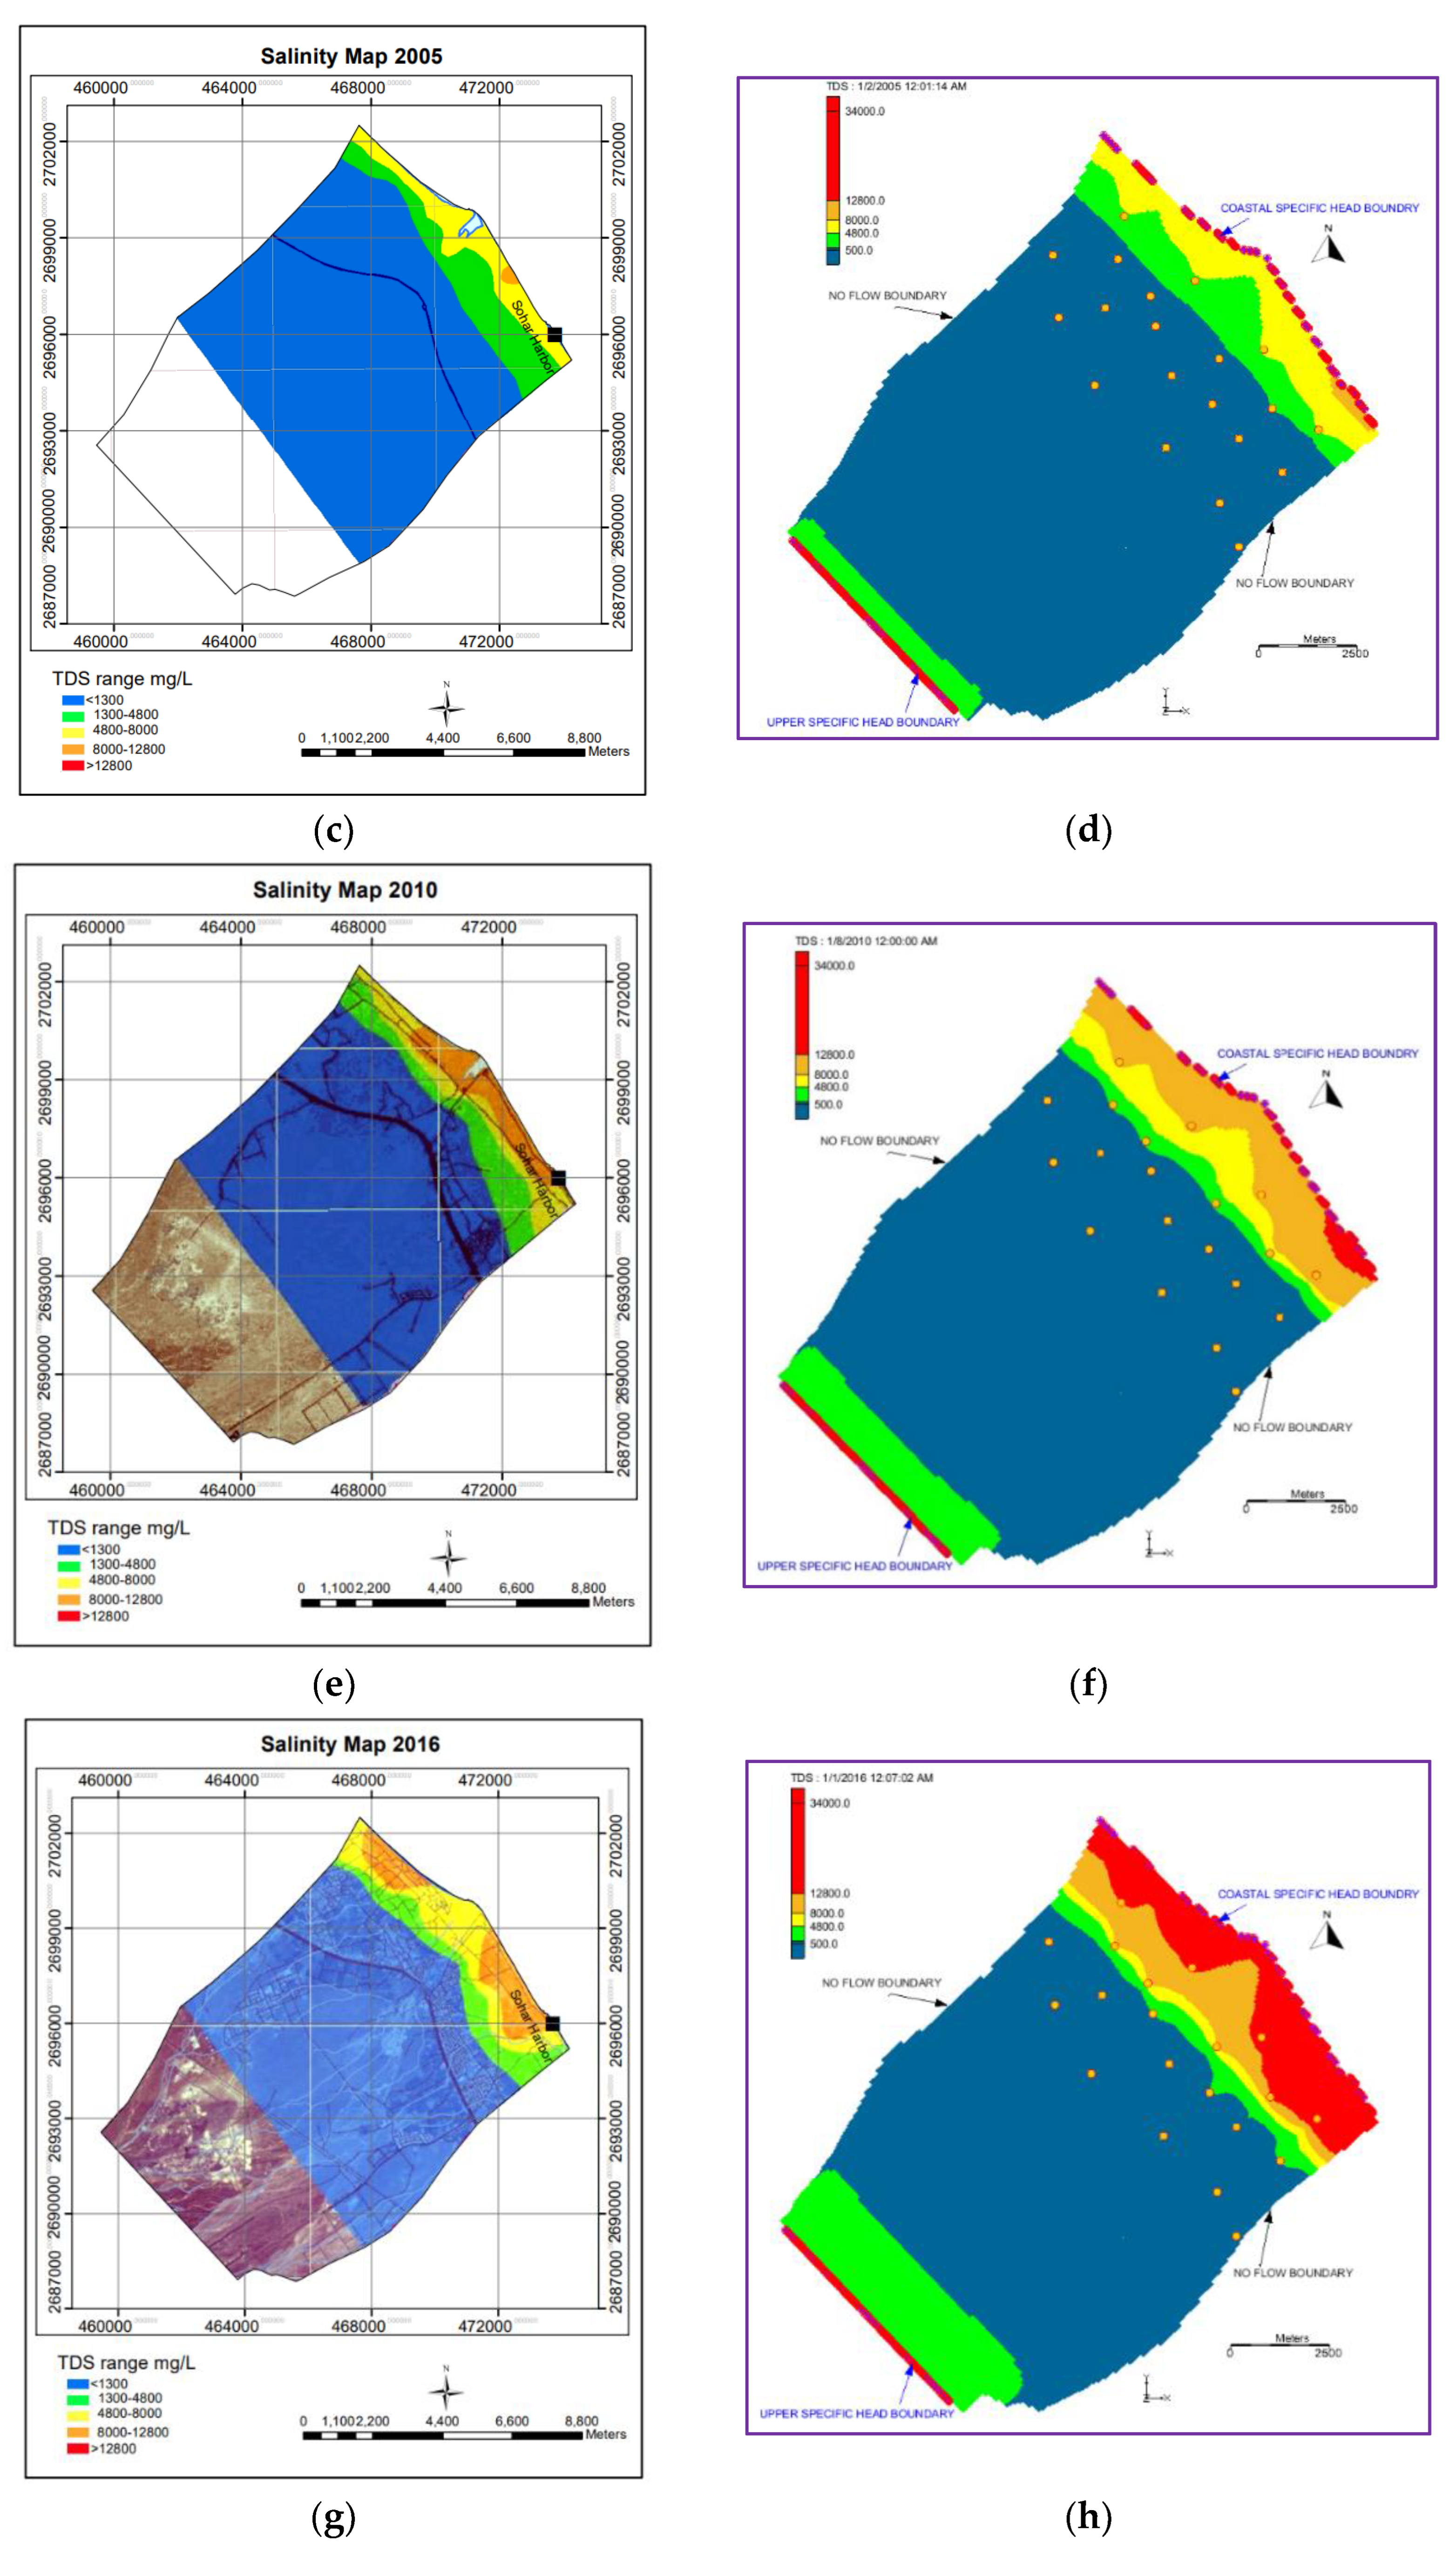
Figure 5 shows the computed salinity contours for the years 2000, 2005, 2010, and 2016, respectively. The observed values of the TDS recorded by MRMWR are also shown. In the year 2000, the observed salinity contours extended around 2.0 km (TDS 1300–4800 mg/L) from the shoreline (Figure 5a), whereas the model simulation showed TDS < 1300 mg/L for the whole modeled area (Figure 5b). The comparison between the observed and computed salinity is subject to a certain degree of bias due to the conversion of EC to the salinity using an empirical relationship. However, qualitative comparisons can be made, as conducted in the present study.
In the years 2005 (Figure 5c,d), 2010 (Figure 5e,f), and 2016 (Figure 5g,h), a good qualitative agreement was observed between the observed and computed salinity distributions throughout the area.
After the validation of the model, various management scenarios were studied to mitigate the seawater intrusion in the Wadi Al-Jizi aquifer.
5.4. Effect of Pumping Rates on Seawater Intrusion
Owing to the population increase and better quality of life, the trend of freshwater consumption is consistently increasing in Oman. The model was used to assess the impact of increasing or decreasing (as a result of water conservation efforts) pumping rates on salinity intrusion. To study the pumping impact, rates in the year 2017 were considered as the baseline pumping rates, and increases of 10%, 20%, and 30% from the baseline pumping rates of 2017 were considered. Moreover, decreases of 5% and 10% from the baseline pumping rates were considered. These increased or decreased rates were considered for all 22 pumping wells used in the model domain. The pumping scenarios were considered for the period between 2018–2040. The simulated groundwater levels in all cases of pumping scenarios were compared against the levels under normal pumping rates at different wells. It is clear that salinity will move inland with the increase in the pumping rates and retreat if pumping rates are decreased. However, the numerical model can predict the extent of seawater intrusion with reasonable accuracy if it is properly calibrated and validated.
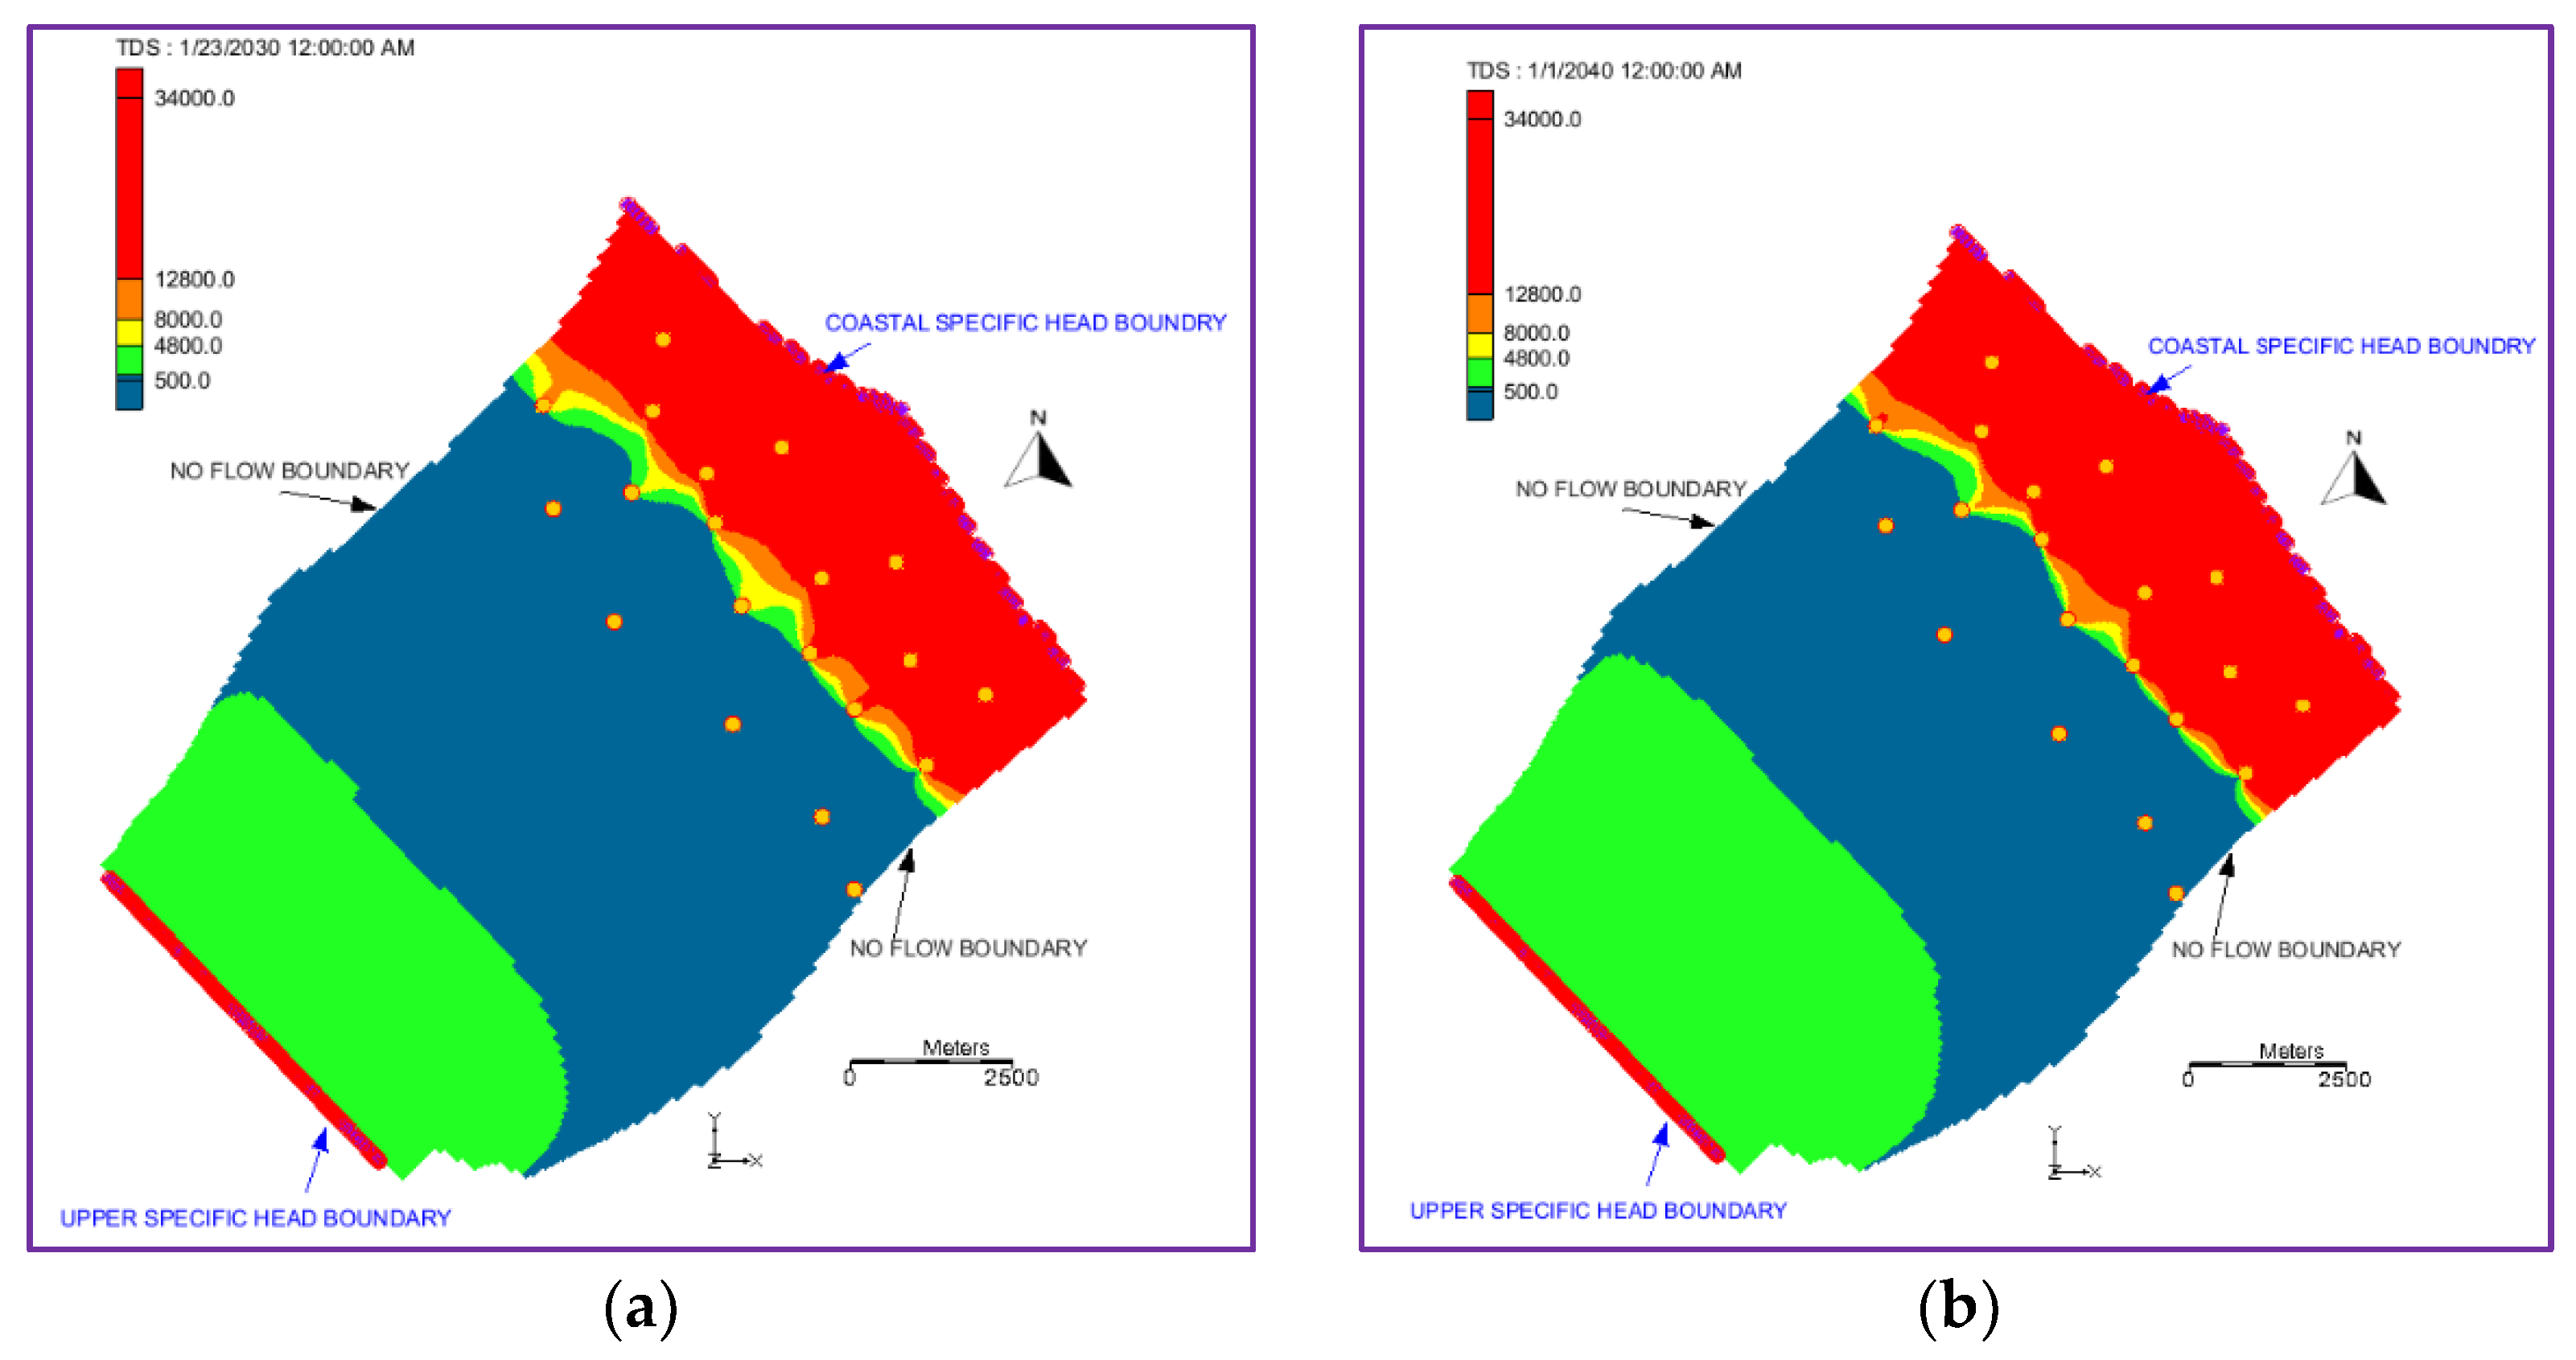
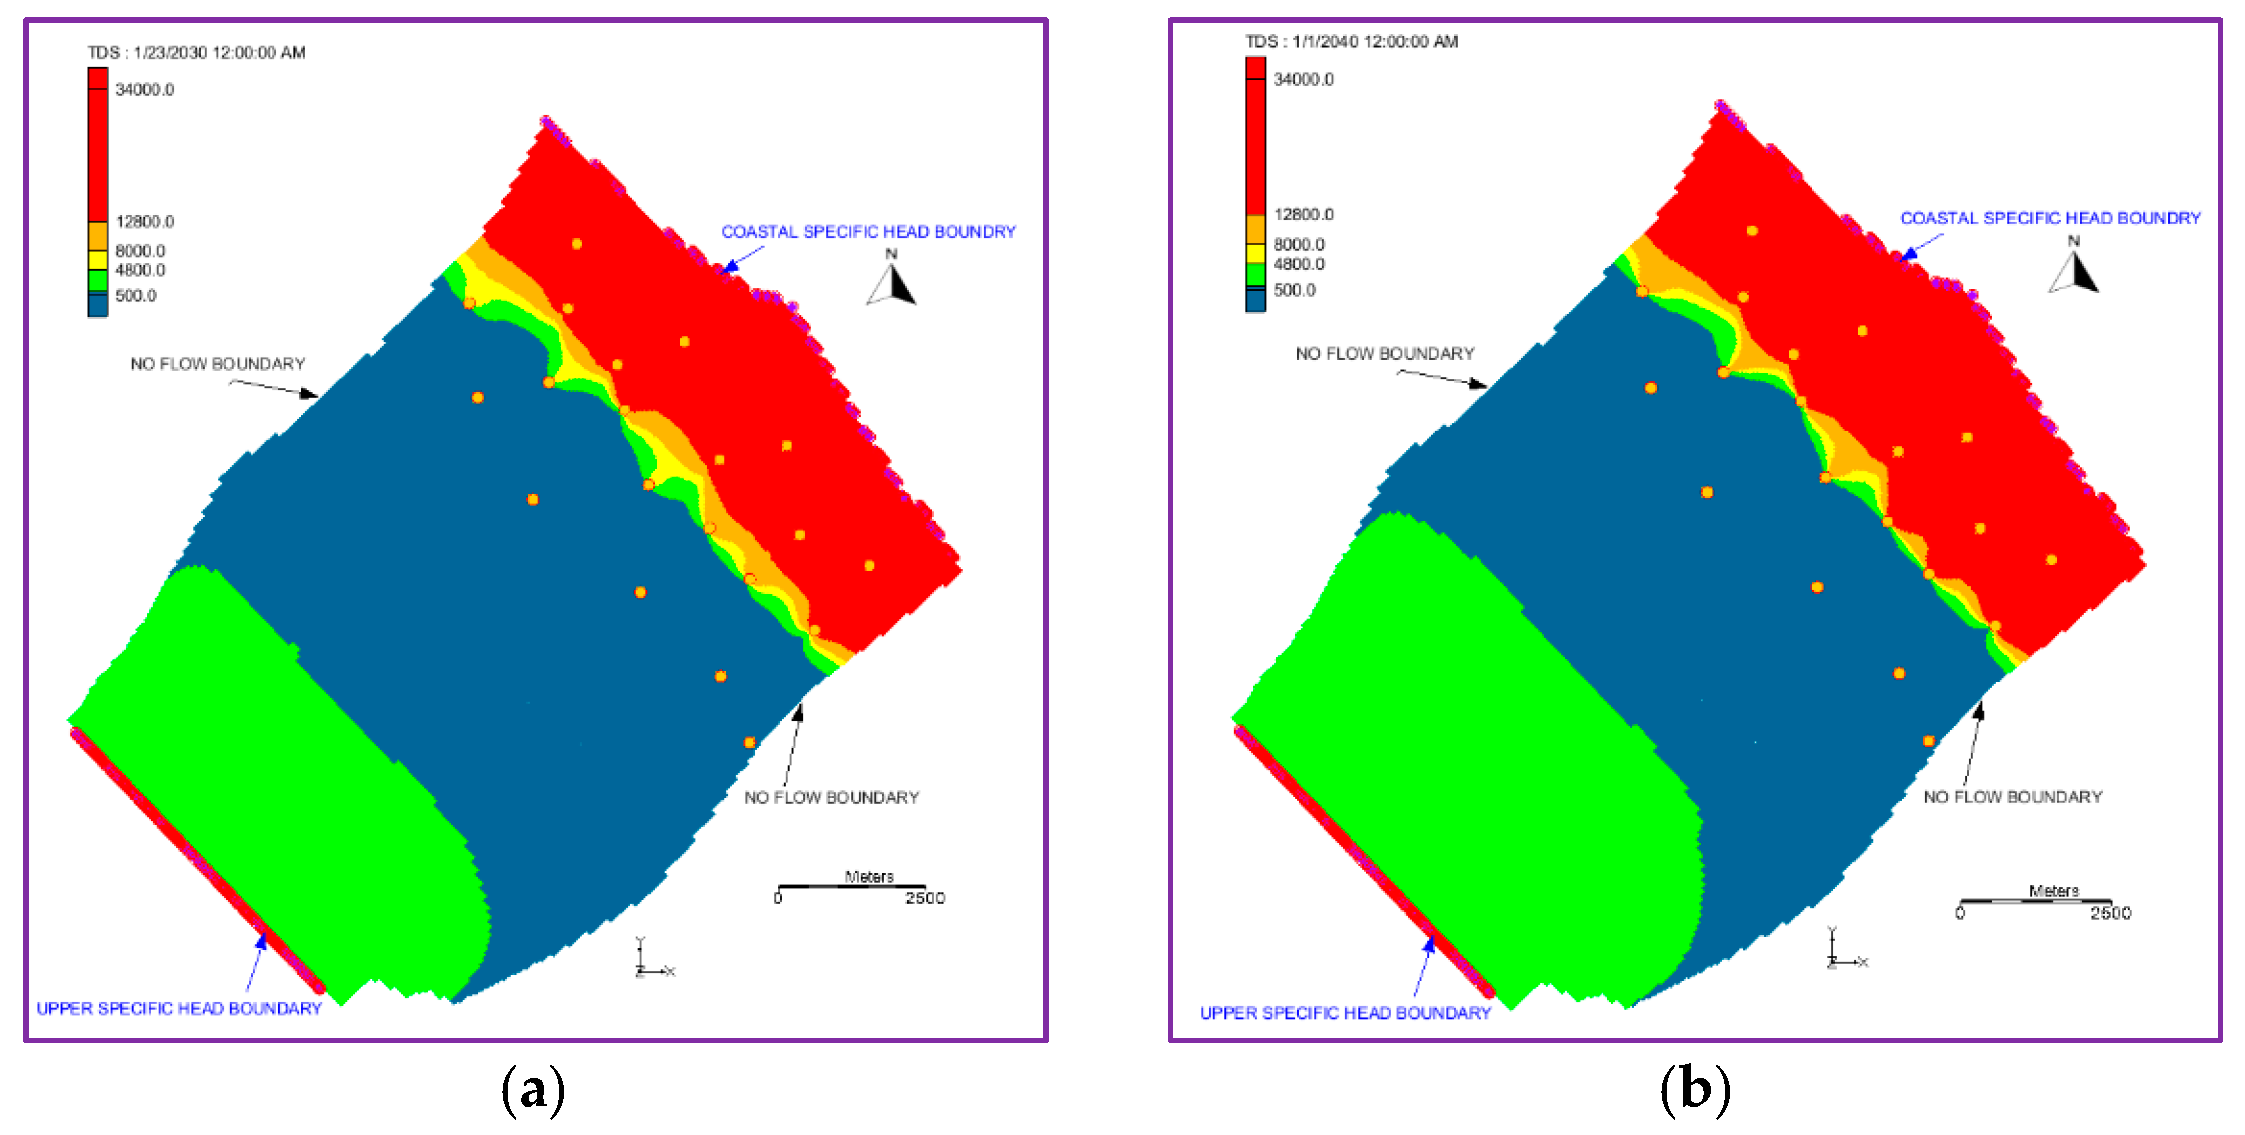
In this case, the rate of water abstraction from the year 2017 was considered to remain constant for all of the future years until 2040 (Scenario-1). Figure 6 shows the predicted salinity intrusion contours in the Wadi Al-Jizi aquifer for the years 2030 and 2040. From the salinity contours using the model results, the saline water with a TDS of >12,800 mg/L was observed to intrude landward by the average distances of 2.39 km and 2.56 km in the years 2030 and 2040, respectively.
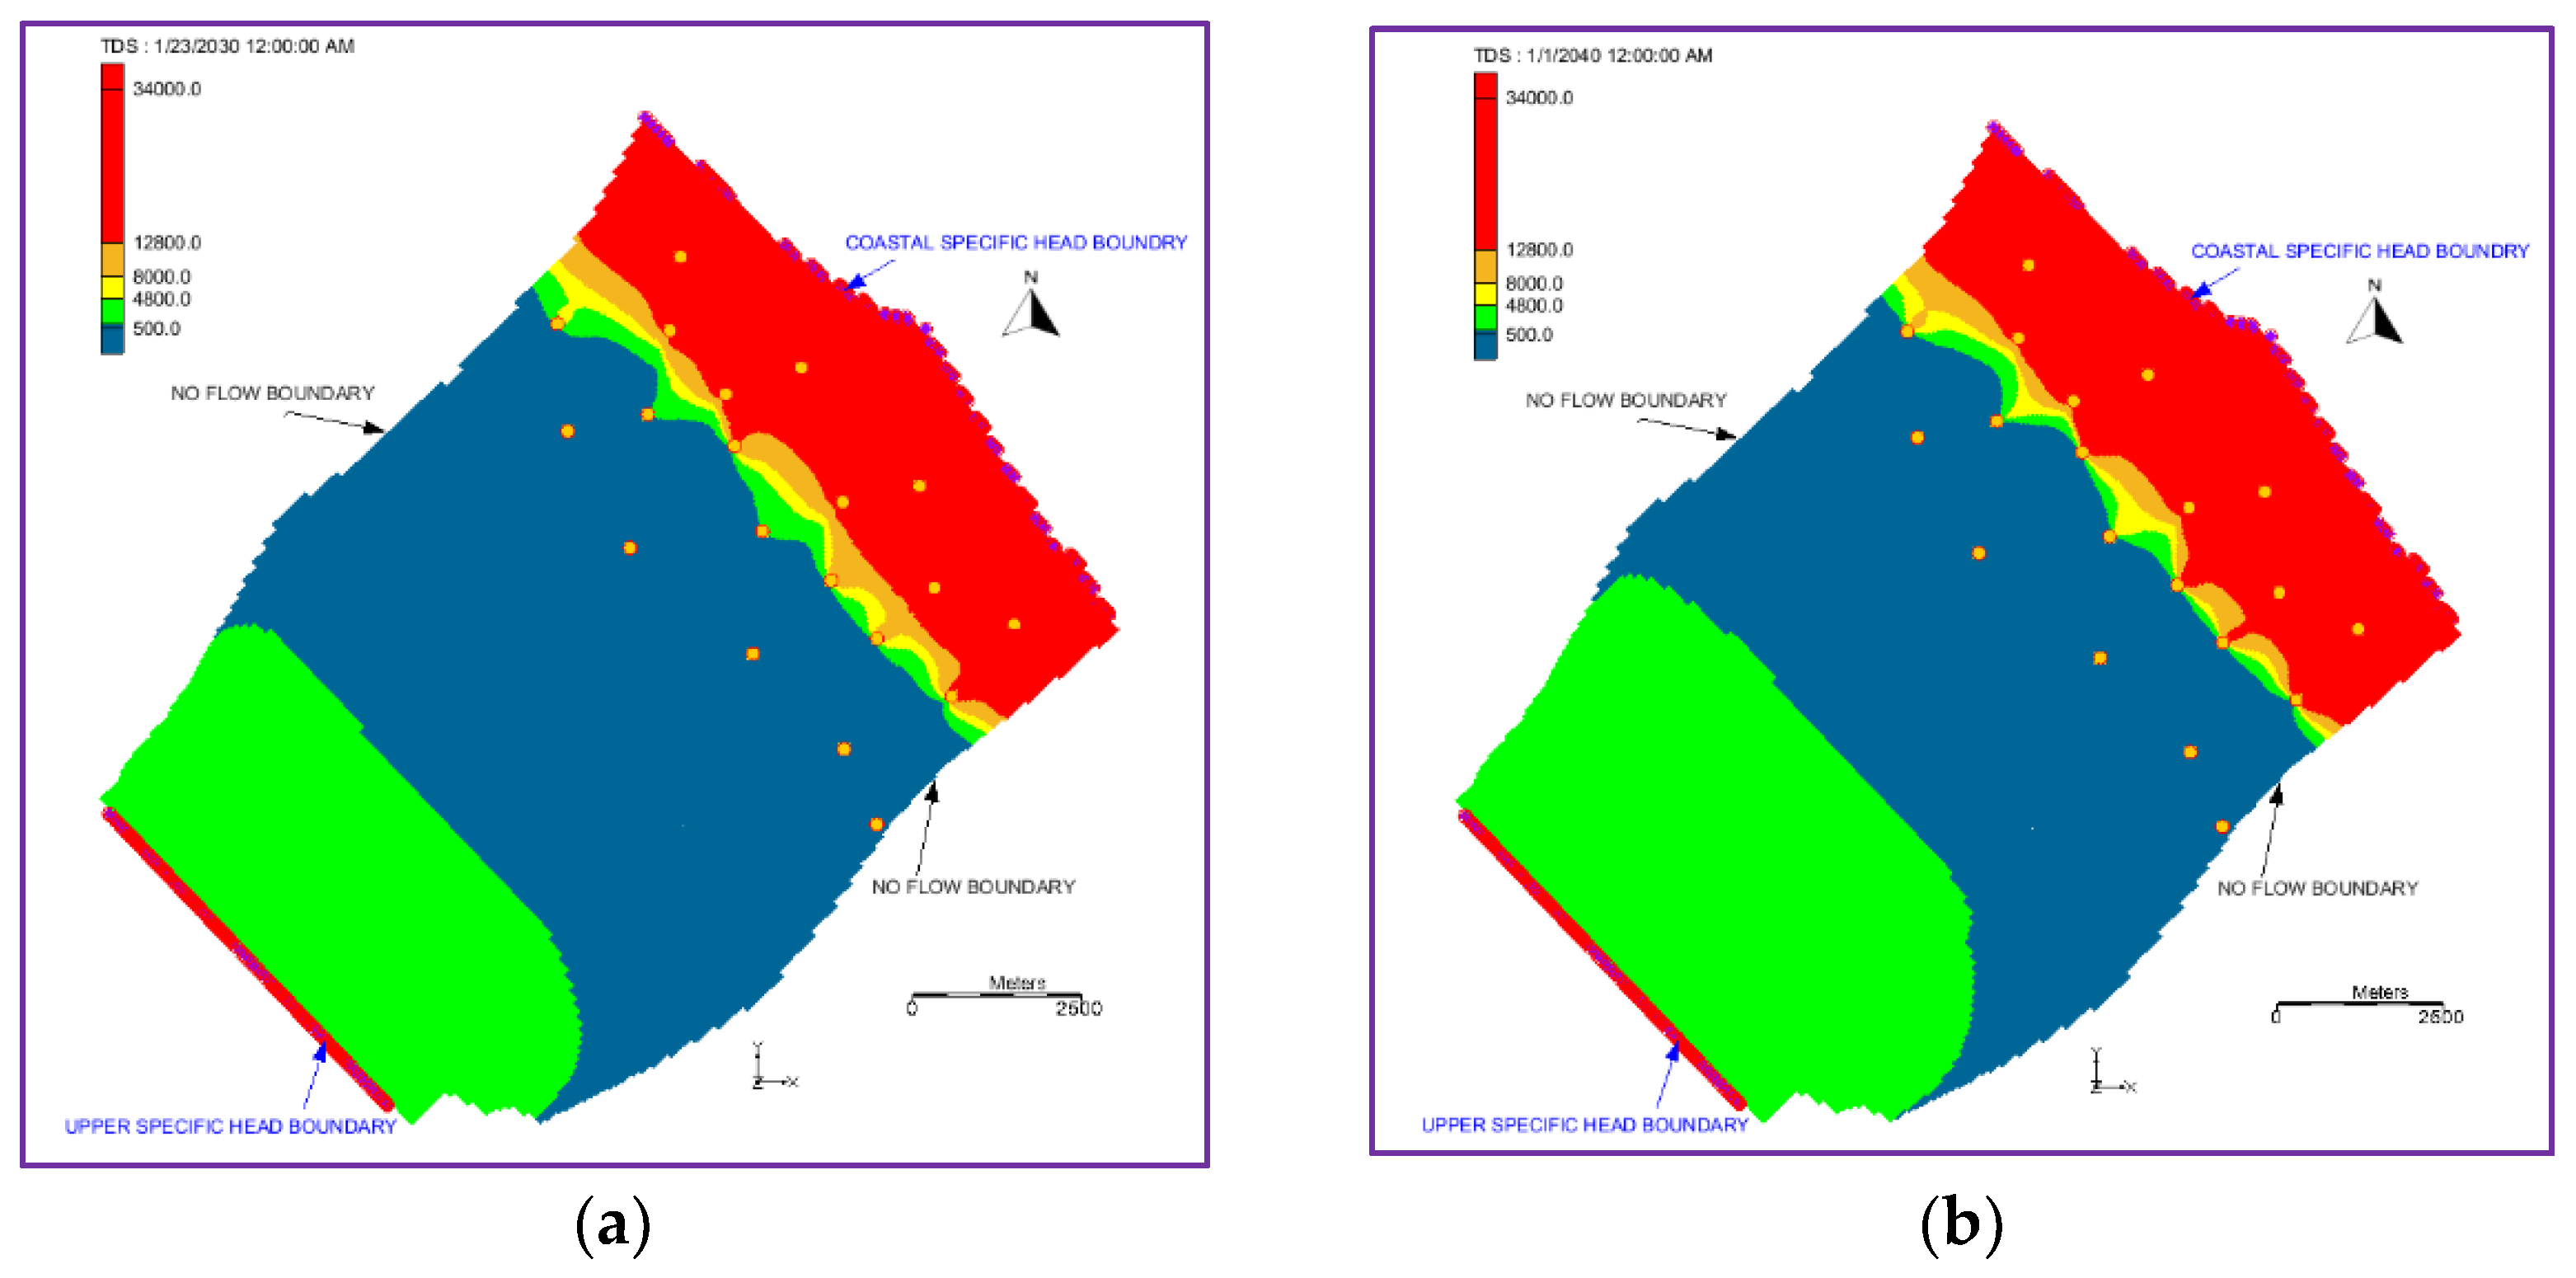
For the pumping rates increased by 10% with respect to the baseline pumping rate of 2017 (Scenario-2), the saline water would intrude inland to average distances of 2.42 km and 2.57 km in the years 2030 and 2040, respectively (Figure 7). In other words, a 10% increase in pumping rates from those in the year 2017 will not cause a significant deterioration in the next 20 years. However, when the pumping rates are increased by 20% with respect to the baseline pumping rate of 2017 (Scenario-3), the salinity would intrude inland at average distances of 2.58 km and 2.65 km in the years 2030 and 2040, respectively (Figure 8).
For a further increase in the pumping rates (30% with respect to the baseline pumping rate of 2017), shown as Scenario-4, the salinity seemed to intrude landward at average distances of 2.37 km and 2.69 km in the years 2030 and 2040, respectively.
A reduction in pumping rates was also considered in response to the possibility of water conservation regulations and practices promoted by authorities. Scenario-5 represents a 5% decrease in the pumping rates from those in the year 2017. The salinity for Scenario-5 would retreat in the Wadi Jizi aquifer for the years 2030 and 2040. From the salinity contours, the salinity would intrude landward by average distances of 2.19 km and 2.41 km for the years 2030 and 2040, respectively. In Scenario-6 (10% reduction in the abstraction rates of the year 2017), the salinity would reach the landward side by average distances of 2.12 km and 2.15 km in the years 2030 and 2040 respectively.
5.5. Effect of Climate Change on Seawater Intrusion
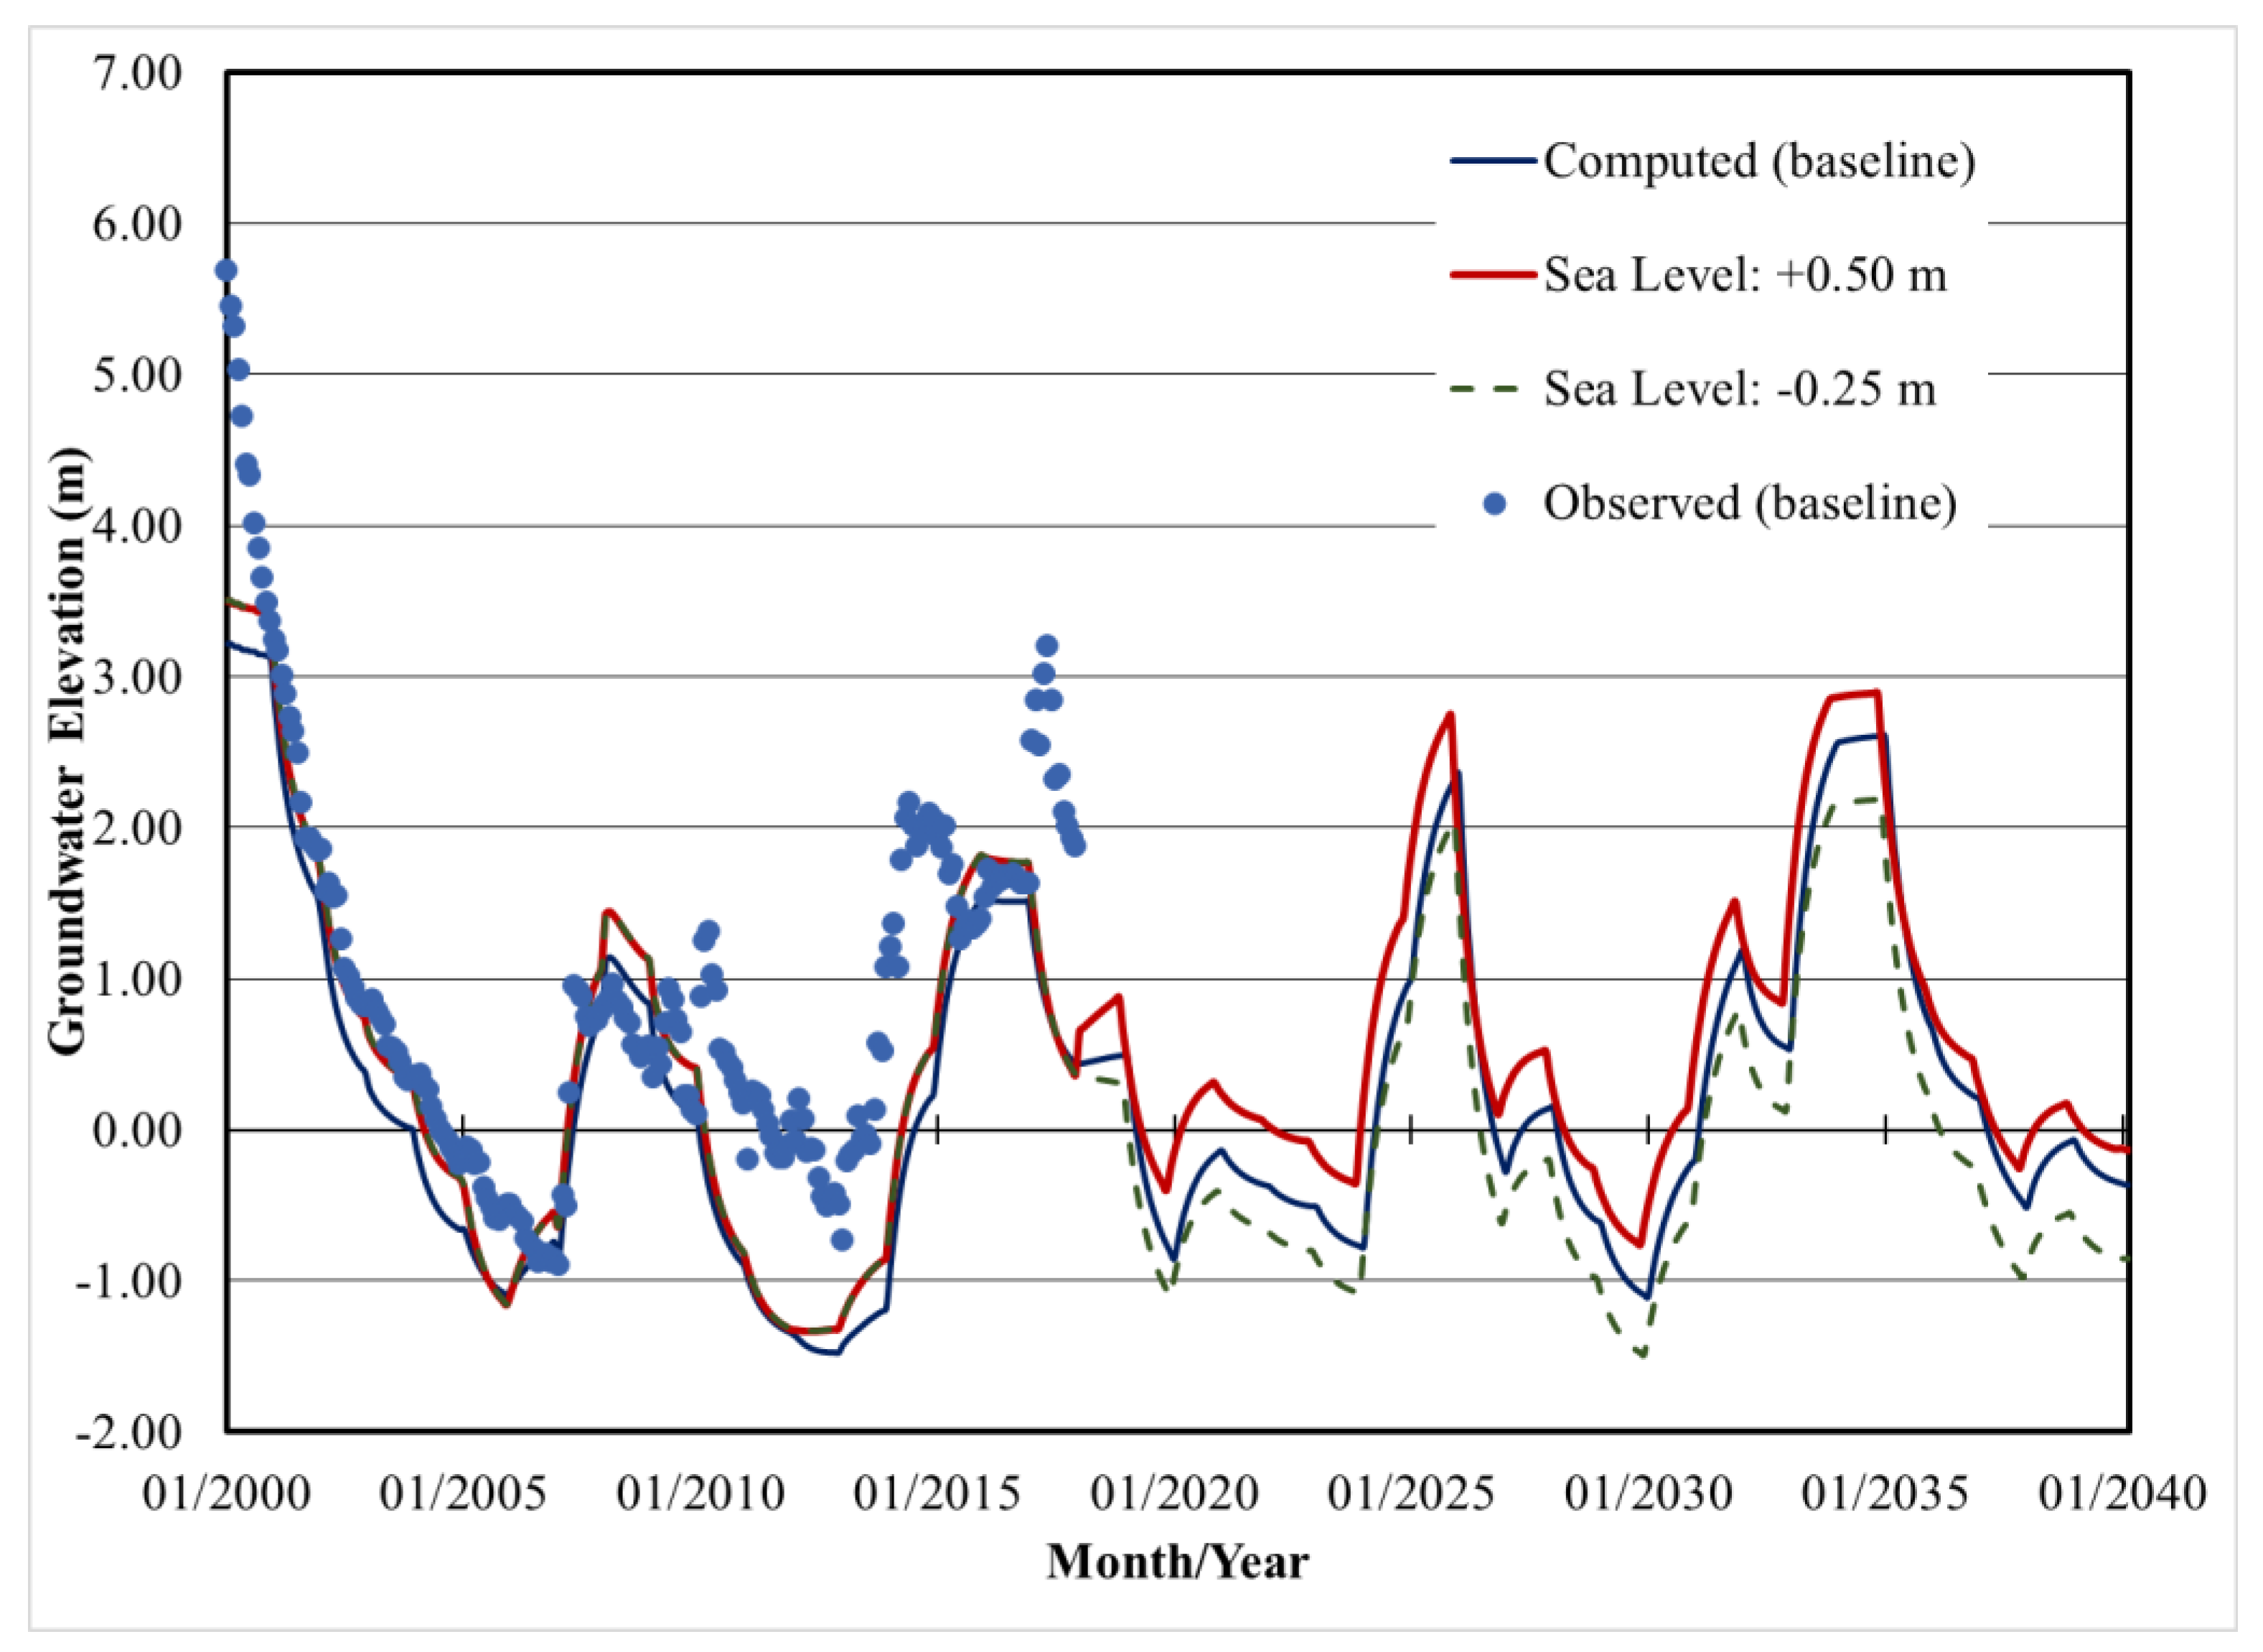
The developed model was applied to simulate seawater intrusion in the Wadi Al-Jizi aquifer considering the sea level rise due to climatic change. The prediction of sea level rise as per the IPCC (Inter-Governmental Panel on Climatic Change) [74] and the other possible changes in the sea level (+0.25 m, +0.50 m, and −0.25 m with respect to the base sea level) were considered to simulate seawater intrusion in the study area. The pumping rates in the year 2017 were kept constant and continued until 2040. The modeled groundwater elevations were observed to rise with the sea level rise. Similarly, the groundwater elevations fell in response to the fall of sea level (Figure 9). It is clear that the sea level rise would cause more seawater intrusion as compared with the baseline situation (groundwater elevations in the year 2017). However, to estimate the spatial and temporal movements of the seawater intrusion, MT3DMS was used.
The sea level rise was considered as per RCP (8.5) (Scenario-7) mentioned in the Annual Report-5 of the IPCC [74]. As per RCP (8.5), a gradual increase of 0.31 m (0.26–0.42 m) was applied to the baseline sea level (0.65 m) for the transient model. The predictive scenario values were applied gradually from 2018–2040. The salinity contours for the years 2030 and 2040 were plotted to observe the impacts of sea level in the study area as per the IPCC prediction. The salinity intruded inland by average distances of 2.60 km and 2.63 km in the years 2030 and 2040, respectively. Similarly, a rise of 0.25 m above the baseline sea level (Scenario-8) resulted in salinity intrusion landward at average distances of 2.60 km and 2.65 km in the years 2030 and 2040, respectively. A rise of 0.50 m added to the baseline sea level (0.65 m) (Scenario-9) and a reduction of 0.25 m in the baseline sea level due to the possibility of sea level fall in the study area (Scenario-10) were considered. The results of all these scenarios are summarized in Table 5.
An increase in the abstraction rate of approximately 20% (Scenario-3) will cause almost the same extent of seawater intrusion as that caused by a sea level rise as per IPCC predictions (Scenario-7).
6. Conclusions
A numerical model is a reasonably accurate and economical tool to simulate and predict the head and quality of groundwater in coastal aquifers if it is properly calibrated using the available measurements of heads, pumping rates, and boundary conditions. The calibrated geo-hydrological parameters can then be used to validate the model for another set of measured data. Finally, predictions of the groundwater elevations and quality can be made for any anticipated situation occurring in the future. The Wadi Al-Jizi coastal aquifer is facing seawater intrusion along the coastal boundary. The seawater front changes sporadically as a result of seasonal recharge patterns, the ensuing groundwater level oscillations, and decreases in freshwater discharge to the sea, according to salinity contour maps based on the measured data. These salinity contour maps revealed that the seawater front moves transiently because of seasonal recharge patterns and the consequent groundwater table fluctuations and reductions in the freshwater discharge to the sea. The salinity concentrations in groundwater in most of the monitoring wells have increased when compared with historical data, indicating that the plain aquifer’s groundwater quality is consistently deteriorating due to seawater intrusion. A consistent water deficit in the watershed due to agricultural activities is also aggravating the situation. If the baseline pumping rates of the year 2017 continue until the year 2040, salinity intrusion (TDS > 12,800 mg/L) will encroach inland by 0.80 km. However, anticipated increases in the abstraction rates will result in further intrusion. On the other hand, if the public authorities reduce the water deficit through water conservation policies and strictly implement them, the saline wedge might retreat by the year 2040. Another phenomenon that will increase seawater intrusion is the sea level rise. The IPCC scenario showed saline wedge intrusion 0.70 km inland in the year 2040 when compared with the results of the year 2017. Sea level rises of 0.25 m and 0.50 m also showed further seawater intrusion. In case of a drop in the sea level by 0.25 m, the seawater will recede in the year 2040. The results of a GIS-based study of groundwater potential [41] may be updated using the modeling results from the present study. Improved groundwater development and aquifer management measures (monitoring and control of abstraction rates and water rationing schemes, promoting agricultural products using brackish water, and recharging aquifers with recycled water) would be necessary to supplement the increasing water demands and safeguard the rapidly contaminating groundwater aquifers from seawater intrusion.
Author Contributions
J.A.: Conceptualization, original draft, model implementation, and numerical modeling. A.S.: Data curation, resources, writing—review and editing, and supervision. S.M.T.: Supervision and data curation. H.T.: Review and editing. All authors have read and agreed to the published version of the manuscript.
Funding
This research received no external funding.
Institutional Review Board Statement
Not applicable.
Informed Consent Statement
Not applicable.
Data Availability Statement
The datasets used during and/or analyzed during the current study are available from the corresponding author on reasonable request.
Acknowledgments
The authors acknowledge the Environment Authority, Oman, for providing the groundwater elevations and groundwater quality data.
Conflicts of Interest
The authors declare no conflict of interest.
References
- World Health Organization (WHO). Comprehensive Assessment of the Freshwater Resources of the World; WHO: Geneva, Switzerland, 1997; p. 34. [Google Scholar]
- Al-Taani, A.A.; Batayneh, A.; Mogren, S.; Nazzal, Y.; Ghrefat, H.; Zaman, H.; Elawadi, E. Groundwater Quality of Coastal Aquifer Systems in the Eastern Coast of the Gulf of Aqaba, Saudi Arabia. J. Appl. Sci. Agric. 2013, 8, 768–778. [Google Scholar]
- Al-Naeem, A.A. Effect of Excess Pumping on Groundwater Salinity and Water Level in Hail Region of Saudi Arabia. Res. J. Environ. Toxicol. 2014, 8, 124–135, ISSN 1819-3420. [Google Scholar] [CrossRef] [Green Version]
- Josep, M.P.; Giorgio, G.; Gabriele, U. Seawater intrusion and coastal groundwater resources management. Examples from two Mediterranean regions: Catalonia and Sardinia. Contrib. Sci. 2014, 10, 171–184. [Google Scholar] [CrossRef]
- Baalousha, H.M. Development of a groundwater flow model for the highly parameterized Qatar aquifers. Model Earth Syst. Environ. 2016, 2, 67. [Google Scholar] [CrossRef] [Green Version]
- Hussain, M.S.; Elhamid, H.F.A.; Javadi, A.A.; Sherif, M.M. Management of Seawater Intrusion in Coastal Aquifers: A Review. Water 2019, 11, 2467. [Google Scholar] [CrossRef] [Green Version]
- Singhal, B.B.S.; Gupta, R.P. Applied Hydrogeology of Fractured Rocks; Springer Science: Berlin, Germany, 2010. [Google Scholar] [CrossRef] [Green Version]
- Mazzonia, A.; Heggy, E.; Scabbia, G. Forecasting water budget deficits and groundwater depletion in the main fossil aquifer systems in North Africa and the Arabian Peninsula. Glob. Environ. Chang. 2018, 53, 157–173. [Google Scholar] [CrossRef]
- Mogren, S. Saltwater Intrusion in Jizan Coastal Zone, Southwest Saudi Arabia, Inferred from Geoelectric Resistivity Survey. Int. J. Geosci. 2015, 6, 286–297. [Google Scholar] [CrossRef] [Green Version]
- Prusty, P.; Farooq, S.H. Seawater intrusion in the coastal aquifers of India—A review. HydroResearch 2020, 3, 61–74. [Google Scholar] [CrossRef]
- Sana, A.; Al Shibli, S.H. Modeling of Seawater Intrusion into a Coastal Aquifer in the Sultanate of Oman. In Proceedings of the 30th Congress of International Association for Hydro-Environment Research (IAHR 2003), Thessaloniki, Greece, 24–29 August 2003; pp. 581–588. [Google Scholar]
- Sherif, M.; Al-Mulla, M.; Shetty, A. Seawater Intrusion Assessment and Mitigation in the Coastal Aquifer of Wadi Ham. In Groundwater in the Coastal Zones of Asia-Pacific, Coastal Research Library 7; Springer: New York, NY, USA, 2013. [Google Scholar] [CrossRef]
- Stoeckl, L.; Walther, M.; Morgan, L.K. Physical and Numerical Modelling of Post-Pumping Seawater Intrusion. Hindawi Geofluids 2019, 2019, 7191370. [Google Scholar] [CrossRef]
- Al Barwani, A.; Helmi, T. Seawater Intrusion in Coastal Aquifer: A Case Study for the Area between As Seeb and As Suwaiq (1984–2005). In International Conference on Economic Incentives and Water Demand Management; United Nations Education Scientific and Cultural Organization (UNESCO): Paris, France, 2006. [Google Scholar]
- Abulibdeh, A.; Al Awadhi, T.; Al Bolushi, A.; Abdelghani, M. Spatiotemporal mapping of groundwater salinity in Al-Batinah, Oman. Groundw. Sustain. Manag. 2021, 12, 100551. [Google Scholar] [CrossRef]
- Walther, M.; Delfs, J.O.; Grundmann, J.; Kolditz, O.; Liedl, R. Saltwater intrusion modeling: Verification and application to an agricultural coastal arid region in Oman. J. Comput. Appl. Math. 2012, 236, 4798–4809. [Google Scholar] [CrossRef] [Green Version]
- Young, M.E.; Bruign, R.G.M.; Al Ismaily, A.S. Exploration of an Alluvial aquifer in Oman by time-domain electromagnetic sounding. Hydrogeol. J. 1998, 6, 383–393. [Google Scholar] [CrossRef]
- Lakey, R.; Easton, P.; Hinai, A.H. Eastern Batinah Water Resources Assessment—The International Conference on Water Resources Management in Arid Countries Proceedings. Muscat. Sultanate of Oman; The library of the General Directorate of Regional Municipality, Environment and Water Resources in North of Al Batinah: Sohar, Oman, 1995. [Google Scholar]
- Weyhenmeyer, C.E.; Stephen, J.B.; Niklaus, W.H. Isotope study of moisture sources, recharge areas, and groundwater flow paths within the Eastern Batinah coastal plain, Sultanate of Oman. Water Resour. Res. 2002, 38, 1184. [Google Scholar] [CrossRef]
- Sana ABaawain, M.; Al Sabti, A. Feasibility Study of Using Treated Wastewater to Mitigate Seawater Intrusion along Northern Coast of Oman. Int. J. Water Resour. Arid. Environ. 2013, 3, 56. [Google Scholar]
- Ministry of Water Resources (MWR). Seawater Intrusion Beneath the Batinah Coast. In the Batinah Coast Salinity Intrusion Periodical Monitoring Results 1983–1995; Library of the General Directorate of Regional Municipality, Environment and Water Resources in North of Al-Batinah: Sohar, Oman, 1996. [Google Scholar]
- Ministry of Regional Municipalities, Environment and Water Resources (MRMEWR). National Water Resources Master Plan, Unpublished Report. 2000.
- Ministry of Water Resources (MWR). Al Batinah Salinity Report 97–99; Library of the General Directorate of Regional Municipality, Environment and Water Resources in North of Al Batinah: Sohar, Oman, 2000. [Google Scholar]
- Kwarteng, A.Y.; Dorvlo, A.S.; Kumar, G.T.V. Analysis of a 27-year rainfall data (1977–2003) in the Sultanate of Oman. Int. J. Climatol. 2009, 29, 605–617. [Google Scholar] [CrossRef]
- Grundmann, J.; Schutze, N.; Schmitz, G.H.; Al-Shaqsi, S. Towards an integrated arid zone water management using simulation-based optimization. Environ. Earth Sci. 2012, 65, 1381–1394. [Google Scholar] [CrossRef]
- Ministry of Agriculture and Fisheries (MAF); International Center for Biosaline Agriculture (ICBA). Oman Salinity Strategy—Assessment of Salinity Problem: Annex-1; MAF: Muscat, Oman, 2012. [Google Scholar]
- Kumar, K.S.A.; Prijub, C.P.; Prasad, N.B.N. Study on Saline Water intrusion into the Shallow Coastal Aquifers of Periyar River Basin, Kerala using Hydrochemical and Electrical Resistivity Methods. International Conference on Water Resources, Coastal and Ocean Engineering (ICWRCOE 2015). Aquat. Procedia 2015, 4, 32–40. [Google Scholar] [CrossRef]
- Sherif, M.; Kacimov, A.; Javadi, A.A.; Ebraheem, A. Modelling groundwater flow and seawater intrusion in the coastal aquifer of Wadi Ham, UAE. Water Resour. Manag. 2012, 26, 751–774. [Google Scholar] [CrossRef]
- Bolster, D.T.; Tartakovsky, D.M.; Dentz, M. Analytical models of contamination transport in coastal aquifers. Adv. Water Resour. 2007, 30, 1962–1972. [Google Scholar] [CrossRef]
- Shammas, M.I.; Jacks, G. Seawater intrusion in the Salalah plain aquifer, Oman. Environ. Geol. J. 2007, 53, 575–587. [Google Scholar] [CrossRef]
- Chaudhari, A.N.; Mehta, D.J.; Sharma, N.D. An assessment of groundwater quality in South-West zone of Surat city. Water Supply 2021, 21, 3000–3010. [Google Scholar] [CrossRef]
- Chaudhari, A.N.; Mehta, D.J.; Sharma, N.D. Coupled effect of seawater intrusion on groundwater quality: Study of South-West zone of Surat city. Water Supply 2022, 22, 1716–1734. [Google Scholar] [CrossRef]
- Shammas, M.I. The effectiveness of artificial recharge in combating seawater intrusion in Salalah coastal aquifer, Oman. Environ. Geol. 2008, 55, 191–204. [Google Scholar] [CrossRef]
- Abdalla, F. Ionic ratios as tracers to assess seawater intrusion and to identify salinity sources in Jazan coastal aquifer, Saudi Arabia. Arab. J. Geosci. 2016, 9, 40. [Google Scholar] [CrossRef]
- FAO. Groundwater Management in Oman, Draft Synthesis Report; Food and Agriculture Organization of the United Nations: Rome, Italy, 2009. [Google Scholar]
- Japan International Cooperation Agency (JICA). Hydrologic Observation Project in the Batinah Coast; Library of the General Directorate of Regional Municipality, Environment and Water Resources in North of Al Batinah: Sohar, Oman, 1986. [Google Scholar]
- Dale, R.H. Salinity Survey of the Batinah; Library of the General Directorate of Regional Municipality, Environment and Water Resources in North of Al Batinah: Sohar, Oman, 1983. [Google Scholar]
- Davison, D.W., Jr. Change in Groundwater Quality along the Batinah Coast 1983 to 1986; Council for Conservation of Environment and Water Resources (CCEWR); Library of the General Directorate of Regional Municipality, Environment and Water Resources in North of Al Batinah: Sohar, Oman, 1986. [Google Scholar]
- Hydroconsult. Preliminary Soil and Groundwater Survey in the Batinah Region, Part 1 Groundwater; Ministry of Agriculture and Fisheries (MAF); Library of the Ministry of Regional Municipality, Environment and Water Resources (MRMEWR): Muscat, Oman, 1985. [Google Scholar]
- Chitrakar, P.; Sana, A. Ground Water Flow and Solute Transport Simulation in Eastern Al Batinah Coastal Plain, Oman: Case Study. J. Hydrol. Eng. 2015, 21, 05015020, ISSN 1084-0699. [Google Scholar] [CrossRef]
- Zubari, W.K. Spatial and temporal trends in groundwater resources in Bahrain 1992–2002. Emir. J. Eng. Res. 2005, 10, 57–67, ISSN 1022-9892. [Google Scholar]
- Al-Weshah, R.A.; Yihdego, Y. Flow modelling of strategically vital freshwater aquifers in Kuwait. Environ. Earth Sci. 2016, 75, 1315. [Google Scholar] [CrossRef]
- Al-Damkhi, A.M.; Al-Fares, R.A.; Al-Khalifa, K.A.; Abdul-Wahab, S.A. Water issues in Kuwait: A future sustainable vision. Int. J. Environ. Stud. 2009, 66, 619–636. [Google Scholar] [CrossRef]
- Bhandary, H.; Sabarathinam, C.; Al-Khalid, A. Occurrence of hypersaline groundwater along the coastal aquifers of Kuwait. Desalination 2018, 436, 15–27. [Google Scholar] [CrossRef]
- Rajmohan, N.; Milad, H.Z.; Masoud, M.H.Z.; Niyazia, B.A.M. Impact of evaporation on groundwater salinity in the arid coastal aquifer, Western Saudi Arabia. Catena 2021, 196, 104864, ISSN 0341-8162. [Google Scholar] [CrossRef]
- The Environment Agency—Abu Dhabi (EAD). Ground Water Atlas of Abu Dhabi Emirates. 2018. Available online: https://www.researchgate.net/publication/337857829_GROUNDWATER_ATLAS_OF_ABU_DHABI_EMIRATE (accessed on 5 October 2022).
- Lachaal, F.; Gana, S. Groundwater flow modelling for impact assessment of port dredging works on coastal hydrogeology in the area of Al-Wakrah (Qatar). Model. Earth Syst. Environ. 2016, 2, 201. [Google Scholar] [CrossRef]
- Al-Qubatee, W.; Ritzema, H.; Al-Weshali, A.; Van Steenbergen, F.; Hellegers, P.J.G.J. Participatory rural appraisal to assess groundwater resources in Al-Mujaylis, Tihama Coastal Plain, Yemen. Water Int. 2017, 42, 810–830. [Google Scholar] [CrossRef] [Green Version]
- Nasher, G.; Al-Sayyaghi, A.; Al- Matary, A. Identification and evaluation of the hydrogeochemical processes of the lower part of Wadi Siham catchment area, Tihama plain, Yemen. Arab. J. Geosci. 2013, 6, 2131–2146. [Google Scholar] [CrossRef]
- ELHamidi, M.J.; Larabi, A.; Faouzi, M. Numerical Modeling of Saltwater Intrusion in the Rmel-Oulad Ogbane Coastal Aquifer (Larache, Morocco) in the Climate Change and Sea-Level Rise Context (2040). Water 2021, 13, 2167. [Google Scholar] [CrossRef]
- Praveena, S.M.; Aris, A.Z. Groundwater resources assessment using numerical model: A case study in low-lying coastal area. Int. J. Environ. Sci. Technol. 2010, 7, 135–146. [Google Scholar] [CrossRef] [Green Version]
- Ranjan, P.; Kazama, S.; Sawamoto, M.; Sana, A. Global Scale Evaluation of Coastal Fresh Ground Water Resources. Ocean. Coast. Manag. 2008, 52, 197–206. [Google Scholar] [CrossRef]
- McDonald, M.G.; Harbaugh, A.W. A Modular Three-Dimensional Finite Difference Groundwater Flow Model Technique of Water Resources Investigations of United States Geological Survey; U.S. Geological Survey: Denver, CO, USA, 1988; Volume 6, p. 586. [Google Scholar]
- McDonald, M.G.; Harbaugh, A.W.; Banta, E.R.; Hill, M.C. MODFLOW-2000, U.S. Geological Survey Modular Ground-Water Model—User Guide to Modularization Concept and the Ground Water Flow Process; U.S. Geological Survey Open-File Rep. 00-92: Reston, VA, USA, 2000; p. 121. [Google Scholar]
- Zheng, C.; Wang, P.P. MT3DMS: Transport Model for Simulation of Advection, Dispersion, and Chemical Reactions of Contaminants in Groundwater Systems; Documentation and User’s Guide; United State Army Corps of Engineers: Vicksburg, MI, USA, 1999. [Google Scholar]
- Shammas, M.I.; Thunvik, R. Predictive simulation of flow and solute transport for managing the Salalah coastal aquifer, Oman. Water Resour. Manag. 2009, 23, 2941–2963. [Google Scholar] [CrossRef]
- Al-Hashmi, S.; Gunawardhana, L.; Sana, A.L.; Baawain, M. Application of groundwater flow model in assessing aquifer layers interaction in arid catchment area. Int. J. Environ. Sci. Technol. 2020, 17, 4577–4588. [Google Scholar] [CrossRef]
- Al-Maktoumi, A.; Zekri, S.; El-Rawy, M.; Abdalla, O.; Al-Wardy MAl-Rawas, G.; Charabi, Y. Assessment of the impact of climate change on coastal aquifers in Oman. Arab. J. Geosci. 2018, 11, 501. [Google Scholar] [CrossRef]
- Kacimov, A.R.; Sherif, M.M.; Perret, J.S.; Al–Mushikhi, A. Control of Seawater Intrusion by Saltwater Pumping: Coast of Oman. Hydrogeol. J. 2009, 17, 541–558. [Google Scholar] [CrossRef]
- Dibaj, M.; Javadi, A.A.; Akrami, M.; Ke, K.-Y.; Farmani, R.; Tan, Y.-C.; Chen, A.S. Modelling seawater intrusion in the Pingtung coastal aquifer in Taiwan, under the influence of sea-level rise and changing abstraction regime. Appl. Hydrogeol. 2020, 28, 2085–2103. [Google Scholar] [CrossRef]
- Sowe, M.A.; Sadhasivam, S.; Mohamed, M.M.; Mohsen, S. Modeling the mitigation of seawater intrusion by pumping of brackish water from the coastal aquifer of Wadi Ham, UAE. Sustain. Water Resour. Manag. 2019, 5, 1435–1451. [Google Scholar] [CrossRef]
- Lathashri, U.A.; Mahesha, A. Simulation of Saltwater Intrusion in a Coastal Aquifer in Karnataka, India. In Proceedings of the International Conference on Water Resources, Coastal and Ocean Engineering (ICWRCOE 2015) Aquatic Procedia 4, Mangalore, India, 12–14 March 2015; pp. 700–705. [Google Scholar] [CrossRef]
- Hussain, M.S.; Javadi, A.A.; Sherif, M.M. Three-Dimensional Simulation of Seawater Intrusion in a Regional Coastal Aquifer in UAE. Procedia Eng. 2015, 119, 1153–1160. [Google Scholar] [CrossRef] [Green Version]
- Nofal, E.; Amer, M.; El-Didy, S.; Fekry, A.M. Delineation and modeling of seawater intrusion into the Nile Delta Aquifer: A new perspective. National Water Research Centre. Water Sci. 2015, 29, 156–166. [Google Scholar] [CrossRef] [Green Version]
- Ghoraba, S.M.; Zyedan, B.A.; Rashwan, I.M.H. Solute Transport Modeling of the Ground Water for Quaternary Aquifer Quality Management in Middle Delta, Egypt. Alex. Eng. J. 2013, 52, 192–207. [Google Scholar] [CrossRef] [Green Version]
- Chun, J.A.; Lim, C.; Kim, D.; Kim, J.S. Assessing Impacts of Climate Change and Sea-Level Rise on Seawater Intrusion in a Coastal Aquifer. Water 2018, 10, 357. [Google Scholar] [CrossRef] [Green Version]
- Baalousha, H.M.; Fahs, M.; Ramasomanana, F.; Younes, A. Effect of Pilot-Points Location on Model Calibration: Application to the Northern Karst Aquifer of Qatar. Water 2019, 11, 679. [Google Scholar] [CrossRef] [Green Version]
- Ghazaw, Y.M.; Ghumman, A.R.; Al-Salamah, I.; Khan, Q.U.Z. Investigations of Impact of Recharge Wells on Groundwater in Buraydah by Numerical Modeling. Arab. J. Sci. Eng. 2014, 39, 713–724. [Google Scholar] [CrossRef]
- Al-Salamah, I.S.; Ghazaw, Y.M.; Ghumman, A.R. Groundwater modeling of Saq Aquifer Buraydah Al Qassim for better water management strategies. Environ. Monit. Assess. 2010, 173, 851–860. [Google Scholar] [CrossRef]
- Akhtar, J.; Sana, A.; Tauseef, S.M. Using MODFLOW to Investigate the Effect of Persistent Water Deficit in Al-Jizi Coastal Aquifer, Sultanate of Oman. Arab. J. Geosci. 2022, 15, 1448. [Google Scholar] [CrossRef]
- Sana, A.; Baawain, M. Ground Water Modeling of Coastal Plain Aquifer in Southern Oman. In Proceedings of the 19th IAHR—APD Congress 2014, Hanoi, Vietnam, 21–24 September 2014. [Google Scholar]
- McDonald, M.G.; Harbaugh, A.W. A Modular Three-Dimensional Finite-Difference Ground-Water Flow Model; Techniques of Water-Resources Investigations of the United States Geological Survey; United States Geological Survey: Washington, DC, USA, 1988. [Google Scholar]
- Zheng, C.; Wang, P.P. MT3DMS: A Modular Three-Dimensional Multispecies Transport Model for Simulation of Advection, Dispersion, and Chemical Reactions of Contaminants in Groundwater Systems; Documentation and User’s Guide, Contract Report SERDP-99-1; U.S. Army Engineer Research and Development Center: Vicksburg, MS, USA, 1999. [Google Scholar]
- Intergovernmental Panel on Climate Change (IPCC). Summary for Policymakers. In Climate Change 2013: The Physical Science Basis; Contribution of Working Group I to the Fifth Assessment Report of the Intergovernmental Panel on Climate Change; Stocker, T.F., Qin, D., Plattner, G.-K., Tignor, M., Allen, S.K., Boschung, J., Nauels, A., Xia, Y., Bex, V., Midgley, P.M., Eds.; Cambridge University Press: Cambridge, UK; New York, NY, USA, 2013. [Google Scholar]
Figure 1.
(a) Map of the Sultanate of Oman (onestopmap.com, accessed on 12 November 2022) with a red circle near Suhar showing the location of the study area. (b) Part of the Wadi Al-Jizi aquifer, which is the computational domain.
Figure 1.
(a) Map of the Sultanate of Oman (onestopmap.com, accessed on 12 November 2022) with a red circle near Suhar showing the location of the study area. (b) Part of the Wadi Al-Jizi aquifer, which is the computational domain.
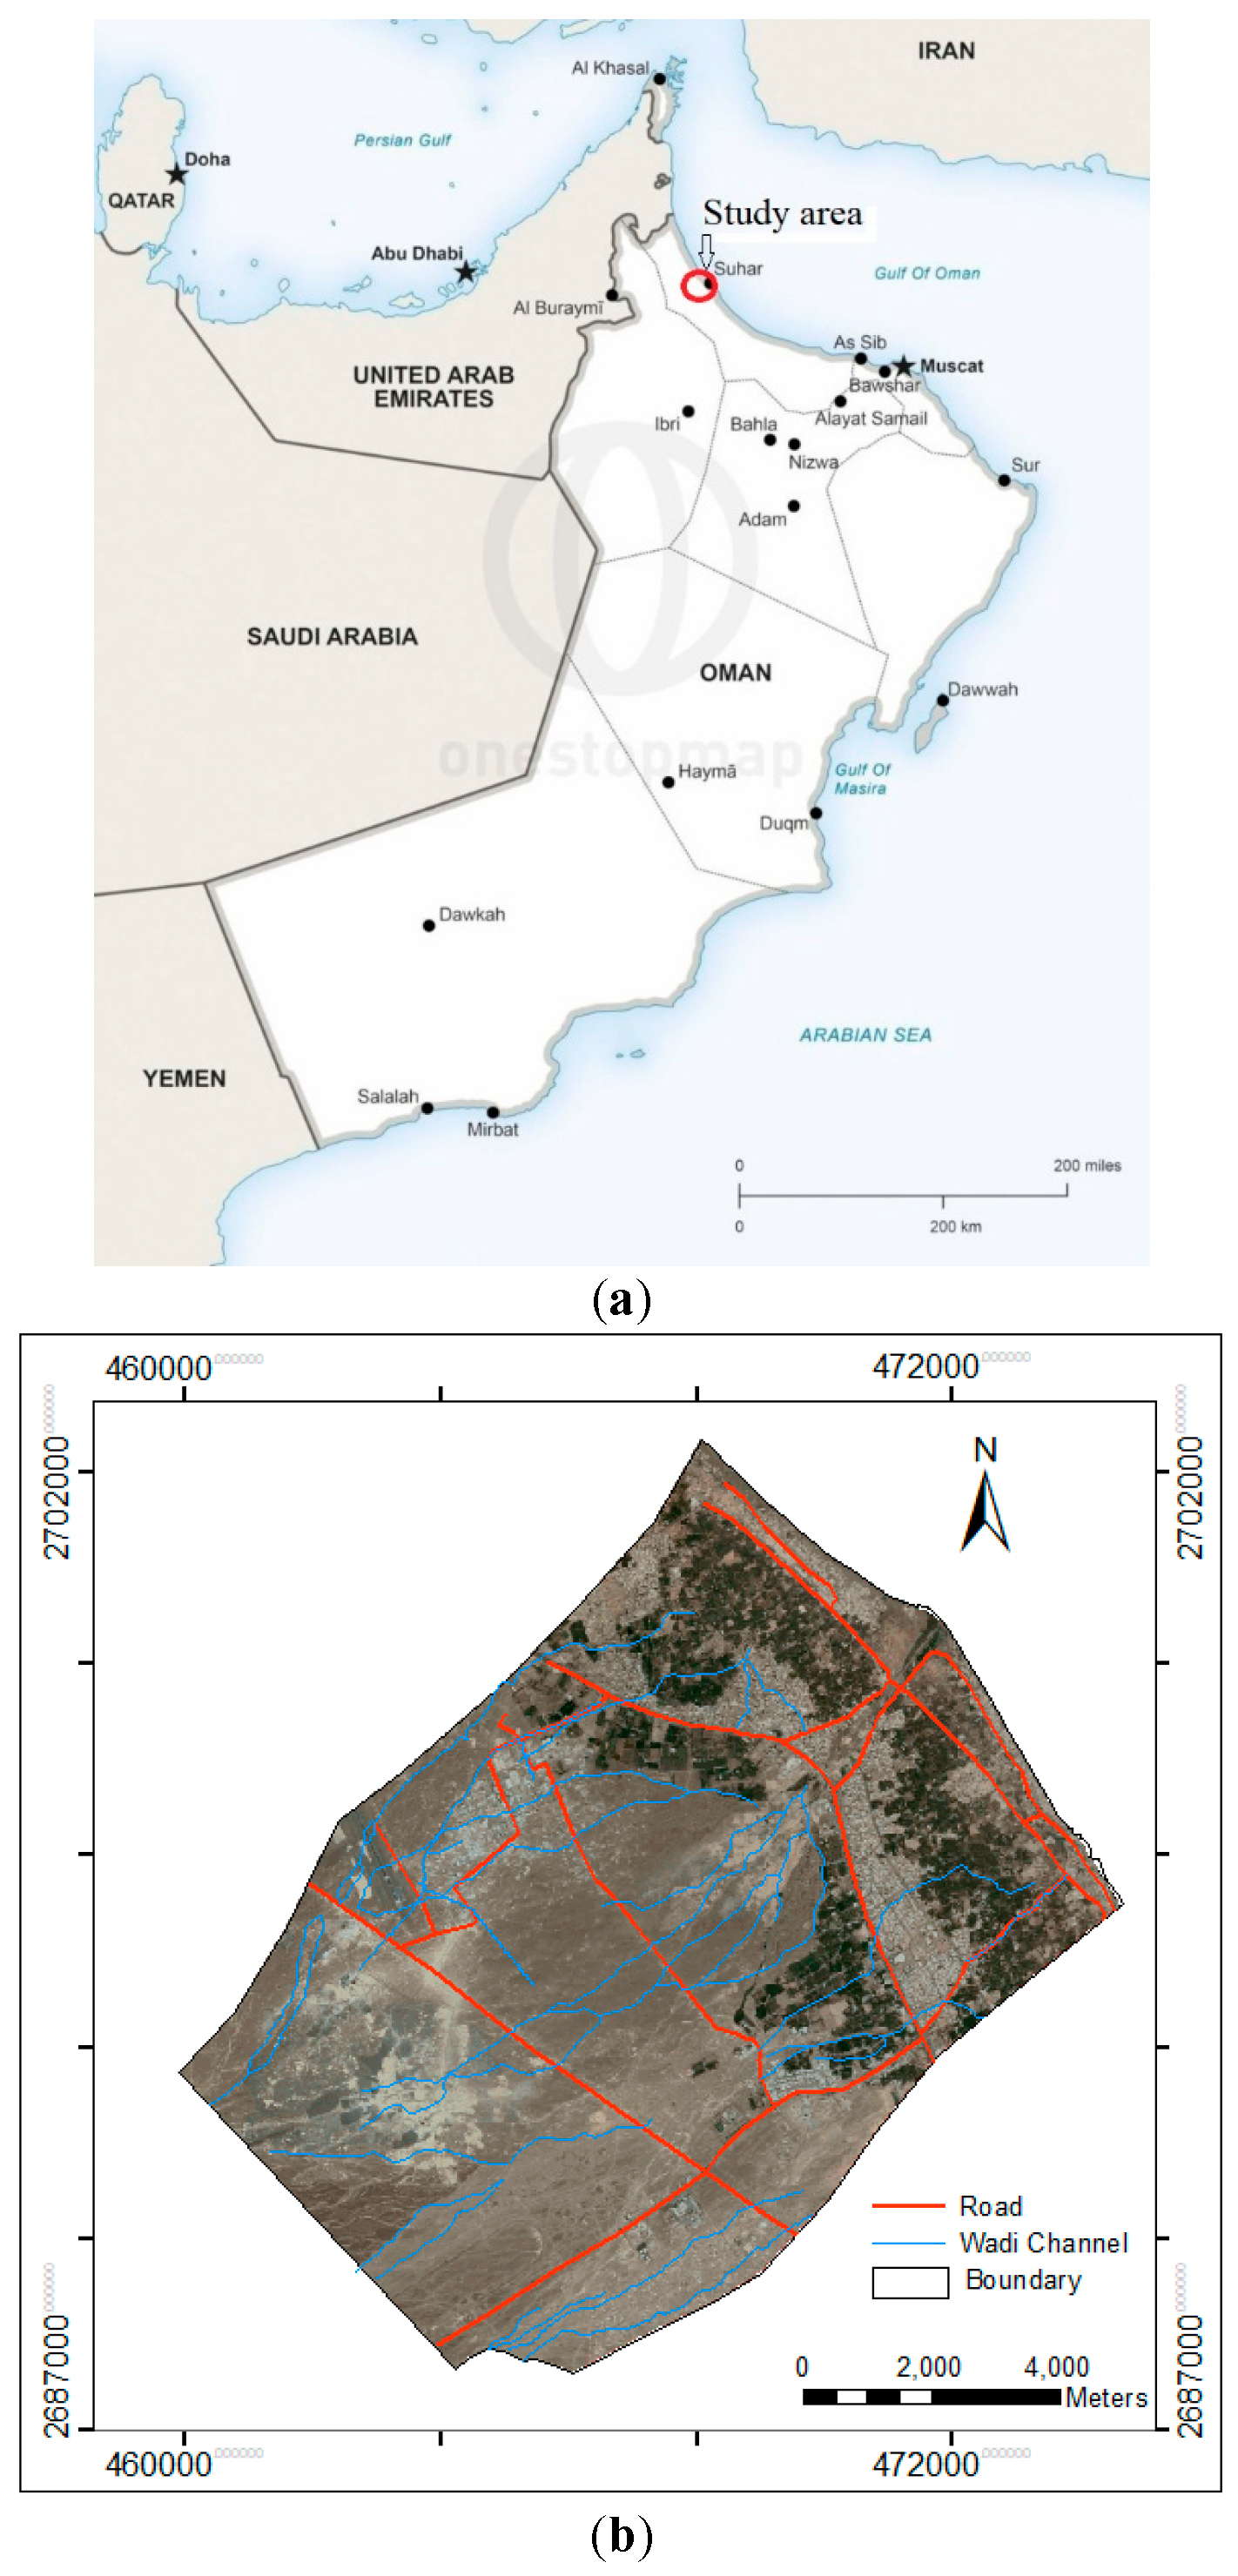
Figure 2.
An abandoned date palm garden in Al Batinah, Oman, due to salinity intrusion (Photograph taken by Javed Akhtar on 17 December 2021).
Figure 2.
An abandoned date palm garden in Al Batinah, Oman, due to salinity intrusion (Photograph taken by Javed Akhtar on 17 December 2021).

Figure 3.
Conceptual model of Wadi Al Jizi groundwater flow system.

Figure 4.
Location of salinity monitoring wells and zones in the model domain.
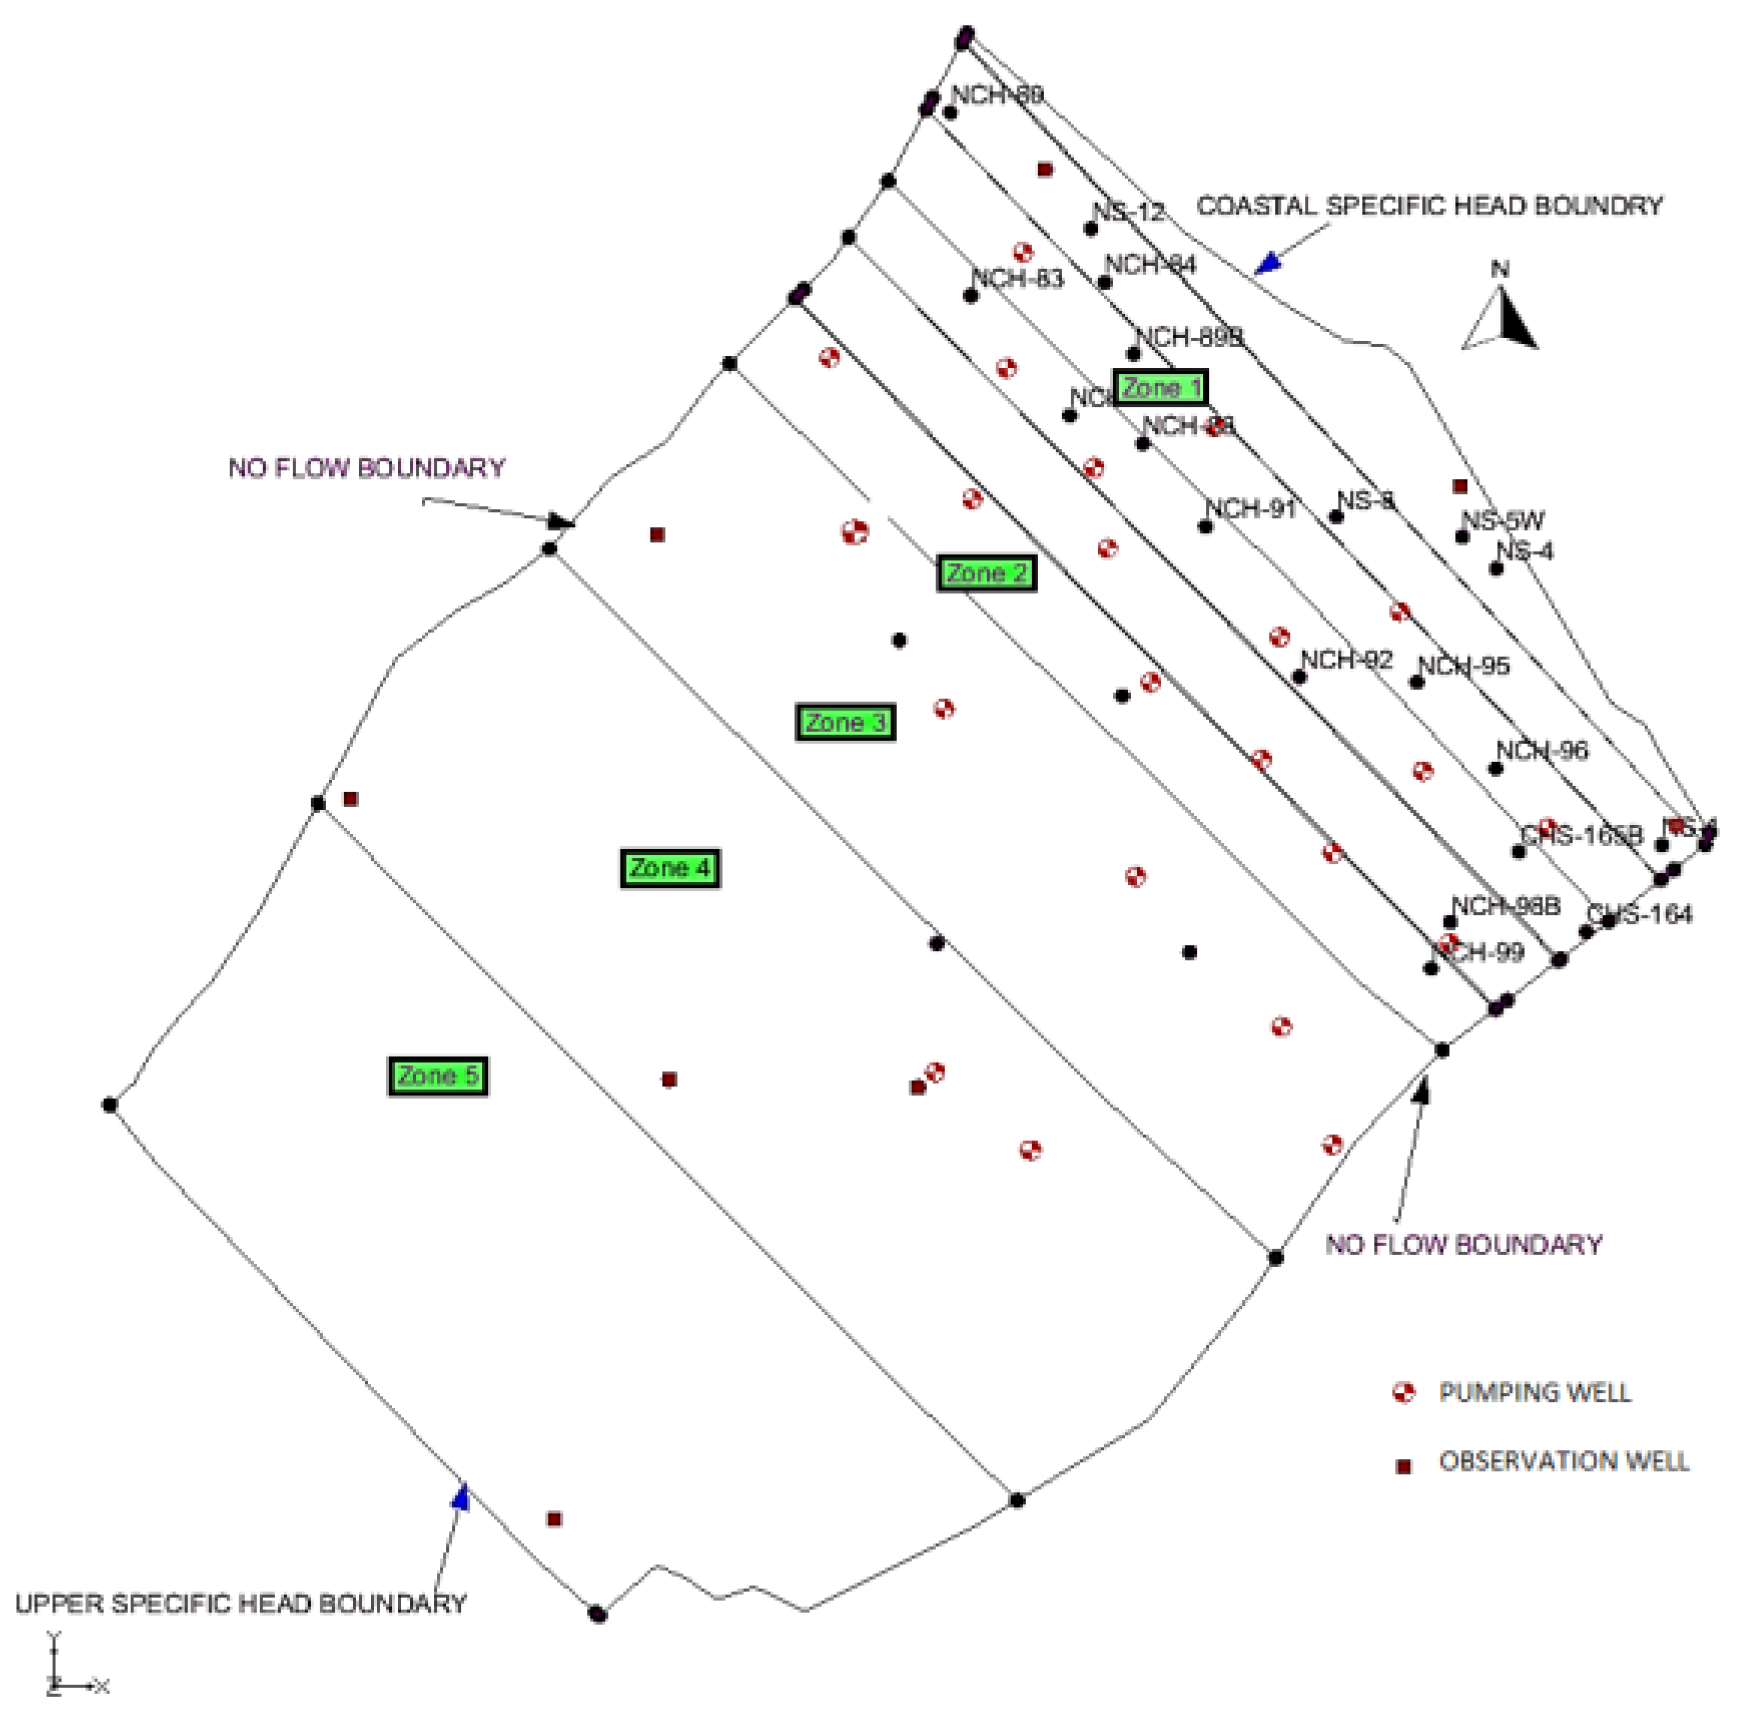
Figure 5.
Salinity contour maps. (a) Year 2000 observations, (b) year 2000 simulations, (c) year 2005 observations, (d) year 2005 simulations, (e) year 2010 observations, (f) year 2010 simulations, (g) year 2016 observations, and (h) year 2016 simulations.
Figure 5.
Salinity contour maps. (a) Year 2000 observations, (b) year 2000 simulations, (c) year 2005 observations, (d) year 2005 simulations, (e) year 2010 observations, (f) year 2010 simulations, (g) year 2016 observations, and (h) year 2016 simulations.


Figure 6.
Salinity contours for Scenario-1 pumping rates from 2017: (a) 2030 and (b) 2040.

Figure 7.
Salinity contours for Scenario-2 (pumping rates increased by 10% from those in the year 2017). (a) 2030 and (b) 2040.
Figure 7.
Salinity contours for Scenario-2 (pumping rates increased by 10% from those in the year 2017). (a) 2030 and (b) 2040.

Figure 8.
Salinity contours for Scenario-3 (pumping rates increased by 20% from those in the year 2017). (a) 2030 and (b) 2040.
Figure 8.
Salinity contours for Scenario-3 (pumping rates increased by 20% from those in the year 2017). (a) 2030 and (b) 2040.

Figure 9.
Groundwater elevations in Wadi Al-Jizi aquifer (Station EA1) in response to sea level rise until 2040. The existing observed elevations (2000 to 2017) along with the computed values from MODFLOW are shown from 2000 to 2040.
Figure 9.
Groundwater elevations in Wadi Al-Jizi aquifer (Station EA1) in response to sea level rise until 2040. The existing observed elevations (2000 to 2017) along with the computed values from MODFLOW are shown from 2000 to 2040.


Table 1.
Classification of groundwater salinity (adopted from [26]).
Table 1.
Classification of groundwater salinity (adopted from [26]).
| Level of Salinity | Classification | Water Salinity | |
|---|---|---|---|
| TDS (mg/L) | EC (µs/m) | ||
| Class 1 | Freshwater | <1500 | 2.14 |
| Class 2 | Low Salinity | 1500–3000 | 2.14–4.30 |
| Class 3 | Moderate Salinity | 3000–5000 | 4.30–7.0 |
| Class 4 | Moderately High Salinity | 5000–7000 | 7.0–10.0 |
| Class 5 | High Salinity | 7000–10,000 | 10.0–15.0 |
| Class 6 | Very High Salinity | >10,000 | >15.0 |
Table 2.
Observed salinity values in groundwater at various locations on the Arabian Peninsula.
| S. No | Region/Aquifer | Country | Observed SalinityValues TDS (ppm) | Reference/s |
|---|---|---|---|---|
| 1 | Dammam Aquifer | Bahrain | 2097–53,562 | [41] |
| 2 | Al-Raudhatain/Umm Al-Aish | Kuwait | 350–2400 | [42] |
| 3 | Kuwait Aquifer | Kuwait | 3000–8000 | [43] |
| 4 | Kuwait Aquifer | Kuwait | 1649–98,692 | [44] |
| 5 | Salalah Coastal Aquifer | Oman | 446–6305 | [30] |
| 6 | Al Batinah Coastal plain | Oman | 849–53,562 | [11,14,40] |
| 7 | Gulf of Aqaba | Saudi Arabia | 800–10,018 | [2] |
| 8 | Jazan Aquifer | Saudi Arabia | 217–8010 | [34] |
| 9 | Saq Aquifer | Saudi Arabia | 600–1180 | [3] |
| 10 | Al Lusab Basin | Saudi Arabia | 646–12,860 | [45] |
| 11 | Abu Dhabi Emirates Aquifer | United Arab Emirates | ≤1500–140,000 | [46] |
| 12 | Wadi Ham | United Arab Emirates | 15,000–30,374 | [12] |
| 13 | Al-Wakrah | Qatar | 2420–9210 | [47] |
| 14 | Wadi Siham, Tihama Basin | Yemen | 363–9610 | [48,49] |
Table 3.
Observed versus computed head for selected observation wells in the steady-state calibration for the year 2000.
Table 3.
Observed versus computed head for selected observation wells in the steady-state calibration for the year 2000.
| Observation Well | Observed Head (m) | Computed Head (m) | Difference |
|---|---|---|---|
| EA1 | 4.45 | 4.70 | −0.25 |
| JA5 | 7.75 | 6.50 | 1.25 |
| NJ1 | 0.52 | 0.85 | −0.33 |
| NJ2 | 0.42 | 1.00 | −0.58 |
| NJ10 | 1.40 | 1.20 | 0.20 |
| NJ9 | 3.05 | 3.38 | −0.33 |
| SARKM | 1.37 | 3.19 | −1.82 |
| DE5 | 4.73 | 4.20 | 0.53 |
| JA2 | 2.54 | 2.63 | −0.09 |
Table 4.
Transient state calibrated parameter values.
| Parameters | Calibrated Value | |
|---|---|---|
| Layer 1 | Layer 2 | |
| Hydraulic conductivity (m/day) | 7.5–163 | 4.0–180 |
| Vertical anisotropy | 20–25 | 10–25 |
| Porosity | 0.2–0.5 | 0.2–0.6 |
| Longitudinal dispersivity (m) | 14,000 to 15 | |
| Ratio of horizontal transverse dispersivity to longitudinal dispersivity | 0.1 | |
| Ratio of vertical transverse dispersivity to longitudinal dispersivity | 0.01 | |
Table 5.
Summary of the scenarios considering changes in the pumping rates and sea level changes.
| Scenario Type | Scenario | Description of the Scenario | Predicted Salinity Intrusion Inland (km) | |
|---|---|---|---|---|
| 2030 | 2040 | |||
| Pumping increment and reduction | 1 | Pumping at baseline pumping rates of 2017 | 2.39 | 2.56 |
| 2 | Pumping increment of 10% from the baseline pumping rate of 2017 | 2.42 | 2.57 | |
| 3 | Pumping increment of 20% from the baseline pumping rate of 2017 | 2.58 | 2.65 | |
| 4 | Pumping increment of 30% from the baseline pumping rate of 2017 | 2.69 | 2.73 | |
| 5 | Pumping reduction of 5% from the baseline pumping rate of 2017 | 2.19 | 2.41 | |
| 6 | Pumping reduction of 10% from the baseline pumping rate of 2017 | 2.12 | 2.15 | |
| Sea level rise due to climatic changes | 7 | Sea level rise as per IPCC prediction | 2.60 | 2.63 |
| 8 | Sea level rise @ + 0.25 m to the base sea level | 2.60 | 2.65 | |
| 9 | Sea level rise @ + 0.50 m to the base sea level | 2.61 | 2.70 | |
| 10 | Sea level rise @ − 0.25 m from the base sea level | 2.52 | 2.59 | |
Publisher’s Note: MDPI stays neutral with regard to jurisdictional claims in published maps and institutional affiliations. |
© 2022 by the authors. Licensee MDPI, Basel, Switzerland. This article is an open access article distributed under the terms and conditions of the Creative Commons Attribution (CC BY) license (https://creativecommons.org/licenses/by/4.0/).
Share and Cite
MDPI and ACS Style
Akhtar, J.; Sana, A.; Tauseef, S.M.; Tanaka, H. Numerical Modeling of Seawater Intrusion in Wadi Al-Jizi Coastal Aquifer in the Sultanate of Oman. Hydrology 2022, 9, 211. https://doi.org/10.3390/hydrology9120211
AMA Style
Akhtar J, Sana A, Tauseef SM, Tanaka H. Numerical Modeling of Seawater Intrusion in Wadi Al-Jizi Coastal Aquifer in the Sultanate of Oman. Hydrology. 2022; 9(12):211. https://doi.org/10.3390/hydrology9120211
Chicago/Turabian StyleAkhtar, Javed, Ahmad Sana, Syed Mohammed Tauseef, and Hitoshi Tanaka. 2022. "Numerical Modeling of Seawater Intrusion in Wadi Al-Jizi Coastal Aquifer in the Sultanate of Oman" Hydrology 9, no. 12: 211. https://doi.org/10.3390/hydrology9120211
Note that from the first issue of 2016, this journal uses article numbers instead of page numbers. See further details here.