Article

Comparison and Optimization of Different Extraction Methods of Bound Phenolics from Jizi439 Black Wheat Bran

1
Key Laboratory of Bulk Grain and Oil Deep Processing Ministry of Education, Wuhan Polytechnic University, Wuhan 430023, China
2
School of Food Science and Engineering, Wuhan Polytechnic University, Wuhan 430023, China
*
Author to whom correspondence should be addressed.
Foods 2022, 11(10), 1478; https://doi.org/10.3390/foods11101478
Submission received: 3 May 2022 / Revised: 14 May 2022 / Accepted: 16 May 2022 / Published: 19 May 2022
(This article belongs to the Section Food Engineering and Technology)

Abstract

:
Diet rich in phenolics would potentially associate with multiple health benefits. Response surface methodology (RSM) was introduced to optimize the process of ultrasound- and microwave-assisted extraction of bound phenolics from the bran of a newly developed black wheat breeding line Jizi439 and then compared with the traditional alkaline method. The optimum conditions were found to be 66 °C, 48 min, and power 240 W for ultrasound-assisted extraction (UAE), and 120 s, power 420 W for microwave-assisted extraction (MAE), respectively. Total bound phenolic contents (TBPCs), determined by Folin-Ciocalteu reagent, were 8466.7 ± 240.9 μg gallic acid equivalents per gram (μg GAE/g) bran for UAE and 8340.7 ± 146.7 μg GAE/g bran for MAE under optimized conditions, which were both significantly higher than that of the traditional method (5688.9 ± 179.6 μg GAE/g) (p < 0.05). Antioxidant activities (AAs) were determined by DPPH and ABTS methods. UAE extracts showed the highest DPPH scavenging activity (77.5 ± 0.9%), while MAE extracts showed the highest ABTS scavenging activity (72.1 ± 0.6%). Both were significantly higher than that of the traditional method (69.6 ± 1.1% for DPPH and 65.9 ± 0.5% for ABTS) (p < 0.05). Total bound phenolics (TBPs) profiles were further analyzed by HPLC, and results indicated that ferulic acid was dominant, followed by vanillic acid and p-coumaric acid. The contents of each identified individual phenolics were significantly increased by ultrasound and microwave. In conclusion, UAE and MAE were comparable with each other in TBP yields and AAs; however, when taking operation time and energy consumption into consideration, MAE was more efficient than UAE. Our study suggested efficiency extraction methods for further use of bound phenolics as a healthy food ingredient.

1. Introduction

Wheat bran, an important cereal industry by-product, is mostly used as fertilizer or discarded, resulting in a great waste of resources [1]. Due to an increased interest in the health benefits of its bioactive phytochemicals, particularly phenolics, the use of bran as a functional food ingredient, is on the rise [2,3,4]. Among different wheat varieties, black wheat was reported to possess the highest level of phenolic content, as well as antioxidant activity, compared with white and purple wheat [5]. Around 80% of the total phenolics in whole grains exist in bound form and are distributed in the bran [6,7,8]. Bound phenolics have shown significantly higher antioxidant capacity than free phenolics in vitro [9,10]. However, studies regarding phenolics are mostly focused on free phenolics rather than their bound form [11,12]. Moreover, the majority of published papers related to bound phenolics in foods mainly include fruits, vegetables, and legumes/seeds [13]. There is a lack of knowledge regarding bound phenolics in grains, such as black wheat bran (BWB). In this respect, a recently developed black wheat Jizi439, which was hybrid from four different breeding lines [14], was selected and investigated in the present study.
To maximize the TBPs yields of Jizi439 BWB and thereby improve their antioxidant activity, response surface methodology (RSM) was introduced and different extraction methods, including the traditional alkaline method, ultrasound-, and microwave- assisted extraction method, were compared in our study. The traditional acid or alkaline method was established in 1982 [15]. Although acid treatment breaks glycosidic bonds of sugars and leaves ester bonds of bound phenolics intact [16], the acid environment may lead to the degradation of flavanols [17]. Compared with acid extraction, alkaline hydrolysis avoids flavanol degradation [18] and reduces their loss [19,20]. However, both methods still have their drawbacks, such as low yield of phenolics and long production cycle. Therefore, a variety of new extraction techniques have been developed, such as ultrasound- [21,22,23] and microwave-assisted extraction [24,25]. These two new green extraction techniques not only greatly shorten the extraction time, but also consume less solvents and energy [26,27]. The acoustic cavities, as well as the mechanical effect created by ultrasound waves, could disrupt the plant cell walls and release the bioactive compounds into solvent [28]. Meanwhile, microwaves possess the ability to heat up the molecules in the plant by ionic conduction and dipole rotation, resulting in the rupture of cell walls, and accelerate the release of phenolic compounds [29]. Extraction of bioactive compounds using ultrasound or microwave has been proven to be an efficient method that reduces the use of toxic chemicals [26,27].
Therefore, the objective of this study was: (1) to optimize UAE and MAE processes using RSM; (2) to compare the TBPC yields, AAs, and the profiles of bound phenolics obtained from UAE, MAE, and traditional alkaline extraction methods under the optimal extraction conditions; and (3) eventually to find an most efficiency way for obtaining more bound phenolics with high antioxidant activity. Taken together, our study fills the gap in optimization of extracting bound phenolics from BWB, provides a fundamental knowledge of bound phenolics profile in the Jizi439 BWB, and suggests an efficient extraction method for further use as a sustainable healthy food ingredient.

2. Materials and Methods

2.1. Materials and Reagents

The Jizi439 BWB was received from Yueqing Agricultural Science and Technology Co., Ltd. (Handan, China). Tris-HCl buffer was obtained from Solarbio Science and Technology Co. (Beijing, China). DPPH (2,2-diphenyl-1-picrylhydrazyl) and 2,2′-Azinobis (3-ethylbenzothiazoline-6-sulfonate) (ABTS) free radical were acquired from Sigma-Aldrich (St. Louis, MO, USA). Folin-Ciocalteu reagent and NaCO3 were purchased from Hushi chemical Co. (Shanghai, China). Standards, including Gallic acid, p-hydroxybenzoic acid, vanillic acid, p-coumaric acid, ferulic acid, syringic acid, caffeic acid, protocatechuic acid, chlorogenic acid, catechin, luteolin, and apigenin, were purchased from Shanghai Yuanye Bio-Technology Co., Ltd. (Shanghai, China).

2.2. Preparation of Samples

Milling of Jizi439 BWB used a high-speed multifunctional pulverizer (RHP-100, Jinhua, China) before sieving through a 60-mesh screen. A total of 200 g of bran powder was then transferred to a flask, defatted with hexane at a ratio of 4:1 (v/w), and then kept on a thermostatic oscillator for 1 h at room temperature. After that, the defatted bran powder was dried in a hood overnight and stored at −20 °C before analysis.

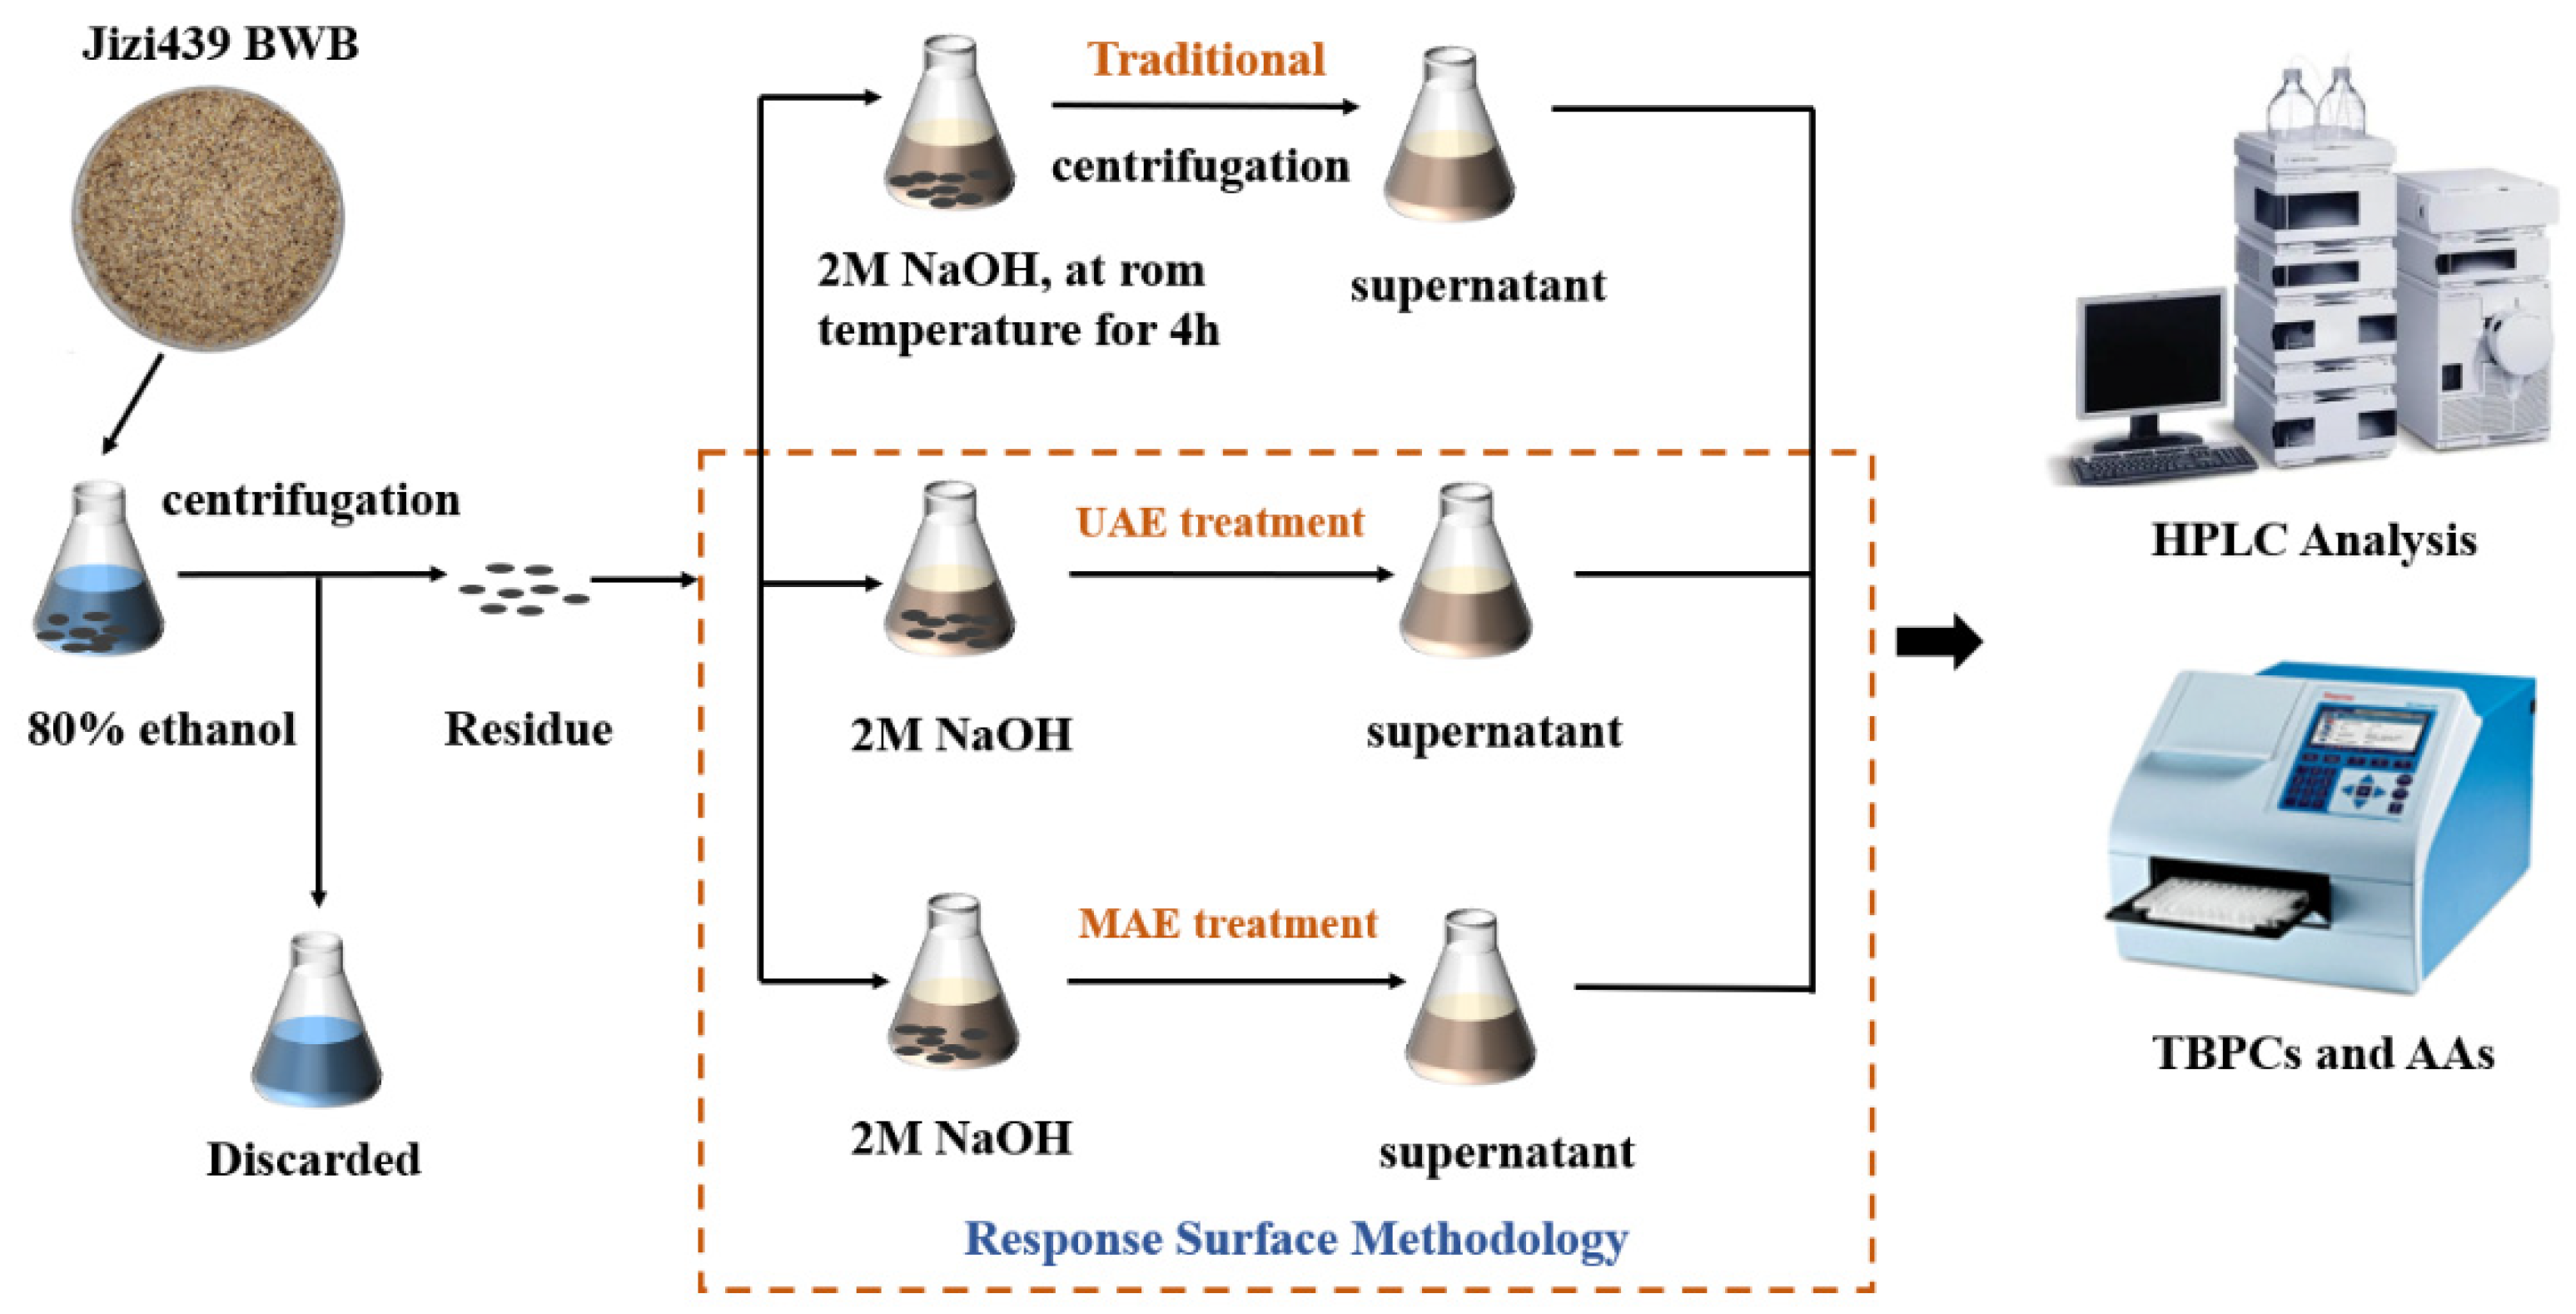
2.3. Experimental Design

The scheme of the Jizi439 BWB extraction process, either by traditional, UAE, or MAE methods, was shown in Figure 1. RSM was used to optimize the extraction conditions for UAE and MAE. The defatted bran powder acquired from Section 2.2 was assigned to three groups, including: (1) the traditional alkaline extraction method group, where TBPs were extracted by the traditional alkaline method, without ultrasound or microwave treatment; (2) ultrasound-assisted extraction (UAE), where TBPs were extracted with ultrasound treatment; (3) microwave-assisted extraction (MAE), where TBPs were extracted with microwave treatment. TBPCs and their AAs (in terms of DPPH and ABTS scavenging activity) were compared in each group.

2.4. Traditional Alkaline Extraction Method

Bound phenolics were extracted according to Brij Verma et al. [8], with modifications. One gram of defatted Jizi439 BWB was extracted two times with 80% ethanol before centrifugation at 2500× g for 10 min. The supernatant was discarded, and the residue was mixed with 40 mL of NaOH (2 M), then left to stand for 4 h at room temperature. After that, the mixture was acidified to pH 2 with 6 M HCl. Bound phenolics were then extracted three times with diethyl ether (DE) and ethyl acetate (EA) (1:1 v/v) by manually shaking before centrifuging at 2500× g for 10 min. DE/EA layers were combined, and the supernatants were pooled and evaporated to less than 5 mL. The concentrated samples were reconstituted to a final volume of 15 mL with methanol, then stored at −20 °C until further use.

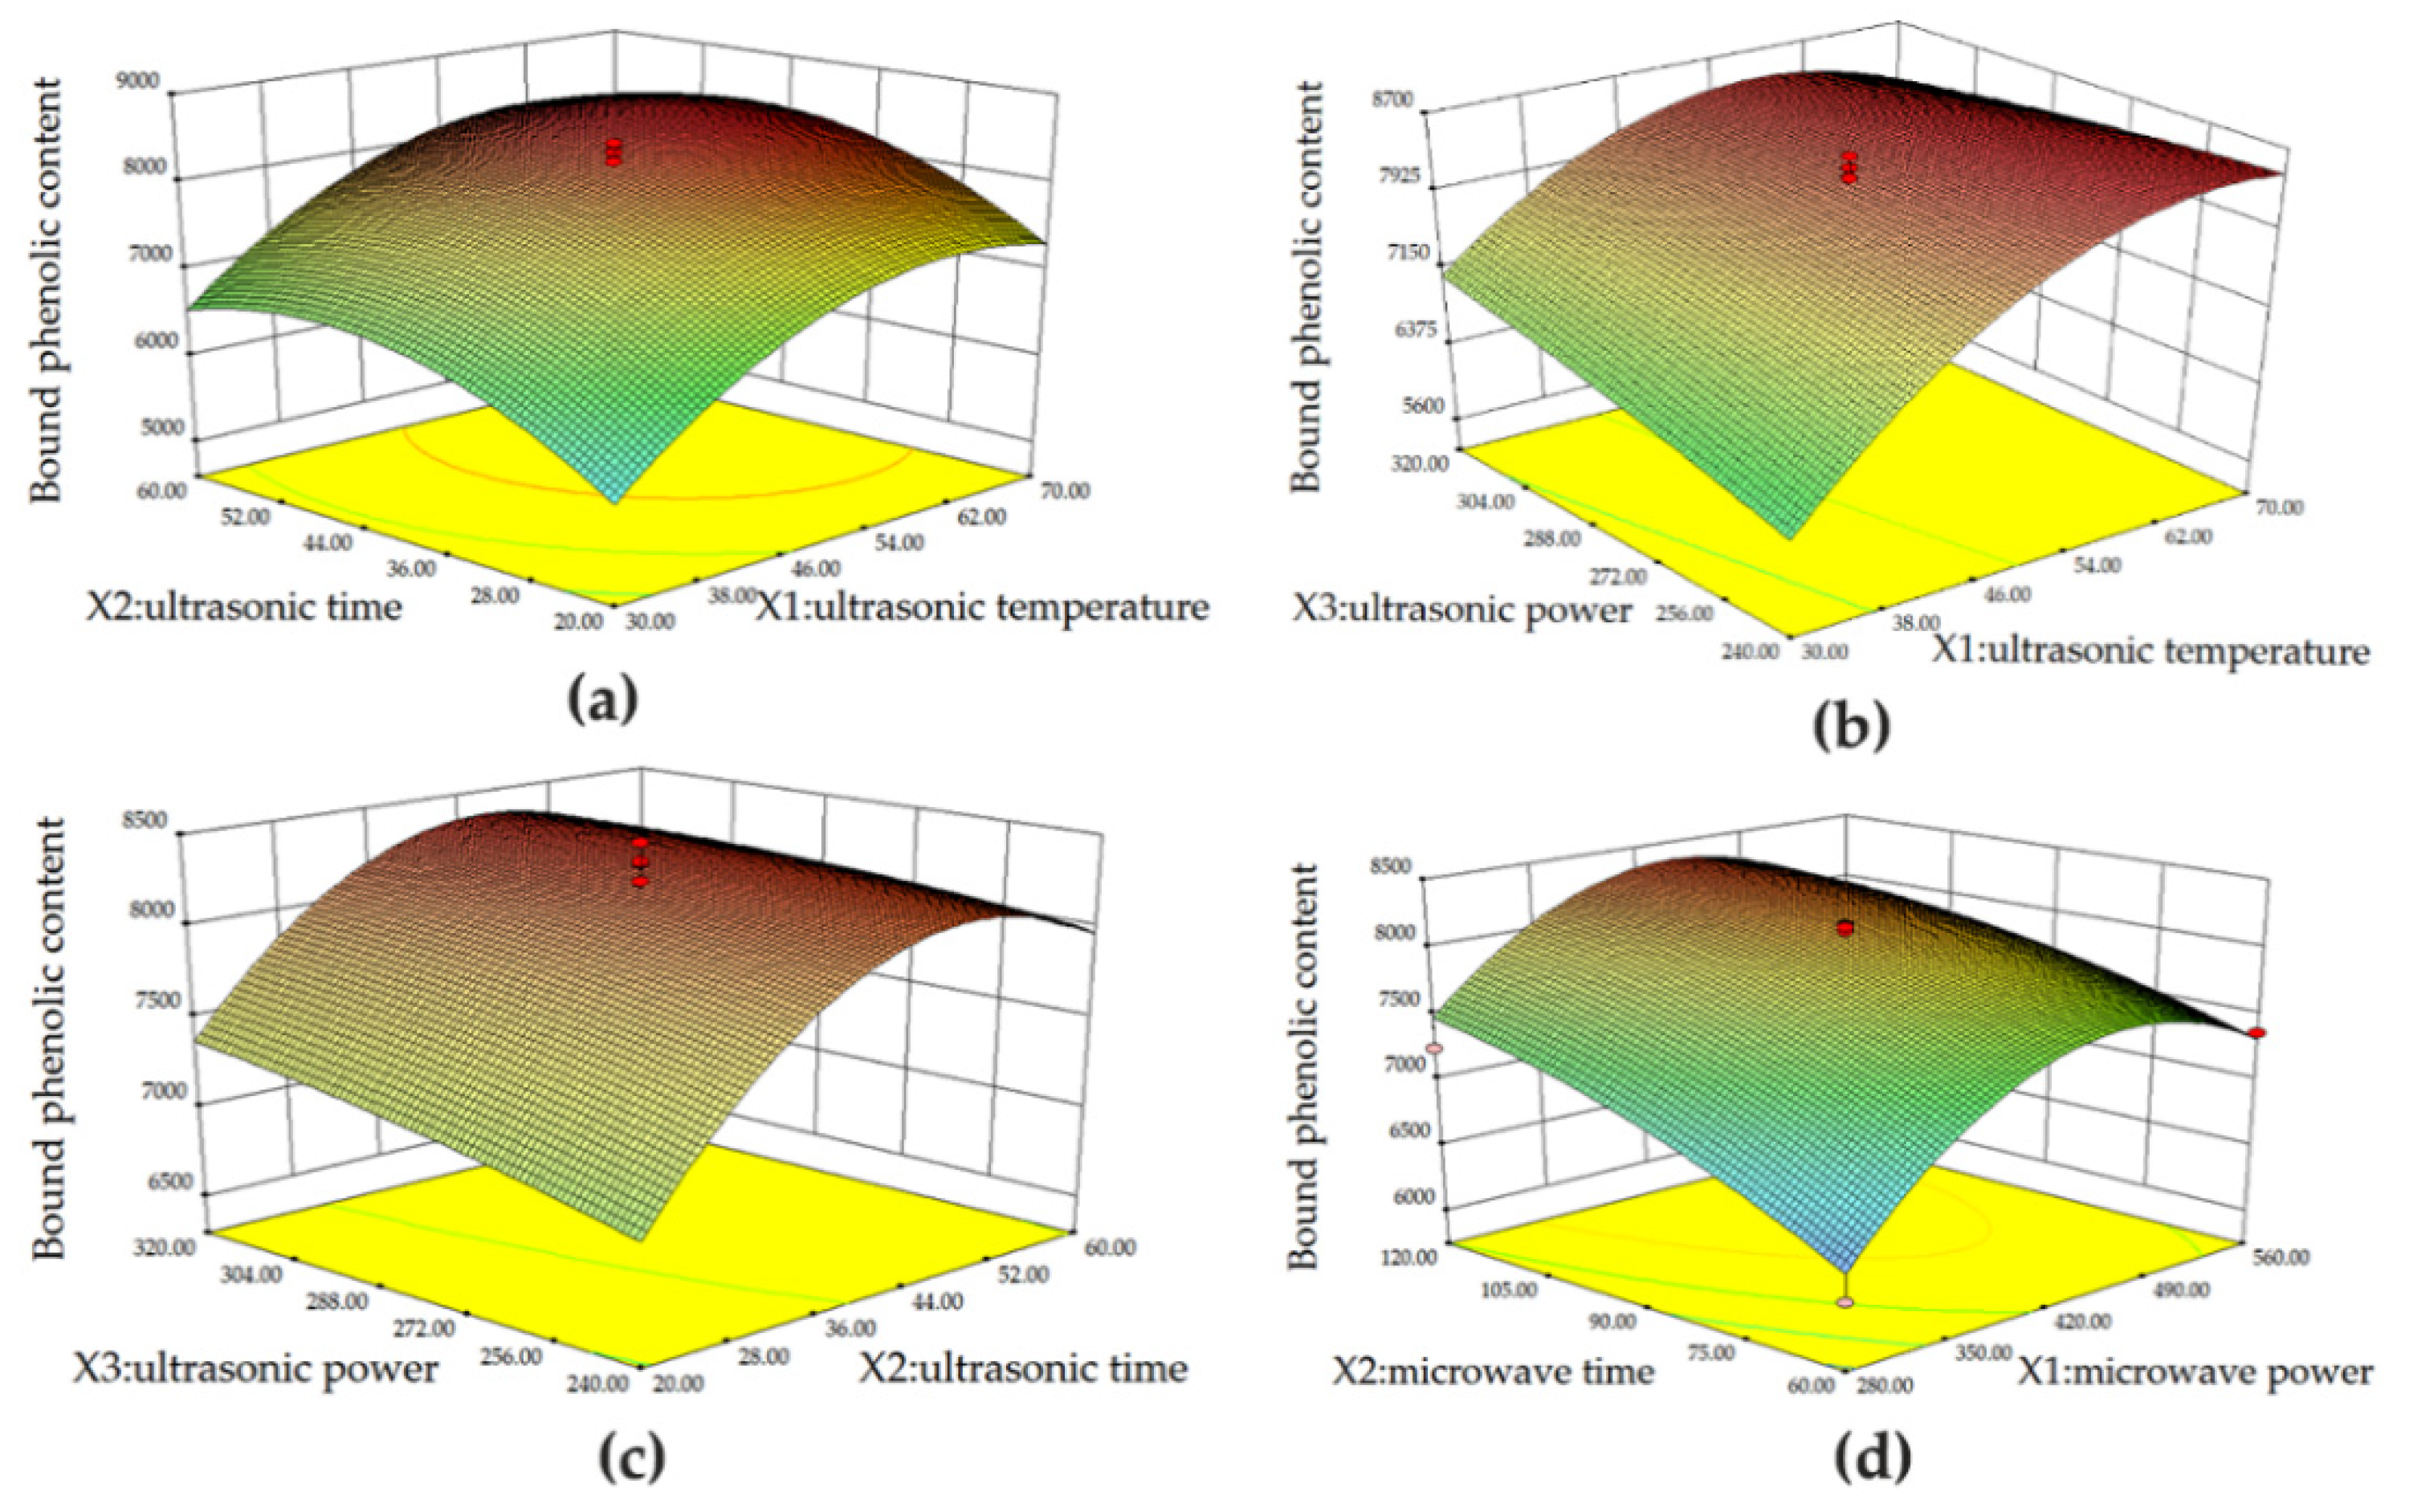
2.5. Response Surface Design for UAE and MAE

2.5.1. Ultrasound-Assisted Extraction (UAE)

Bound phenolics were extracted with 2 M NaOH and assisted with an ultrasound instrument (THC-2B, Jining Tianhua Ultrasound Electronic Instrument Co., Ltd., Jining, China). Ultrasonic temperature (X1), ultrasonic time (X2), and ultrasonic power (X3) were selected as independent variables. TBPCs measured by the Folin-Ciocalteu method were used as a response value (Y). The central composite design (CCD) was carried out for the levels of each independent variable. The ANOVA model was established by the Design-Expert version 8.0.6 software (Minneapolis, MN, USA). The response surface independent variables and levels design are shown in Table 1.

2.5.2. Microwave-Assisted Extraction (MAE)

Bound phenolics were extracted from Jizi439 BWB with 2 M NaOH assisted with a microwave oven (700 W, Galanz Microwave Oven Manufacture Co., Ltd., Foshan, China). Microwave power (X1) and microwave time (X2) were selected as independent variables, and TBPCs measured by the Folin-Ciocalteu method were used as a response value (Y). The central composite design (CCD) was carried out for the levels of each independent variable. The ANOVA model was established by the Design-Expert 8.0.6 software. The response surface independent variables and levels design are shown in Table 2.

2.5.3. Model Fitting

Experimental data were fitted to a second-order polynomial model. The generalized second-order polynomial model used in the response surface analysis was as follows:
Y = β 0 + i = 1 3 β i X i + i = 1 3 β i i X i 2 + i < j = 1 3 β i j X i X j  
where Y represented the measured response (TBPCs); β0, βi, βii, and βij were the regression coefficients for intercept, linear, quadratic, and interaction terms, respectively; Xi and Xj were the coded values of the ith and jth independent variables. The variable XiXj represented the first order interaction between Xi and Xj for (i < j).

2.5.4. Verification of Model

Bound phenolics were extracted under optimized conditions of UAE or MAE, and the actual experimental data and the predicted value calculated by equation in Section 2.5.3 were compared for the purpose of determining the validity of the model.

2.6. Determination of the Total Bound Phenolic Contents (TBPCs)

TPBCs were determined using Folin-Ciocalteu reagent, as adapted from Chen et al. [30]. Briefly, in each well of the 96-well plate, an aliquot of the 20 µL sample solution or gallic acid standard solution (0–180 µg/mL) was mixed with 100 µL of the Folin-Ciocalteu reagent. The mixture reacted for 5 min at room temperature before the addition of 80 µL 7.5% NaCO2 solution and then kept in the dark for 2 h at room temperature. The absorbance was measured at 750 nm using a microplate reader (EnSpire® Multimode Plate reader, PerkinElmer Management Co., Ltd., Shanghai, China). Each well was repeated six times. The TBPCs was calculated and expressed as micrograms of gallic acid equivalent per gram of BWB (µg GAE/g).

2.7. Determination of Antioxidation Activity (AA)

DPPH assay: The DPPH scavenging activity of the Jizi439 BWB extracts was determined according to Shimamura et al. [31]. In brief, the DPPH solution was freshly prepared before each use. In total, 20 μL of the sample solution and 80 μL of Tris-HCl buffer (0.1 M) were mixed before 100 μL of DPPH solution was added. The mixture was then allowed to stand for 30 min in the dark at room temperature. Absorbance was read at 515 nm using a microplate reader (EnSpire® Multimode Plate reader, PerkinElmer Management Co., Ltd., Shanghai, China). The radical scavenging activity in terms of the inhibition ratio was calculated using the following equation:
Inhibition   ratio   ( % ) = ( 1 A s A 1 A c ) × 100
where As was the absorbance of DPPH solution and Tris-HCl buffer with the sample solution; Ac was the absorbance of DPPH solution and Tris-HCl buffer with methanol; A1 was the absorbance of Tris-HCl buffer and the sample solution, with methanol for background absorbance.
ABTS assay: This procedure was conducted according to Wu and Maria et al. [32,33], with some modification. The ABTS•+ was generated by reacting an ABTS aqueous solution at 7.4 mM with a K2S2O8 solution at 2.6 mM in the dark for 12−16 h and adjusting the Abs734 nm to 0.700 (±0.020) with a pH 7.4 phosphate buffer solution. The sample solution of 10 μL was mixed with 190 μL of ABTS, and the absorbance was measured under 734 nm after avoiding light 20 min at room temperature. The solution was then shaken for 30 s during measurement to fully mix. The radical scavenging activity in terms of the inhibition ratio was calculated using the following equation:
Inhibition   ratio   ( % ) = ( 1 A 1 A 2 A 3 ) × 100
where A1 was the absorbance of the ABTS solution with the sample solution; A2 was the absorbance of the sample solution with methanol; A3 was the absorbance of the ABTS solution with methanol.

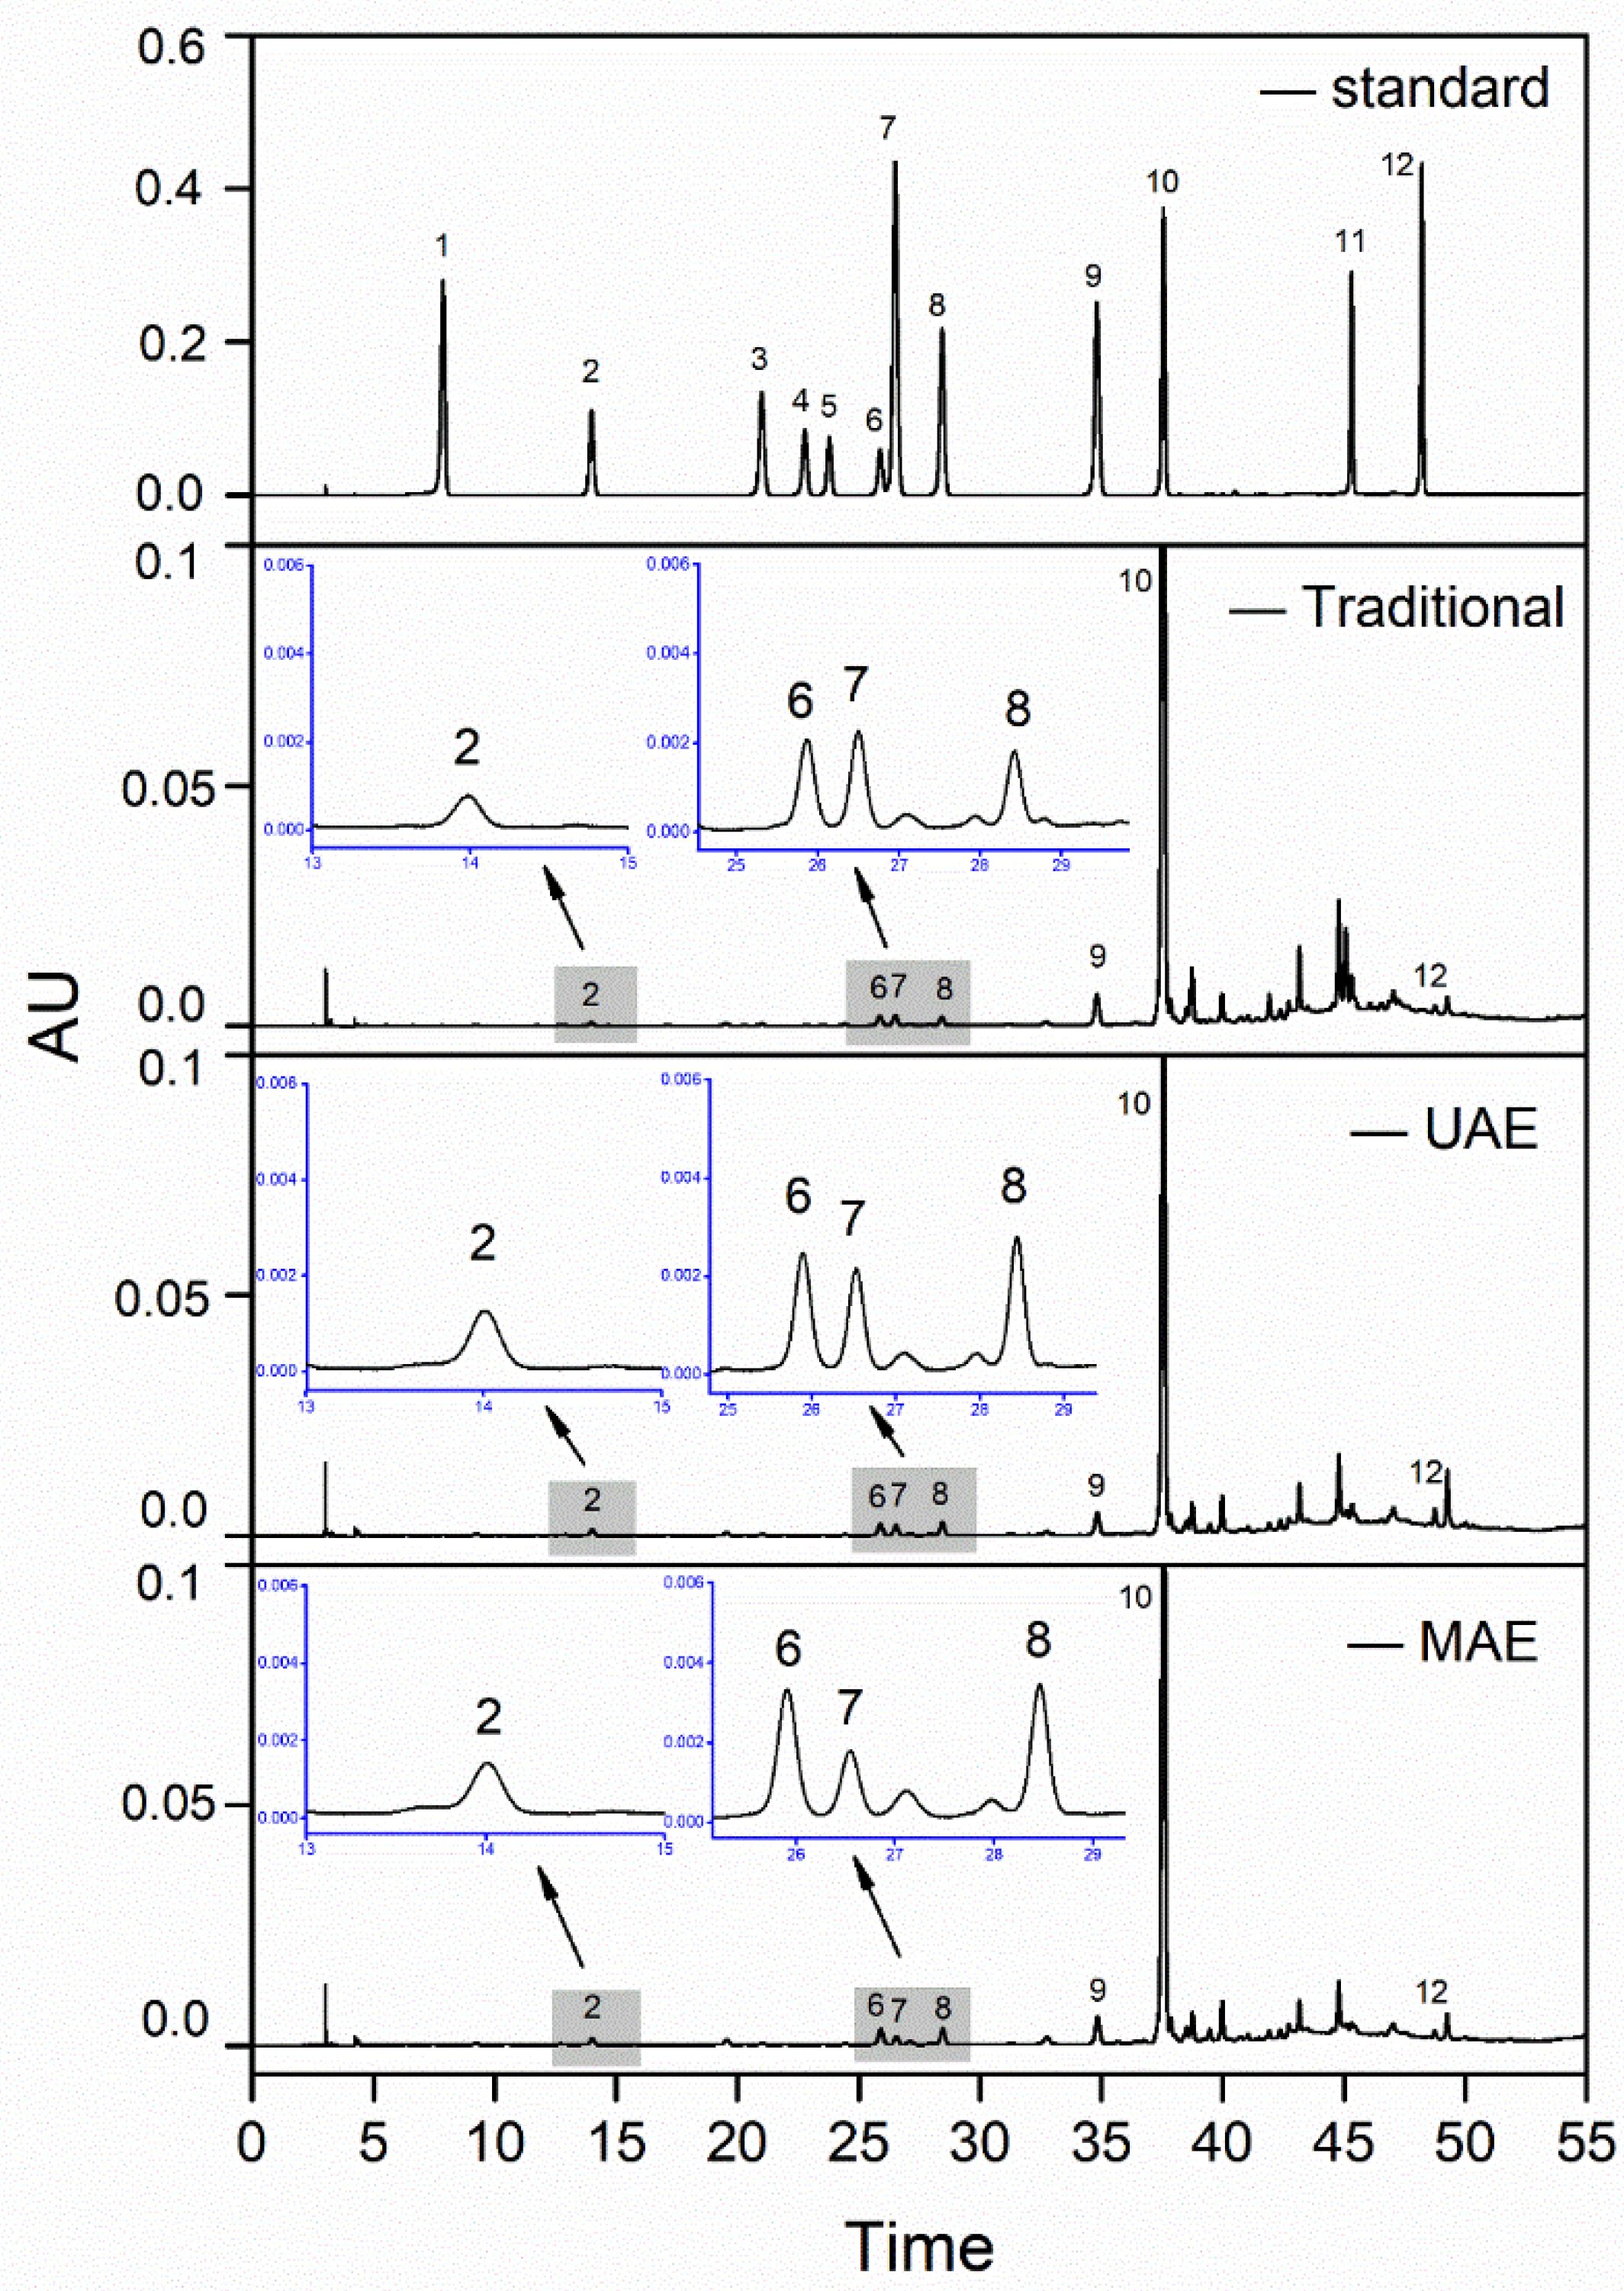
2.8. HPLC Analysis of Bound Phenolic Extracts from Jizi439 BWB

HPLC analysis was carried out according to Kim et al. [18], with slight modifications. The profile of TBPs was analyzed using a Waters e2695 HPLC system equipped with an auto sampler, a Waters XSelect® HSS T3 column (250 × 4.6 mm, 5 µm), and a UV detector (Milford, MA, USA). The mobile phase consisted of acetonitrile (solvent A) and 2% acetic acid solution(solvent B). The elution program was set as follows: 0–30 min, 0–15% A; 30–50 min, 15–50% A; 50–55 min, 50–100% A; 55–60 min, 100–0% A; 60–70 min, 0%A, at a flow rate of 1 mL/min. The injection volume and column temperature were set at 10 µL and 30 °C, respectively. Peaks were read at 280 nm. Retention times and chromatographic peaks were matched with those of the standards.

2.9. Statistical Analysis

All measurements were independently conducted in triplicate. Data were expressed as mean ± standard deviations (SD). The adequacy of the RSM model was predicted through the regression (R2) and ANOVA analysis. The CCD and the corresponding analysis of the data, including the generated 3D response surfaces and the determination of the optimal set of variables that maximize the yield of bound phenolics, were carried out using the software package Design Expert Version 8.0.6 software (Minneapolis, MN, USA).
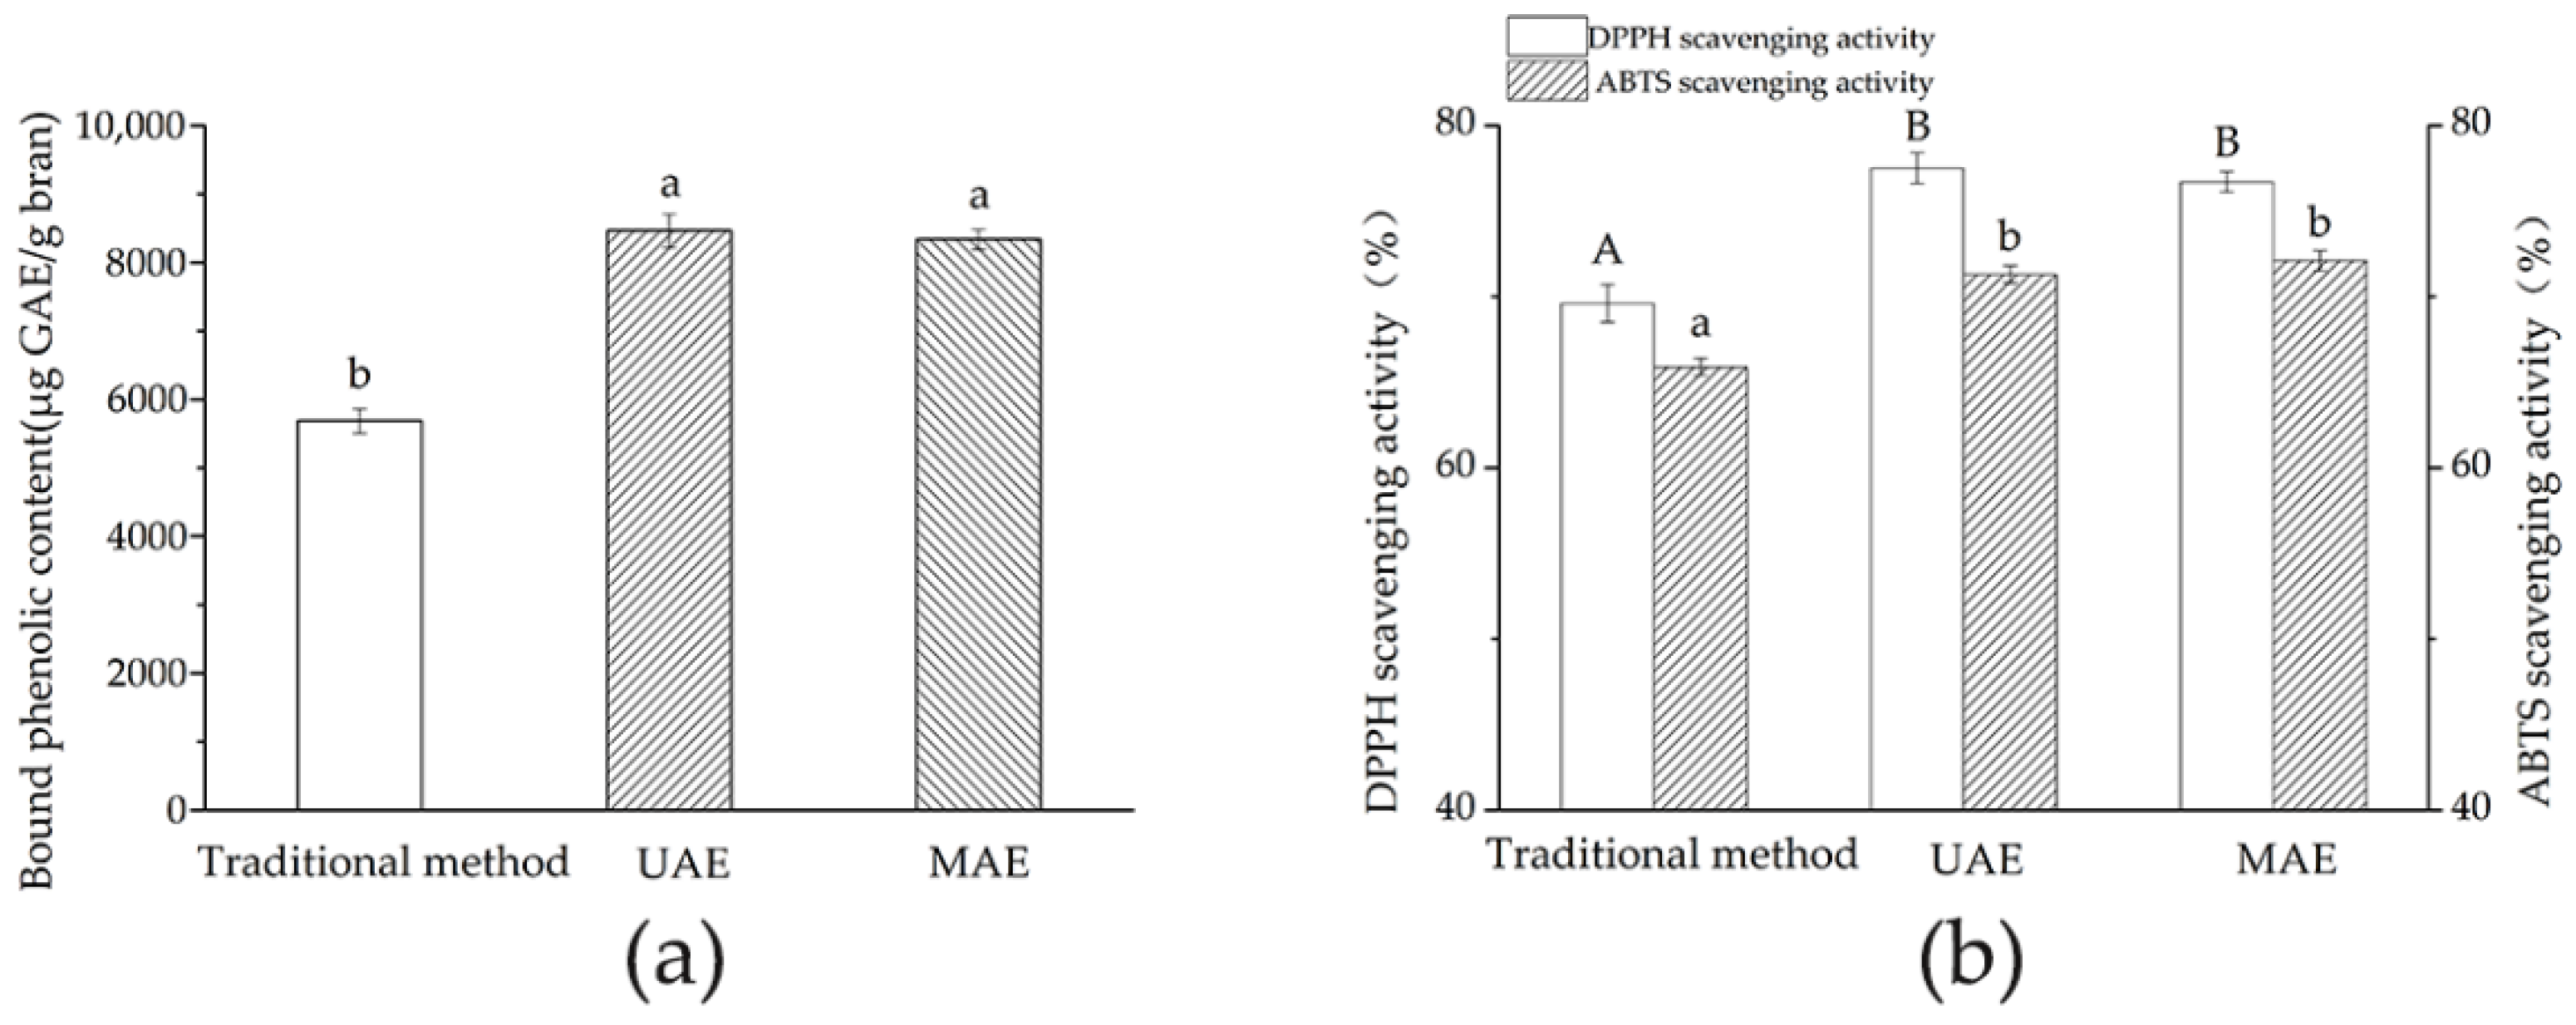
3. Results and discussion

3.1. Modeling Fitting

3.1.1. Modeling of UAE

The data of TBPCs obtained from the 20 experimental runs are shown in Table 3, analyzed by ANOVA and R2 interpretation at 95% confidence level (p < 0.05) (Table 4) and fitted to a second-order polynomial model (Y—TBPCs value, X1—ultrasonic temperature, X2—ultrasonic time, X3—ultrasonic power) with insignificant items being removed:
Y = −11,507.48197 + 327.15102X1 + 177.30934X2 − 0.38409X1X3 − 1.77471X12 − 1.51980X22.
The ANOVA in Table 4 declared that the fitted model was significant (F = 29.82, p < 0.0001). The insignificance of the lack-of-fit test (p = 0.1266 > 0.05) verified the suitability of the selected model. The ANOVA table showed that TBPCs were significantly influenced by ultrasonic temperature (X1), ultrasonic time (X2), and the interaction between temperature and ultrasonic power (X1X3) (p < 0.05, Table 4). The R2 value of 0.9641 and adjust R2 value of 0.9318 indicated that the observed response values were highly correlated with the predicted values. All the above results revealed the validity of the model for predicting the real correlations between the response and independent variables.

3.1.2. Modeling of MAE

The data of TBPCs obtained from the 13 experimental runs are shown in Table 5, analyzed by ANOVA and R2 interpretation at 95% confidence level (p < 0.05) (Table 6) and fitted to a second-order polynomial model (Y—TBPCs value, X1—microwave power, X2—microwave time) with insignificant items being removed:
Y = −2791.25618 + 34.97056X1 + 55.50481X2 − 0.035451X12.
The results of ANOVA for TBPCs are shown in Table 6, which confirm the reliability of the predictive models. The ANOVA table shows that TBPCs were significantly influenced by microwave power (X1), microwave time (X2), and the quadratic parameter (X12) (p < 0.05, Table 6). In this experiment, for TBPCs, the R2 value was 0.9558, adjust R2 value was 0.9242, lack of fit value was insignificant (p = 0.0716 > 0.05), and the p-value of the model was significant (p = 0.0001 < 0.05). All of these indicated that the polynomial prediction model was reliable.

3.2. Analysis of Response Surface

3.2.1. Graphical Analysis of UAE

The effect of ultrasonic temperature and time on the TBPCs were shown in Figure 2a. The increase in ultrasonic temperature elevated the TBPCs value, which reached peak at around 66 °C, then gradually came to steady. Our results were in agreement with Wang et al. [22], who reported that the total phenolic content was maximized at 65 °C. This was mainly due to the fact that a higher temperature might improve the solubility of phenolic compounds in wheat bran. Similarly, longer extraction time lead to a higher TPBC. It reached the peak at around 52 min and then decreased, which was in line with earlier studies that the highest yields of phenolic compounds are obtained when the ultrasound extraction time is around 55 min [34]. As is shown in Figure 2b,c, increased extraction temperature and time resulted in a remarkable increase in TBPCs, while the ultrasonic power only had a mild influence on the TBPCs (p > 0.05, Table 4). These results further confirm that ultrasonic temperature and time significantly affect the response value (TBPC) rather than ultrasonic power.

3.2.2. Graphical Analysis of MAE

The interaction between microwave power and microwave time against the TBPCs value is plotted in Figure 2d. TBPCs increased by extraction time and reached a peak value at 120 s. Meanwhile, the TBPCs value was increased markedly when the microwave power increased from 280 to 420 W. The increasement could be attributed to the exposure of the bran to microwave irradiation, which caused more ruptures in the tissues and cell walls of the bran, leading to an increased release of bound phenolics [35,36]. Additionally, the elevated temperature caused by microwave power increased the mass diffusion rate, which also resulted in more bound phenolics liberated from the bran. However, the long exposure in the presence of high microwave power in turn resulted in a declined extraction rate due to thermal degradation [35,37] that further caused a decrease in TBPCs after 420 W.

3.3. Validation and Verification of Predicted Model

3.3.1. Verification of the Model for UAE

The optimal conditions of UAE obtained using the RSM model were as follows: ultrasonic temperature, 65.62 °C; ultrasonic time, 48.28 min; and ultrasonic power, 240 W. However, in practice, it was not applicable to maintain the recommended conditions during processing. Therefore, optimum conditions were targeted as 66 °C, 48 min, and 240 W ultrasonic power. Under the optimal conditions, the model predicted a maximum response of 8605.1 μg GAE/g. Meanwhile, experimental rechecking was performed to compare with the predicted data. A mean value of 8466.7 ± 240.9 μg GAE/g (n = 3) was obtained from the real experiments, and the difference between the predicted value and the experimental result was 1.6%, which validated the RSM model.

3.3.2. Verification of the Model for MAE

Based on the prediction of the models, the optimized MAE conditions were microwave power of 420 W and microwave time of 120 s. Under the optimal conditions, the actual TBPC was 8340.7 ± 146.7 μg GAE/g, which was comparable with the predicted value (8362.77 μg GAE/g), and the difference between them was 0.3%, indicating the accuracy of the model.

3.4. Comparisons of TBPCs and AAs among Different Extraction Methods

TBPCs of different extraction methods and their antioxidant activities were compared (Figure 3). According to Figure 3a, although no significant difference was found between UAE and MAE groups, their TPBCs were both significantly higher than that of the traditional method. Similar results were reported when comparing MAE with conventional extraction techniques, regarding extraction of phenolics from blueberry leaves, lemon myrtle, and melastoma sanguineum [38, 39,40]. In addition, TBPCs may vary with different plant sources or extraction methods. For example, Brij Verma et al. [8] reported that TBPCs in 51 wheat cultivars ranged from 2304.9 to 5386.1 µg GAE/g by the traditional alkaline extraction method. Ahmad et al. [41] found that the phenolics from defatted wheat germ obtained by MAE was higher than that of UAE and conventional extraction techniques.
The antioxidant activities of the extracts (in terms of DPPH and ABTS radical scavenging activities) obtained by the three methods were shown in Figure 3b. A higher percentage of DPPH and ABTS scavenging activity is associated with a stronger antioxidant activity. In the present study, remarkable DPPH or ABTS radical scavenging capacity were obtained in all methods. Antioxidant capacities measured by DPPH and ABTS and were not significantly different between UAE and MAE. However, they were both significantly higher than that of the traditional method. Our results confirmed that the DPPH radical scavenging activity of Jizi439 BWB is associated with the content of bound phenolics, which is consistent with previous research [17,42].
Taken together, UAE and MAE rivalled each other in TBP yields and antioxidant activities; however, when taking operation time and energy consumption into consideration, MAE was more efficient than UAE.

3.5. HPLC Analysis of Phenolic Profile

Qualitative and quantitative analysis of bound phenolics from the extracts obtained by the three methods under optimal conditions were performed using HPLC. Results are shown in Figure 4 and Table 7. The selected 12 standard phenolics have been previously reported in wheat bran [18,30,43], among which six phenolic acids and one flavonoid were detected, including protocatechuic acid, vanillic acid, caffeic acid, syringic acid, p-coumaric acid, ferulic acid, and apigenin. In general, UAE and MAE were more efficient in releasing the phenolic compounds when compared with the traditional method (Table 7). Ferulic acid was predominant in Jizi439 BWB and drastically higher than any other phenolics detected, accounting for 85–91% of the total identified phenolics. Similar phenomena have been mentioned in previous reports [17,44,45]. In addition, our previous study [28] found that ferulic acid was not detectable in its free form in the extract, indicating that ferulic acid existed in bound form in the wheat bran.
According to Table 7, protocatechuic acids and apigenin were highest in UAE extract, meanwhile syringic acid and vanillic acid were highest in MAE extract, and all of them were higher than that of the traditional method. After reviewing published literature, we found that the underlying reasons for the difference in the yield of individual phenolics by UAE and MAE have not been well studied; thus, more investigations should be done in the future. It should be noted that the total amount of identified phenolics was significantly lower than the result obtained by the Folin-Ciocalteu method, because the Folin-Ciocalteu assay does not only measure phenolics, but also reacts with other antioxidants that may exist in the extracts, such as proteins, carbohydrates, and amino acids [46]. In addition, the HPLC only detected the content of several representative phenolics, which may be another reason for the difference in total phenolic content between the Folin-Ciocalteu method and the HPLC.

4. Conclusions

The optimal UAE and MAE conditions generated by RSM models were ultrasonic temperature of 66 °C, ultrasonic time of 48 min, ultrasonic power of 240 W for UAE, microwave power of 420 W, and extraction time of 120 s for MAE, respectively. Under optimal conditions, the TBPCs and antioxidant activity of UAE and MAE were comparable with each other, and both were significantly higher than that of the traditional method. However, MAE possessed the economic advantage of a short extraction time with less energy consumption as compared to UAE and the traditional method. Based on our results, MAE is considered an efficient method to obtain large quantities of bound phenolics for further usage of a functional ingredient for food and pharmaceutical products.

Author Contributions

Conceptualization, X.C. and W.D.; methodology, X.C., K.Z. and K.S.; validation, K.Z.; investigation, K.S.; data curation, K.S.; writing—original draft preparation, K.S.; writing—review and editing, X.C.; supervision, X.C. and W.D.; funding acquisition, X.C. and W.D., X.C. and K.S. contributed equally to this study. All authors have read and agreed to the published version of the manuscript.

Funding

The study was supported by Research and Innovation Initiatives of WHPU (Grant No. 2021Y03) and Key Laboratory of Bulk Grain and Oil Deep Processing Ministry of Education (Wuhan Polytechnic University) (Grant No. 2020JYBQGDKFB12).

Institutional Review Board Statement

Not applicable.

Informed Consent Statement

Not applicable.

Data Availability Statement

The data is contained within the article.

Conflicts of Interest

The authors declare no conflict of interest.

References

  1. Lin, L. On the Nutrient Components and Its Utilization of Wheat Bran. Agric. Sci. Technol. Equip. 2010, 3, 41–42. [Google Scholar]
  2. Bonoli, M.; Marconi, E.; Caboni, M.F. Free and bound phenolic compounds in barley (Hordeum vulgare L.) flours. J. Chromatogr. A 2004, 1057, 1–12. [Google Scholar] [CrossRef] [PubMed]
  3. Fernandez-Panchon, M.S.; Villano, D.; Troncoso, A.M.; Garcia-Parrilla, M.C. Antioxidant Activity of Phenolic Compounds: From In Vitro Results to In Vivo Evidence. Crit. Rev. Food Sci. Nutr. 2008, 48, 649–671. [Google Scholar] [CrossRef] [PubMed]
  4. Dinelli, G.; Carretero, A.S.; Di Silvestro, R.; Marotti, I.; Fu, S.; Benedettelli, S.; Gutiérrez, A.F. Determination of phenolic compounds in modern and old varieties of durum wheat using liquid chromatography coupled with time-of-flight mass spectrometry. J. Chromatogr. A 2009, 1216, 7229–7240. [Google Scholar] [CrossRef] [PubMed]
  5. Li, Y.; Ma, D.; Sun, D.; Wang, C.; Zhang, J.; Xie, Y.; Guo, T. Total phenolic, flavonoid content, and antioxidant activity of flour, noodles, and steamed bread made from different colored wheat grains by three milling methods. Crop J. 2015, 3, 328–334. [Google Scholar] [CrossRef] [Green Version]
  6. Bueno-Herrera, M.; Pérez-Magario, S. Validation of an extraction method for the quantification of soluble free and insoluble bound phenolic compounds in wheat by HPLC-DAD. J. Cereal Sci. 2020, 93, 102984. [Google Scholar] [CrossRef]
  7. Acosta-Estrada, B.A.; Gutierrez-Uribe, J.A.; Serna-Saldivar, S.O. Bound phenolics in foods: A review. Food Chem. 2014, 152, 46–55. [Google Scholar] [CrossRef]
  8. Verma, B.; Hucl, P.; Chibbar, R.N. Phenolic Content and Antioxidant Properties of Bran in 51 Wheat Cultivars. Cereal Chem. 2008, 85, 544–549. [Google Scholar] [CrossRef]
  9. Chandrasekara, A.; Shahidi, F. Content of Insoluble Bound Phenolics in Millets and Their Contribution to Antioxidant Capacity. J. Agric. Food Chem. 2010, 58, 6706–6714. [Google Scholar] [CrossRef]
  10. Liyana-Pathirana, C.M.; Shahidi, F. Importance of insoluble-bound phenolics to antioxidant properties of wheat. J. Agric. Food Chem. 2006, 54, 1256. [Google Scholar] [CrossRef]
  11. Rocchetti, G.; Perez, G.R.; Lorenzo, J.M.; Barba, F.J.; Garcia Oliveira, P.; Prieto, M.A.; Simal-Gandara, J.; Mosele, J.I.; Motilva, M.-J.; Tomas, M.; et al. Functional implications of bound phenolic compounds and phenolics-food interaction: A review. Compr. Rev. Food Sci. Food Saf. 2022, 21, 811–842. [Google Scholar] [CrossRef] [PubMed]
  12. Roasa, J.; De Villa, R.; Mine, Y.; Tsao, R. Phenolics of cereal, pulse and oilseed processing by-products and potential effects of solid-state fermentation on their bioaccessibility, bioavailability and health benefits: A review—ScienceDirect. Trends Food Sci. Technol. 2021, 116, 954–974. [Google Scholar] [CrossRef]
  13. Bing, Z.; Zhang, Y.; Li, H.; Deng, Z.; Tsao, R. A review on insoluble-bound phenolics in plant-based food matrix and their contribution to human health with future perspectives. Trends Food Sci. Technol. 2020, 105, 347–362. [Google Scholar]
  14. Lan, S.Q.; Li, X.P.; Zhang, Y.L. Development of a New Black Wheat Variety Jizi 439 with High Contents of Trace Elements. J. Hebei Agric. Sci. 2010, 14, 43–45. [Google Scholar]
  15. Sosulski, F.; Krygier, K.; Hogge, L. Free, esterified, and insoluble-bound phenolic acids. 3. Composition of phenolic acids in cereal and potato flours. J. Agric. Food Chem. 1982, 30, 337–340. [Google Scholar] [CrossRef]
  16. Tang, Y.; Zhang, B.; Li, X.; Chen, P.X.; Zhang, H.; Liu, R.; Tsao, R. Bound Phenolics of Quinoa Seeds Released by Acid, Alkaline, and Enzymatic Treatments and Their Antioxidant and α-Glucosidase and Pancreatic Lipase Inhibitory Effects. J. Agric. Food Chem. 2016, 64, 1712–1719. [Google Scholar] [CrossRef]
  17. Verma, B.; Hucl, P.; Chibbar, R.N. Phenolic acid composition and antioxidant capacity of acid and alkali hydrolysed wheat bran fractions. Food Chem. 2009, 116, 947–954. [Google Scholar] [CrossRef]
  18. Kim, K.H.; Tsao, R.; Yang, R.; Cui, S. Phenolic acid profiles and antioxidant activities of wheat bran extracts and the effect of hydrolysis conditions. Food Chem. 2006, 95, 466–473. [Google Scholar] [CrossRef]
  19. Ti, H.; Li, Q.; Zhang, R.; Zhang, M.; Deng, Y.; Wei, Z.; Chi, J.; Zhang, Y. Free and bound phenolic profiles and antioxidant activity of milled fractions of different indica rice varieties cultivated in southern China. Food Chem. 2014, 159, 166–174. [Google Scholar] [CrossRef]
  20. Alshikh, N.; Camargo, A.D.; Shahidi, F. Phenolics of selected lentil cultivars, Antioxidant activities and inhibition of low-density lipoprotein and DNA damage. J. Funct. Foods 2015, 18, 1022–1038. [Google Scholar] [CrossRef]
  21. Herrera, M.C.; Castro, M. Ultrasound-assisted extraction for the analysis of phenolic compounds in strawberries. Anal. Bioanal. Chem. 2004, 379, 1106–1112. [Google Scholar] [CrossRef] [PubMed]
  22. Wang, J.; Sun, B.; Cao, Y.; Tian, Y.; Li, X. Optimisation of ultrasound-assisted extraction of phenolic compounds from wheat bran. Food Chem. 2014, 106, 804–810. [Google Scholar] [CrossRef]
  23. Sarma, L.; Chakraborty, S.; Das, M.J.; Duary, R.K. Optimization of ultrasound-assisted extraction of phenolic compounds from Sesamum indicum. Nat. Prod. Res. 2020, 34, 1931–1936. [Google Scholar] [CrossRef] [PubMed]
  24. Jokic, S.; Cvjetko, M.; Božić, Đ.; Fabek, S.; Toth, N.; Vorkapić-Furač, J.; Redovniković, I.R. Optimisation of microwave-assisted extraction of phenolic compounds from broccoli and its antioxidant activity. Int. J. Food Sci. Technol. 2012, 47, 2613–2619. [Google Scholar] [CrossRef]
  25. Alara, O.R.; Abdurahman, N.H.; Mudalip, S.K.A. Optimizing Microwave-Assisted Extraction Conditions to Obtain Phenolic-Rich Extract from Chromolaena odorata Leaves. Chem. Eng. Technol. 2019, 42, 1733–1740. [Google Scholar] [CrossRef]
  26. Rao, M.V.; Sengar, A.S.; Sunil, C.K.; Rawson, A. Ultrasonication-A green technology extraction technique for spices: A review. Trends Food Sci. Technol. 2021, 116, 975–991. [Google Scholar] [CrossRef]
  27. Moro, K.I.B.; Bender, A.B.B.; da Silva, L.P.; Garcia Penna, N. Green Extraction Methods and Microencapsulation Technologies of Phenolic Compounds From Grape Pomace: A Review. Food Bioprocess Technol. 2021, 14, 1407–1431. [Google Scholar] [CrossRef]
  28. Gómez-López, I.; Lobo-Rodrigo, G.; Portillo, M.P.; Pilar Cano, M. Ultrasound-Assisted “Green” Extraction (UAE) of Antioxidant Compounds (Betalains and Phenolics) from Opuntia stricta var. Dilenii’s Fruits: Optimization and Biological Activities. Antioxidants 2021, 10, 1786. [Google Scholar] [CrossRef]
  29. Melgar, B.; Dias, M.I.; Barros, L.; Ferreira, I.C.F.R.; Rodriguez-Lopez, A.D.; Garcia-Castello, E.M. Ultrasound and Microwave Assisted Extraction of Opuntia Fruit Peels Biocompounds: Optimization and Comparison Using RSM-CCD. Molecules 2019, 24, 3618. [Google Scholar] [CrossRef] [Green Version]
  30. Chen, X.; Li, X.; Zhu, X.; Wang, G.; Zhuang, K.; Wang, Y.; Ding, W. Optimization of Extrusion and Ultrasound-Assisted Extraction of Phenolic Compounds from Jizi439 Black Wheat Bran. Processes 2020, 8, 1153. [Google Scholar] [CrossRef]
  31. Shimamura, T.; Sumikura, Y.; Yamazaki, T.; Tada, A.; Kashiwagi, T.; Ishikawa, H.; Matsui, T.; Sugimoto, N.; Akiyama, H.; Ukeda, H. Applicability of the DPPH Assay for Evaluating the Antioxidant Capacity of Food Additives—Inter-laboratory Evaluation Study. Anal. Sci. Int. J. Jpn. Soc. Anal. Chem. 2014, 30, 717. [Google Scholar] [CrossRef] [PubMed] [Green Version]
  32. Wu, S.B.; Dastmalchi, K.; Long, C.; Kennelly, E.J. Metabolite profiling of jaboticaba (Myrciaria cauliflora) and other dark-colored fruit juices. Planta Med. 2012, 60, 1185. [Google Scholar]
  33. Irakli, M.; Kleisiaris, F.; Kadoglidou, K.; Katsantonis, D. Optimizing Extraction Conditions of Free and Bound Phenolic Compounds from Rice By-Products and Their Antioxidant Effects. Foods 2018, 7, 93. [Google Scholar] [CrossRef] [Green Version]
  34. Rocha, J.D.C.G.; Procopio, F.R.; Mendonca, A.C.; Vieira, L.M.; Perrone, I.T.; Barros, F.A.R.D.; Stringheta, P.C. Optimization of ultrasound-assisted extraction of phenolic compounds from jussara (Euterpe edulis M.) and blueberry (Vaccinium myrtillus) fruits. Food Sci. Technol. 2018, 38, 45–53. [Google Scholar] [CrossRef] [Green Version]
  35. Quan, V.V. Optimization of Commercial Microwave Assisted-Extraction Conditions for Recovery of Phenolics from Lemon-Scented Tee Tree (Leptospermum petersonii) and Comparison with Other Extraction Techniques. Foods 2022, 11, 50. [Google Scholar]
  36. Chiremba, C.; Rooney, L.W.; Beta, T. Microwave-assisted extraction of bound phenolic acids in bran and flour fractions from sorghum and maize cultivars varying in hardness. J. Agric. Food Chem. 2012, 60, 4735–4742. [Google Scholar] [CrossRef] [PubMed] [Green Version]
  37. Akbari, S.; Nour, A.H.; Yunus, R.M. Determination of phenolics and saponins in fenugreek seed extracted via microwave-assisted extraction method at the optimal condition. IOP Conf. Ser. Mater. Sci. Eng. 2020, 736, 022024. [Google Scholar] [CrossRef]
  38. Routray, W.; Orsat, V. MAE of phenolic compounds from blueberry leaves and comparison with other extraction methods. Ind. Crops Prod. 2014, 58, 36–45. [Google Scholar] [CrossRef]
  39. Quan, V.V. Optimization of Microwave-Assisted Extraction of Polyphenols from Lemon Myrtle: Comparison of Modern and Conventional Extraction Techniques Based on Bioactivity and Total Polyphenols in Dry Extracts. Processes 2021, 9, 2212. [Google Scholar]
  40. Zhao, C.N.; Zhang, J.J.; Li, Y.; Meng, X.; Li, H.B. Microwave-Assisted Extraction of Phenolic Compounds from Melastoma sanguineum Fruit: Optimization and Identification. Molecules 2018, 23, 2498. [Google Scholar] [CrossRef] [Green Version]
  41. Tesli, N.; Bojanić, N.; Rakić, D.; Takači, A.; Zeković, Z.; Fišteš, A.; Pavlić, B. Defatted wheat germ as source of polyphenols—Optimization of microwave-assisted extraction by RSM and ANN approach. Chem. Eng. Processing 2019, 143, 107634. [Google Scholar] [CrossRef]
  42. Ahmad, F.; Pasha, I.; Saeed, M.; Asgher, M. Antioxidant profiling of native and modified cereal brans. Int. J. Food Sci. Technol. 2019, 54, 1206–1214. [Google Scholar] [CrossRef]
  43. Rosa, N.N.; Barron, C.; Gaiani, C.; Dufour, C.; Micard, V. Ultra-fine grinding increases the antioxidant capacity of wheat bran. J. Cereal Sci. 2013, 57, 84–90. [Google Scholar] [CrossRef]
  44. Zhang, J.; Ding, Y.; Dong, H.; Hou, H.; Zhang, X. Distribution of Phenolic Acids and Antioxidant Activities of Different Bran Fractions from Three Pigmented Wheat Varieties. J. Chem. 2018, 2018, 1–9. [Google Scholar] [CrossRef] [Green Version]
  45. Martín-Diana, A.; García-Casas, M.J.; Martínez-Villaluenga, C.; Frías, J.; Peñas, E.; Rico, D. Wheat and Oat Brans as Sources of Polyphenol Compounds for Development of Antioxidant Nutraceutical Ingredients. Foods 2021, 10, 115. [Google Scholar] [CrossRef]
  46. Andres, A.I.; Petron, M.J.; Lopez, A.M.; Timon, M.L. Optimization of Extraction Conditions to Improve Phenolic Content and In Vitro Antioxidant Activity in Craft Brewers’ Spent Grain Using Response Surface Methodology (RSM). Foods 2020, 9, 1398. [Google Scholar] [CrossRef]
Figure 1. Methodological schematic for the extraction of bound phenolics by the traditional extraction method, UAE, and MAE; UAE, ultrasonic-assisted extraction; MAE, microwave-assisted extraction; TBPCs, total bound phenolic contents; AAs, antioxidant activities.
Foods 11 01478 g001
Figure 2. Graphical analysis of the effects of ultrasonic temperature (X1, °C) and ultrasonic time (X2, min) (a); ultrasonic temperature (X1, °C) and ultrasonic power (X3, W) (b); ultrasonic time (X2, min) and ultrasonic power (X3, W) (c); and microwave power (X1, W) and microwave time (X2, s) (d) on TBPCs (μg GAE/g).
Foods 11 01478 g002
Figure 3. Effect of different treatments on TBPCs (a) and antioxidation activity (b) of Jizi439 BWB. Values with different lowercase letters indicated statistically significant difference among (a) TBPCs or (b) ABTS scavenging activities from different treatments (p < 0.05). Values with different uppercase letters indicated statistically significant difference among (b) DPPH scavenging activities from different treatments (p < 0.05).
Foods 11 01478 g003
Figure 4. HPLC chromatogram of mixed standards and bound phenolic extracts obtained via different methods. Peak 1: gallic acid; peak 2: protocatechuic acid; peak 3: p-hydroxybenzoic acid; peak 4: catechin; peak 5: Chlorogenic acid; peak 6: vanillic acid; peak 7: caffeic acid; peak 8: syringic acid; peak 9: p-coumaric acid; peak 10: ferulic acid; peak 11: luteolin; peak 12: apigenin.
Foods 11 01478 g004
Table 1. Coded and actual levels of independent variables used in central composite design for ultrasound-assisted extraction.
FactorsLevel
−1.682−1011.682
X116.3630507083.64
X26.3620406073.64
X3212.73240280320347.27
X1, ultrasonic temperature, °C; X2, ultrasonic time, min; X3, ultrasonic power, W.
Table 2. Coded and actual levels of independent variables used in the central composite design for microwave-assisted extraction.
FactorsLevel
−1.414−1011.414
X1222.01280420560617.99
X247.576090120132.43
X1, microwave power, W; X2, microwave time, s.
Table 3. The UAE experimental design in coded and uncoded form for the optimization of variables using CCD.
No.Extraction Conditions (Independent Variables)Observed Responses (Dependent Variables)
X1X2X3TBPCs
130 (−1)20 (−1)240 (−1)5346.9 ± 66.7
270 (1)20 (−1)240 (−1)7564.5 ± 83.8
330 (−1)60 (1)240 (−1)6226.5 ± 139.6
470 (1)60 (1)240 (−1)8234.5 ± 73.3
530 (−1)20 (−1)320 (1)6502.2 ± 104.4
670 (1)20 (−1)320 (1)7351.1 ± 94.3
730 (−1)60 (1)320 (1)6874.1 ± 154
870 (1)60 (1)320 (1)7792.6± 230.5
916.36 (−1.682)40 (0)280 (0)4573.3 ± 110
1083.64 (1.682)40 (0)280 (0)7568.5 ± 178.1
1150 (0)6.36 (−1.682)280 (0)5329.8 ± 231.6
1250 (0)73.64 (1.682)280 (0)7388.8 ± 198
1350 (0)40 (0)212.73 (−1.682)7762.2 ± 33
1450 (0)40 (0)347.27 (1.682)8123.7 ± 219.9
1550 (0)40 (0)280 (0)8345 ± 230.4
1650 (0)40 (0)280 (0)8352.1 ± 125.7
1750 (0)40 (0)280 (0)8245.7 ± 104.7
1850 (0)40 (0)280 (0)8453.1±324.8
1950 (0)40 (0)280 (0)8246.7 ± 199.1
2050 (0)40 (0)280 (0)7846.6 ± 197.9
X1, ultrasonic temperature, °C; X2, ultrasonic time, min; and X3, ultrasonic power, W; TBPCs, total bound phenolic contents, μg GAE/g.
Table 4. ANOVA of the second polynomial model (UAE) for the TBPCs.
SourceSum of SquaresdfMean SquareF Valuep Value
Model2.40 × 10792.67 × 10629.82<0.0001
X18.91 × 10618.91 × 10699.70<0.0001
X22.49 × 10612.49 × 10627.810.0004
X32.26 × 10512.26 × 1052.530.1431
X1X22450124500.0270.8718
X1X37.55 × 10517.55 × 1058.450.0156
X2X367,748.8167,748.80.760.4043
X127.26 × 10617.26 × 10681.27<0.0001
X225.33 × 10615.33 × 10659.60<0.0001
X3233,223.47133,223.470.370.5556
Residual8.94 × 1051089,358.65
Lack of Fit6.70 × 10551.34 × 1053.000.1266
Pure Error2.23 × 105544,688.1
Cor. Total2.49 × 10719
R20.9641
Adjusted R20.9318
X1, ultrasonic temperature, °C; X2, ultrasonic time, min; X3, ultrasonic power, W; df, degree of freedom.
Table 5. The MAE experimental design in coded and uncoded form for the optimization of variables using CCD.
NO.Extraction Conditions (Independent Variables)Observed Responses (Dependent Variables)
X1X2TBPCs
1280 (−1)60 (−1)6215.9 ± 31.4
2560 (1)60 (−1)7370.4 ± 10.5
3280 (−1)120 (1)7251.9 ± 52.4
4560 (1)120 (1)7851.9 ± 41.9
5222.01 (−1.414)90 (0)6548.2 ± 335.2
6617.99 (1.414)90 (0)7066.7 ± 83.8
7420 (0)47.57 (−1.414)7340.8 ± 73.3
8420 (0)132.43 (1.414)8481.5 ± 408.6
9420 (0)90 (0)8170.4 ± 240.9
10420 (0)90 (0)8126 ± 94.3
11420 (0)90 (0)8163 ± 188.6
12420 (0)90 (0)8155.6 ± 115.2
13420 (0)90 (0)7903.7 ± 52.3
X1, microwave power, W; X2, microwave time, s; TBPCs, total bound phenolic contents, μg GAE/g.
Table 6. ANOVA of the regression model (MAE) for the TBPCs.
SourceSum of SquaresdfMean SquareF Valuep Value
Model5.45 × 10651.09 × 10630.250.0001
X17.74× 10517.74 × 10521.450.0024
X21.23 × 10611.23 × 10633.970.0006
X1X276,867.56176,867.562.130.1877
X123.36 × 10613.36 × 10693.13<0.0001
X221.42 × 10511.42 × 1053.940.0874
Residual2.52 × 10573.61 × 104
Lack of Fit2.01 × 105367,092.795.250.0716
Pure Error51,156.27412,789.07
Cor. Total5.71 × 10612
R20.9558
Adjusted R20.9242
X1, microwave power, W; X2, microwave time, s; df, degree of freedom.
Table 7. Phenolics composition of extracts from different methods.
Phenolics Standard (μg g−1 Bran)TraditionalUAEMAE
Ferulic acid2094.1 ± 9.7 a2931.7 ± 8.5 b3084.2 ± 14.5 c
CatechinNDNDND
Gallic acidNDNDND
Protocatechuic acid18.8 ± 1.2 a60.5 ± 0.6 c51.1 ± 0.6 b
Syringic acid20.4 ± 0.4 a67 ± 1.3 b71.4 ± 1.6 c
Chlorogenic acidNDNDND
p-hydroxybenzoic acidNDNDND
p-coumaric acid47.1 ± 1.5 a69.7 ± 2.4 b85.5 ± 2.6 c
Vanillic acid91.1 ± 2.4 a208.4 ± 19.4 b265.3 ± 2.0 c
Caffeic acid19.8 ± 1.6 a39 ± 0.5 c27.6 ± 0.2 b
Apigenin8.8 ± 0.9 a43 ± 0.7 c11.8 ± 0.1 b
LuteolinNDUDND
Total2300.1 ± 1.6 a3419.5 ± 16.5 b3596.9 ± 15.3 c
Data were expressed as mean ± standard deviation (n = 3). Traditional, TBPs extracted by the traditional alkaline method; UAE, TBPs extracted with ultrasound treatment; MAE, TBPs extracted with microwave treatment. ND, not detected. Values with different lowercase letters within a row differ significantly (p < 0.05).
Publisher’s Note: MDPI stays neutral with regard to jurisdictional claims in published maps and institutional affiliations.

