
Effect of Electrical Accelerated Aging on DC Resistivity of Mineral Oil Used in Power Transformers

Laboratory of Electrical Materials, University Politehnica of Bucharest, 060042 Bucharest, Romania
*
Author to whom correspondence should be addressed.
Energies 2023, 16(1), 294; https://doi.org/10.3390/en16010294
Submission received: 24 November 2022
/
Revised: 16 December 2022
/
Accepted: 20 December 2022
/
Published: 27 December 2022
(This article belongs to the Section F4: Critical Energy Infrastructure)
Abstract
:Power transformers are still equipment of primary importance within power grids. The recent paradigm changes registered in the field of energy require the interconnection of electrical grids of much larger areas, even up to the level of an entire continent. In this context, knowing the state of the electrical equipment and that of the power transformers is an essential aspect to ensure safe operation conditions. The present work is related to the vulnerability of the oil–paper insulation systems of power transformers to different aging factors and their quick degradation under certain conditions. In this regard, the study proposed in this paper considers the measurement of DC resistivity on mineral oil samples contaminated with small amounts of accelerated aging oil under the action of high-strength electric field and partial discharges. In the absence of standardized procedures for accelerated electrical aging of mineral oil, an original method presented and discussed in previous articles is used. The obtained results clearly indicate that under the action of electrical stress, the mineral oil resistivity decreases significantly, showing that the oil’s electric properties worsen.
1. Introduction
Power transformers (PTs) are critical components of power grids and of large industrial manufacturing units. The electric energy flows continuously through the PTs which means they must operate without interruption. That requires a permanent and thorough maintenance and control. PTs are also expensive equipment; their price increases with their rated power and voltage level. A special report of North American Electric Reliability Corporation indicates that in 2010 a power transformation unit with a power of 500 MVA and the high voltage between 138–345 kV had a price close to 4 million USD (the final price was about 30% higher due to transportation and installation costs) [1]. Moreover, in case of a transformer failure, repairing or replacing the unit can take from a few months to two years. That is a very long time as the energy required during the intervention duration must be provided by other means. Although today’s electric power grids have a certain redundancy ensured by the regional reserve production, additional transformers units, and/or by the interconnection of networks, the economic efficiency requires that the PTs operate in high safety and security conditions for as long as possible. This implies, on the one hand, following the appropriate maintenance programs, and, on the other hand, having the most accurate knowledge of the operating state of each PT. In this context, there is a general trend to equip PTs with online (and offline) monitoring systems that can provide information about the state of health and operation condition of the equipment [2,3,4,5].
The large and ultra-large PTs have their insulation made of cellulose paper and mineral oil. Due to thermal, electrical, and mechanical aging stress, the PT’s insulation depreciates over time, which is why the statistics indicate that most defects occur because of the electrical insulation system. In most situations, that means the lifetime of a PT is equal to the lifetime of the solid component of its insulation system [6,7,8]. Many studies refer to the degradation processes of cellulose paper and mineral oil [9,10,11,12,13]. In general, it is accepted that the thermal stresses are the ones that gradually cause the degradation of the insulation systems as high temperature favors chemical degradation reactions. In high and very high voltage PTs, the insulation system may face additional hazards such as partial discharges (PDs). In the presence of PDs, the components of the PT’s insulation system age sooner and their dielectric properties modify faster. Oil condition monitoring should be accurate to detect as many types of faults as possible in advance, thus preventing catastrophic failures and outages. Analyzing the oil condition assesses not only the oil quality but it can also provide information about other potential issues, such as contact arcing, insulation paper aging, and other latent faults. In consequence, monitoring oil condition becomes a necessity for PTs’ safe operation and their cost-effective maintenance [4,5].
Few studies refer to the degradation of mineral oil and cellulosic paper under the action of the electric field and the PDs. A method used for an accelerated aging of the mineral oil under high electric field strength and the PDs has been presented in [14]. By using dielectric spectroscopy in the frequency domain, it was found that the main dielectric properties of the mineral oil placed in an AC electric field change significantly due to the action of the electric field and the PDs [14].
In this context, this paper presents an experimental study concerning the impact of the PDs and of a high electric field strength on the mineral oil DC resistivity. Thus, several samples of conditioned mineral oil used for PTs were contaminated with different amounts of accelerated aged oil under electric fields and PDs. Then, for each oil sample, the absorption and resorption currents were measured, and the DC electrical resistivity was calculated. Furthermore, it will be confirmed that the high electric field intensity is an important aging factor, drastically affecting the oil’s dielectric properties.
2. Electrical Conduction in Mineral Oil
The conductivity of insulating liquids has been studied for many years. Extensive studies have been conducted on the electrical conduction phenomena in oils used for insulating power systems. Mainly, the conduction in mineral oil is possible due to two physical processes which refer first to the electrolytic dissociation of the liquid molecules and impurities, and secondly, to the charge carrier injection at the liquid–metal interface. While the dissociation process of molecules strongly depends on the liquid composition, temperature, and electric field, the charge injection is highly dependent on the interface condition and local electric field. Moreover, the conductivity σ is affected by the diffusion phenomenon which plays an important role in the movement of the free charge carriers. Neglecting the diffusion, the general formula for the electrical conductivity of liquids is [15]:
where qi is the charge of the i species of free charge carrier, µi is the charge carrier mobility, and, respectively, Ni is the concentration. Therefore, aside from the concentration of the free charge carriers, their mobility influences strongly the value of conductivity. Like most liquids, mineral oil has an ionic conductivity, which means that the free charge carriers are positive and negative ions. The contribution of free electrons to the conduction process (especially in usual electric fields) is insignificant, mainly because they are absorbed by other chemical products in an extremely short time [16]. Thus, the whole process of electrical conduction in a liquid depends on the charge spatial distribution in the volume and near the electrodes.
The mineral oils (MO) used for the PTs’ insulating systems are non-polar and with low permittivity liquids. In this case, the free ions are generated from the neutral molecules M of the liquid bulk in a two-step process: firstly, the dipoles are generated (by breaking of molecules) and then, there is a dissociation in positive and negative ions. Therefore, free ions are continuously generated from the dissociation of the ionic pairs (and conversely, ionic pairs are formed by the recombination of ions). This process is characterized by the dissociation constant kD which, according to Onsager’s theory [17], depends on the liquid’s temperature T, electric field strength E, and relative permittivity εr. In addition, the existence and dissociation of impurities in mineral oil are major factors that can greatly modify the conductivity value. Note that, in the case of operational PTs for which the mean temperature value can reach several tens of degrees Celsius, faster dissociation of oil molecules and impurities occurs.
Generating free-conduction ions is also influenced by the presence of chemical species that result from chemical degradation reactions under high temperatures and electric fields. Many papers [9,10,11,12,13] present the aging mechanisms of mineral oil and the generation of byproducts that modify the physicochemical properties of MO and, especially, the electrical conductivity [17]. During the PTs’ operation, several charge carriers are generated under the electric field effect (hydrocarbons with smaller molecules, CO, H2, H2O, etc.). The presence of oxygen favors the oxidation reactions and generates polar radicals, acids, and H+ and OH− ions. Moreover, it must be taken into account that, in PT insulation systems, the oil is also contaminated with byproducts resulting from cellulosic paper degradation [10,11,18]. These few considerations show how close the connection between the state of oil degradation and its electrical conductivity value is.
In the case of a high electric field, the concentration and the transport of the free conduction ions are influenced by the charge injection phenomena taking place at the interface between the liquid and the metallic electrodes. Extensive studies have been conducted on the charge injection phenomena in dielectric liquids, showing the influence of the electric field and the interface nature on the free charge carrier’s concentration [15,19,20,21]. In practice, this phenomenon takes place in the regions where the local electric field is increased as a consequence of small metallic edges or impurities. Since the physical phenomena of charge injection are very complex, in a concise formulation, it can be stated that both free electrons and ions can be injected into the mineral oil. In most cases, the injection of electrons from rough cathode electrodes into mineral oil submitted to a high voltage is attributed to cold field emission according to Fowler–Nordheim theory [7,9,13]. Moreover, the Schottky mechanism is suggested for electron injection in the case of a smooth cathode [11]. In accordance with many studies, the average time during which free electrons can be observed in MO is of the order of microseconds [16]. As mentioned above, this is the main reason why their contribution to the conduction process is generally neglected. On the other hand, the injection of ions is attributed to the detachment of ions from the electric double layers (Helmholtz double layer) which is formed at the electrodes [15].
Another important factor that impacts the conduction in dielectric liquids and especially in MO for PTs concerns the partial discharges (PDs) whose harmful effect on the conditions of the insulations is much studied and well known. However, although the effect of PDs on the insulation system of PTs is assumed to be slow, it can be very interesting to evaluate what its impact would be on the oil main dielectric properties and, in particular, on the electrical conductivity. Among the standardized tests of mineral oil are testing its resistance to electric discharges produced near its surface and the absorption of the formed gases (ASTM D 6180-05) [22]. However, the tests provided by this standard do not offer any information regarding the influence of the partial electric discharges produced in the oil volume on its dielectric properties. Few studies refer to the influences of high-strength electric fields and PDs on the main dielectric properties of the MO. Some of them are focused on the influence of the repeated electrical breakdown of MO on its dielectric properties [23]. An experimental method of accelerated aging of mineral oil under the action of high-strength electric field and PDs was presented in [14]. The results determined based on the frequency domain dielectric spectroscopy method indicate that the oil dielectric properties show drastic changes. This represents a substantial argument in favor of the present experimental study about the influence of high electric field strengths and the PDs on the oil DC resistivity.
3. Experimental Method
3.1. Accelerated Aging Method
3.1.1. Method Implementation Principle
The principle of the accelerated aging method is inspired by the real phenomena that occur during the operation of high and very high voltage PTs, mainly located in the regions where the electric field strength reaches high values (because of micro-defects, impurities, etc.) that generate local PDs. The method consists in taking a small volume of oil that is submitted to high strength electric field in a specific way to generate gas bubbles and PDs without the total breakdown of oil. To implement this procedure, an accelerated aging cell was created, with the structure detailed in the next section.
The level of accelerated electrical stress to which the oil samples are subjected is practically adjusted by changing the value of the voltage applied between the cell electrodes. In order to observe the influence of electrical aging factors on the mineral oil properties, several accelerated aging experiments with different aging duration were conducted.
To minimize the influence of the external factors on the oil aging process, before applying the voltage, the oil is sealed at its free surface with a nitrogen inert gas. Then, a special plug is used to close the test cell and to center the inner electrode in the test tube. The proposed aging method is based on forming gas bubbles exclusively from the reactions that occur within the oil volume under the presence of a high electric field strength (the same as the process occurring in PTs). To prevent the interference of the atmospheric gases (i.e., oxygen) during the aging test, an overpressure is maintained in the cell.
To avoid the charge injection effect, the inner electrode is made brass and has round corners (with no sharp edges). Additionally, as explained further, the inner brass electrode is designed in such a way to assist in gas bubble formation and gas bags accumulation and consequently to facilitate the local electrical discharges.
3.1.2. Accelerated Aging Cell Design
The special accelerated aging cell is shown in Figure 1. As it can be observed, this consists in a special glass test tube (very stable thermically and dielectrically) which accommodates an oil volume of 8 mL, having an inner diameter of 14 mm and a 130 mm high. Inside the glass tube, there is a brass electrode in a form of a cylindrical rod, made of six disks each with the outer diameter of 12 mm. Careful attention was paid to the electrode surface finishing to avoid punctual concertation of the electrical field and for maintaining consistency among the results obtained by all aging cells which are prepared and supplied at the same time. The gap distance between the edge of the disks and the glass wall is about 1 mm. The thickness of the glass wall is 1.25 mm, and this acts as a dielectric barrier between the inner brass electrode and the outer electrode (made of natrium chloride solution) in such a way to avoid the total dielectric breakdown of the oil found in the inter-electrode gap.
High electric field strength is generated by immersing the cell into a solution of water with sodium chloride connecting it to the ground and by supplying the inner bras electrode with a high voltage (0–30 kV and f = 50 Hz).
Special attention was given to centering the metallic electrode into the test tube. To achieve that, an inner plug was used to fix and hold the electrode at the same distance all around the glass tube. A second outer plug was then used to mechanically fix the cell as well as to isolate the cell from the environment. A fine hole was made in the outer plug to allow the release of the gases generated in the cell during the aging process. In this way, the formation of the overpressure inside the cell is avoided.
3.1.3. Experimental Aging Setup
The laboratory experimental setup used for oil accelerated electrical aging is composed of a glass tank filled with salt water into which the aging cells are partially immersed as presented in Figure 2. The aging cell support can accommodate up to five cells that can be simultaneously energized by applying an electrical voltage (within the range of 0 to 30 kV), between the inner metallic electrode (made of brass) and a stainless-steel electrode immersed in sodium chloride solution. The aging cells are monitored during the aging process with a video camera recording up to 30 frames per second.
A current relay connected to the transformer low voltage winding is used to interrupt the power supply in the case of an accidental breakdown of the aging cell glass tube. A timer is used to measure the time during which the calls are under voltage.
The aging tests were carried out on samples of Mol® which is a mineral oil specially used in PTs insulation systems. Before pouring the oil into the aging cell, the oil was conditioned in a forced flow oven at 60 °C for 72 h. The preparation procedure for the aging cells consists of several steps. Firstly, all the cell components were cleaned using alcohol and by blowing compressed air. Then, they were dried in the oven at 50 °C for at least 15 min. A volume of 8 mL of mineral oil was poured into the test tube carefully to avoid air bubbles emergence. Then, nitrogen gas at room temperature was injected into the cell sealing the oil surface from the air. The next step was to insert slowly the brass electrode into position using the inner and the outer plugs. Last, the assembled cells were placed into the oven at 50 °C for 15 min.
All the tests of electric aging were performed in the laboratory at room temperature, applying a gradually increased electric potential to the brass electrode. The gas bubbles start forming and the PDs occurred around 16 kV. Later, the electrical discharges expanded in the entire oil volume and the voltage value could be slightly decreased to 14 kV. At this voltage level, it was observed that the gas bubbles and the PDs occurred throughout the entire aging test duration.
3.2. Absorption and Resorption Currents Measurement
3.2.1. Absorption and Resorption Currents
When a DC voltage step U0(t) = U0δ(t) is applied to a capacitor for a period Tc, a current ia(t) appears through the dielectric (Figure 3) [24]:
where δ(t) is the step function
ia(t) is the absorption current, ich(t) is the charging current of the capacitor with vacuum as dielectric, ip(t) is the polarization current, is_ch(t) is the current produced by the space distributed charge and ic(t) is the conduction current characterizing the DC conductivity of the capacitor dielectric σDC.
The current ich(t) decreases to zero very quickly and that is why in usual experiments it is not recorded. The polarization current ip(t) corresponds to dielectric polarization phenomena consisting of small spatial movement of bounded charges and decreases slowly to zero. The current is_ch(t) corresponds to the space charge found in the dielectric volume which is generated mainly by the degradation process and the charge injection phenomena. Moreover, is_ch(t) decreases slowly to zero. The conduction current ic(t) is given by the convection of the free charge carriers and does not change in time. This current allows the computation of the electrical conductivity or resistivity of the dielectric.
If the voltage source is cut off (U0 = 0) and the capacitor electrodes are short-circuited at t = Tc, the resorption current ir(t) can be measured:
where id(t) is the discharge current of the vacuum dielectric capacitor, idp(t) is the depolarization current, and is_ch′(t) is the current that corresponds to the dielectric space charge.
For low and medium values of the applied electric field strength (which corresponds to a supply voltage lower than 1 kV) and for tests lasting just minutes or hours, there is no change of free charge carriers or of the polar dipoles concentration caused by the degradation process. Therefore, the polarization and depolarization current and the space charge current are almost identical (is_ch(t) ≅ is_ch′(t) and ip(t) ≅ id(t)) and the conduction current can be calculated as:
Considering the geometrical characteristics of the capacitor, it is possible to calculate the corresponding resistance and conductivity.
3.2.2. Absorption and Resorption Currents Testing Bench Setup
The measurement of the absorption and resorption currents of the oil samples was done at room temperature using a Keithley 6517B electrometer and an IRLAB CL-1 standard dielectric liquid cell (Figure 4).
3.2.3. Mineral Oil Samples
The mineral oil samples were prepared considering the volume of the measuring cell (which is about 150 mL) and the volume of the oil aging cell presented in Section 3.1.2 (Figure 1). The measurements were performed on five types of samples detailed in Table 1. All samples were obtained using Mol® mineral oil used in PTs which was preconditioned in a forced air flow oven at T = 50 °C for 72 h.
As it can be seen in Table 1, the oil samples were prepared as follows: 150 mL of conditioned mineral oil was contaminated with 1 mL, 2 mL, 3 mL, and 4 mL of accelerated aged oil that was obtained following the procedure described above in Section 3.1, using aging cells supplied at 14 kV for four hours. The prepared samples were placed in sealed glass bottles with a nitrogen cushion and then left in the oven at T = 50 °C for 12 h in order to homogenize the mixture.
4. Experimental Results and Discussion
4.1. Experimental Aging Process Observation
The first thing during the experiments of accelerated aging mineral oil samples under the influence of high-strength electric field and PDs was to make some visual observations (throughout the entire aging process) and to analyze them. The different stages of the aging process such as the gas bubble generation, PDs, and then the formation of the gas bags in the interelectrode space were remarked. In the absence of a voltage supply, there were no gas bubbles present in the oil (Figure 5a). When voltage was applied to the brass electrode, gas bubbles started forming from the oil free surface, then they spread into the entire oil volume becoming visible (Figure 5b). Subsequently, the gas bubbles formed inside the aging cell could be observed in small disparate luminescent electrical discharges as shown in Figure 5c. The next stage of the aging process consisted in the formation of the gas bags between the discs of the inner brass electrode (Figure 5d). The state of the aging process could be qualitatively assessed by a visual inspection of the oil color which become darker as the aging process. The color of the oil samples shows that the degradation mechanisms also involve thermal phenomena associated with PDs. Therefore, in real PTs this effect is cumulative to the thermal stress generated by the energy losses in the active parts of the transformer (the windings and magnetic core losses).
4.2. Absorption and Resorption Currents and Resistivity
The absorption and the resorption currents were measured for all oil samples. All measurements were made at room temperature. The value of the DC voltage applied between the cell electrodes was 200 V. A complete measurement of the ia(t)/ir(t) currents required 40 min (20 min for the absorption and 20 min for the resorption) during which 2400 current values were recorded (one value per second). Figure 6 shows the time variation curves of the absorption and the resorption currents for all investigated mineral oil samples.
As shown in Figure 6 and Figure 7, the contamination of the conditioned mineral oil with an exceedingly small volume of accelerated aged oil leads to an important increase in the absorption and resorption currents. Moreover, a correlation between the values of the measured currents and the volume of the aged oil can be observed. The results show very clearly that ia(t) and ir(t) increase significantly when the added aged oil volume increase from 1 mL (MO1ml) to 4 mL (MO4ml). It results that following the contamination of the conditioned oil with a small volume of aged oil, there is an increase in the concentration of free charge carriers (ions) and electric dipoles. In turn, they will determine the increase in the components of the absorption current, especially the conduction and the polarization currents. According to Figure 8, the conduction current calculated using (5) increases by an order of magnitude for MO4ml compared to the value obtained for conditioned oil.
Based on the results presented in Figure 8, the electrical resistivity of the investigated oil samples was calculated taking into account the geometry of the dielectric liquid measurement cell. The results obtained for ic(60) and ic(600)—i.e., measured after 60 s and 600 s from the applying voltage time—are depicted in Figure 9a and the variations of corresponding electrical resistivity can be examined in Figure 9b.
The results presented above indicate without any doubt that the contamination of a conditioned mineral oil with very small quantities of accelerated aged oil under the action of high-strength electric field and PDs, modify the absorption and the resorption current curves and their values. Most probably, this is due to the changes in the polarization and the conduction currents caused by the formation of free polar radicals and charge carriers’ during the aging process. This assumption is based on the fact that the changes that occur in the absorption current curves are manifested both for short periods of time after applying the voltage (t < 100 s)—which characterizes the polarization phenomena, as well as for longer periods of time (t > 100 s)—which characterizes the conduction process [18].
The analysis of these results will be pointed out using the values of ρ(60). It can be observed that compared to the initial value of the DC resistivity obtained for MOcond which is equal to 4.76 × 10¹¹ Ω·m, in the case of MO1ml, MO2ml, and MO3ml samples, the values of ρ(60) are 1.63 × 10¹¹ Ω·m, 1.51 × 10¹¹ Ω·m and, respectively, 1.42 × 10¹¹ Ω·m. Although the resistivity tendency is to decrease, there are small differences between these values. As it results from (1), the resistivity of the oil decreases when the concentration of free ions increases. Therefore, considering the low quantities of the added aged oil (which is supposed to be reach in conduction ions) this low resistivity variation can be explained. On the other hand, in the case of MO4ml, the resistivity value increase to 6.3 × 10¹⁰ Ω·m, which is significantly higher compared to the previous values. Most probably, this is due to the fact that the oil degradation rate under the action of the electric field and PDs is not the same during the exposure time.
In particular, it is noted that if the volume of aged oil added over the conditioned oil is 4 mL, the electric resistivity decreases by about one order of magnitude compared to the conditioned oil. This increase is very important considering that the volume of accelerated aging oil represents only 2.67% of the total volume of oil and the aging duration is only four hours. Moreover, the results presented in several papers [18] indicate that in the case of an accelerated thermal aging of mineral oil at temperatures exceeding 150 °C, such magnitude in the variation of the oil resistivity is obtained only after several thousand hours. Therefore, it can be concluded that the oil degradation process under high-strength electric fields and PDs is particularly fast, and the changes in the oil dielectric properties, especially its electrical resistivity, are very important.
The results presented in this paper indicate that in high and very high voltage PTs, in addition to the permanent thermal stress (which depends on the load level of the transformer), the electric field strength and PDs have an important impact on the degradation of the mineral oil.
5. Conclusions
This paper presents an experimental study regarding an accelerated aging of a transformer mineral oil under the action of high-strength electric fields and PDs. Several samples of conditioned mineral oil were subjected to an accelerated aging process using the special method presented above. Different phases of the aging process were analyzed and presented. Then, several conditioned oil samples of 150 mL were contaminated with 1, 2, 3, and 4 mL of aged oil and their absorption and resorption currents were measured. Based on the values of these currents, the time variation curves of the conduction current were determined and the oil DC resistivity was calculated. The results indicate clearly that the addition of the accelerated aging oil to a non-aged oil sample leads to a significant increase of the conduction current and, respectively, a reduction of the oil electrical resistivity. This happens because during the aging process, many free charge carriers (positive and negative ions) are generated and they participate in the conduction process. Although the volume of the aged oil added over the conditioned oil was only 2.67% of the total oil volume, it was found that the electrical resistivity of the contaminated oil decreased significantly by about one order of magnitude.
Author Contributions
Conceptualization, L.M.D. and A.M.; methodology, L.M.D.; formal analysis, L.M.D., A.M. and T.G.; investigation L.M.D., A.M., T.G. and A.L.; writing—original draft preparation, L.M.D. and A.M.; writing—review and editing, L.M.D., A.M. and T.G.; supervision, L.M.D. All authors have read and agreed to the published version of the manuscript.
Funding
This research received no external funding.
Data Availability Statement
Not applicable.
Conflicts of Interest
The authors declare no conflict of interest.
References
- North American Electric Reliability Corporation, Special Report: Spare Equipment Database System. October 2011. Available online: https://drosheim.files.wordpress.com/2012/10/sedtf_special_report_october_2011.pdf (accessed on 19 December 2022).
- Schwarz, R.; Muhr, M. Diagnostic Methods for Transformers. In Proceedings of the International Conference on Condition Monitoring and Diagnosis, Pekin, China, 21–24 April 2008; pp. 974–977. [Google Scholar]
- Saha, T.K.; Pradhan, M.K.; Yew, J.H. Optimal Time Selection for the Polarisation and Depolarisation Current Measurement for Power Transformer Insulation Diagnosis. In Proceedings of the Power Engineering Society General Meeting, Tampa, FL, USA, 24–28 June 2007; pp. 1–7. [Google Scholar]
- Gubanski, S.; Boss, P.; Csépes, G.; Der Houhanessian, V.; Filippini, J.; Guuinic, P.; Gäfvert, U.; Karius, V.; Lapworth, J.; Urbani, G.; et al. Dielectric Response Methods for Diagnostics of Power Transformers. CIGRE 2002, 254, 1–40. [Google Scholar]
- Zhang, X.; Gockenbach, E. Asset-Management of Transformers Based on Condition Monitoring and Standard Diagnosis. IEEE Electr. Insul. Mag. 2008, 24, 26–40. [Google Scholar] [CrossRef]
- Tenbohlen, S.; Vahidi, F.; Gebauer, J.; Krüger, M.; Müller, P. Assessment of Power Transformer Reliability. In Proceedings of the XVII International Symposium on High Voltage Engineering, Hannover, Germany, 22–26 August 2011. [Google Scholar]
- Metwally, I.A. Failures, monitoring and new trends of power transformers. IEEE Potentials 2011, 30, 36–43. [Google Scholar] [CrossRef]
- Jahromi, A.; Piercy, R.; Cress, S.; Service, J.; Fan, W. An Approach to Power Transformer Asset Management Using Health Index. IEEE Electr. Insul. Mag. 2009, 25, 20–34. [Google Scholar] [CrossRef]
- Notingher, P.; Badicu, L.; Dumitran, L.; Setnescu, R.; Setnescu, T. Transformerboard Lifetime Estimation using Activation Energy. In Proceedings of the ISEF 2011—XV International Symposium on Electromagnetic Fields in Mechatronics, Electrical, and Electronic Engineering, Funchal, Portugal, 1–3 September 2011. [Google Scholar]
- CIGRE Brochure 323, Ageing of Cellulose in Mineral-Oil Insulated Transformers. 2007. Available online: https://e-cigre.org/publication/323-ageing-of-cellulose-in-mineral-oil-insulated-transformers (accessed on 19 December 2022).
- Du, Y.; Zahn, M.; Lesieutre, B.; Mamishev, A.; Lindgren, S. Moisture Equilibrium in Transformer Paper-Oil Systems. IEEE Electr. Insul. Mag. 1999, 15, 11–20. [Google Scholar] [CrossRef] [Green Version]
- Fabre, J.; Pichon, A. Deteriorating Processes and Products of Paper in Oil. Application to Transformers, In Proceedings of the 1960 International Conference on Large High Voltage Electric System (CIGRE), Paris, France, 15–25 June 1960; p. 137.
- Lelekakis, N.; Guo, W.; Martin, D.; Wijaya, J.; Susa, D. A Field Study of Aging in Paper-Oil Insulation Systems. IEEE Electr. Insul. Mag. 2012, 28, 12–19. [Google Scholar] [CrossRef]
- Manea, A.; Dumitran, L.; Borzea, C.; Cazacu, E. Accelerated Ageing Method of Mineral Oil Under High Electric Field and Partial Discharges. In Proceedings of the 12th International Symposium on Advanced Topics in Electrical Engineering (ATEE 2021), Bucharest, Hungary, 25–27 March 2021. [Google Scholar]
- Felici, N. High-Field Conduction in Dielectric Liquids Revisited. IEEE Trans. Elect. Insul. 1985, EI-20, 233–238. [Google Scholar] [CrossRef]
- Felici, N.; Gosse, J. Injection d’ions par des électrodes métalliques dans les hydrocarbures liquides de résistivité élevée. Rev. Phys. Appliquée 1979, 14, 629–633. [Google Scholar] [CrossRef]
- Onsager, L. Deviations from Ohm’s Law in Weak Electrolytes. J. Chem. Phys. 1934, 2, 599–615. [Google Scholar] [CrossRef]
- Badicu, L.V. Diagnosis, and Monitoring of Insulation Systems of Power Transformers. Ph.D. Thesis, University Politehnica of Bucharest, Bucharest, Hungary, 2011. [Google Scholar]
- Lewis, T.J. Basic electrical processes in dielectric liquids. IEEE Trans. Dielect. Electr. Insul. 1994, 1, 630–643. [Google Scholar] [CrossRef]
- Minday, R.M. Excess Electrons in Liquid Hydrocarbons. J. Chem. Phys. 1971, 54, 3112. [Google Scholar] [CrossRef]
- Küchler, A.; Piowan, U.; Ananstova-Höhlein, I.; Berglund, M.; Chen, G.; Fabian, J.; Fritsche, R.; Grav, T.; Gubanski, S.; Jaufer, S.; et al. HVDC Transformer Insulation: Oil conductivity. CIGRÉ Technol. Broch. 646 2016. [Google Scholar]
- ASTM D 6180–05; Standard Test Method for Stability of Insulating Oils of Petroleum Origin under Electrical Discharge. ASTM International: West Conshohocken, PA, USA, 2005.
- Loiselle, L.; Rao, U.M.; Fofana, I. Influence of aging on oil degradation and gassing tendency under high-energy electrical discharge faults for mineral oil and synthetic ester. IET J. High Volt. 2020, 5, 731–738. [Google Scholar] [CrossRef]
- Badicu, L.; Gorgan, B.; Busoi, S.; Dumitran, L.; Notingher, P. Use of time-domain spectroscopy for assessment of oil impregnated paper condition. U.P.B. Sci. Bull. Ser. C 2011, 73, 267–282. [Google Scholar]
Figure 1.
Aging cell under high electric field strength and PDs: 1—fine tube for gases discharge, 2—upper sealing plug, 3—inner centering plug, 4—brass inner high voltage electrode, 5—glass test tube, 6—mineral oil, and 7—salt water.
Figure 1.
Aging cell under high electric field strength and PDs: 1—fine tube for gases discharge, 2—upper sealing plug, 3—inner centering plug, 4—brass inner high voltage electrode, 5—glass test tube, 6—mineral oil, and 7—salt water.
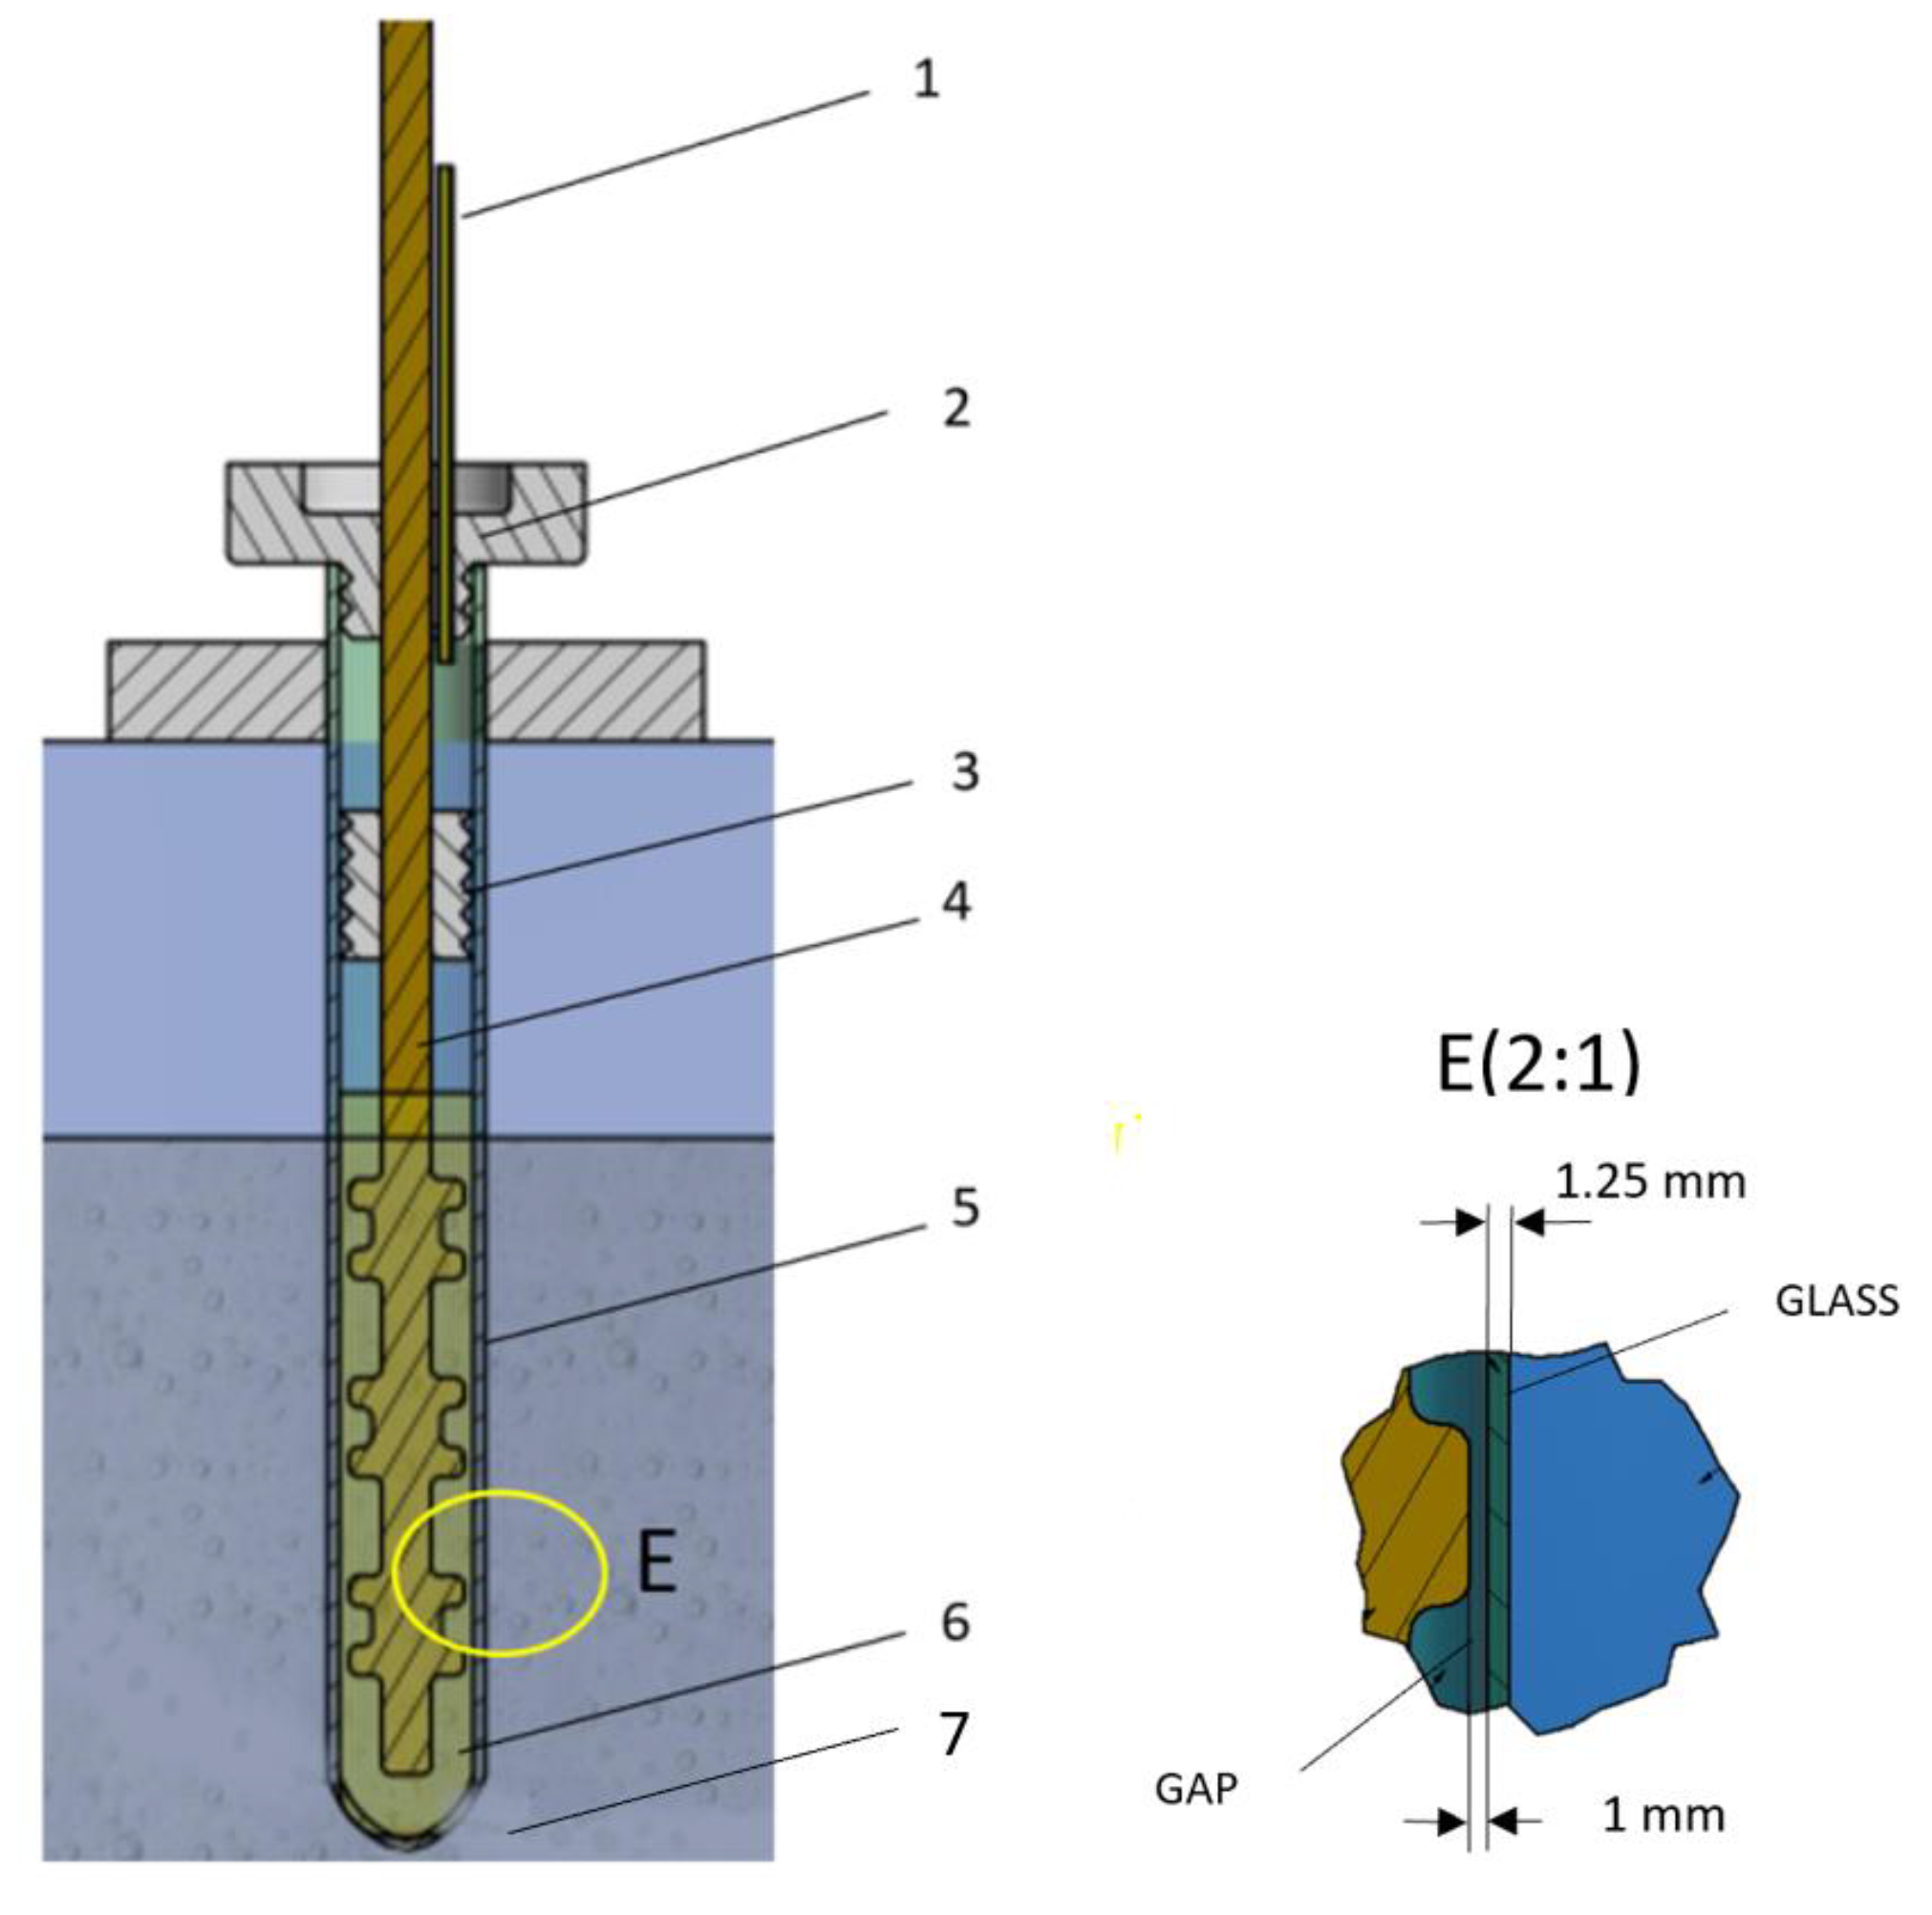
Figure 2.
Experimental setup: 1—adjustable transformer for setting the voltage value, 2—voltmeter, 3—high voltage transformer, 4—timer, 5—current relay, 6—aging cell, 7—glass tank, and 8—video recorder camera.
Figure 2.
Experimental setup: 1—adjustable transformer for setting the voltage value, 2—voltmeter, 3—high voltage transformer, 4—timer, 5—current relay, 6—aging cell, 7—glass tank, and 8—video recorder camera.
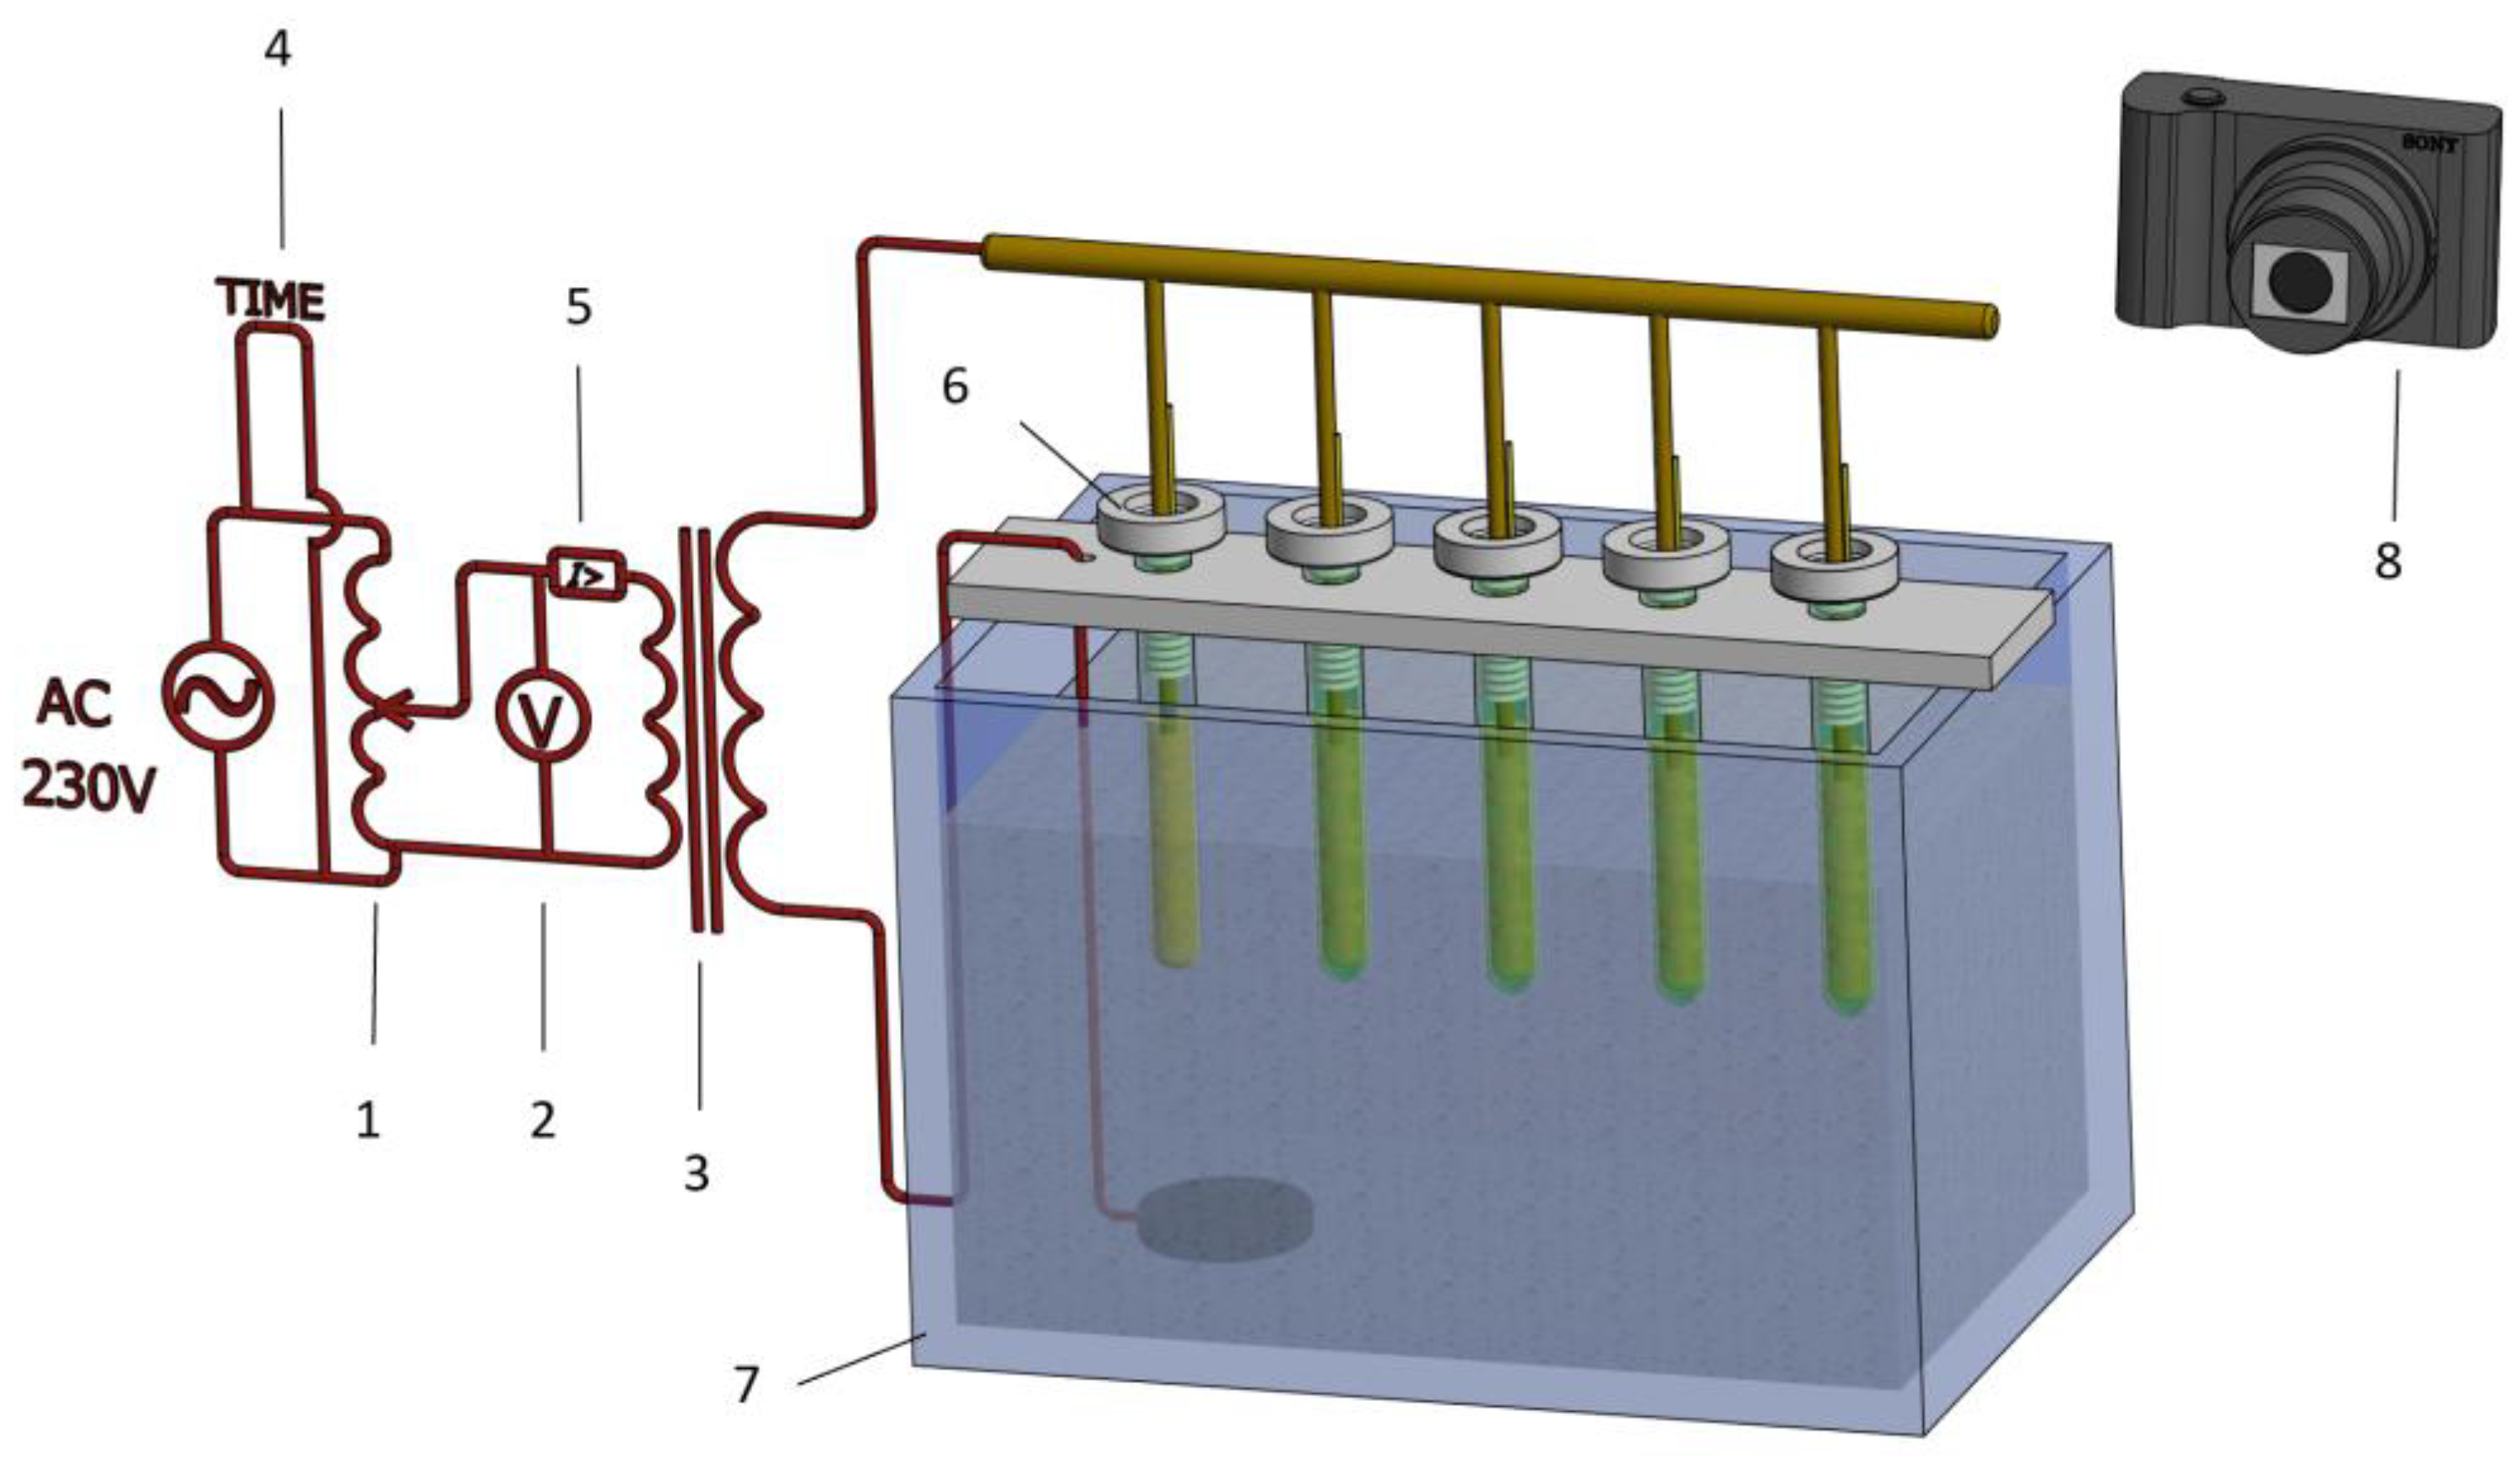
Figure 3.
Time variation of the absorption ia(t) and the resorption ir(t) currents.

Figure 4.
(a) Experimental setup used for measuring the absorption and the resorption currents; (b) schematic view of the IRLAB CL-1 measurement cell for dielectric liquids.
Figure 4.
(a) Experimental setup used for measuring the absorption and the resorption currents; (b) schematic view of the IRLAB CL-1 measurement cell for dielectric liquids.
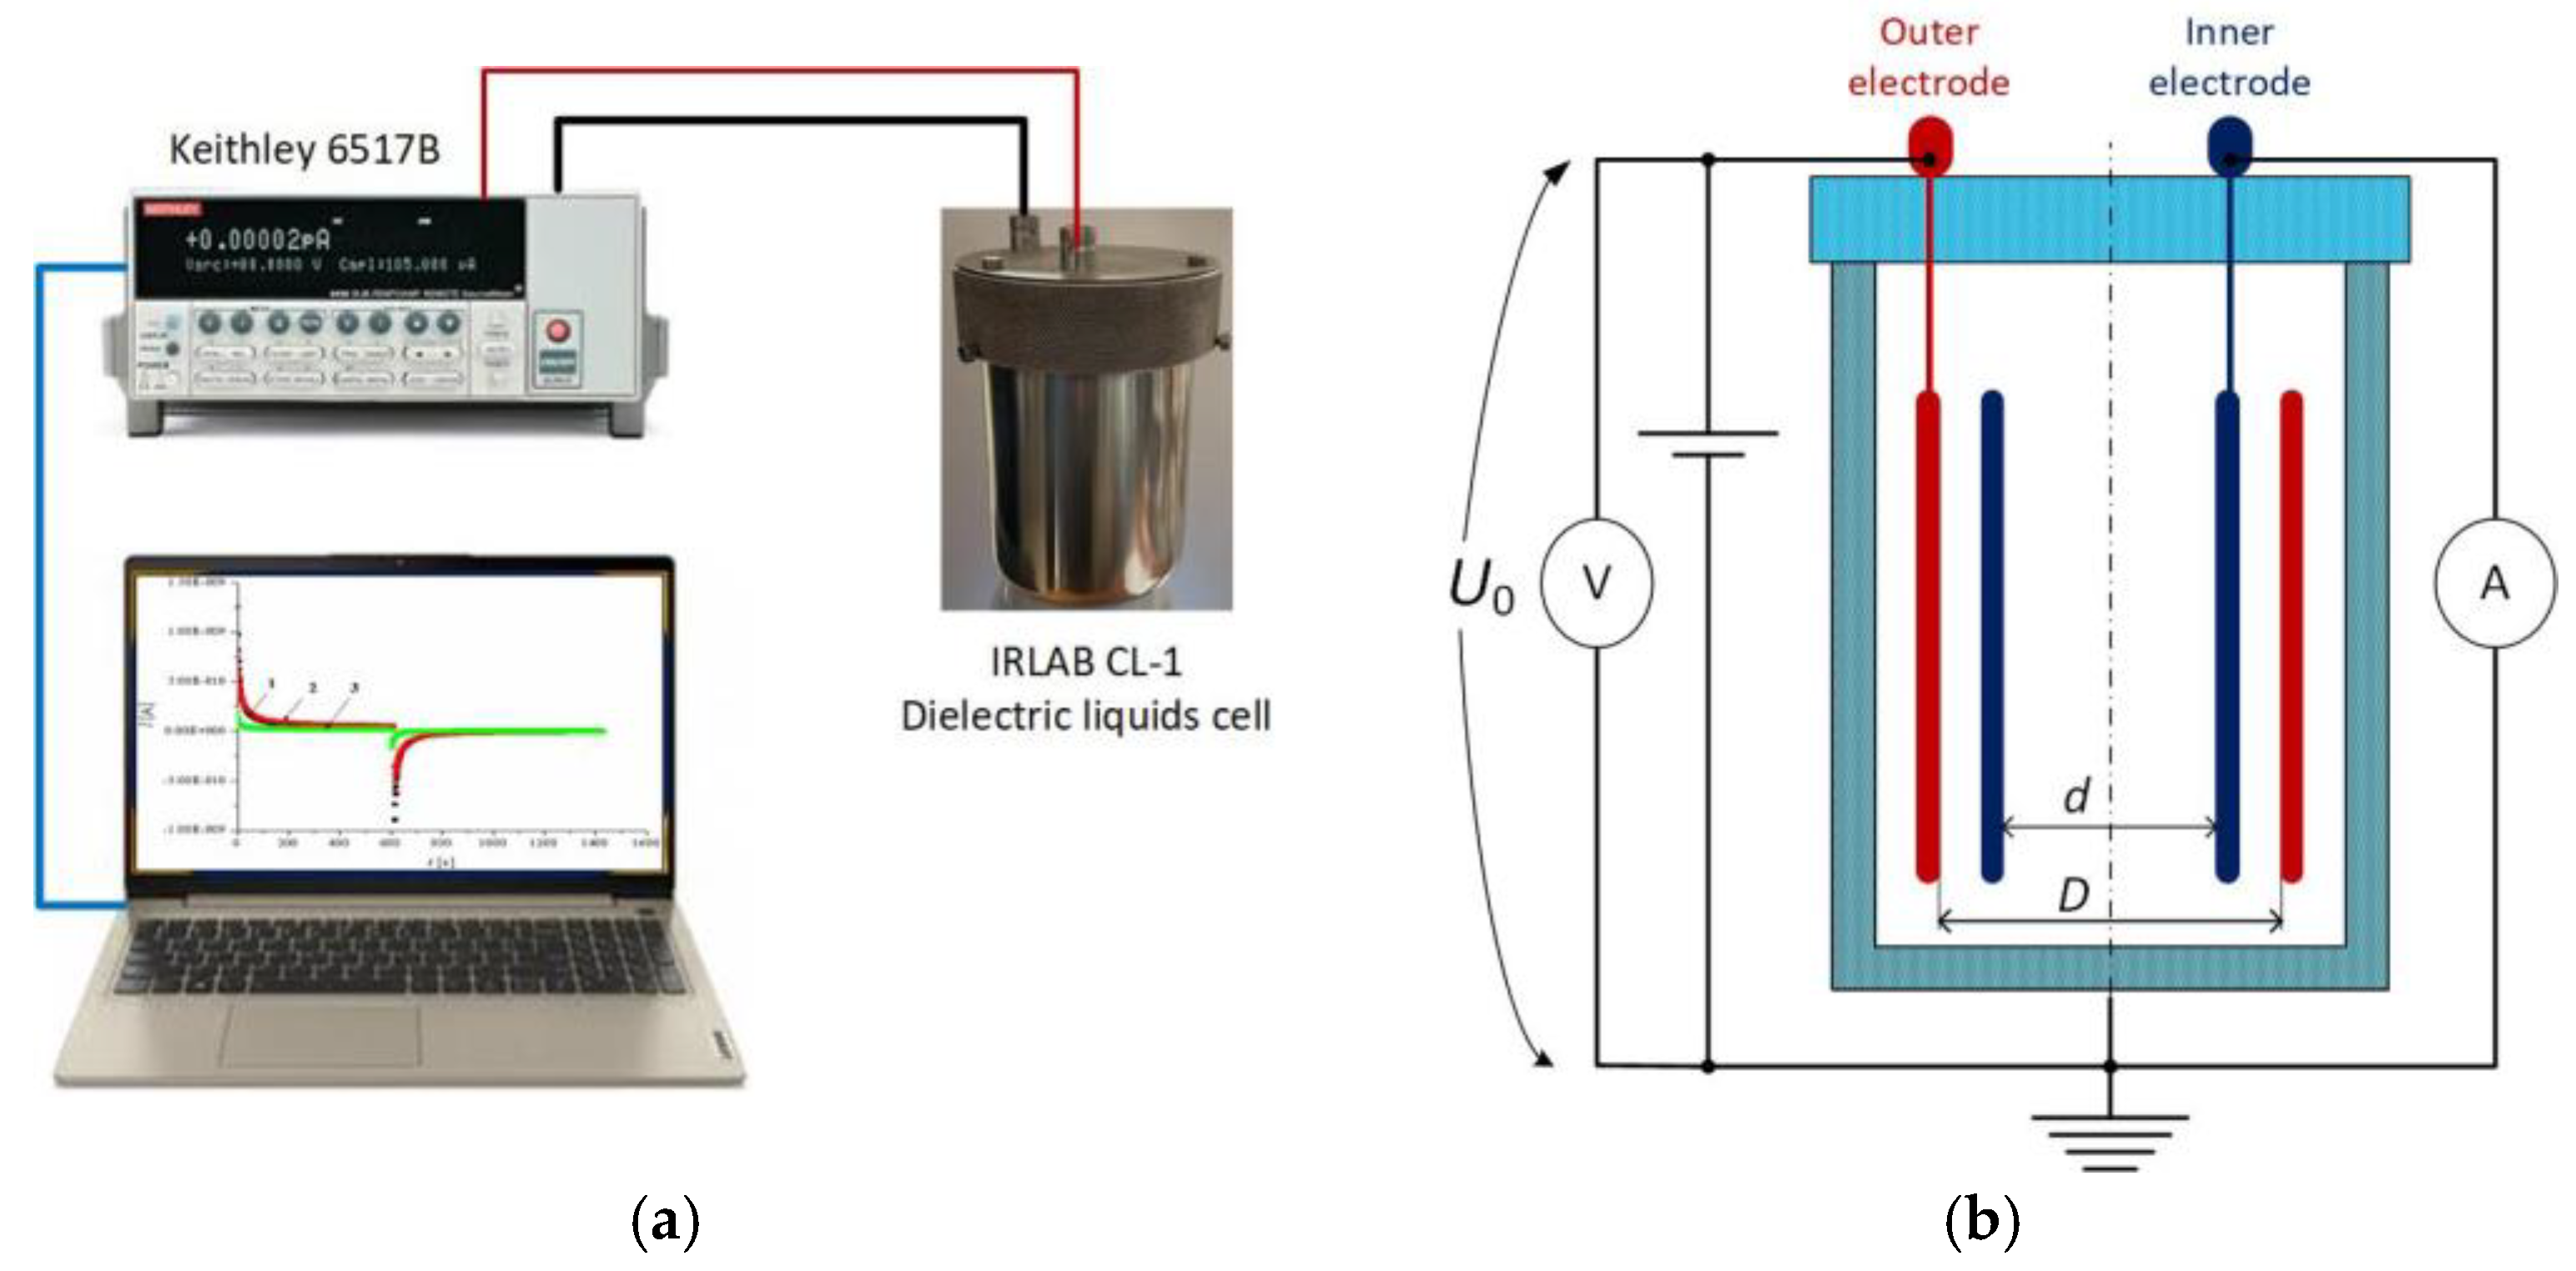
Figure 5.
(a) The initial condition of the mineral oil inside the aging cell (U = 0 kV); (b) gas bubble generation; (c) visual observation of PDs in oil; (d) gas bags between the metallic electrode disks (U = 13 kV and T = 25 °C).
Figure 5.
(a) The initial condition of the mineral oil inside the aging cell (U = 0 kV); (b) gas bubble generation; (c) visual observation of PDs in oil; (d) gas bags between the metallic electrode disks (U = 13 kV and T = 25 °C).
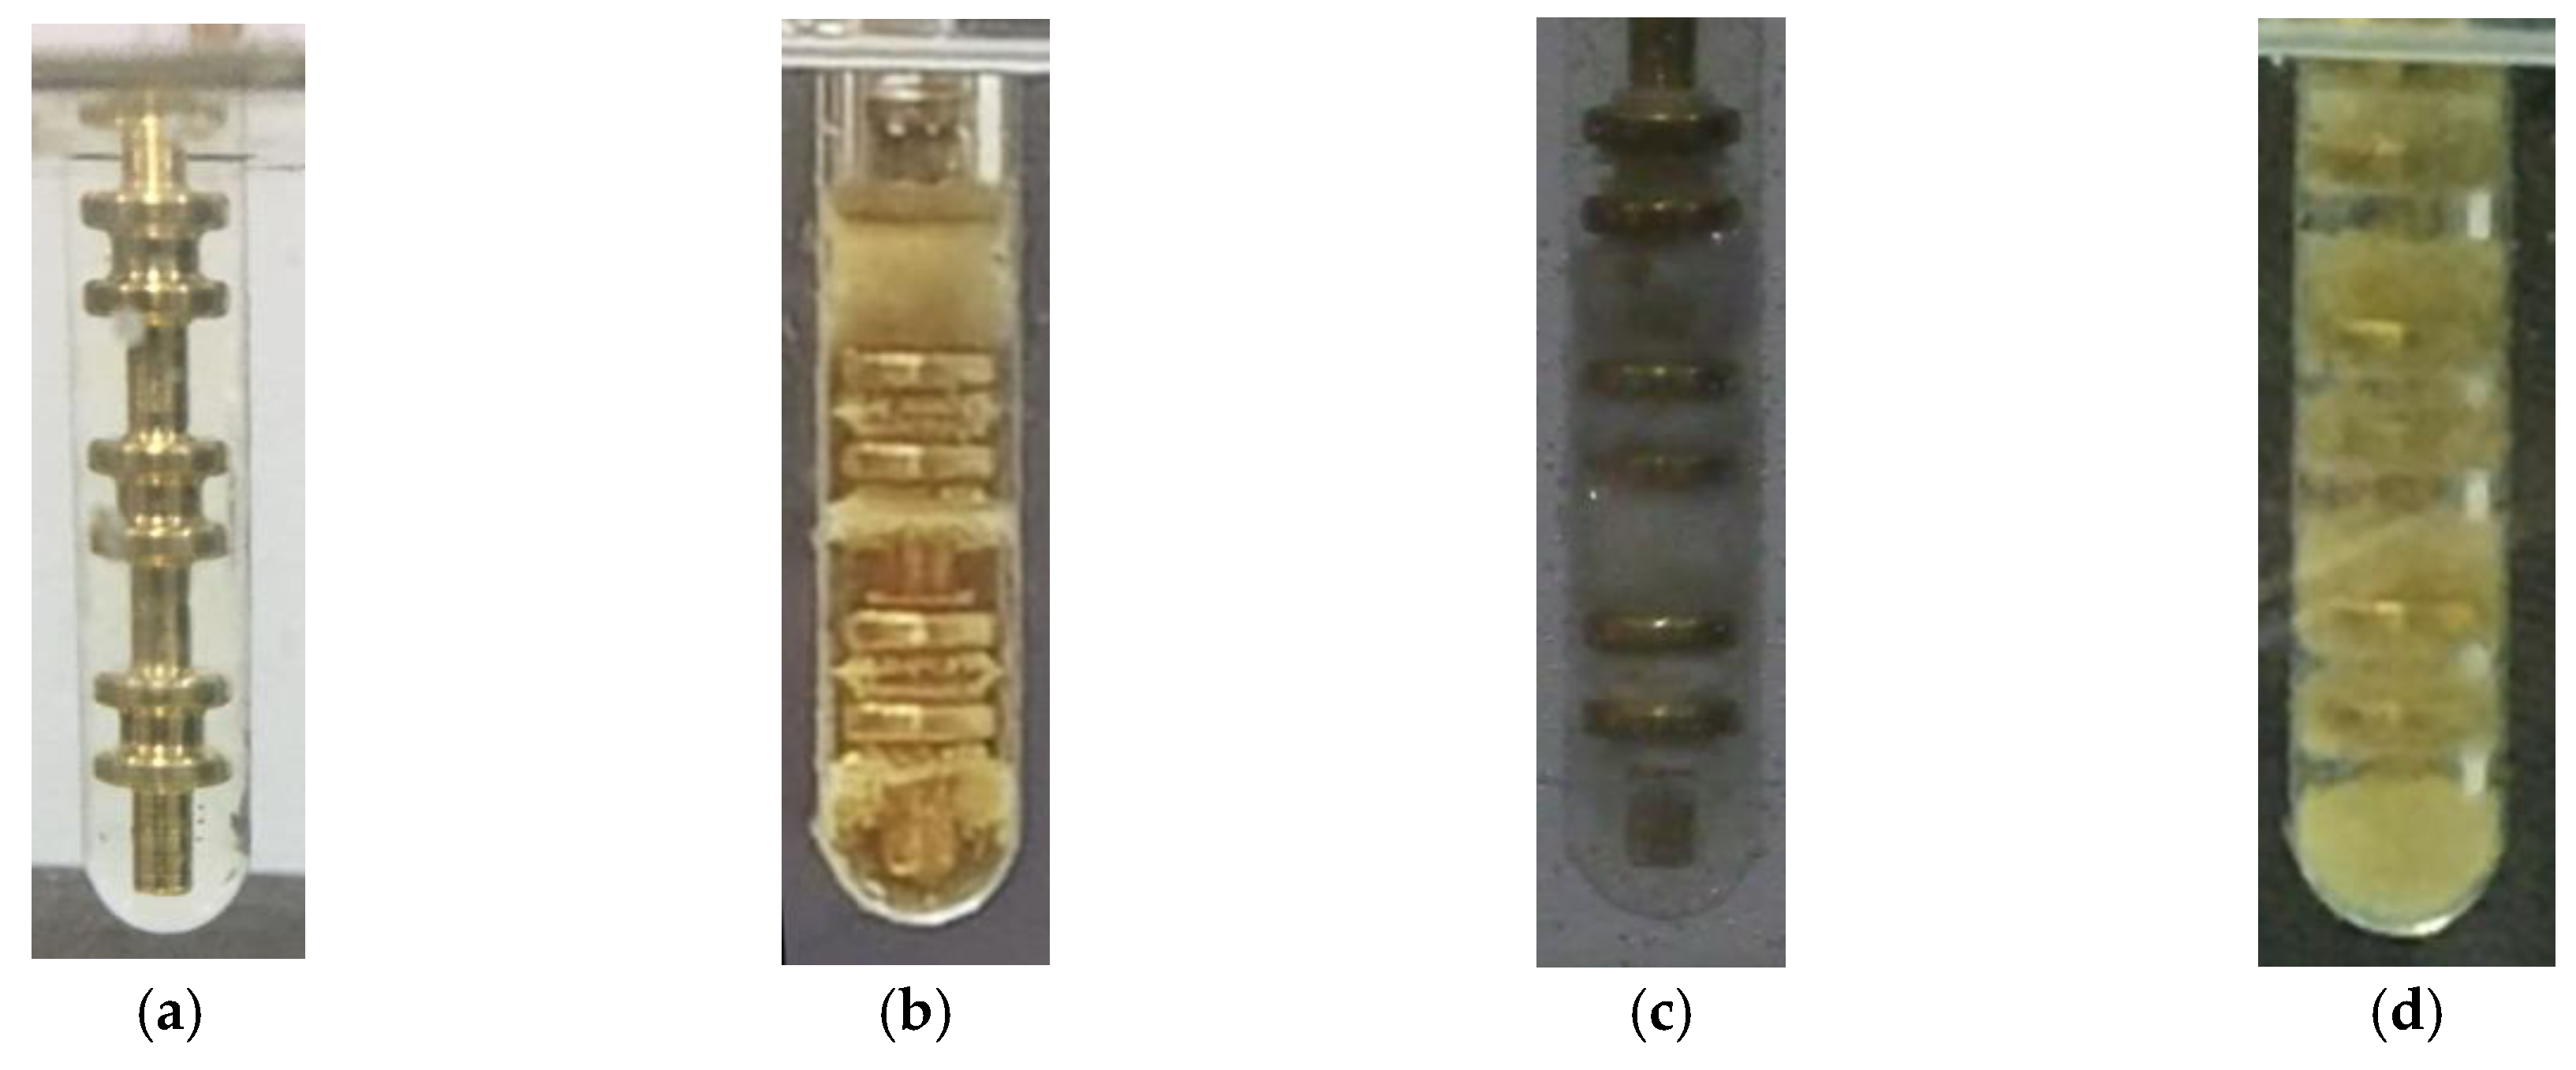
Figure 6.
The variation of the absorption and the resorption currents against time (U0 = 200 V and T = 24 °C).
Figure 6.
The variation of the absorption and the resorption currents against time (U0 = 200 V and T = 24 °C).
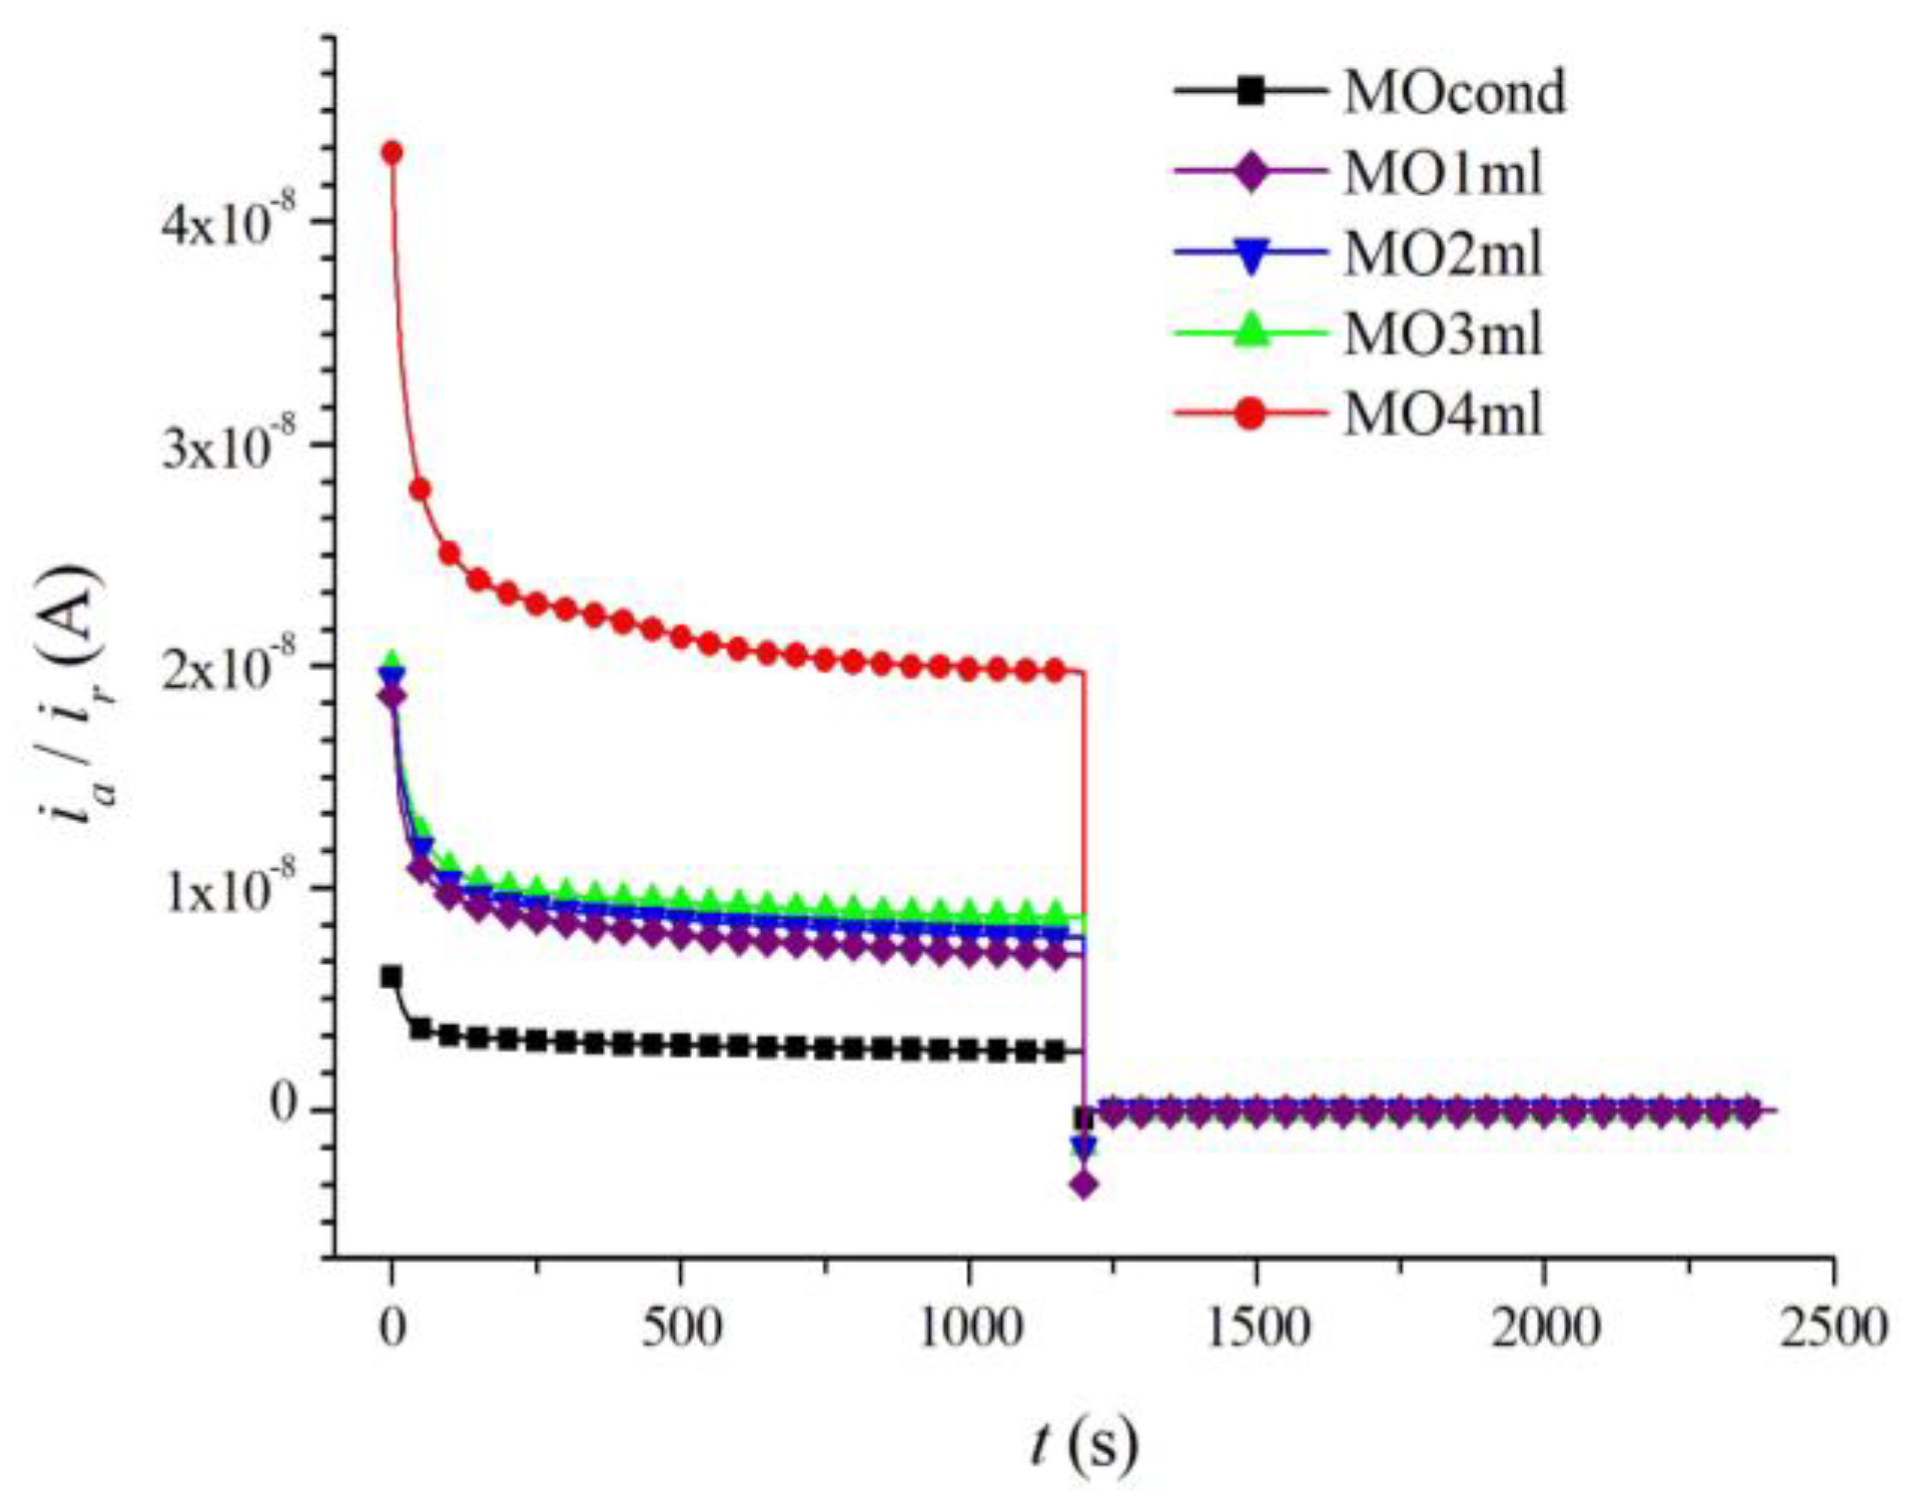
Figure 7.
(a) The variation of the absorption current against time; (b) variation of the modulus of the resorption current against (U0 = 200 V and T = 24 °C).
Figure 7.
(a) The variation of the absorption current against time; (b) variation of the modulus of the resorption current against (U0 = 200 V and T = 24 °C).
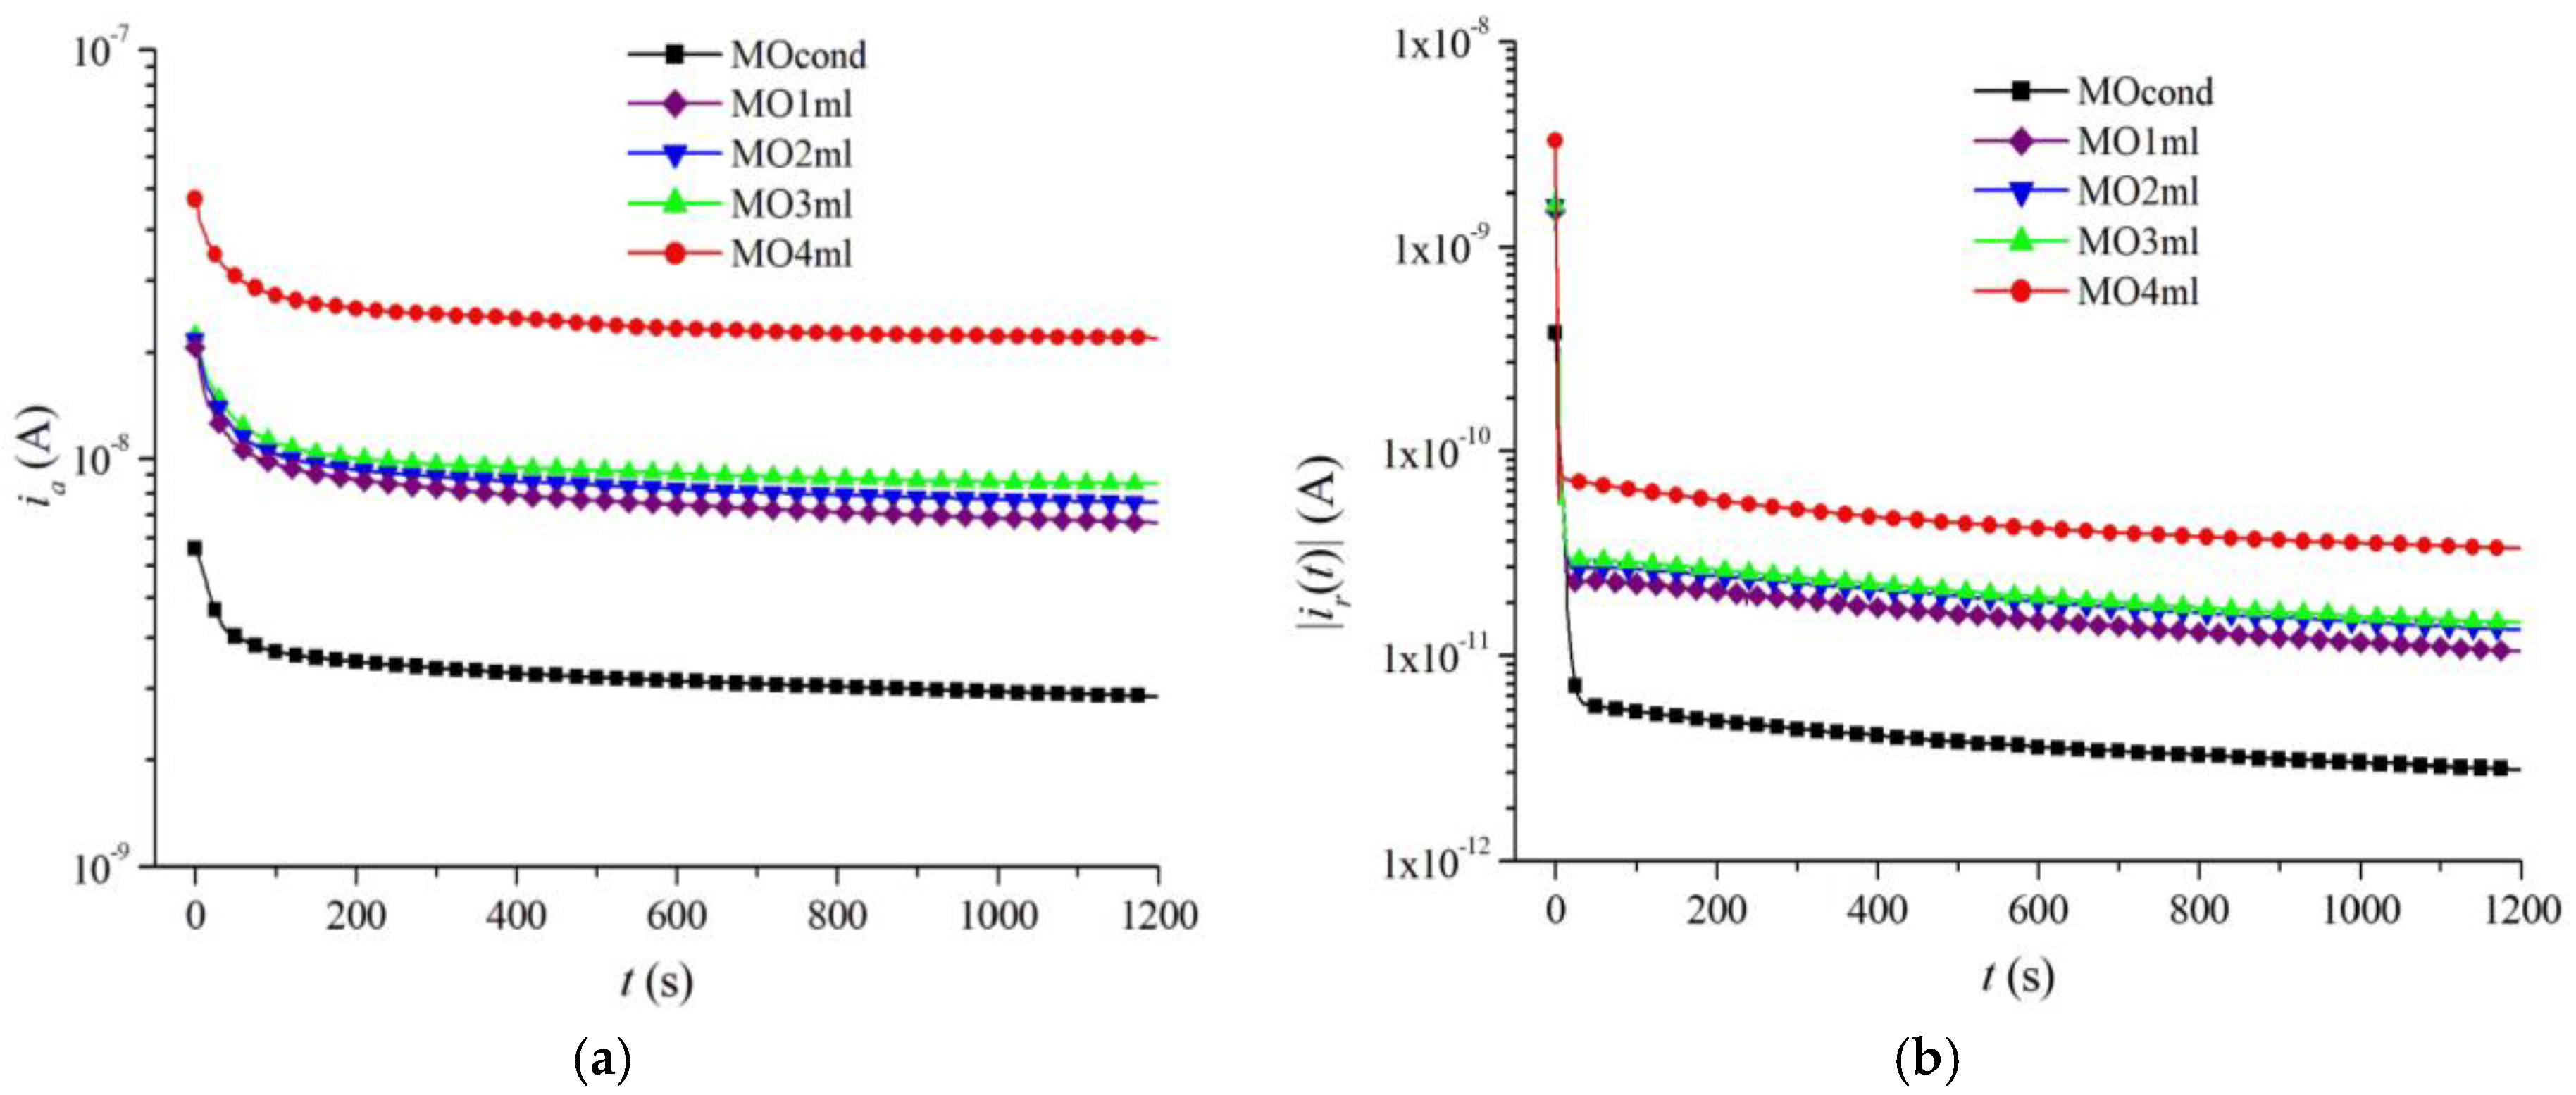
Figure 8.
The variation of the conduction current against time (U0 = 200 V and T = 24 °C).
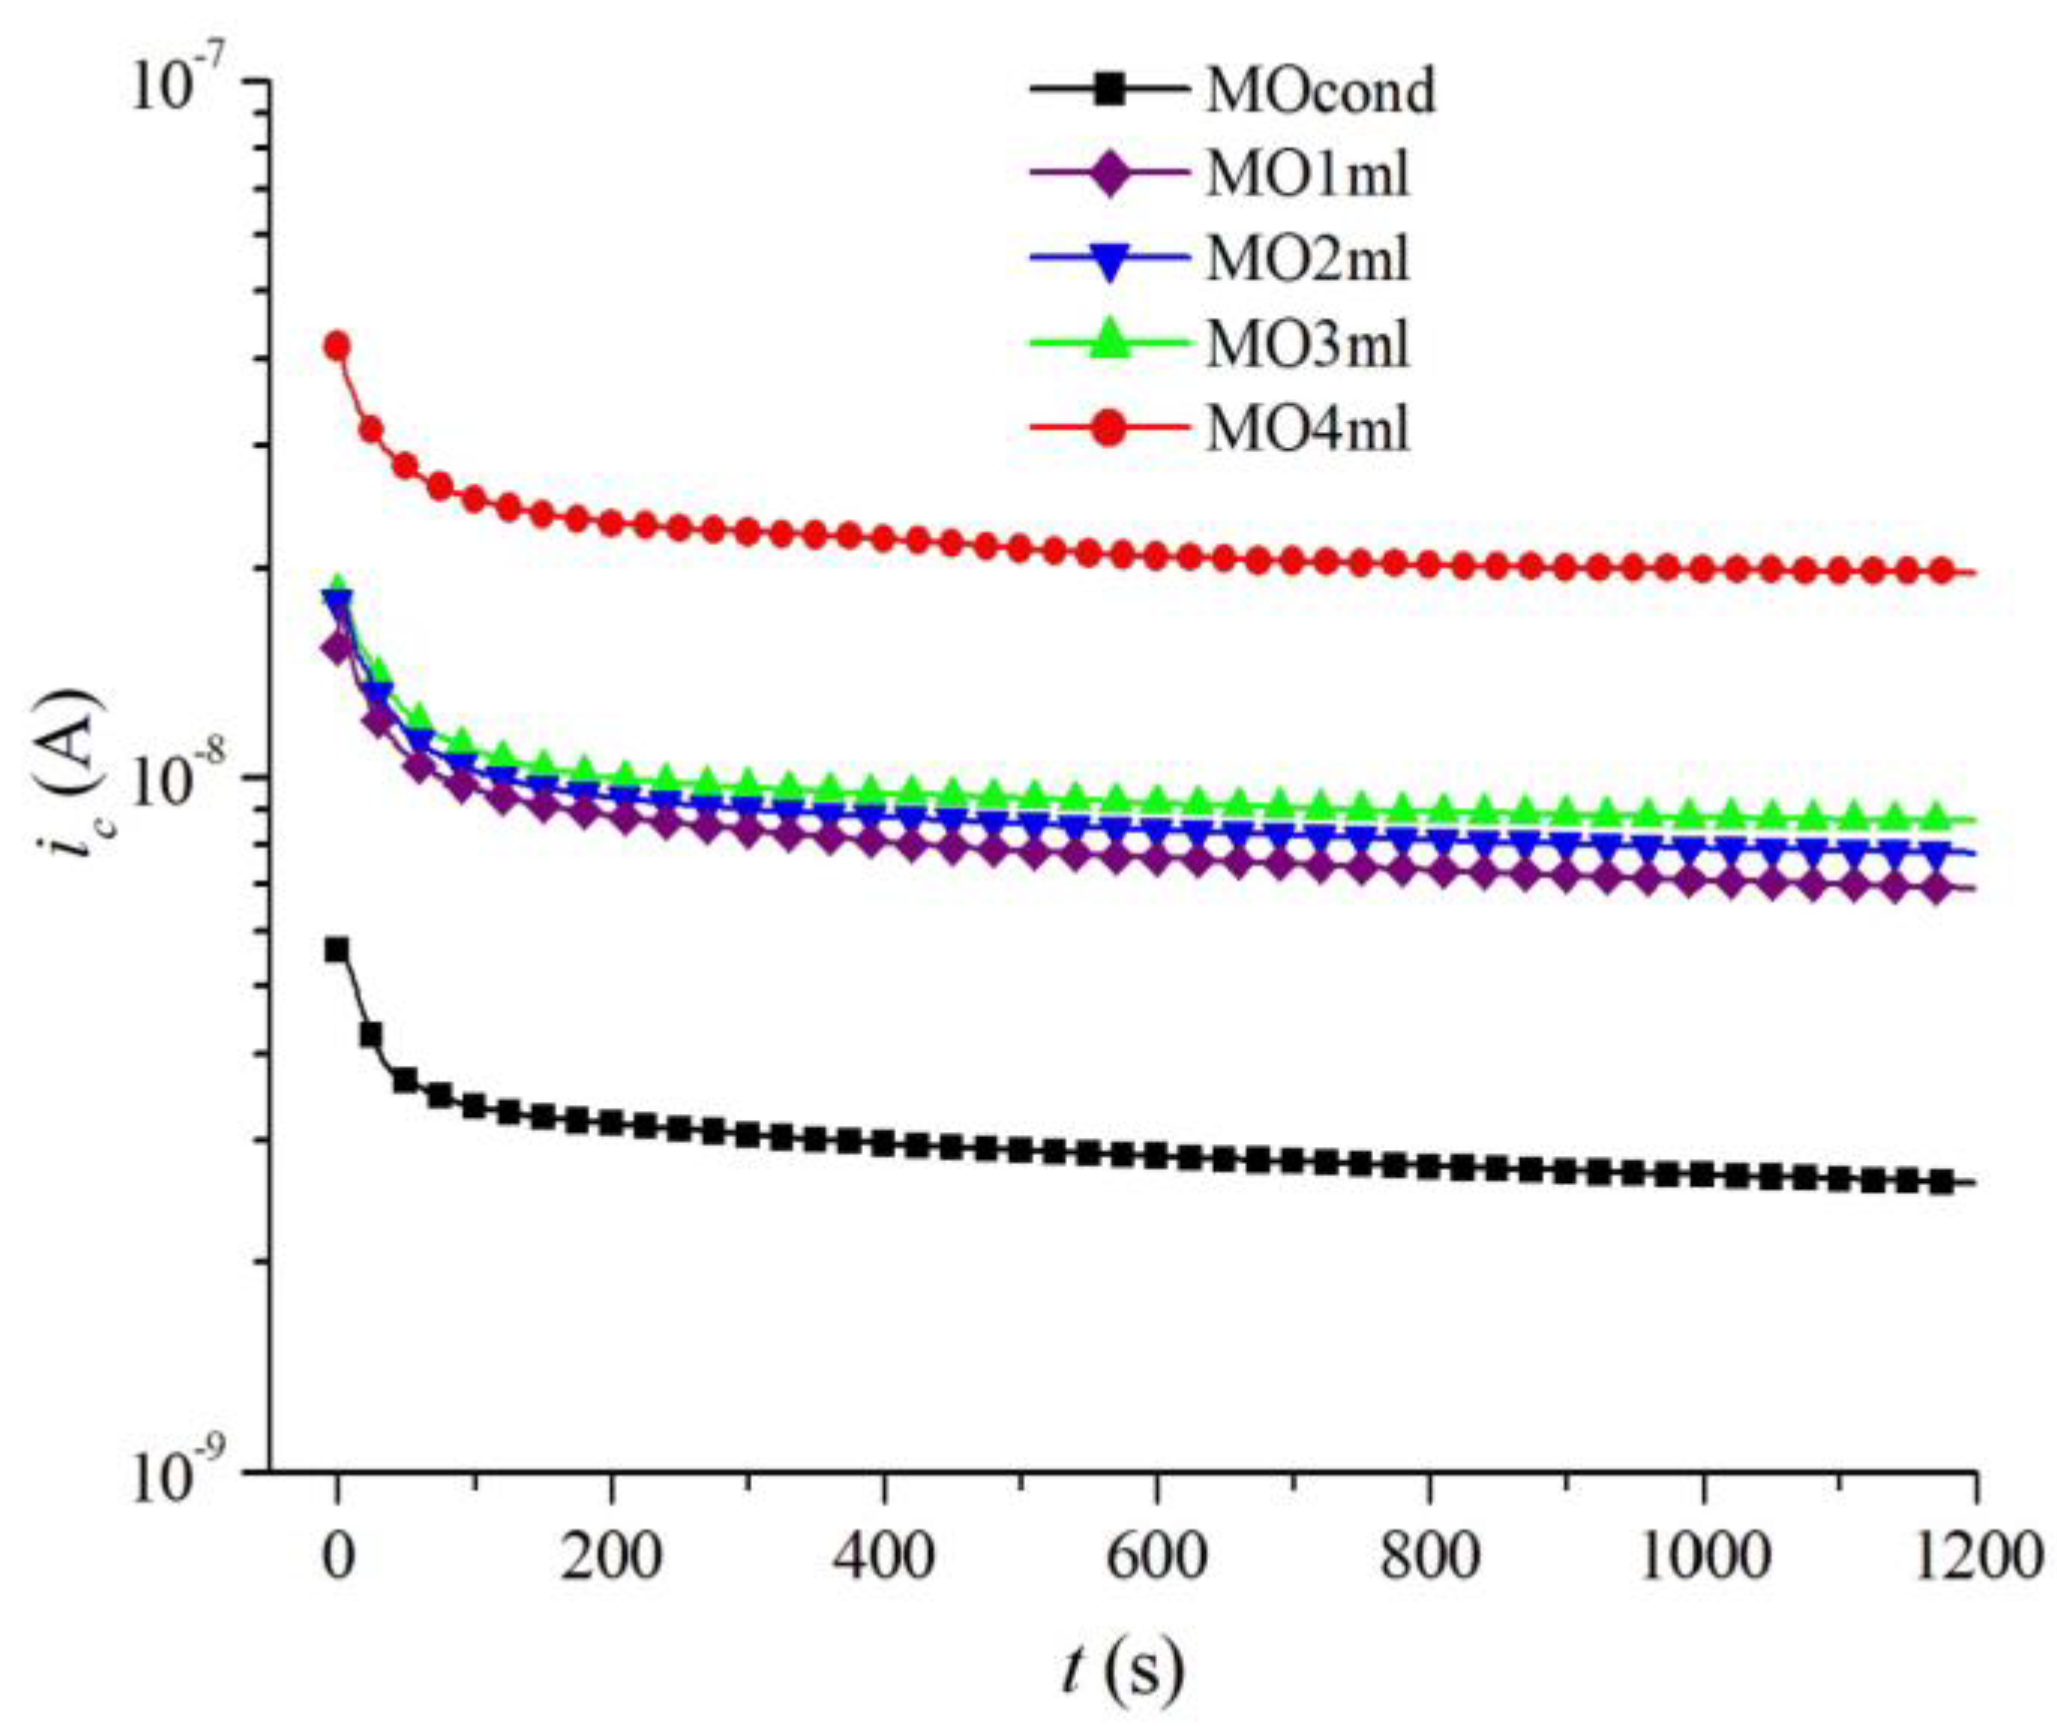
Figure 9.
(a) The variation of ic(60) and ic(600) as a function of aged oil volume; (b) variation of ρ(60) and ρ(600) as a function of aged oil volume.
Figure 9.
(a) The variation of ic(60) and ic(600) as a function of aged oil volume; (b) variation of ρ(60) and ρ(600) as a function of aged oil volume.


Table 1.
Measured mineral oil samples.
| Sample | Composition |
|---|---|
| MOcond | 150 mL unaged oil |
| MO1ml | 150 mL unaged oil + 1 mL aged oil |
| MO2ml | 150 mL unaged oil + 2 mL aged oil |
| MO3ml | 150 mL unaged oil + 3 mL aged oil |
| MO4ml | 150 mL unaged oil + 4 mL aged oil |
Disclaimer/Publisher’s Note: The statements, opinions and data contained in all publications are solely those of the individual author(s) and contributor(s) and not of MDPI and/or the editor(s). MDPI and/or the editor(s) disclaim responsibility for any injury to people or property resulting from any ideas, methods, instructions or products referred to in the content. |
© 2022 by the authors. Licensee MDPI, Basel, Switzerland. This article is an open access article distributed under the terms and conditions of the Creative Commons Attribution (CC BY) license (https://creativecommons.org/licenses/by/4.0/).
Share and Cite
MDPI and ACS Style
Manea, A.; Gorjanu, T.; Lazeanu, A.; Dumitran, L.M. Effect of Electrical Accelerated Aging on DC Resistivity of Mineral Oil Used in Power Transformers. Energies 2023, 16, 294. https://doi.org/10.3390/en16010294
AMA Style
Manea A, Gorjanu T, Lazeanu A, Dumitran LM. Effect of Electrical Accelerated Aging on DC Resistivity of Mineral Oil Used in Power Transformers. Energies. 2023; 16(1):294. https://doi.org/10.3390/en16010294
Chicago/Turabian StyleManea, Andrei, Teodora Gorjanu, Andreea Lazeanu, and Laurentiu Marius Dumitran. 2023. "Effect of Electrical Accelerated Aging on DC Resistivity of Mineral Oil Used in Power Transformers" Energies 16, no. 1: 294. https://doi.org/10.3390/en16010294
Note that from the first issue of 2016, this journal uses article numbers instead of page numbers. See further details here.