1. Introduction
Aviation is a rapidly growing branch of transport. Its major advantage is the ability to move quickly over very long distances. It is an integral part of the modern world and contributes to the economic growth of countries [
1,
2]. However, with the growth of aviation comes an increase in the amount of pollutants emitted from aviation activities [
3,
4,
5].
According to the data presented in [
3]:
in 2016, aviation was responsible for 3.6% of total greenhouse gas (GHG) emissions in the European Union (EU). This corresponded to 13.4% of emissions of these gases in the transport sector. Therefore, aviation was the second largest transport GHG source in the EU, after road transport;
GHG emissions from aviation more than doubled compared to those in 1990;
in 2015, emissions of nitrogen oxides from aviation accounted for 14% of transport emissions and 7% of total emissions of this compound in the European Union. There was a doubling of emissions compared to those in 1990;
with regard to carbon monoxide and sulphur oxides, emissions of these harmful compounds from aviation activities in EU have also increased since 1990, while their emissions from most other transport modes have declined.
The primary source of pollution in aviation is the combustion of fossil fuels in aircraft engines. The main compounds emitted by aircraft engines during their operation are carbon dioxide (CO
2), water vapor (H
2O), nitrogen oxides (NO
x), sulfur oxides (SO
x), unburned hydrocarbons (HC), carbon monoxide (CO), particulate matter (PM) and soot [
3].
Carbon dioxide is produced by burning coal, a component of fuel. Carbon dioxide is a non-poisonous gas, however, too much concentration can cause increased respiratory rate, shortness of breath or headache [
6]. Although carbon dioxide makes up about 0.04% of the Earth’s atmosphere, it is one of the major greenhouse gases, that is, the gases responsible for the greenhouse effect. Excessive CO
2 emissions increase the greenhouse effect, which leads to climate change [
7,
8].
Nitrogen oxides are formed when nitrogen and oxygen react during fuel combustion at high temperature and pressure. They are primarily nitrogen monoxide (NO) and nitrogen dioxide (NO
2) [
8]. Exposure to NO
x can result in respiratory diseases and even pulmonary edema, which may lead to death [
9]. In addition, oxides of nitrogen contribute to the formation of ozone in the atmosphere. In the lower layers of the atmosphere, high concentrations of ozone have harmful effects on the respiratory and cardiovascular systems and are related to death from pulmonary causes [
8,
9].
As a result of sulfur contamination of jet fuel, sulfur oxides are produced during combustion [
8]. The sulfur oxides contained in the exhaust mainly include sulfur dioxide (SO
2) and the stable sulfur trioxide (SO
3). When SO
3 combines with water droplets in the air, sulfuric acid (H
2SO
4) is formed [
10]. Sulfur dioxide is a highly toxic gas. It causes difficulty in breathing. It leads, for example, to respiratory irritation and bronchospasm [
9]. Sulphur oxides, through chemical reactions with other compounds contained in the exhaust, may contribute to the formation of secondary particulate matter [
11].
Hydrocarbons (HC) are another toxic compound found in aircraft engine exhaust that have a very negative impact on human health. The main cause of their formation is low-temperature combustion. Hydrocarbons are a very large group of compounds with different properties [
8]. One of the most harmful for living organisms are polycyclic aromatic hydrocarbons (PAH), because they have mutagenic and carcinogenic properties [
9].
Carbon monoxide (CO) is produced when fuel in an engine is burned incompletely. It is highly toxic. CO has a high affinity for hemoglobin, significantly greater than that of oxygen. This leads to oxygen deficiency in the blood and consequently to hypoxia of organs and tissues. Carbon monoxide causes the greatest damage to the brain and cardiovascular system [
8,
9].
Particulate matter (PM) is a diverse mixture of suspended particles. They differ in structure, size and chemical composition [
12]. All particulate matter usually consists of an elementary soot particle on whose surface other compounds, often toxic, are adsorbed. Particulate matter is typically divided into two groups: PM2.5 and PM10. This distinction is due to the aerodynamic diameter of the particles. The PM2.5 group includes particles with diameters less than 2.5 μm, and the PM10 group includes particles with diameters less than 10 μm [
11]. The particles with the smallest aerodynamic diameters are the most dangerous to human health. The size of PM affects their ability to penetrate and accumulate in various organs and tissues. The smallest particles may represent a small fraction of the mass of all emitted particles, but their negative impact on human health is much more significant. Particles with diameters of less than 1 μm can enter the bloodstream and later the heart and brain, among other organs. Exposure to particulate emissions leads to lung failure, asthma, cardiac arrhythmias, heart attacks and even cancer [
12,
13].
Harmful compounds from aviation activities affect local, regional and global air quality [
14] and have a negative impact on the climate [
4,
10]. However, pollutants emitted around airports are thought to have the most direct impact on human health [
8]. To protect the health and lives of European Union residents threatened by local air pollution, legislators have developed framework directives for assessing and managing ambient air quality [
15,
16,
17,
18,
19]. Air quality is assessed on the basis of concentrations of particular pollutants in the atmospheric air. These directives define limit values of pollutant concentrations. If the limit values are exceeded, actions must be taken to lower the concentration levels. Mentioned legal regulations address harmful compounds from all sources in a particular area, not just aviation sources [
20].
Emissions from aircraft engines are regulated by Volume II of Annex 16 to the Convention on International Civil Aviation [
21]. The regulations are intended for turbojet and turbofan engines with thrust greater than 26.7 kilonewtons (kN). Emissions controlled for the certification of aircraft engines include smoke, unburned hydrocarbons, carbon monoxide and oxides of nitrogen. The certification process is based on an idealized landing and takeoff (LTO) cycle up to 914 m (3000 ft) above ground level (AGL). Certification procedures are carried out on a single engine on a test bed [
22]. The standard LTO cycle can be also implemented to assess exhaust emissions around airports [
23,
24].
It is important to emphasize that specific regulations, whether in terms of air quality in general or certification of aircraft engine emissions, are driving forces for initiatives in the area of making the air transport sector greener. One of such activities are environmental start-up projects [
25]. These projects serve to reduce the harmful impact of aviation on the environment by applying precursor technologies in the areas of airport operations, air traffic management, manufacturing new aircraft, among others.
When analyzing the impact of aviation on local air quality comprehensively, all airport-related emissions sources should be considered [
8]. Apart from aircraft emissions, these include aircraft handling emissions, stationary emissions sources and vehicle traffic sources [
22].
The primary method by which ambient air quality can be assessed is through measurements. Another way is to use mathematical modeling techniques, which are now becoming the main tool for air quality assessment [
26]. Moreover, only modeling enables estimation of the contribution of airport sources to regional pollution [
20,
27]. Modeling of emissions and pollutant dispersion is carried out using models specifically designed for this purpose. A wide range of models have been developed that differ in purpose, design, complexity, range of applicability, data requirements and computing power [
28]. Some of the models are widely available and easy to use with user-friendly software. While others require specialized knowledge to operate.
The previously mentioned directive [
15] also assumes the use of modeling techniques for air quality assessment. First of all, modeling can be a supplement to fixed measure-ments in those zones and agglomerations, where the level of pollutants is above the upper assessment threshold. When the level of pollutants is between the upper and lower as-sessment thresholds, a combination of fixed measurements and modeling techniques is possible. On the other hand, when the level of pollutants does not exceed the lower as-sessment threshold, only modeling techniques are allowed. Modeling also enables more effective air quality management [
29].
Various tools are available to model airport activity and dispersion of pollutants from airport sources. These include, for example, the Atmospheric Dispersion Modelling Sys-tem (ADMS), the Emission and Dispersion Modeling System (EDMS) or the Lagrangian Simulation of Aerosol-Transport for Airports (LASPORT) [
30,
31,
32]. Furthermore, EUROCON-TROL initiated the Airport Local Air Quality Studies (ALAQS) Project. The aim of this project is to harmonize at the European level actions concerning air quality assessment around airports using modeling techniques [
33]. The project has also developed a tool for modeling the impact of airport emission sources on ambient air quality [
31]. It should be remembered that modeling techniques make it possible not only to conduct current assessments, but also to analyze different scenarios and predict the future contribution of aviation to air pollution [
34].
It is also worth mentioning that modeling techniques applied in the aspect of aviation allow not only to assess the influence of aviation on the environment on a local scale, but also on a global scale [
35]. Analysis on a global scale is particularly important when it comes to the impact of the aviation sector on climate change through GHG emissions. There are a number of models that enable analysis on this issue; however, they still need to be improved [
35].
The purpose of this article was the assessment of Nicolaus Copernicus Airport activity in terms of the flight operations’ impact on air pollution in the area around the airport. Modeling techniques were used to achieve the purpose. Firstly, emission sources and airport layout were modeled, and parameters related to pollutant dispersion were defined. Next, pollutant concentrations at selected locations were analyzed.
2. Methodology
The Emissions and Dispersion Modeling System (EDMS) was used to model emissions and dispersion of pollutants. EDMS combines emissions and pollutant dispersion modeling and was developed to assess air quality at civilian airports and military air bases within the United States.
The airport chosen for the analysis was the Nicolaus Copernicus Airport in Wroclaw (ICAO airport code: EPWR). This airport is an international airport located 10 km west of the city center of Wroclaw, Poland. There is one asphalt concrete runway on the 11/29 direction with dimensions of 2503 × 45 m. The airport is equipped with a passenger terminal, a general aviation terminal and a cargo terminal.
The performed study can be divided into the following three stages:
Modeling of emission sources;
Modeling of airport layout;
Defining parameters related to pollutants’ dispersion.
2.1. Modeling of Emission Sources
The months of July and December 2017 were analyzed, which was due to the availability of air traffic data in the form of flight schedules for that particular year. The selected months differed from each other, both in the number of flight operations and the prevailing weather conditions, which is important from the point of view of emissions and dispersion of pollutants. Modeled air traffic included only scheduled passenger operations. In July 2017, according to the flight schedules, there were a total of 1858 takeoffs and landings, while in December, there were 1735. Information about the aircraft with which these operations took place was taken from flight schedules (
Table 1). Each aircraft was assigned an engine suggested by EDMS by default (
Table 2).
The landing and takeoff cycle in EDMS is divided into six modes: approach, taxi in, startup, taxi out, takeoff and climb out, while the emissions during startup are calculated only for selected harmful compounds [
36]. In order to determine the duration of each mode for each aircraft, the following modules implemented in the program were used: aircraft performance module (approach, landing roll, takeoff, climb out) and sequence module (taxi modes) [
36]. A default approach slope angle of 3° was left for all aircrafts included in the analysis. Default weights for takeoff and approach of the aircraft were also used. In addition, the exact arrival and departure times of the aircraft were used in modeling the air traffic, which increased the accuracy of the results obtained for the dispersion of emitted pollutants.
In addition to emissions from aircraft engines, emissions from auxiliary power units (APU) and ground support equipment (GSE) implicitly assigned to individual aircraft were modeled. APUs are usually on-board generators, very similar to small jet engines. Their purpose is to provide electricity to aircrafts when they have their engines shut down. For each aircraft analyzed, default APU run times of 13 min on arrival and 13 min on departure were left.
GSE includes all the ground handling equipment and vehicles typically associated with aircraft arrival or departure at the aircraft parking location. The GSE category includes mobile generators, air start compressors, tugs, baggage handling equipment, and fuel trucks/loaders [
20]. GSE parameters such as runtime and power, among others, were left at default values.
In summary, the modeled emission sources were only the exhaust of aircraft with which scheduled passenger operations took place and the auxiliary power units and ground support equipment implicitly assigned to the aircraft.
2.2. Modeling of Airport Layout
The first step in modeling the airport layout was to implement weather data that was processed by an external meteorological preprocessor. The requirement was that these data include hourly observations and provide information on humidity, temperature or wind speed and direction, among others.
This was followed by a mapping of the airport layout. Runway parameters were entered into the EDMS: numbers 11 and 29, corresponding elevations and the default approach slope angles of 3°. Five taxiways were then modeled. Four of them were the actual taxiways A1, B1, B2 and C. A fifth one, named “Taxiway1”, was added to account for taxiing from the intersection of Taxiway C with the runway to the beginning of the RWY11. This is because it was assumed that all aircraft departing from RWY11 taxi to the runway threshold. For each taxiway, their actual widths, corresponding elevations and implicit taxing speed values were entered. For Taxiway1, its width was assumed to be equal to the width of the widest taxiways at the airport. All parameters used for the runway and taxiways are presented in
Table 3.
The next step was to map the aircraft stands at the terminal. A simplification was made, and the entire apron—Apron 2—at the passenger terminal was modeled as one parking stand. An elevation of the modeled apron of 121.62 m was introduced.
The next action was to define taxipaths. Taxipaths are a compilation of the taxiways used that connect the runway exit to the aircraft stand for arrivals and the aircraft stand to the beginning of the runway for departures. The designated taxipaths are shown in
Table 4.
The final step in modeling the airport layout was to determine the configurations. Configurations are the pattern of aircraft arrivals and departures on specific runways depending on activation parameters. In the conducted study, only one activation parameter was used, which was wind direction. It was determined that for wind direction in the range from 23° to 201°, landings and takeoffs were performed from RWY11, while for wind direction in the range from 202° to 22°—from RWY29. Thus, it was assumed that landings and takeoffs were performed upwind.
2.3. Defining Parameters Related to Pollutants’ Dispersion
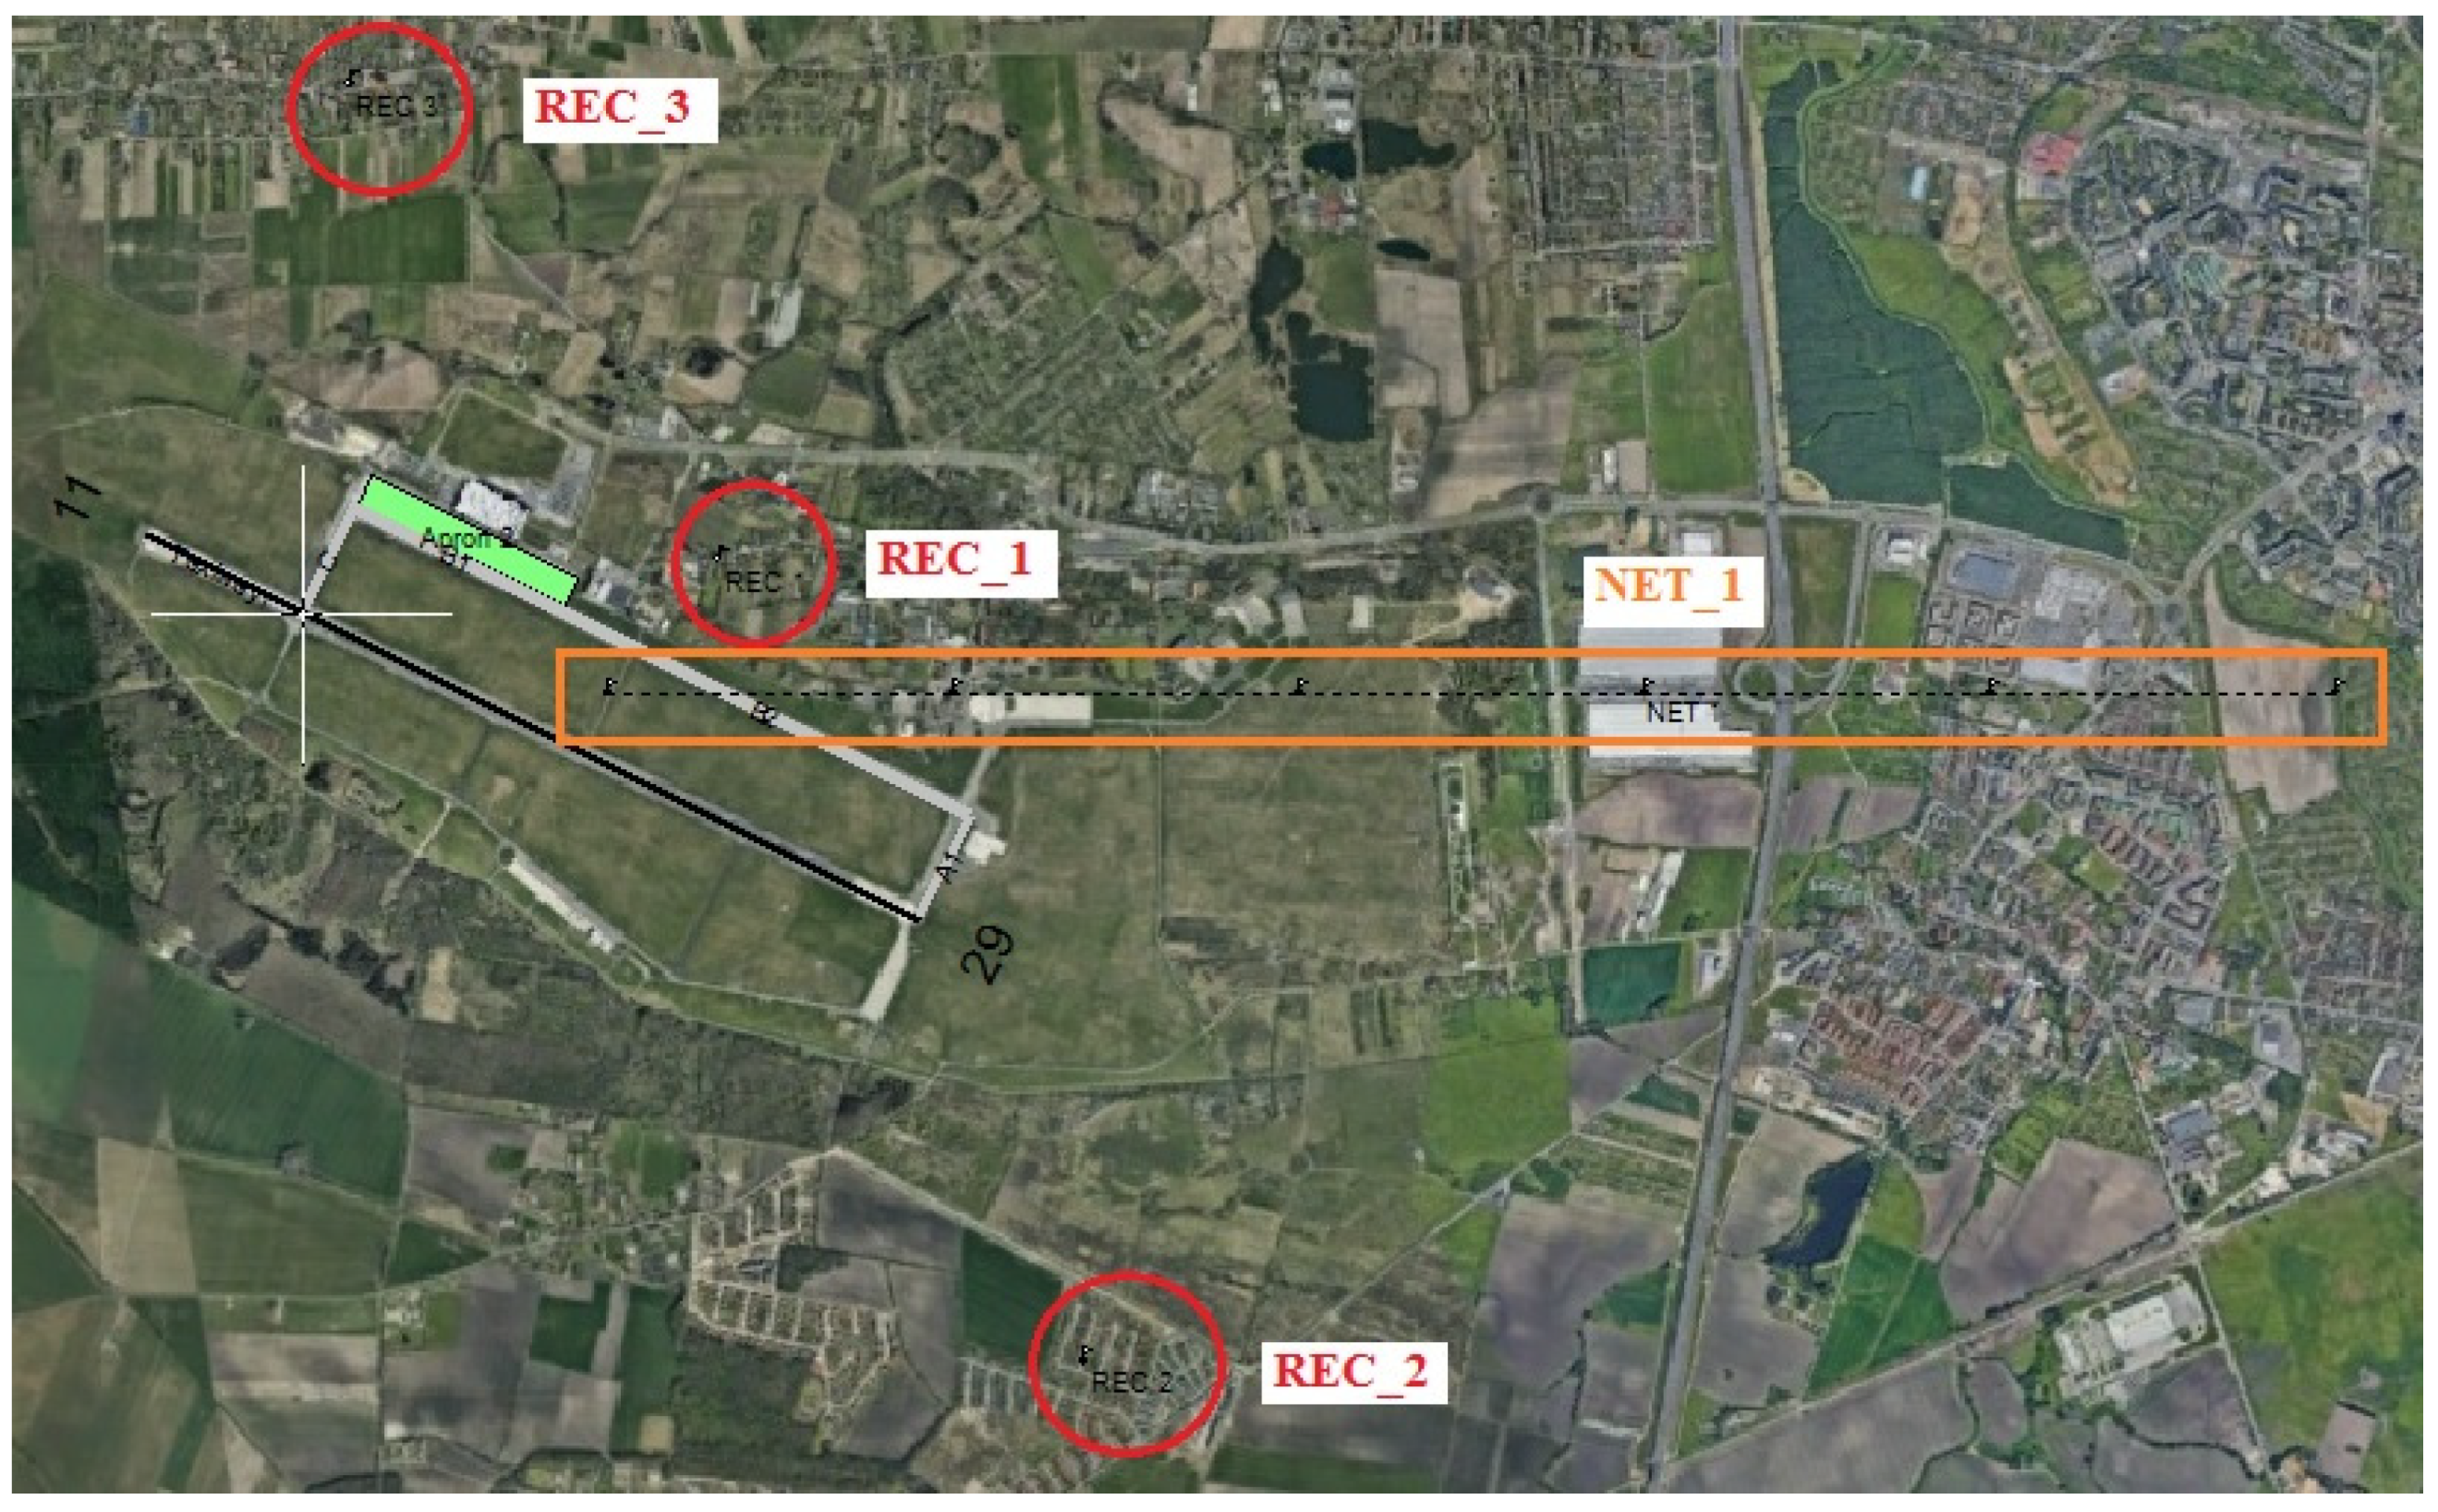
Dispersion modeling results in concentrations of individual pollutants in micrograms per cubic meter at points selected for analysis called receptors. In the performed study, three single receptors—REC_1, REC_2 and REC_3—and a receptor network named NET_1 were created (
Figure 1).
The REC_1 receptor was located in a residential area nearest to the airport. The choice of this location was also due to the high share of westerly and southwesterly winds (39% in July and 71% in December [
37]) in the analyzed area, which influenced the transport of pollutants eastward from the airport. The second receptor, REC_2, was placed in a residential area southeast of the airport. This receptor was located approximately 3 km from Plate 2 and was predicted to have lower pollutant concentrations due to its greater distance from the airport than REC_1 and the low contribution from north and northwest winds (32% in July and 9% in December, respectively [
38]). The REC_3 receptor was located north of the airport. As in the previous two cases, this was also a residential area located approximately 1.5 km from Apron 2. The distance of this site from the airport was smaller than the area analyzed to the southeast; however, there was also a smaller proportion of south and southeast winds (9% in July and 16% in December [
38]) affecting the dispersion of pollutants in this direction.
The NET_1 receptor network consisted of six receptors placed one behind the other exactly in the eastern direction (according to the western wind direction) towards the center of Wroclaw. The first receptor was located in the middle of the airport. The distances between subsequent receptors were 1 km. The analysis of pollutant concentrations at the points of the discussed network enabled determination of the influence of the distance from the airport on air pollution.
A measurement height of 1.8 m above ground level was modeled for all receptors. The elevations of each area were estimated using Google Earth Pro. For receptor REC_2, this was 121 m, and for the other receptors, it was 120 m.
3. Results and Discussion
3.1. Analysis of Pollutant Emissions by Emission Source
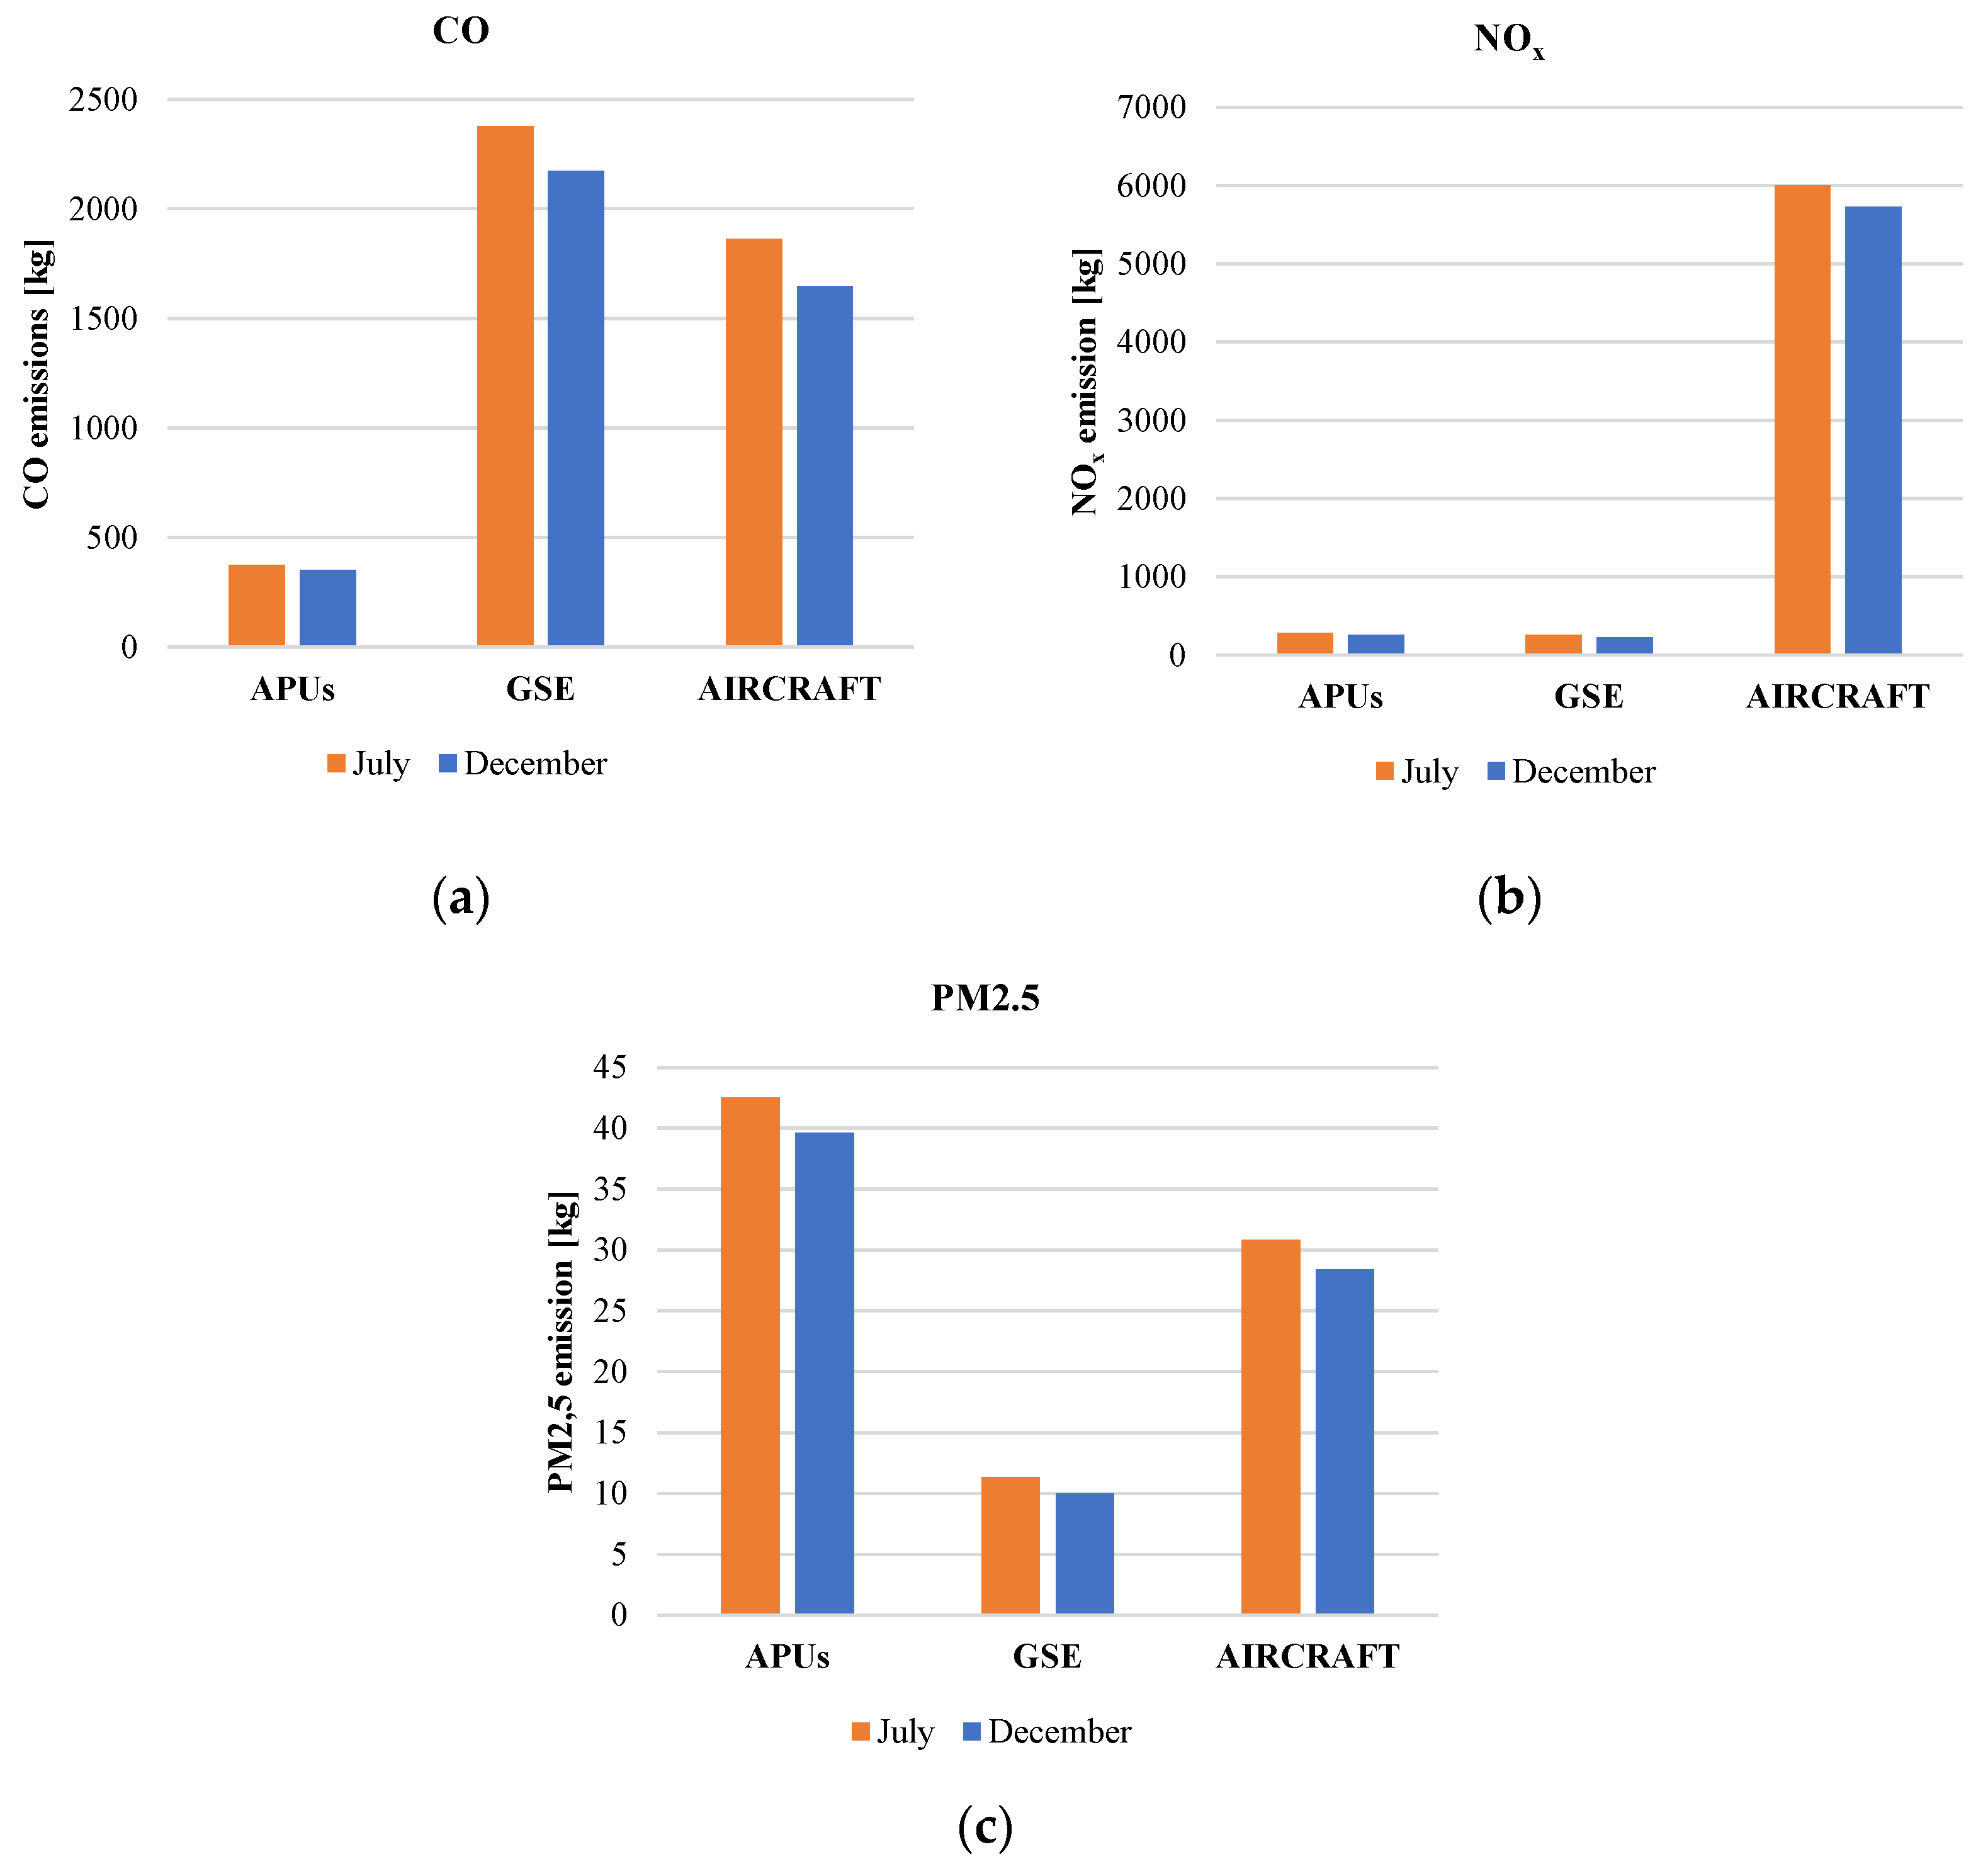
First, the amount of pollutants emitted was analyzed. Three toxic compounds were selected for analysis: carbon monoxide, nitrogen oxides and particulate matter with aerodynamic diameters below 2.5 μm.
Table 5 and
Figure 2 present the total modeled emissions by auxiliary power units, ground support equipment and aircraft.
Ground support equipment emitted the most CO. Emissions of this compound from GSE exceeded those from aircraft by 28% in July and 32% in December and accounted for just over 50% of total emissions in both months. In contrast, aircraft proved to be the largest source of nitrogen oxides. NOx emissions from aircraft accounted for nearly 92% in July and over 92% in December of the total modeled emissions. For particulate matter, auxiliary power units were the largest emitters. PM2.5 emissions from APUs accounted for just over half of the total emissions and were 38% greater in July and 40% greater in December than emissions of this pollutant from aircraft.
The obtained results are slightly different from the results in other works presented. In the case of carbon monoxide, aircraft exhaust from the aircraft LTO cycle accounts for the largest contribution to emissions (from 89% [
37] to 97% [
39]). Aircraft are also the largest emitters of nitrogen oxides (from 80% [
37] to 95% [
39]). With respect to PM2.5 emissions, the shares of the different sources—aircraft, GSE and APUs—are, respectively, 62%, 28% and 10% [
38]. The differences may be due to various assumptions in the adopted methodologies. In addition, it might be necessary to verify the assumed APU run times and obtain accurate information about the ground support equipment used at the airport.
3.2. Analysis of Pollutant Concentrations at Three Selected Locations Relative to the Airport
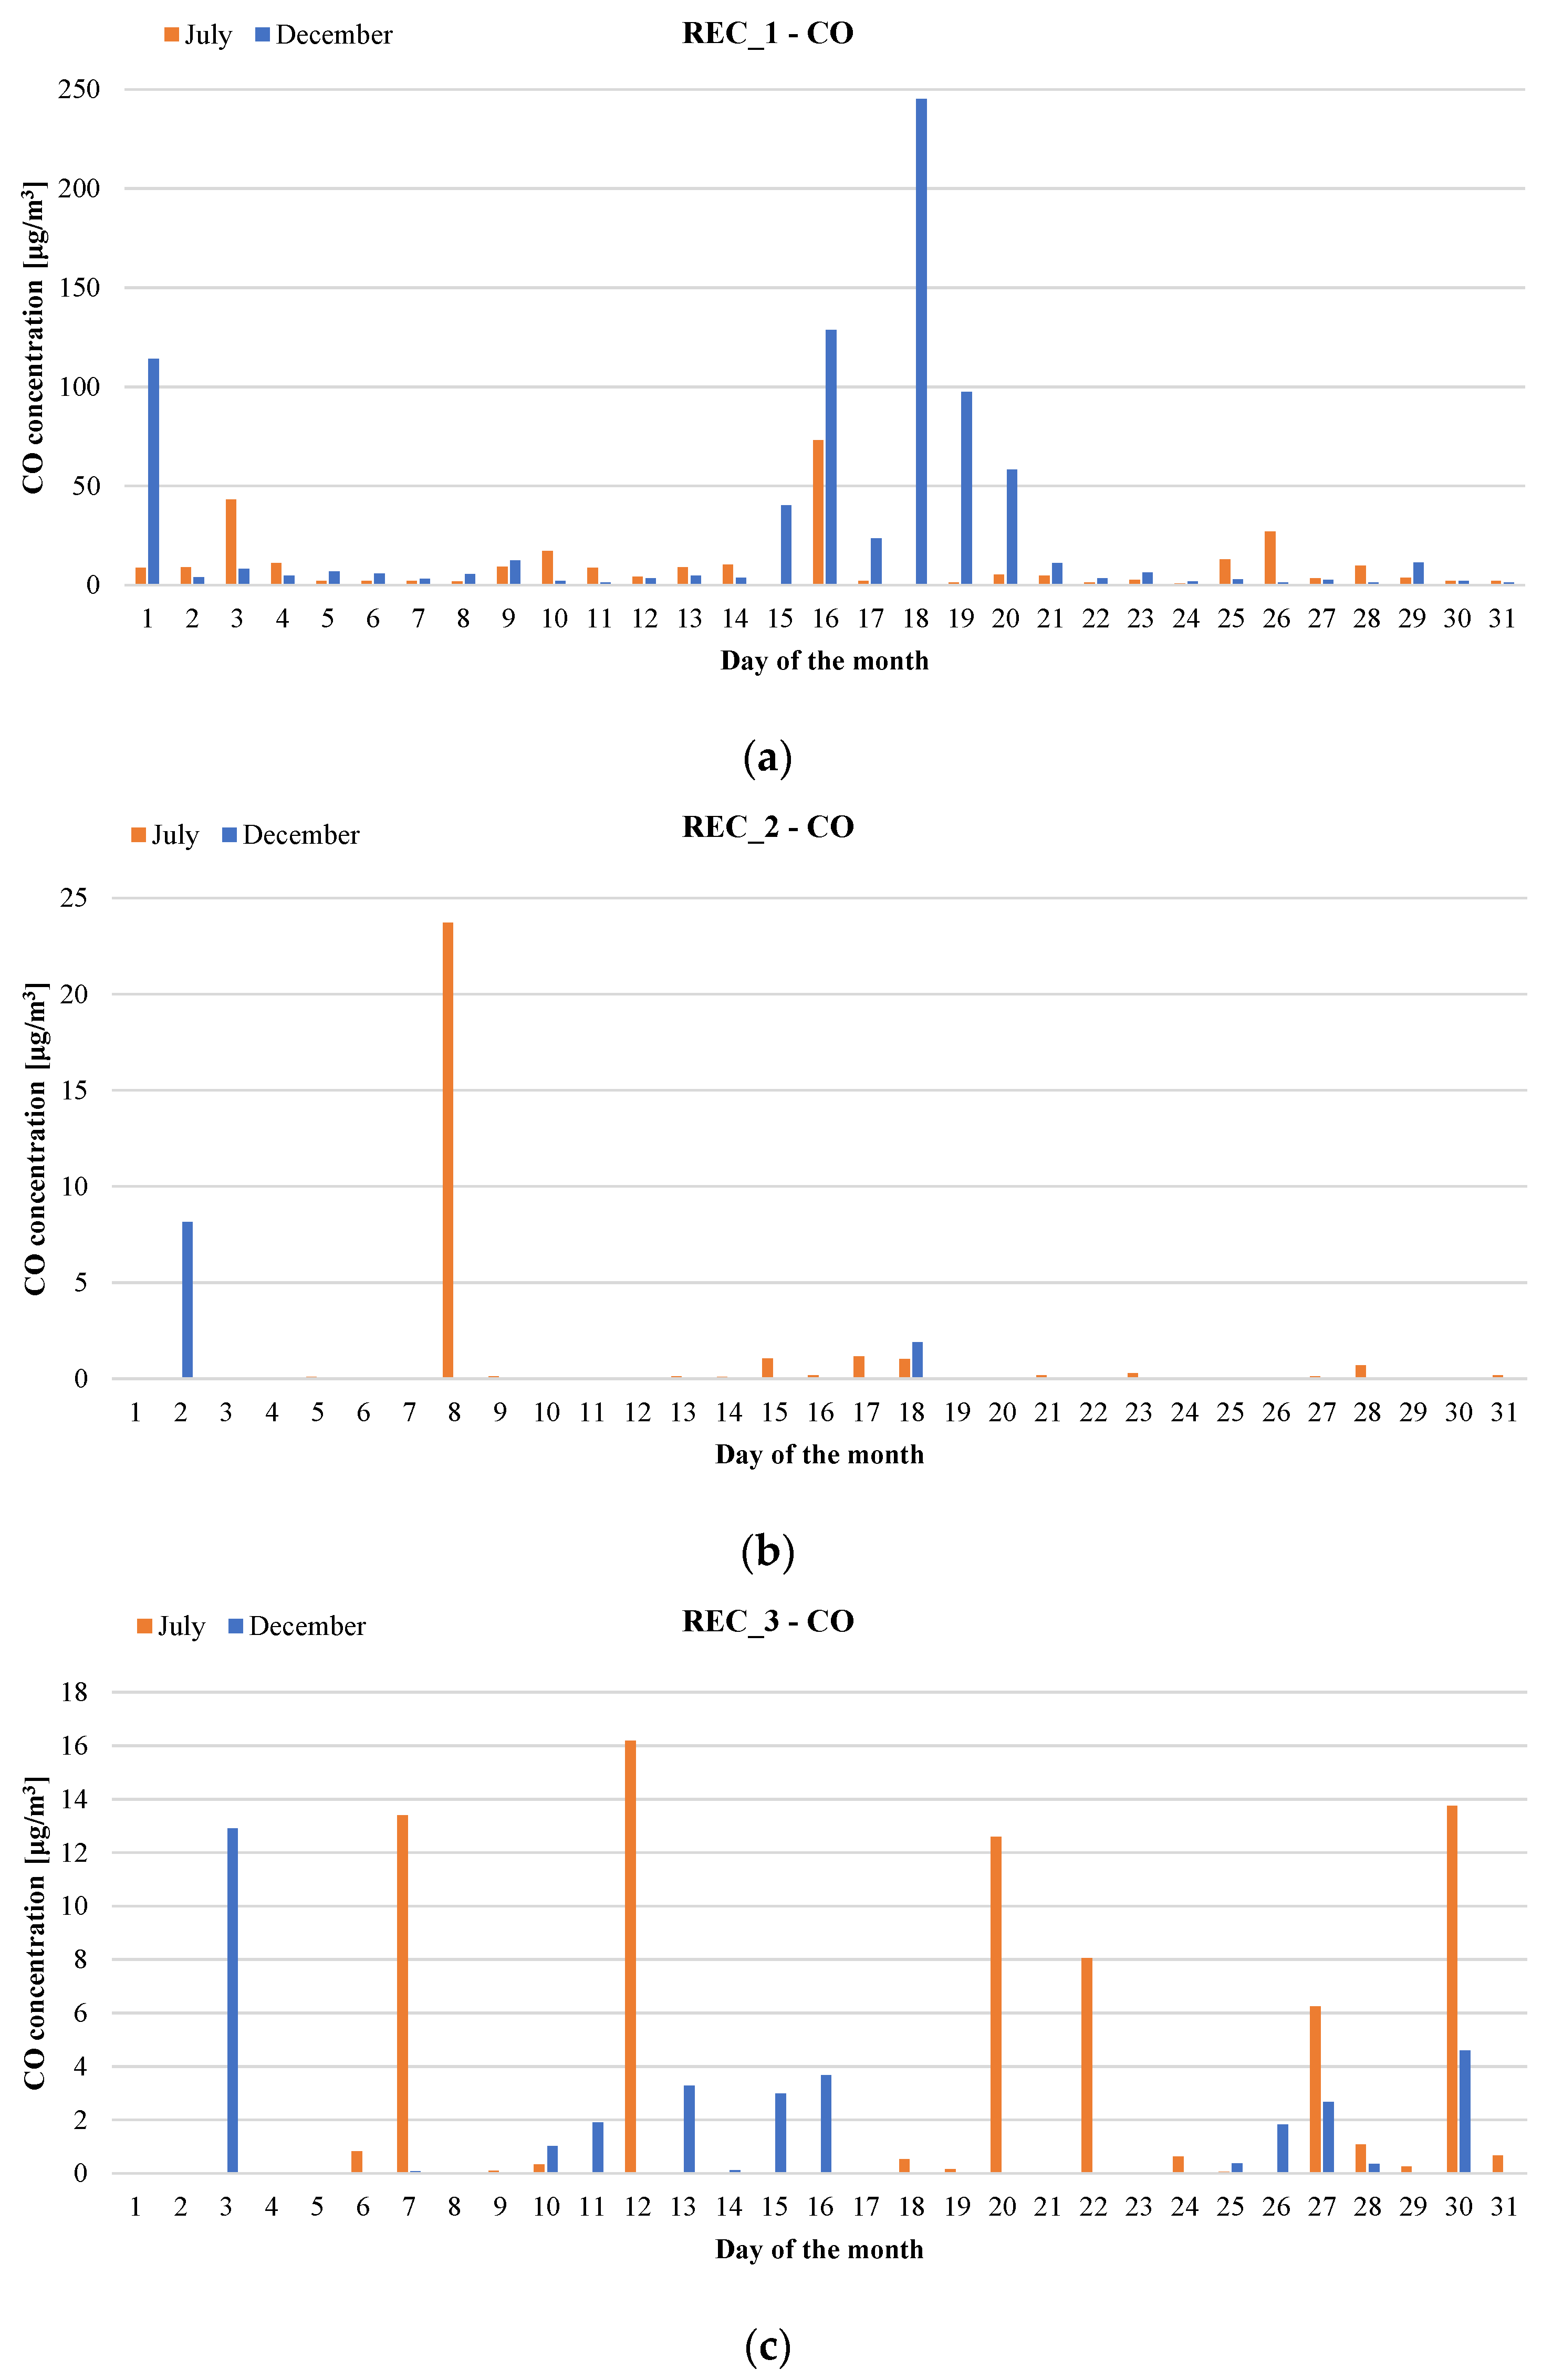
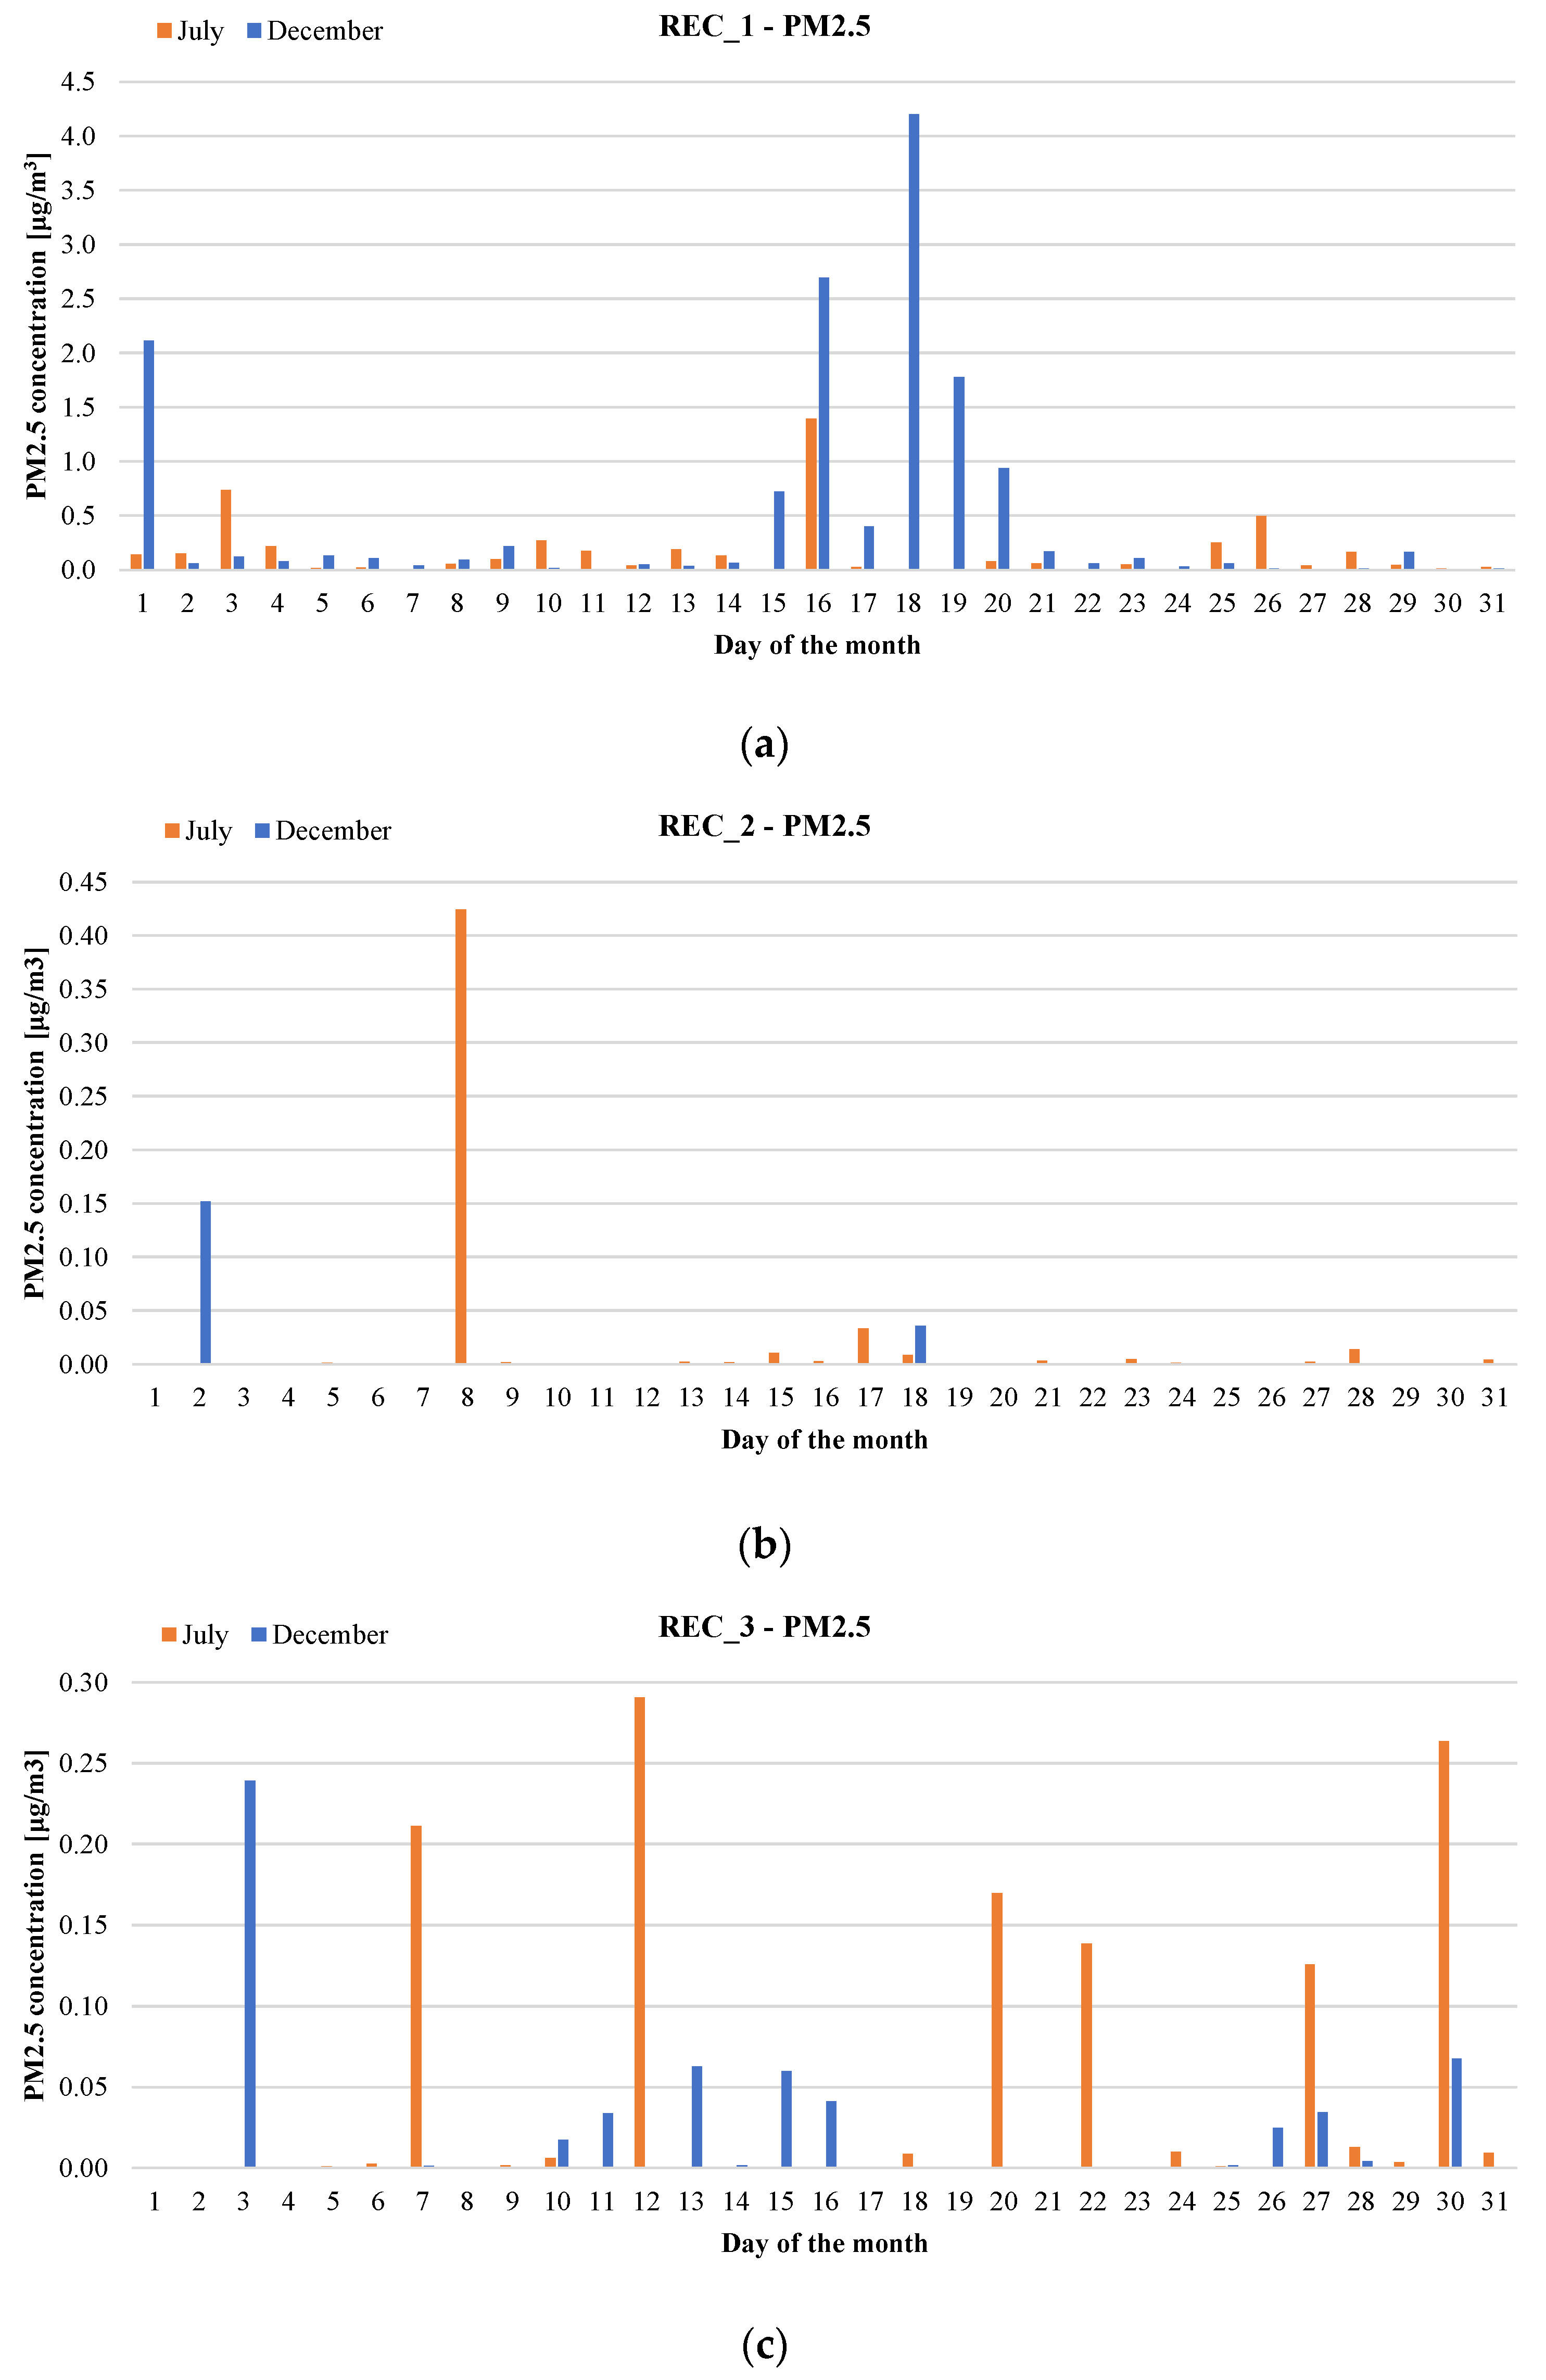
The next step was to analyze pollutant concentrations at REC_1, REC_2 and REC_3 receptors. The presented results include daily values of concentrations of toxic compounds obtained for consecutive days of July and December.
Figure 3 shows the 24 h average carbon monoxide concentrations separately for each day in July and December at each of the three receptors analyzed.
The values of CO concentrations varied quite a bit from day to day. The highest concentration was reached in December at the REC_1 receptor closest to the airport and was 245.2 μg/m
3. On many days, CO concentrations reached zero. It is presumed that this was largely dependent on wind direction [
40,
41]. This was also confirmed by the relationship that on days of high concentrations from one receptor, concentrations were very low at the other two receptors.
The predominance of westerly and southwesterly winds in both months and the shortest distance from the airport resulted in the highest concentrations at the REC_1 receptor. The maximum concentration at receptor REC_2 was 23.7 μg/m3 and was one of only two values during both months at this location above 5 μg/m3. At receptor REC_3, the highest concentration was 16.2 μg/m3; however, the 5 μg/m3 value was exceeded seven times in total during July and December. The reason for this situation was the predominance of southeastern winds over northern winds, which are believed to be the most determining for the spreading of pollutants towards REC_2 receptor.
When comparing the two months to each other, the influence of wind direction was also evident. There were more westerly and southwesterly winds in December than in July and because of this, the highest CO concentrations were observed in REC_1 in December. In contrast, there were more southeasterly winds in July than in December, which influenced the occurrence of more days of high carbon monoxide concentrations in REC_3 in July than in December.
The value of pollutant concentrations is also determined by wind velocity. The higher the wind speed, the lower the pollutant concentration [
42]. It is probable that wind velocity was responsible for the higher maximum carbon monoxide concentration at REC_2 located further from Apron 2 than at REC_3 located closer to it.
Directive 2008/50/EC of the European Parliament and of the Council of 21 May 2008 on ambient air quality and cleaner air for Europe [
15] establishes the limit value of carbon monoxide concentration. It is defined as the maximum daily eight-hour mean and amounts to 10 mg/m
3. As it was mentioned, the maximum concentration of CO at the receptors selected for the analysis was 245.2 μg/m
3. This value is only 2.5% of the limit value defined in the Directive.
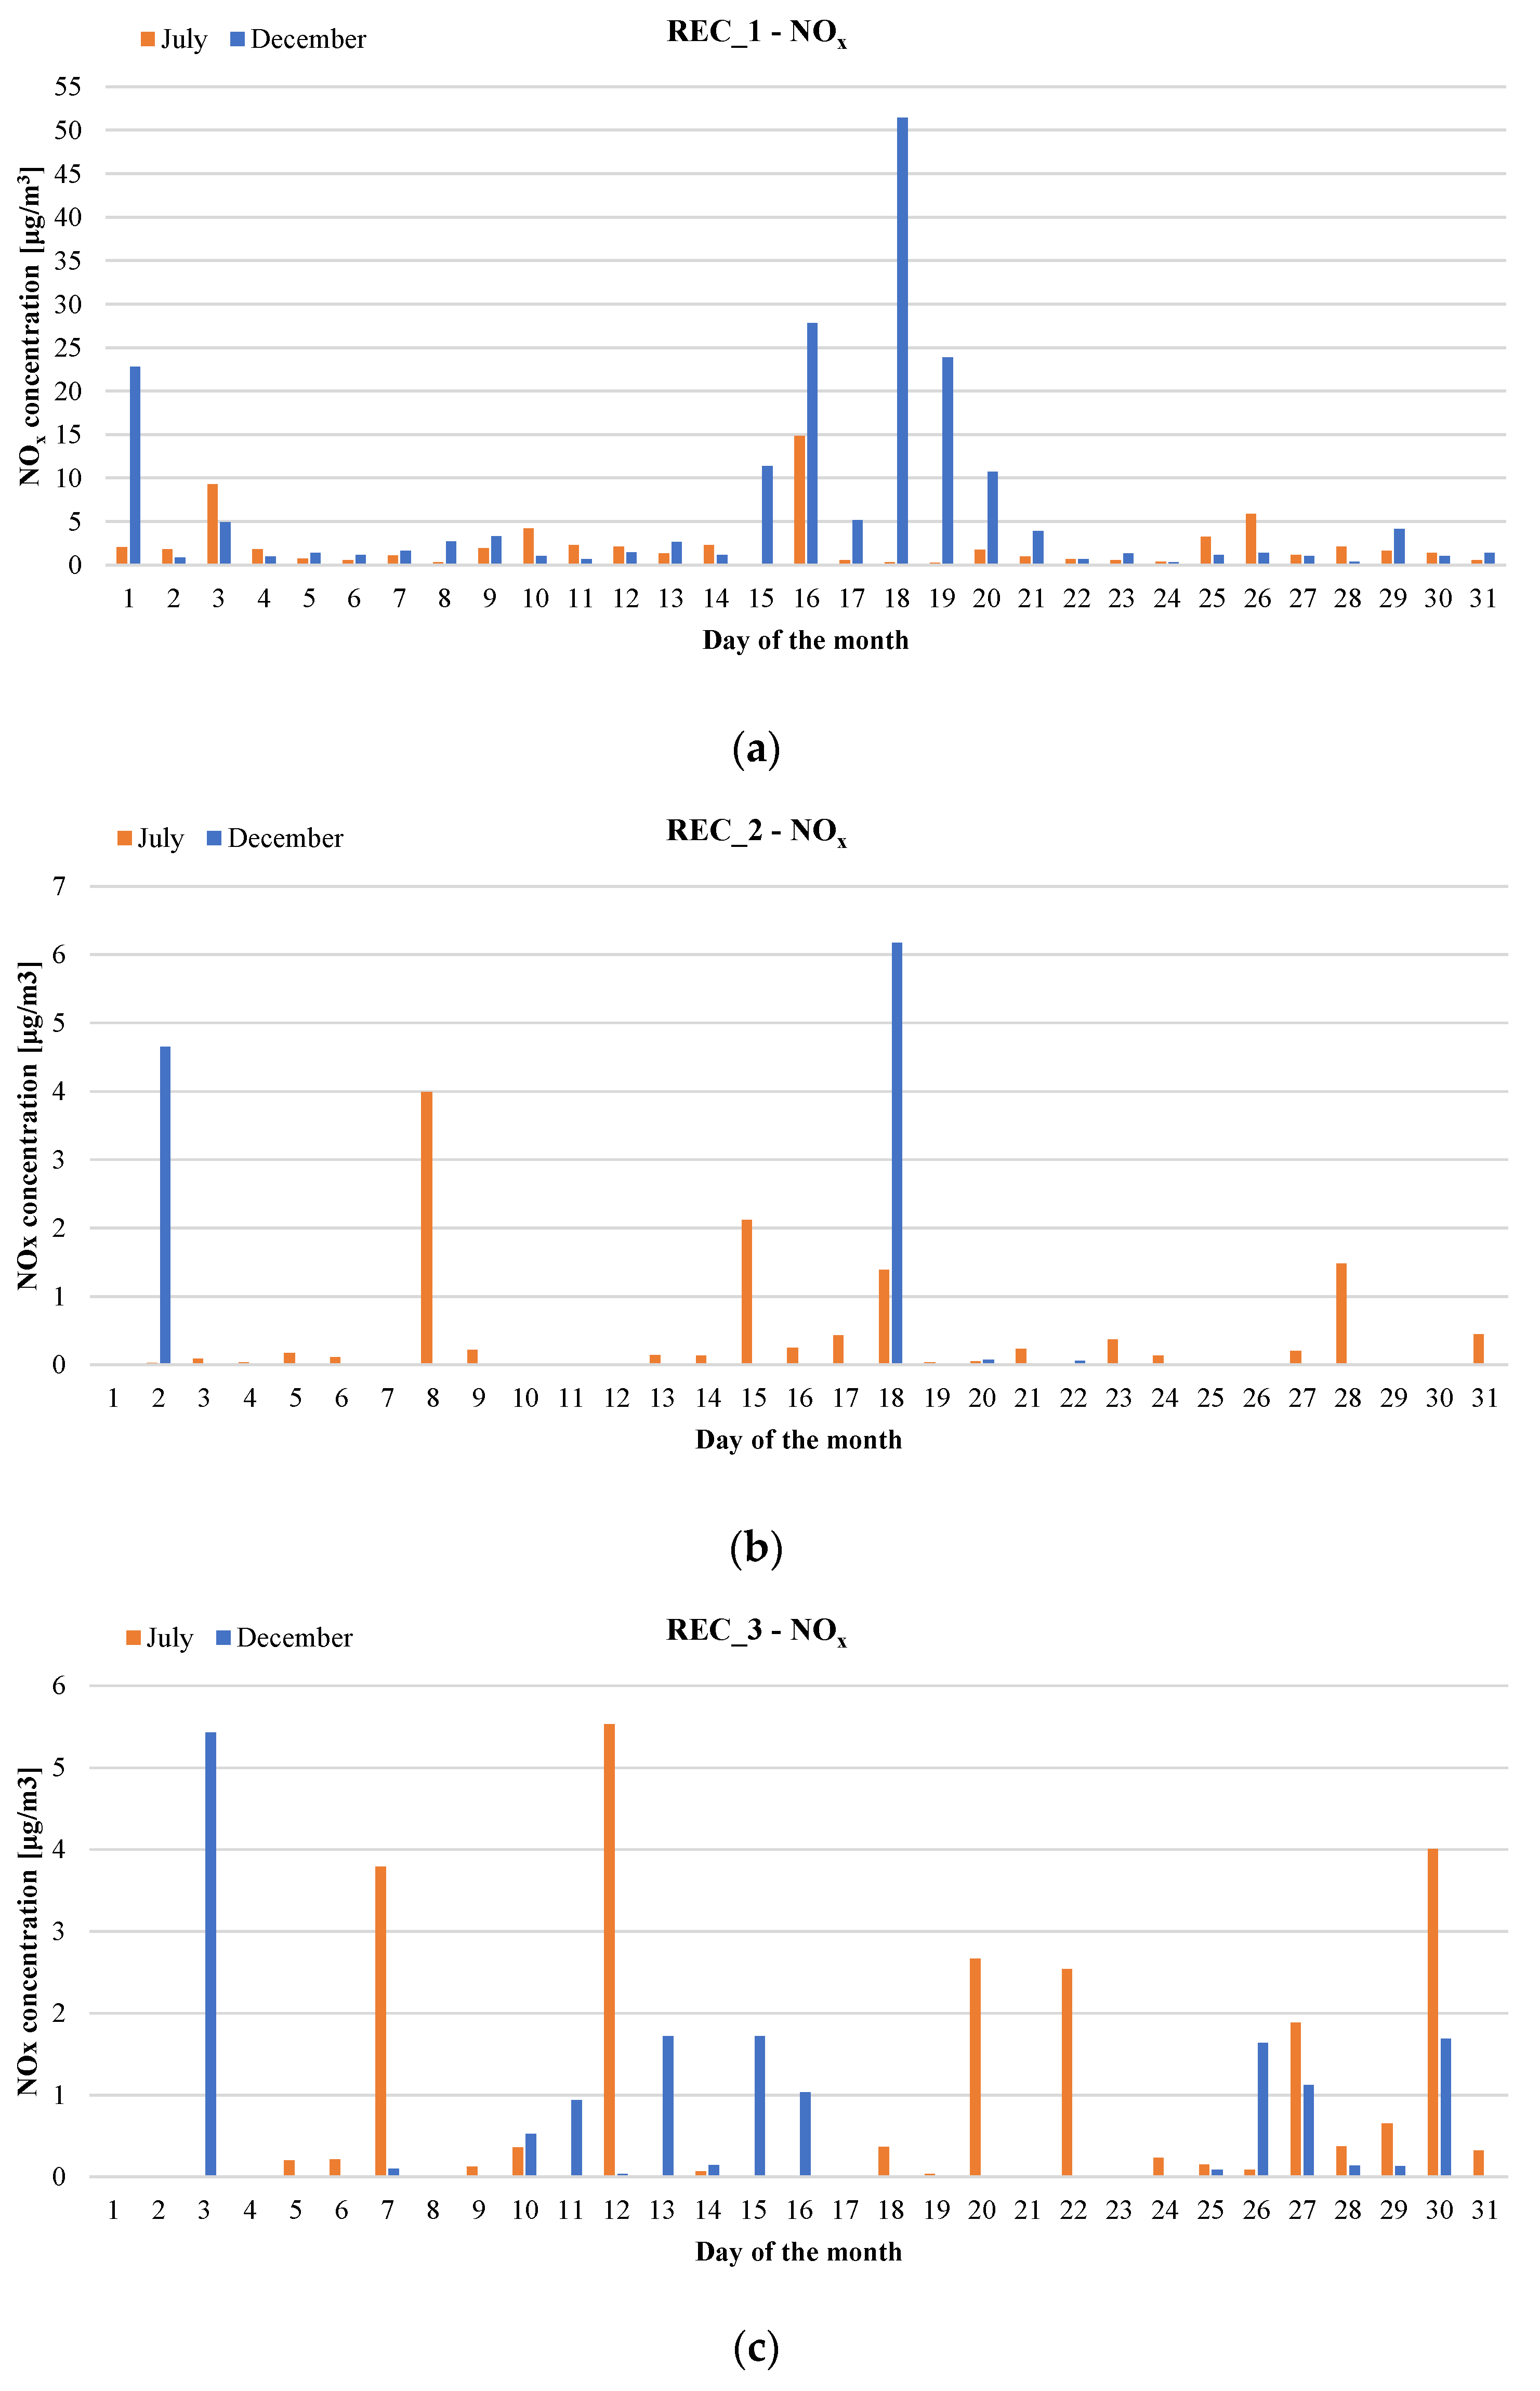
Figure 4 shows 24 h average concentrations of nitrogen oxides, and
Figure 5 shows 24 h average concentrations of PM2.5, analogous to those for carbon monoxide.
The monthly concentration characteristics of both NOx and PM2.5 were identical or nearly identical to those of carbon monoxide. Usually, maximum concentrations of CO occurred on the same days as maximum concentrations of nitrogen oxides and particulate matter. Small disproportions could be caused by differences in mass of emitted compounds or characteristics of their dispersion and transformations in the atmosphere. The smallest disproportions were visible for the REC_1 receptor located closest to the airport.
Directive 2008/50/EC [
15] also includes a daily concentration limit value for PM10 of 50 µg/m
3, which must not be exceeded more than 35 times in a calendar year. The maximum value of PM2.5, contained in PM10, for both months from all three receptors was equal to 4.2 µg/m
3, which is 8.4% of the limit value. Considering that particulate matter from other sources also reaches the study area, and that those covered by the study do not include all particulate matter generated by airport activity, it is possible to make the claim that airport operations are a major contributor to PM emissions. There is also a high probability that the indicated limit value for daily particulate matter concentration is exceeded in the vicinity of the airport.
A factor that also may have affected the concentrations of all three toxic compounds on particular days is rainfall. Rainfall contributes to the washing out of pollutants from the atmosphere [
43]. The study conducted in [
44] shows that the concentrations of each contaminant are higher on sunny days compared to those on rainy days. Particulate matter is absorbed by raindrops and thus carried to the soil. A similar trend is observed for gaseous pollutants such as carbon monoxide and nitrogen oxides. These compounds are soluble in rainwater and also enter the soil. This results in soil acidification and formation of acid rain [
44].
3.3. Analysis of the Impact of Distance from the Airport on Pollutant Concentrations
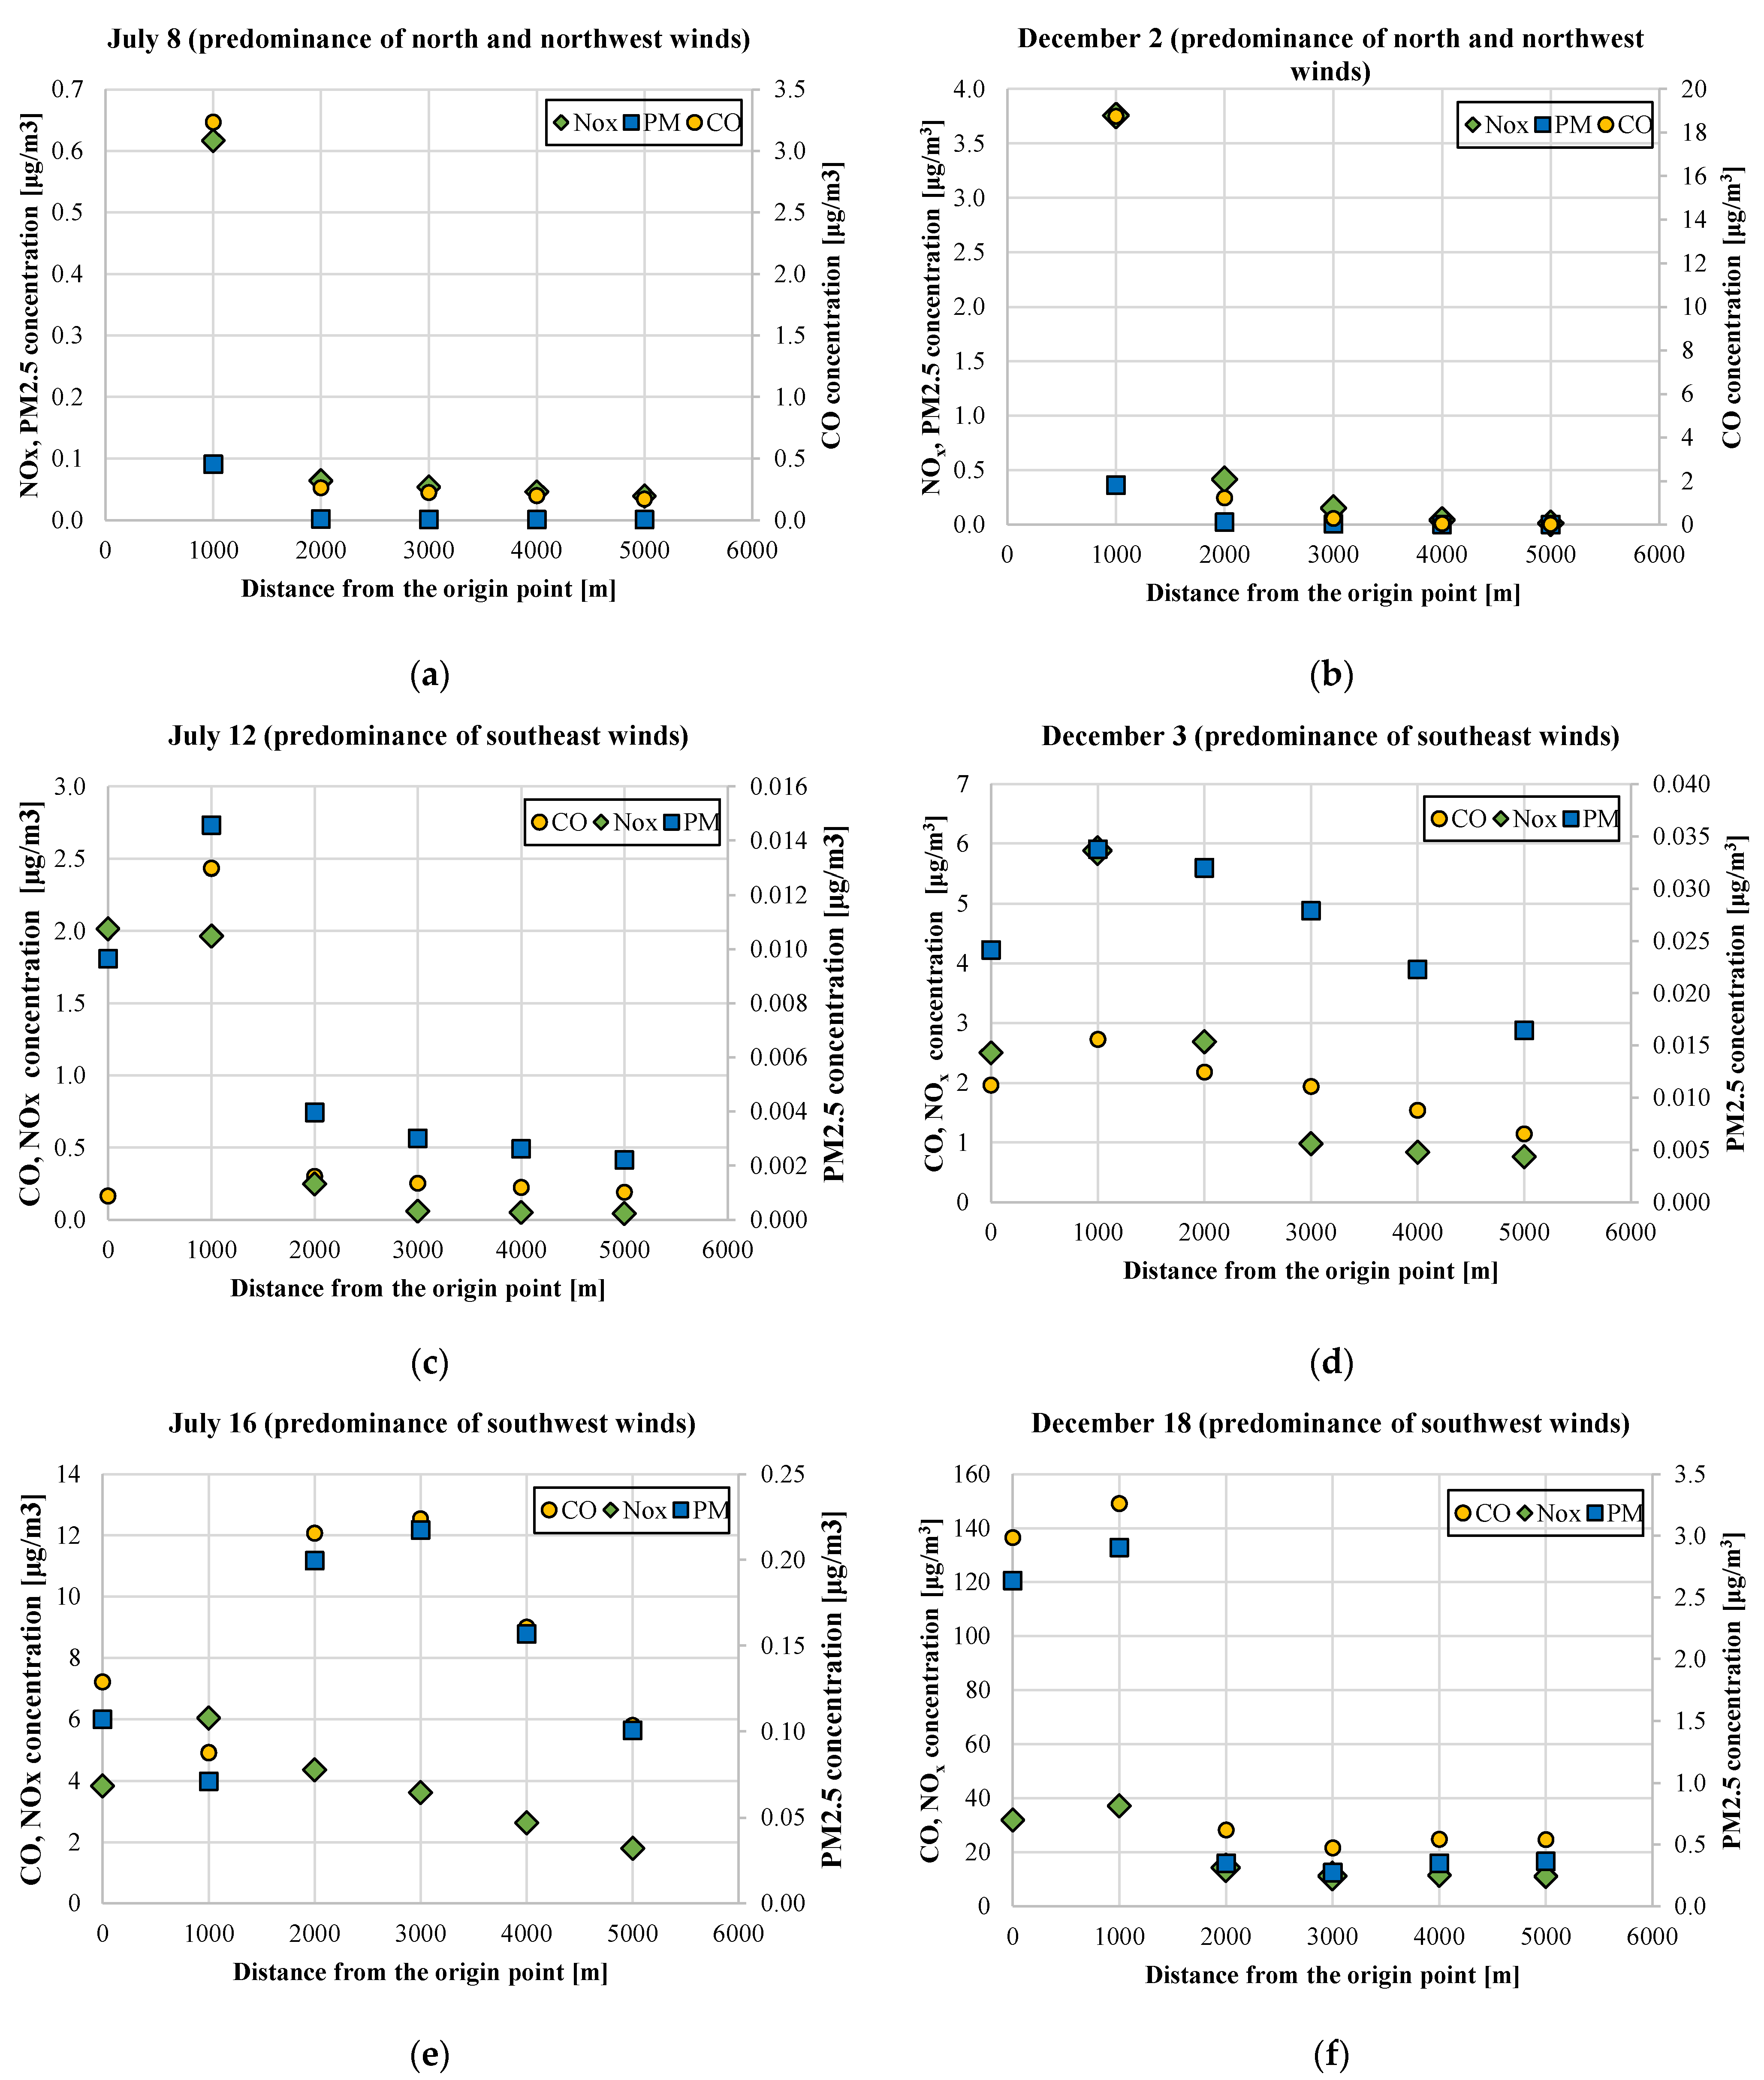
The final step of the study was to analyze the change in pollutant concentrations with increasing distance from the airport. For this purpose, three days in July and three days in December on which different wind directions prevailed were selected based on the maximum daily concentrations of toxic compounds at each of the three receptors (for example, if there was a maximum CO concentration at receptor REC_1 on 18 December and at the same time CO concentrations at the other two receptors on that day were low, this meant that southwest winds prevailed on 18 December).
Figure 6 shows the changes in toxic compound concentrations for all six selected days.
As previously mentioned, the NET_1 network receptors, which were used to analyze the effect of distance from the airport on pollutant concentrations, were modeled according to the west wind direction. In
Figure 6a,b, the concentration values for the starting point are omitted from the graphs to improve the readability of the graphs. They amounted to: CO—78 μg/m
3, NO
x—12.6 μg/m
3 and PM2.5—1.43 μg/m
3 for 8 July and CO—83 μg/m
3, NO
x—17.3 μg/m
3 and PM2.5—1.55 μg/m
3 for 2 December.
The days when the prevailing winds were from westerly and northwesterly directions were 8 July and 2 December. It can be observed that very high concentrations of the studied compounds occurred at the starting point and at the receptor 1 km away from it. The general tendency was decreasing. On 8 July, at consecutive points, the decrease of concentration values was mostly smaller and smaller, whereas on 2 December, practically at every point there was a decrease of one order of magnitude of concentration values.
On 12 July and 3 December, southeasterly winds prevailed, so the dispersion of pollutants was in a direction almost opposite to the direction of receptor placement. In most cases, an increase in pollutant concentrations was observed at the receptor 1 km from the origin point, followed by a gradual decrease with increasing distance from the initial point. This decrease was significantly smaller than in the previous two days. The maximum concentrations of toxic compounds were found to be several to tens of times smaller than the maximum values obtained on 8 July and 2 December. The difference was also evident at a point 5 km away from the center of the airport, where minimum concentration values were obtained. These values were slightly higher on 12 July and up to 100 times higher on 3 December than the minimum concentration values obtained at the same point on the previously analyzed days.
The last two days were 16 July and 18 December, which were dominated by winds from a southwesterly direction. On 16 July, the characteristics for NOx were slightly different than for the other two compounds. The concentration of nitrogen oxides reached the maximum at a distance of 1 km from the starting point after which it slowly decreased. On the other hand, the concentrations of CO and PM2.5 reached the lowest value at the point 1 km away from the center of the airport, increased until the distance equal to 3 km and then gradually decreased. The maximum values of concentrations of the studied pollutants on that day were only two to three times higher than the lowest values. In the case of 18 December, concentrations of all pollutants were the highest at the receptor located at a distance of 1 km from the origin point, followed by a rapid decrease. At subsequent points, the concentration values for each of the toxic compounds were similar to each other and showed little fluctuation. The maximum concentration values on that day were greater than the minimum values from nearly four to more than 10 times. The characteristics for 16 July and 18 December were quite divergent. This was probably due to the slightly different wind direction. It was supposed that on 18 December, the wind direction was the most westerly of all days, i.e., the most consistent with the direction of the dispersion analysis. It resulted from the fact that concentrations of compounds were higher at individual receptors on that day than at analogous receptors on the remaining days.
In summary, wind direction had a significant effect on the change in pollutant concentration values with increasing distance from the emission source. In the case of wind directions similar to the analyzed dispersion direction, there were high concentrations of compounds near the source, after which they decreased rapidly, reaching much smaller and quite similar values in the end. On the other hand, the analysis of pollutant dispersion in the direction almost opposite to the wind direction indicated the occurrence of much smaller values of concentrations in the vicinity of the emission source. Their decrease with distance was, however, less drastic. Nevertheless, it should be emphasized that the concentrations of the studied compounds at particular receptors turned out to be higher when the wind and dispersion directions were most compatible.
One should also bear in mind that the concentrations of pollutants depend not only on the wind direction, which was the main parameter analyzed. Wind is primarily responsible for the direction of pollutant transport. The concentrations of harmful compounds are also affected by factors such as turbulence, atmospheric stability, deposition on the ground surface or physical and chemical reactions depending, among others, on the meteorological conditions [
45,
46]. A thorough analysis would therefore require consideration of the remaining variables as well as the assumptions of the used dispersion model. In addition, it would be necessary to obtain precise information about the direction of the blowing wind.
4. Conclusions
Air pollution, especially in urban areas, is a problem that cannot be ignored [
46]. One factor contributing to the deterioration of local air quality is airport activity. Harmful compounds emitted by aircraft engines and other airport sources adversely affect the health of people living near the airport [
8,
9]. Increased demand for air traffic contributes to increased pollutant emissions. Therefore, there is a need to take measures to reduce the negative impact of aviation on the environment, especially since the ecological aspect is one of the determinants of the efficiency of the aviation sector [
47]. However, in order to be able to implement appropriate and effective actions, there is a need for continuous monitoring and forecasting of the influence of aviation activities on the environment.
The conducted study used modeling techniques to assess the impact of the Nicolaus Copernicus Airport activity on air contamination. Analysis of the emissions of the studied toxic compounds showed that the largest emitter of carbon monoxide was ground support equipment, while the greatest emitters of nitrogen oxides were airplanes and the highest emissions of PM2.5 were from auxiliary power units. The results obtained require further analysis to explain the reasons for the differences compared to the results found in other studies.
The analysis of the 24 h average concentrations of contaminants showed a large variation between individual days of the selected months as well as between both months. It is supposed that the wind direction had the greatest influence on the obtained concentrations of harmful compounds. Moreover, the study revealed that the exposure to pollutants of inhabitants of areas located in different directions in relation to the airport is not constant but has an impulsive character. However, the people most exposed are those living in the closest vicinity of the airport and in the direction consistent with the prevailing wind direction.
When examining the effect of distance from the airport on pollutant concentrations, differences were found depending on wind direction. In the case of dispersion analysis in the direction almost in line with the wind direction, very high values of contaminant concentrations were obtained near the starting point, which quickly decreased with distance to much smaller values. On the other hand, when winds with directions opposite to the direction of dispersion analysis prevailed, concentrations of the studied compounds did not reach such large values, and their decline with increasing distance was much less pronounced. Interestingly, on 12 July and 3 December, when southeast winds dominated, the minimum values of CO, NOx and PM2.5 concentrations exceeded the minimum values achieved, respectively, for 8 July and 2 December, when north and northwest winds dominated. This was probably due to factors other than wind direction and speed determining the dispersion of toxic compounds, perhaps rainfall. In addition, this could be caused by the hourly distribution of wind direction. The results may be of particular importance in the establishment of new residential areas near airports or in the construction of new airports, as they could help to reduce the negative effects of airport activity on the health and lives of nearby residents.
It should be emphasized that the analyzed case study shows some innovativeness due to the lack of similar analyses for Wroclaw airport or even other airports in Poland. This concerns both the obtained results of pollutant emissions by emission sources, as well as the daily average values of pollutant concentrations. Additionally, the analysis of the influence of the distance from the airport on the contaminant concentrations, when the direction of dispersion analysis was windward or downwind, is characterized by some uniqueness in the area of the assessment of the impact of airport activity on the pollution of the areas around the airport. As for the environmental activities of airports in Poland, they are mainly focused on noise protection, water and sewage management, waste management or protection from wildlife. If there are already activities related to air protection, they are concentrated on monitoring air quality through measurements rather than using modeling techniques. This proves the need for similar analyses for the area of Poland.


