Proceeding Paper

Uncertainty Quantification at the Microscale: A Data-Driven Multi-Scale Approach †

by
José Pablo Quesada-Molina
1,2,* and
Stefano Mariani
1
1
Department of Civil and Environmental Engineering, Politecnico di Milano, Piazza L. da Vinci 32, 20133 Milano, Italy
2
Department of Mechanical Engineering, Rodrigo Facio Brenes Campus, Universidad de Costa Rica, Montes de Oca, San José 11501-2060, Costa Rica
*
Author to whom correspondence should be addressed.
Presented at the 9th International Electronic Conference on Sensors and Applications, Online, 1–15 November 2022; Available online: https://ecsa-9.sciforum.net/.
Eng. Proc. 2022, 27(1), 38; https://doi.org/10.3390/ecsa-9-13351
Published: 1 November 2022

Abstract

:
Data-driven formulations are currently developed to deal with the complexity of the multi-physics governing the response of microelectromechanical systems (MEMS) to external stimuli and can be extremely helpful. Such devices are in fact characterized by a hierarchy of length and timescales, which are difficult to fully account for in a purely model-based approach. In this work, we specifically refer to a (single-axis) Lorentz force micro-magnetometer designed for navigation purposes. Due to an alternating current flowing in a slender mechanical part (beam) and featuring an ad hoc set frequency, the microsystem is driven into resonance so that its sensitivity to the magnetic field is improved. A reduced-order physical model was formerly developed for the aforementioned movable part of the device; this model was then used to feed and speed up a multi-physics and multi-objective topology optimization procedure, aiming to design a robust and performing magnetometer. The stochastic effects, which are responsible for the scattering in the experimental data at the microscale, were not accounted for in such a model-based approach. A recently proposed formulation is here discussed and further extended to allow for such stochastic effects. The proposed multi-scale deep learning approach features: at the material scale, a convolutional neural network adopted to learn the scattering in the mechanical properties of polysilicon, induced by its morphology; and, at the device scale, two feedforward neural networks, one adopted to upscale the mechanical properties, while the other learns a microstructure-informed mapping between the geometric imperfections induced by the microfabrication process and the effective response of the movable part of the magnetometer. The data-driven models are linked through the physical model to provide a kind of hybrid solution to the problem. Results relevant to different neural network architectures are here discussed, along with a proposal to frame the approach as a multi-fidelity, uncertainty quantification procedure.

1. Introduction

Most materials used in sophisticated technologies, such as in the case of MEMS, are characterized by a hierarchical internal structure with features at several length scales [1]. These hierarchical structures completely determine their macroscale properties and performance characteristics. Consequently, important efforts in the field of materials informatics are put into developing novel data-driven approaches for mining high fidelity process–structure–property (PSP) linkages from large collections of experimental, modeling, and simulation datasets [2]. Advancements in machine learning and data science approaches, have played a key role in accelerating microstructure quantification and feature extraction tasks, based on several methods such as n-point spatial correlations (n-point statistics) for the microstructural quantification and principal component analysis (PCA) for feature recognition [3,4,5]. Recently, deep learning approaches have facilitated the extraction of higher-order feature information for the establishment of PSP links [6]. Moreover, spatial statistics can be combined with deep learning-based extracted features to build unified models, leading to improved accuracy in terms of properties prediction [7,8].
Building upon a formerly developed artificial neural network (NN)-based framework, see [9,10,11,12], in this work, we propose an improved methodology in terms of the composition of the datasets, and the optimization of the architectural hyperparameters and overall training strategy. This data-driven protocol allows us to account for material related uncertainties governing the performance of polycrystalline structures at the microscale [13] while incorporating microfabrication-induced geometric uncertainties, to produce accurate structure–property mappings for a (single-axis) Lorentz force micro-magnetometer [14,15]. The response of the device is characterized in terms of the maximum oscillation amplitude of its polysilicon resonant structure.
The remainder of this work is organized as follows. Methodological details are discussed in Section 2. Results are reported and analyzed in Section 3. Finally, concluding remarks and insights for future research work are collected in Section 4.

2. Methodology

2.1. Data-Driven Multi-Scale Approach

Figure 1 provides a general description of the adopted model. Two approaches are proposed to address the upscaling of the mechanical property of interest, in this case the in-plane Young’s modulus E ¯ of the polysilicon film. A homogenization procedure carries the information from the length scale of the squared h × h domains, representing stochastic volume elements (SVEs) in Model 1, to the length scale of the resonant structure of the device, i.e., the scale of the polysilicon beam of size L × h in Model 2. Dataset 1 defines the set of values h, while Dataset 2 defines a set of values L × h where n = L/h must be defined a priori and defines the size of the input layer of Model 2. Consequently, the combined use of Model 1 and Model 2 establishes a data-driven homogenization framework for all the possible beam geometries L × h for which L/h = n. In this work, Dataset 1 is composed of elements described by the set h = {2 µm, 3 µm, 5 µm and 10 µm} and n = 20 has been defined as the dimensionality of the input vector to Model 2. Moreover, only h = 2 µm has been considered for assembling the elements of Dataset 2 so that all the L × h structures correspond to samples featuring 40 µm × 2 µm.
The homogenization framework can therefore be exploited to produce microstructure-informed inference models for the polycrystalline structures, whose characteristic length scale is compatible with the scale defined by Model 2. This solution can be the case for typical structures of MEMS devices. An example of it is represented by Model 3, which employs the output of Model 2, together with an additional variable (representing a microfabrication defect termed over-etch, O ) as inputs to predict the maximum oscillation amplitude ν m a x of the resonant structure in a Lorentz force MEMS magnetometer, leveraging available analytical models in [14,15] to generate the ground truth data. O has been modeled according to the statistical distribution reported in [16,17].

2.2. Implementation Details

To find the optimal model architecture, a search space strategy is adopted and the KerasTuner hyperparameter optimization framework [18] is employed with Random Search as the tuning algorithm. To explore the search space, a maximum number of 50 trials, with one execution per trial, is established. Model 1 consists of a convolutional NN with the following arrangement of layers: 2D.Conv (filters = {32,64,96,128}, kernel_size = {3,5}) + Max.Pooling (pool_size = (2,2)) + 2D.Conv (filters = {32,64,96,128}, kernel_size = {3,5}) + Max.Pooling (pool_size = (2,2)) + Flatten followed by a single neuron output layer, Dense (units = 1). Adamax (learning rate = {0.01,0.001,0.0001}) has been selected as the optimizer. Here, values specified within curly brackets represent the elements of the associated search space.
Similarly, both Model 2 and Model 3 consist of feedforward NN, which feature an arrangement of 3 hidden layers of the type Dense (units = {50, 100, 150}), followed by a single neuron output layer Dense (units = 1). The same configuration for Adamax was used again. Moreover, mean squared error (MSE) loss function, batch size equal to 10, and early stopping with a patience equal to 50 were used in all the models.

2.3. Input Data Generation

2.3.1. Dataset 1

Stochastic volume elements were digitally generated via the regularized Voronoi tessellation procedure described in [13] and formerly adopted in [9,10,11,12]. Associated target values of the homogenized Young’s modulus E ¯ S V E were obtained via standard FE simulations. Exploiting the anisotropic elasticity of silicon [19], gray level values between 0 and 1 encoded the in-plane lattice orientation of the crystalline domains, measured with respect to a global reference axis. These squared h × h domains were representative of the texture of polysilicon thin films at the microscale. For the current work, a finite set of characteristic values, namely h = {2 µm, 3 µm, 5 µm and 10 µm} was considered. Specifically, the same dataset reported in [12] for the training of the material-level neural network was adopted for the fitting and assessment of Model 1, only differing in the selection of a lower image resolution of 64 × 64 pixels, rather than the original 128 × 128 pixels. A comparison between these two resolutions is depicted in Figure 2.
To quantify the variation in information associated with the adopted resolution, the Kullback–Leibler divergence was computed to measure the distance between the discrete probability distributions of the pixel values for the images at larger and lower resolutions represented, respectively, by P and Q. These distributions were obtained by normalizing the histograms of the pixel values. Specifically, the reverse KL, i.e., KL(Q||P) was computed, with Q regarded as an approximation of P. Results showed that even for the samples displaying the largest KL(Q||P) distance, an acceptable match of the modes of P was obtained by Q, thus validating the adopted image resolution adjustment.

2.3.2. Dataset 2

As introduced in Section 2.1, Model 2 was trained based on a dataset composed of N samples of size L × h, where N = 1050, L = 40 µm, and h = 2 µm, so that n = 20. At variance with former works [9,10,11,12], where each slender beam was considered as a concatenation of a single individual domain of size h × h, in the current work, a microstructure was digitally generated for the entire geometry of the beam following the same procedure specified in Section 2.3.1. Figure 3 illustrates one of the generated beam microstructures, displaying a resolution of 64 × 1280 pixels.
Each beam indexed by i (i = 1, 2, …, N) is partitioned into a set of j (j = 1, 2, …, n) 64 × 64 pixels subdomains that are fed to the already trained Model 1 to generate a vector of predictions that constitute the input of Model 2. Model 2 is trained to map the vector of predictions E ¯ i j from Model 1 into the homogenized Young’s modulus E ¯ i of the entire beam structure. Additionally, following a format given by number of samples, mean, and standard deviation of the target values, Dataset 2 was composed by: Training set = 800, 149.5 GPa, 1.3 GPa, Validation set = 150, 149.6 GPa, 1.3 GPa, Test set = 100, 149.6 GPa, 1.4 GPa. An additional test set, namely, Test set 2 = 91, 145.0 GPa, 26.3 GPa, consisted of 91 additional data points simulating beams of a hypothetically homogeneous material (so that no real microstructures need to be generated), displaying values of Young’s modulus in the range [100 GPa, 190 GPa]. This set was used to assess the generalization capabilities of Model 2 outside the range of target values characterizing the polysilicon beam microstructures, given by [144.9 GPa, 154.0 GPa].

2.3.3. Dataset 3

To generate the ground truth data, i.e., the maximum oscillation amplitude ν m a x of the resonant structure, this work relies on the analytical model of the single-axis Lorentz force MEMS magnetometer derived in [15], accounting for the weakly coupled thermo-electro-magneto-mechanical multi-physics governing the vibrations of the slender clamped–clamped resonant beam. The specific geometric parameters, i.e., the length, width, and thickness of the beams, were, respectively, given by 40 µm, 2 µm, and 5 µm and were considered in the analytical model to assemble Dataset 3, featuring: Training set = 800, 1.67 nm, 0.032 nm, Validation set = 100, 1.67 nm, 0.029 nm, Test set = 100, 1.67 nm, 0.032 nm.

3. Results

3.1. Homogenization of the Stochastic Volume Elements (SVE)

Within the tested configurations from the search space, the best performing model was obtained for the combination of hyperparameters given by {128, 5, 128, 3, 0.0001}. With this configuration, Model 1 consisted of a total of 176,001 parameters. A very good performance was obtained for the homogenization at the SVE scale, improving the results reported in [12]. The obtained MSE values correspond to 0.2037 GPa2, 0.0907 GPa2, 0.0874 GPa2, 1.4589 GPa2, and 0.1802 GPa2 for the Training set (h = 2, 10 µm), Validation set (h = 2, 10 µm), Test set 1 (h = 2, 10 µm), Test set 2 (h = 3 µm), and Test set 3 (h = 5 µm), respectively.

3.2. Homogenization of the Resonant Structure

The best performing model was obtained for the combination of hyperparameters given by {50, 50, 50, 0.001}, resulting in an architecture with a total of 6201 fitting parameters for Model 2. Figure 4 illustrates the good agreement between the predicted and ground truth data obtained by Model 2 on the test sets. The equation for the linear least squares (LLS) fitting of the predictions is reported in the parity plots, as well as the associated coefficient of determination R2.
The absolute percentage error associated to the mean and standard deviation computed from the set of predictions, corresponds to 0.0% and 7.7% for the Training set, 0.1% and 0.0% for the Validation set, 0.0% and 0.0% for the Test set, and 0.28% and 0.0% for Test set 2. Moreover, the MSE values associated are 0.0222 GPa2, 0.0149 GPa2, 0.0163 GPa2, and 0.1755 GPa2, respectively. These results confirm that Model 2 is able to generate predictions consistent with an effective homogenization scheme, reproducing the trivial expected output for the simulated beams featuring hypothetical homogeneous materials.

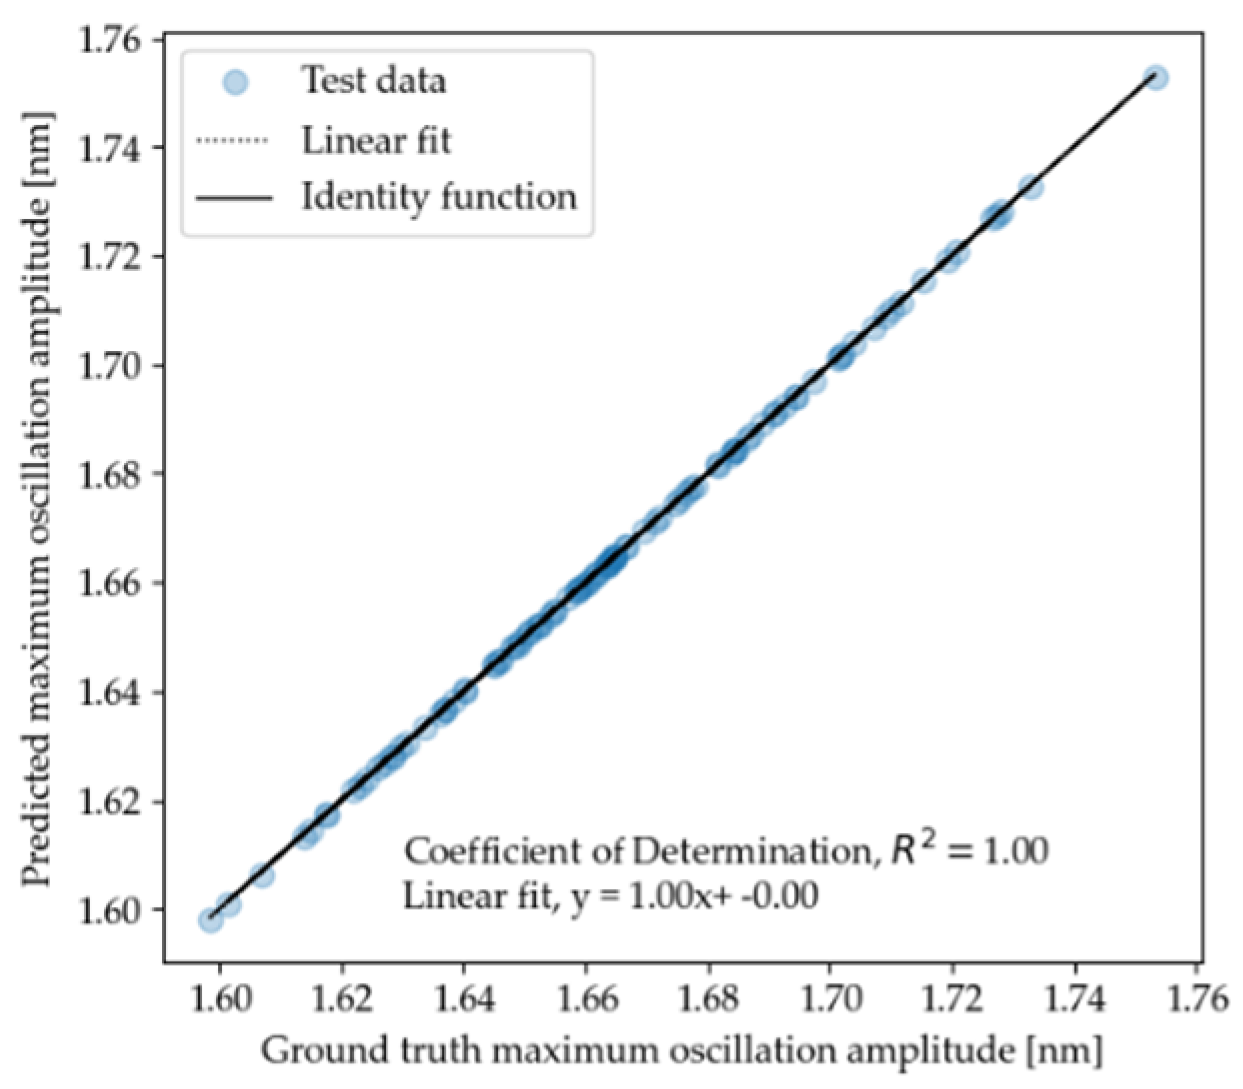
3.3. Maximum Oscillation Amplitude of the Lorentz Force MEMS Magnetometer

The best performing model was obtained for the combination given by {50, 150, 50, 0.01}. With these hyperparameters, Model 3 consists of a total of 15,401 fitting parameters. Figure 5 summarizes the performance of Model 3 on the test set, which can produce exact one-to-one predictions. In this case, the MSE values associated to each of the sets correspond to 2.099 × 10⁻⁸ nm2, 2.065 × 10⁻⁸ nm2, and 1.966 × 10⁻⁸ nm2 for the Training, Validation, and Test sets, respectively.

4. Conclusions

A data-driven modelling scheme was implemented and allowed the effective upscaling of the properties across the identified hierarchy of length scales in MEMS devices, accounting for the microstructure of complex textured structural films (e.g., made of polycrystalline materials). The proposed protocol can be readily exploited to model the response of intricate systems, such as MEMS devices, by incorporating additional relevant variables as inputs of a device-level model, able to learn complex structure–property mappings in a microstructure-informed data-driven manner.
Future research activities will focus on adapting the proposed homogenization framework to become more general and therefore less constrained by the specific device geometry.

Author Contributions

All authors have contributed equally. All authors have read and agreed to the published version of the manuscript.

Funding

This research received no external funding.

Institutional Review Board Statement

Not applicable.

Informed Consent Statement

Not applicable.

Data Availability Statement

Not applicable.

Acknowledgments

J.P.Q.-M. acknowledges the financial support by Universidad de Costa Rica, to pursue postgraduate studies abroad.

Conflicts of Interest

The authors declare no conflict of interest.

References

  1. Mariani, S.; Ghisi, A.; Corigliano, A.; Martini, R.; Simoni, B. Two-scale simulation of drop-induced failure of polysilicon MEMS sensors. Sensors 2011, 11, 4972–4989. [Google Scholar] [CrossRef] [PubMed] [Green Version]
  2. Kalidindi, S.R. Materials, Data, and Informatics. In Hierarchical Materials Informatics; Elsevier: Amsterdam, The Netherlands, 2015; pp. 1–32. [Google Scholar] [CrossRef]
  3. Kalidindi, S.R.; Niezgoda, S.R.; Salem, A.A. Microstructure informatics using higher-order statistics and efficient data-mining protocols. JOM 2011, 63, 34–41. [Google Scholar] [CrossRef]
  4. Gupta, A.; Cecen, A.; Goyal, S.; Singh, A.K.; Kalidindi, S.R. Structure-property linkages for non-metallic inclusions/steel composite system using a data science approach. Acta Mater 2015, 91, 239–254. [Google Scholar] [CrossRef]
  5. Çeçen, A.; Fast, T.; Kumbur, E.C.; Kalidindi, S.R. A data-driven approach to establishing microstructure-property relationships in porous transport layers of polymer electrolyte fuel cells. J. Power Sources 2014, 245, 144–153. [Google Scholar] [CrossRef]
  6. Bock, F.E.; Aydin, R.C.; Cyron, C.J.; Huber, N.; Kalidindi, S.R.; Klusemann, B. A Review of the Application of Machine Learning and Data Mining Approaches in Continuum Materials Mechanics. Front. Mater. 2019, 6, 110. [Google Scholar] [CrossRef] [Green Version]
  7. Cecen, A.; Dai, H.; Yabansu, Y.C.; Klidindi, S.R.; Song, L. Material structure-property linkages using three-dimensional convolutional neural networks. Acta Mater 2018, 146, 76–84. [Google Scholar] [CrossRef]
  8. Ganapathi, A.S. Prediction of two-phase composite microstructure properties through deep learning of reduced dimensional structure-response data. Comp. Part B Eng. 2021, 225, 109–282. [Google Scholar] [CrossRef]
  9. Quesada-Molina, J.P.; Mariani, S. A two-scale multi-physics deep learning model for smart MEMS sensors. J. Mater. Sci. Chem. Eng. 2021, 9, 41–52. [Google Scholar] [CrossRef]
  10. Quesada-Molina, J.P.; Mariani, S. Two-Scale Deep Learning Model for Polysilicon MEMS Sensors. Comput. Sci. Math. Forum 2022, 2, 12. [Google Scholar] [CrossRef]
  11. Quesada-Molina, J.P.; Mariani, S. Hybrid Model-Based and Data-Driven Solution for Uncertainty Quantification at the Microscale. Micro Nanosyst. 2022, 14, 281–286. [Google Scholar] [CrossRef]
  12. Quesada-Molina, J.P.; Mariani, S. Deep Learning-based Multiscale Modelling of Polysilicon MEMS. Proceedings of 2022 23rd International Conference on Thermal, Mechanical and Multi-Physics Simulation and Experiments in Microelectronics and Microsystems (EuroSimE), St. Julian, Malta, 24–27 April 2022. [Google Scholar] [CrossRef]
  13. Mariani, S.; Martini, R.; Ghisi, A.; Corigliano, A.; Beghi, M. Overall elastic properties of polysilicon films: A statistical investigation of the effects of polycrystal morphology. Int. J. Mult. Comp. Eng. 2011, 9, 327–346. [Google Scholar] [CrossRef]
  14. Bagherinia, M.; Bruggi, M.; Corigliano, A.; Mariani, S.; Lasalandra, E. Geometry Optimization of a Lorentz Force, Resonating MEMS Magnetometer. Microelectron. Reliab. 2014, 54, 1192–1199. [Google Scholar] [CrossRef]
  15. Bagherinia, S.M. Mariani. Stochastic effects on the dynamics of the resonant structure of a Lorentz force MEMS magnetometer. Actuators 2019, 8, 36. [Google Scholar] [CrossRef] [Green Version]
  16. Mirzazadeh, R.; Mariani, S. Uncertainty Quantification of Microstructure-Governed Properties of Polysilicon MEMS. Micromachines 2017, 8, 248. [Google Scholar] [CrossRef] [PubMed] [Green Version]
  17. Mirzazadeh, R.; Eftekhar Azam, S.; Mariani, S. Mechanical Characterization of Polysilicon MEMS: A Hybrid TMCMC/PODKriging Approach. Sensors 2018, 18, 1243. [Google Scholar] [CrossRef] [PubMed] [Green Version]
  18. O’Malley, T.; Bursztein, E.; Long, J.; Chollet, F.; Jin, H.; Invernizzi, L. Keras Tuner. 2019. Available online: https://github.com/keras-team/keras-tuner (accessed on 20 September 2022).
  19. Hopcroft, M.A.; Nix, W.D.; Kenny, T.W. What is the Young’s Modulus of Silicon? J. Micro. Syst. 2010, 19, 229–238. [Google Scholar] [CrossRef]
Figure 1. Overall model schematic, composed of three data-driven submodels to account for material- and geometry-related uncertainties at different (termed material and device) length scales.
Engproc 27 00038 g001
Figure 2. Pairs of images featuring original resolution (left) and reduced resolution (right), for all the considered values of h.
Engproc 27 00038 g002
Figure 3. Exemplary 2 µm × 40 µm beam structure of Dataset 2.
Engproc 27 00038 g003
Figure 4. Performance of Model 2 on the test sets specified in Section 2.3.2.
Engproc 27 00038 g004
Figure 5. Performance of Model 3 on the test set specified in Section 2.3.3.
Engproc 27 00038 g005
Publisher’s Note: MDPI stays neutral with regard to jurisdictional claims in published maps and institutional affiliations.

