1. Introduction
Electronic nose (EN) is an advanced technology for the fast identification of complex gaseous mixtures in such areas as food quality, environmental monitoring, counterfeit determination, medical diagnostics, etc. The basis of an EN instrument is an array of cross-selective chemical sensors typically combining a physical transducer and a chemical sensitive layer. Contrary to the approach when selective sensors are used, an array of low-selective sensors gives the response which can be interpreted as the chemical image (CI) of the analyte. A CI is a kind of graphic or mathematic representation of the analyte in the response space.
The functionality of such arrays is determined mostly by the adsorption properties of the sensitive layers. Each multisensor array is targeted to solve only a limited set of tasks and it will not be effective in other areas. This is one of the main problems limiting the wide spread of EN systems.
There are two perspective approaches for overcoming the limited application area of low-selective sensors arrays. Both of them are concerned with the development of new sensing materials with advanced properties. The first approach lies in the development of new sensitive layers with an improved sensitivity, repeatability, and long-term stability. One of the most effective ways to implement this is to combine organic materials, which provide the necessary selectivity profile, with nanostructured inorganic ones.
The second approach is the controlling of adsorption properties of sensor coatings, in other words, the creation of virtual sensors. A virtual sensor is a response of the same sensor operating in different conditions [
1].
We propose to combine both approaches. Nanostructured organic–inorganic sensitive layers based on ZnO nanoparticles and three different phthalocyanines: metal free (H2Pc), copper (CuPc), and lead (PbPc) phthalocyanines were created. We studied the adsorption properties of these layers and the possibility of controlling them by means of illumination. The combination of phthalocyanines with ZnO gave increased responses and the improved reproducibility of the experimental results. The use of the illumination of the obtained sensor coatings made it possible to further improve the recognition ability of the arrays, as well as to obtain additional virtual sensors from which new adaptive arrays can be built for various tasks.
The significant increase in the classification efficiency of the array based on hybrid organic–inorganic layers compared with single-layer phthalocyanine sensors and the additional benefits of a virtual sensor approach is demonstrated on the example of the classification of three alcohols: ethanol, methanol, and isopropanol. As these compounds have similar physico-chemical properties, they are quite a complicated target for classification by systems based on low-selective sensors. Therefore, the successful recognition of alcohols is a result that convincingly demonstrates the effectiveness of the used approaches.
2. Materials and Methods
The ZnO suspension was prepared as it is described here [
2]. The solutions were deposited on one of the electrodes of quartz crystal microbalance (QCM) sensors [
3]. Then, the Pc films were deposited by the thermal evaporation of the powder of metal-free, copper, and lead phthalocyanines (Sigma Aldrich) in a vacuum.
The resonant frequency of the QCM sensors decreases when its mass is increased; so, if an analyte is adsorbed on the surface, the oscillation frequency decreases and is recorded by the frequency meter. The difference between the initial frequency and that measured in the current time in the course of adsorption is the measuring parameter F. The maximum frequency shift was reached when the adsorption–desorption processes on the sensor’s surface came into the equilibrium, which is the response amplitude ΔF.
Ethanol, methanol, and isopropanol were obtained from Sigma Aldrich. The concentration of the analytes was 28,000 ppm.
The typical measurement procedure involved the following stages. Initially, blowing dry air through the gas chamber until the transducer frequency was stabilized (±2 Hz). Then, the sample was injected using the dynamic dilution to obtained the desired analyte concentration. After the signal’s saturation was achieved, blowing dry air through the gas chamber was conducted to the remove vapor residue until the QCM frequency returned to its initial value.
Agilent Technology LEDs with central wavelengths of 472 nm and 615 nm were used for the illumination of the sensor’s surfaces. These regions of spectra were chosen considering the spectral properties of both Pcs and ZnO. The strongest mutual influence of the organic and inorganic components of the hybrid structure was observed here. Indeed, an illumination within the “window” of the Pc’s absorption spectra (472 nm, 21,186 cm
−1) generates states with a partial charge transfer, which can significantly affect the features of the electrostatic interactions at the interface “ZnO-Pc”. Excitation within a high-intensity phthalocyanines’ Q band (615 nm, 17,886 cm
−1) makes it possible not only to maintain a high population of excited states using low-power sources, but also to modify their electron density distribution [
4].
The classification of the experimental data was performed by the cluster analysis method in the fuzzy logic format [
5]. The calculations were performed in the S-Plus environment by Math. Soft Inc. The advantage of this method is the presence of a quantitative assessment of the classification efficiency: the silhouette width (SW). This parameter reproduces the degree of belonging of an object to a certain cluster [
6].
Being normalized to the unity amplitudes of the sensor responses (1) were used as the initial data for analysis in the S-Plus.
Fnorm was used for the chemical images’ representation as well.
The reproducibility of the responses was evaluated by the coefficient of variation Cv, which is the ratio of the standard deviation to the mean value, taken as a percentage.
3. Results and Discussion
The cluster analysis results for the array of sensors with H
2Pc, CuPc, and PbPc layers (without ZnO underlayers) are presented on
Figure 1. Each point on the plot (
Figure 1, left) represents a measurement result: a cumulative array response for one or another analyte transformed for the best graphic representation. Each bar on the diagram (
Figure 1, right) represents a silhouette width for the corresponding response. Here, and after the numbers on the silhouette plot correspond to 1, 2, and 3 to the methanol, 4, 5, and 6 to ethanol, and 7, 8, and 9 to isopropanol.
As it is seen from the silhouette width plot (in the right), the wrong classification takes place: negative SW values indicate that the data most likely belong to another cluster. Therefore, this array cannot be used for the reliable classification of such analytes.
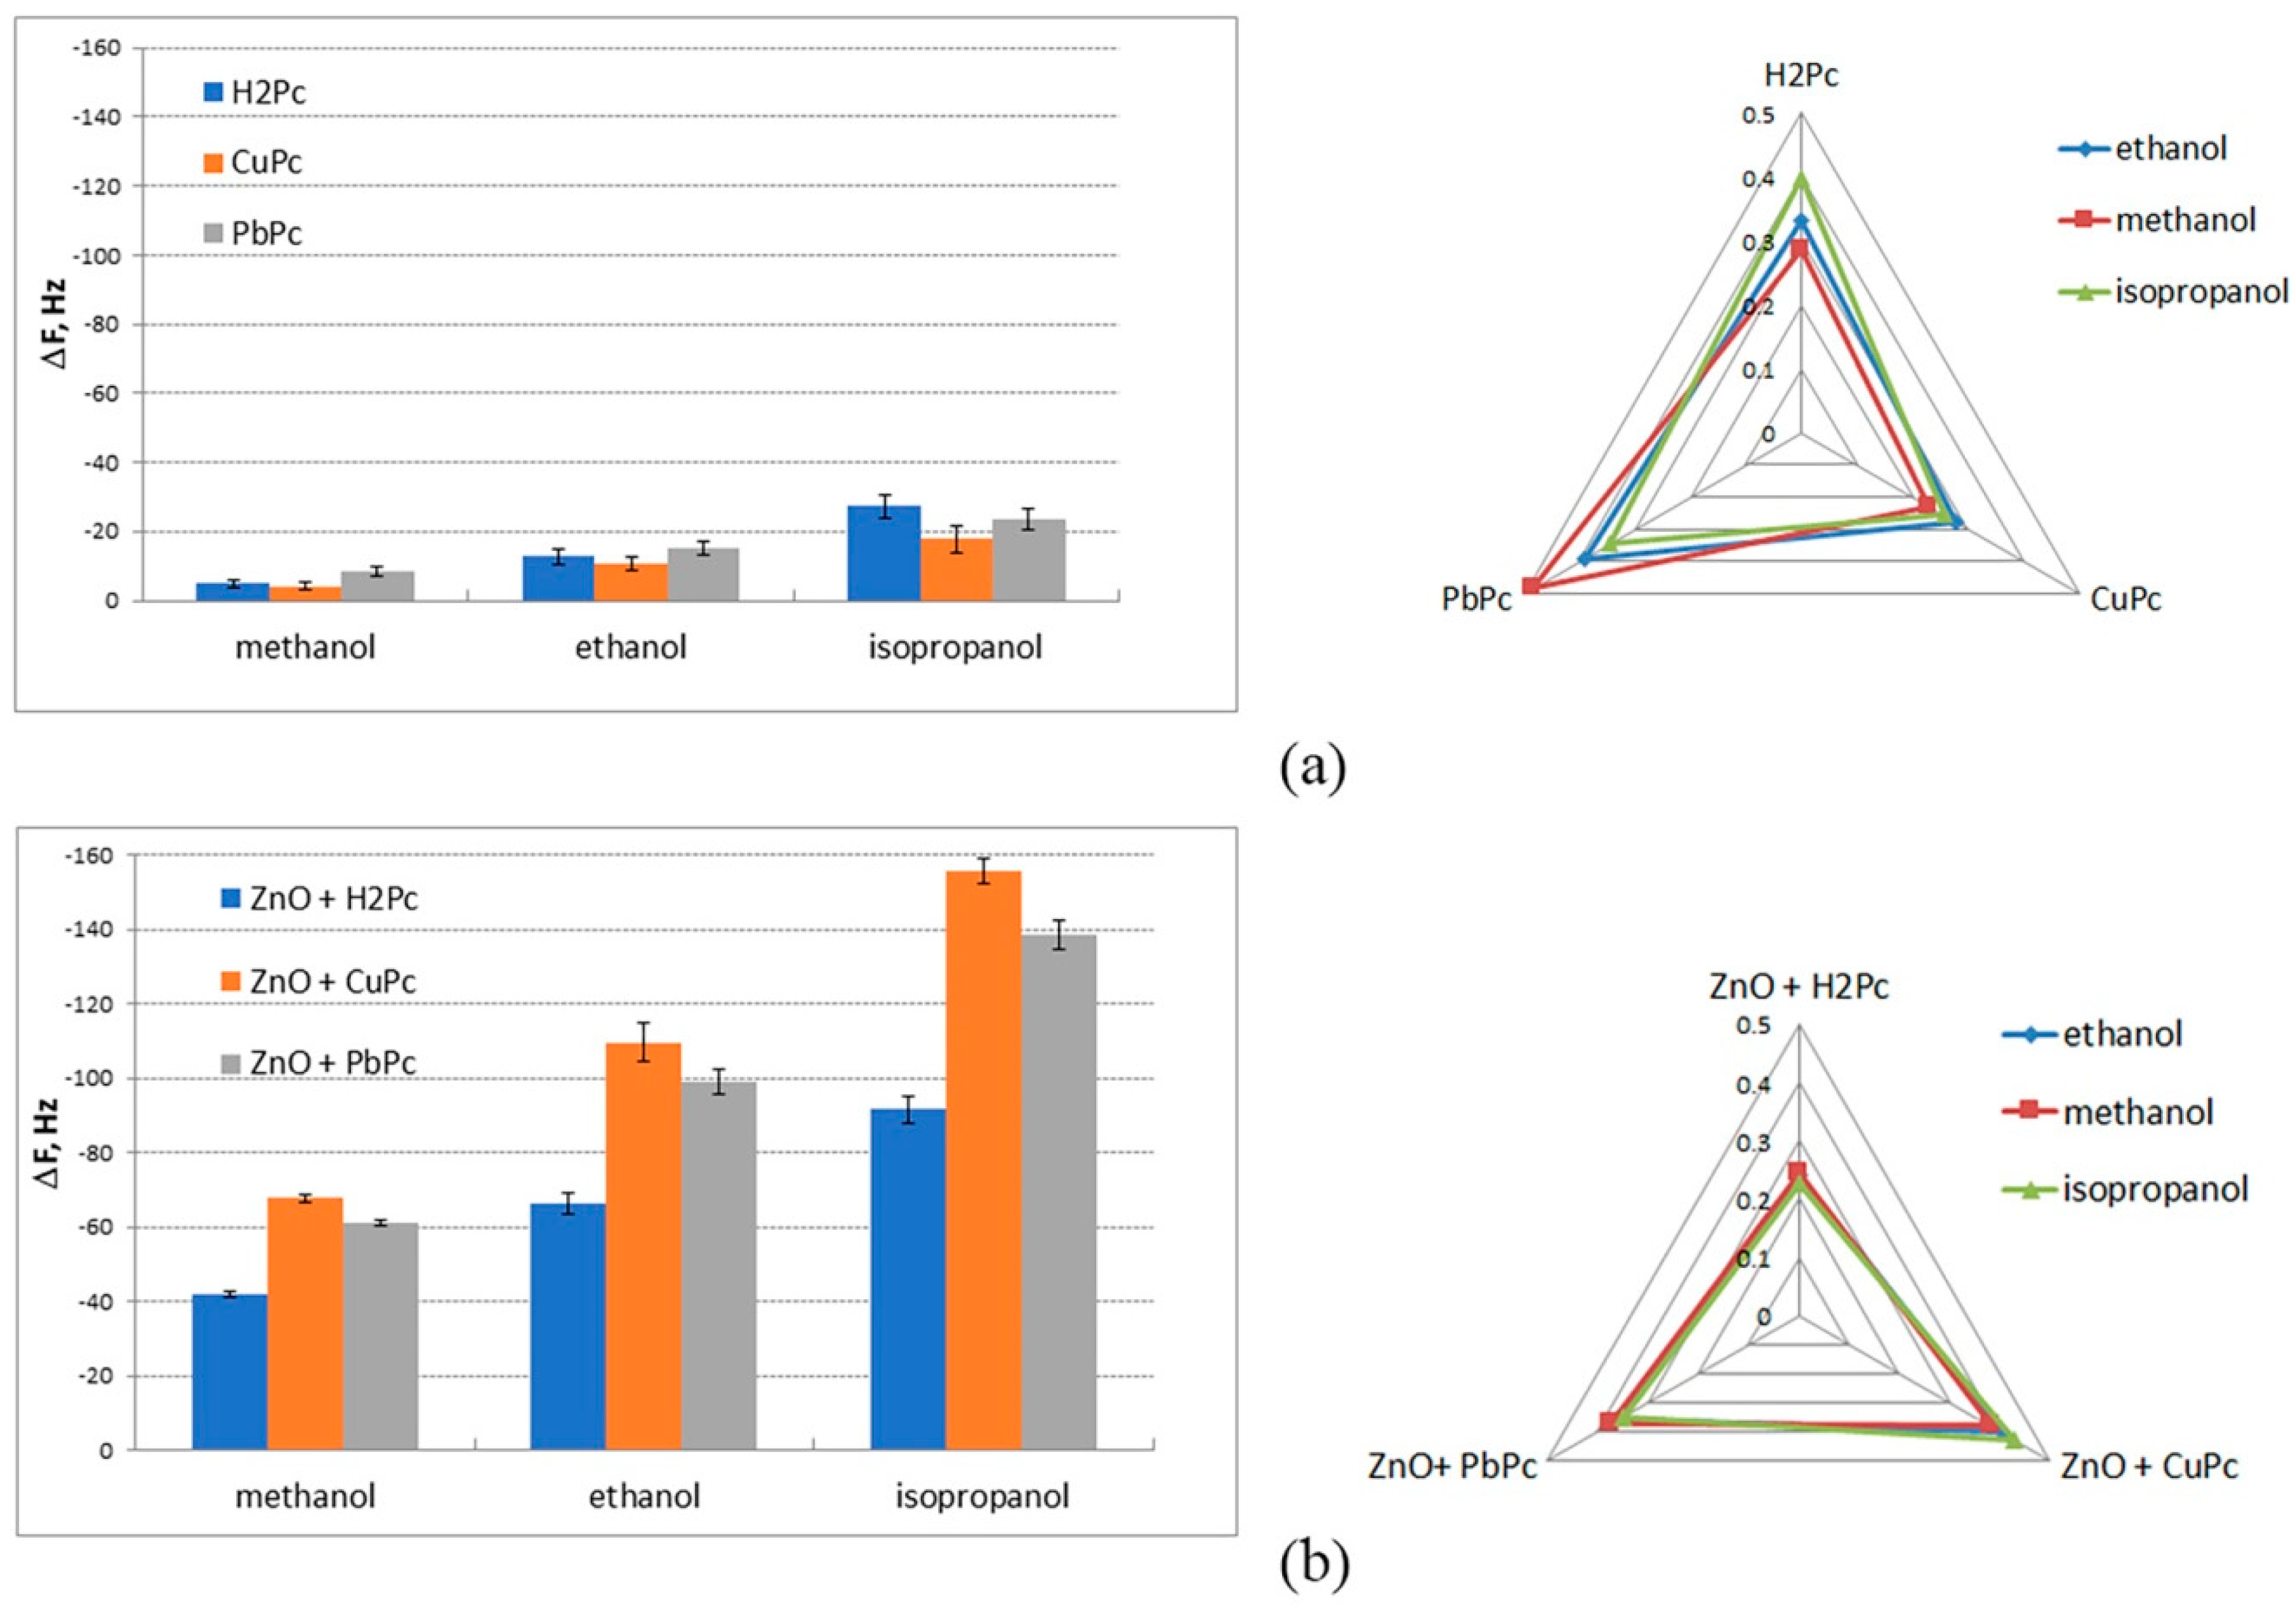
The main reasons for a failed classification in this case are obvious if we analyze the data presented on
Figure 2a. On the left, the response amplitudes are presented while on the right, there are chemical images of the alcohols built as the normalized responses of the three sensors (
Fnorm). Although the CIs look quite different and it seems that the classification should be good, low responses values and an insufficient reproducibility (Cv is 25–54%) played their decisive role in the failed classification.
The situation is totally different when the hybrid ZnO-Pc nanostructured layers are used. As it is seen from
Figure 2b, the response amplitudes increased by 5–10 times. The Cv decreased by 2.5–9.2%. This has allowed us to classify the alcohols despite the somewhat increased similarity of the chemical images.
Another noteworthy result is the change inthe sensors’ functionality compared to the pure Pc films. Indeed, three-sensor arrays based on Pc and ZnO-Pc films form different response patterns for the same analytes. This means that a combination of Pc with ZnO nanostructures results not only in the increase in the sensitivity and reproducibility, but gives us new sensors with different adsorption properties.
The results of the classification of three alcohols by the array based on the ZnO-H
2Pc, ZnO-CuPc, and ZnO-PbPc sensors are presented on
Figure 3.
Figure 3a shows the classification without illumination, and
Figure 3b,c shows the classification of the results obtained from the sensors illuminated by 472 nm and 615 nm LEDs, respectively.
The data obtained from the array of ZnO-Pc sensors are classified adequately (SW value is 0.77), but the classification of the data obtained during the illumination is much better. Indeed, as can be seen from
Figure 3b,c, the clusters are spaced at greater distances, and the objects within each cluster are more compactly located. The best classification is for illumination in the 472 nm region. The SW value for this case is 0.91.
The improvement in the classification efficiency in the conditions of illumination is explained by a further increase in the reproducibility of the data and by a change in the adsorption properties caused by light absorption.
The change in the adsorption properties is summarized in
Figure 4. Here, you can see the chemical images of the three alcohols built on the basis of the whole experimental data set: the responses of the three sensors operating without illumination and the same sensors under illumination by blue and orange light. It is seen from the diagram that not only do the responses magnitude themselves, but the response patterns are different. So, the selectivity profile of hybrid materials changes under illumination. Therefore, virtual sensors may be used as independent elements of multisensor arrays. In such a way, the obtained array is a basis for the further optimization and for finding the best set of sensors for a definite task. The difference with classic approaches when sensors are been selected to form an optimal array is that you do not have to replace sensors in the experimental setup but just select the best illumination program. This opens the way for the development of tunable miniaturized EN systems with a much wider application area.
4. Conclusions
The proper selection of sensing materials considering their photosensitive properties opens wide perspectives for the development of compact and versatile electronic nose systems with the possibility of their tuning for different tasks using illumination. Combining organic and inorganic nanostructured materials allow for increasing the performance of individual sensors that gives an additional contribution in the classification performance.
Author Contributions
Conceptualization, B.S., P.S. and J.B.; methodology, S.C., I.K. and M.E.; formal analysis and validation, J.B.; investigation, J.B. and S.C.; data curation, S.C., B.S. and J.B.; writing—original draft preparation, J.B.; writing—review and editing, B.S.; visualization, J.B.; supervision, B.S. and P.S.; project administration, S.C. All authors have read and agreed to the published version of the manuscript.
Funding
This research received no external funding.
Institutional Review Board Statement
Not applicable.
Informed Consent Statement
Not applicable.
Data Availability Statement
Data are available on request.
Conflicts of Interest
The authors declare no conflict of interest.
References
- Burlachenko, J.; Kruglenko, I.; Manoylov, E.; Kravchenko, S.; Krishchenko, I.; Snopok, B. Virtual sensors for electronic nose devices. In Proceedings of the 18th International Symposium on olfaction and Electronic Nose, Fukuoka, Japan, 26–29 May 2019; pp. 77–79. [Google Scholar]
- Epifani, M.; Arbiol, J.; Diaz, R.; Peralvarez, M.J.; Siciliano, P.; Morante, J.R. Synthesis of SnO2 and ZnO Colloidal Nanocrystalsfrom the Decomposition of Tin(II) 2-Ethylhexanoate and Zinc(II)2-Ethylhexanoate. Chem. Mater. 2005, 17, 6468–6472. [Google Scholar] [CrossRef]
- Burlachenko, J.; Epifani, M.; Capone, S.; Snopok, B.; Siciliano, P. Heats of Sequential Interactions of Hydrogen, Oxygen, Helium and Argon with Gold and Platinum Powders. In Proceedings of the Symposium on Surface Heterogeneity Effects in Adsorption and Catalysis on Solids (ISSHAC 7), Kazimierz Dolny, Poland, 5–10 July 2009. [Google Scholar]
- Burlachenko, J.; Snopok, B.A. Multisensor arrays for gas analysis based on photosensitive organic materials: An increase in the discriminating capacity under selective illumination conditions. J. Anal. Chem. 2008, 63, 610–619. [Google Scholar] [CrossRef]
- Struyf, A.; Hubert, M.; Rousseeuw, P.J. Integrating robust clus-tering techniques in S-PLUS. Comput. Stat. Data Anal. 1997, 26, 17–37. [Google Scholar] [CrossRef]
- Burlachenko, J.; Capone, S.; Snopok, B.; Siciliano, P. Performance of Machine Olfaction: Effect of Uniqueness of the Initial Data and Information Coding on the Discrimination Ability of Multisensor Arrays. IEEE Sens. J. 2010, 11, 649–659. [Google Scholar] [CrossRef]
| Publisher’s Note: MDPI stays neutral with regard to jurisdictional claims in published maps and institutional affiliations. |
© 2022 by the authors. Licensee MDPI, Basel, Switzerland. This article is an open access article distributed under the terms and conditions of the Creative Commons Attribution (CC BY) license (https://creativecommons.org/licenses/by/4.0/).


 ,
, 


