1. Introduction
Various industries, such as aerospace and automotive, require the use of materials with high mechanical tolerance and lightweight properties. These improvements will bring about less fuel and energy consumption, leading to a significant reduction in fabrication costs [
1,
2].
Composites are used in the aerospace industry, often in the construction of aircraft fuselages, aircraft brake linings, helicopter blades, and aircraft radar coverage [
3,
4]. Pieces under high-temperature and high-speed operating conditions are vital parts, which are backed up by friction. Friction is used in various systems, where speed control is critical. Planes are subjected to high kinetic energy when they land, which imposes high heat on the brake components due to the friction associated with the short landing time. At these high temperatures, friction is correlated with material failure risks; therefore, friction tolerant materials are required [
5]. Operation under high-temperature conditions leads to a number of problems, such as failure of the welding pieces under operation; hence, one of the solutions is to make use of composite materials [
6]. Thus, wear resistance is one of the most important properties of composites. Moreover, the components under operation must be well matched and paired with other system members and have as little thermal expansion as possible [
7].
Proper choice of the matrix material in MMC requires thermal and mechanical properties, and corrosion resistance. The hard particulates, usually ceramic, such as SiC, Silica, or mullite, are used to impart better wear resistance, thermal stability, and predictable isotropic mechanical, frictional properties in the MMC [
5]. Additives, such as graphite, MoS
2, and boron nitride, reveal stability under consistent friction, and anti-seizure and damping properties [
8,
9].
In this study, we try to develop the wear resistance of Fe/SiC composites at high speeds and loading conditions. For these conditions, carbon/carbon (C/C) composite brakes have been studied widely in the aerospace industry and race car applications because of their low density, with excellent wear resistance, friction stability, and high thermal conductivity. However, the high production cost of the C/C, associated with several undesirable factors such as: expensive raw materials, multiple re-infiltration steps, low deposition efficiency and propitiatory antioxidant treatments, poor oxidation resistance and a complex with evolving long cycle process, poor control over porosity, especially surface porosity, extreme sensitivity to humidity and temperature causing friction instability, and pollution caused by organic brake dust—makes C/C composite less attractive for wide range of applications [
10]. Other brake materials such as C/SiC composites of similar characteristics require high-cost polymer infiltration and pyrolysis propitiatory processes for manufacturing [
11,
12,
13]. The high-cost fact makes these composites suitable for niche markets such as high-capacity civilian transport aircraft and supersonic jet fighters with braking energy of more than 30 mJ.
In this study, we compare the performance of the Fe matrix composites reinforced with SiC particle as a hardener, Cu particles as a damping agent, and C and BaSO4 as self-lubricant content.
Many studies have been conducted in this direction to produce composites with better wear tolerance. Many composite fabrication methods have been developed with two types of particles, some of which have failed to solve the problem. For example, the wettability of ceramic particulates due to the melt is considered one of the major problems, which has been widely studied in recent years [
14,
15]. Factors affecting the properties of composites include the amount, size, shape, and phase-type distribution of reinforcements; the mechanical properties of the matrix; and the nature of the matrix–phase interface [
16]. There are a variety of particle-reinforced MMC fabrication techniques, classified into two general groups: liquid-state fabrication and solid-state fabrication [
17]. The physico-mechanical properties of pieces include hardness, volumetric shrinkage percentage, density, open porosity percentage, and wear resistance in suitable powder metallurgy methods [
18]. Powder metallurgy is commonly used to fabricate MMCs, whose matrix is filled with particles and discontinuous fibers and whiskers. The powder metallurgy method is widely used for several reasons, such as high fabrication rate, homogeneous microstructure fabrication, reduced number of secondary steps, and working range for the fabrication of large alloy composites. Hence, this method is suitable for obtaining the desired properties with the desired density.
The brake parts of vehicles work under harsh conditions [
19,
20], and few studies have been conducted on low-cost composites for use as brake pads. Asif et al. [
21,
22] addressed the optimal chemical composition in brake linings using powder metallurgy. The purpose of the research is to reduce the friction of the brake linings. In the same study, they also investigated the mechanical properties of steel for heavy industry use using powder metallurgy in three experimental categories with different percentages. Metallographic studies have shown that additives such as SiC and Cu increase strength. Furthermore, the ultimate tensile strength, tensile properties, and yield strength increase with increasing amounts of C, SiC, and Cu [
23].
Prabhu et al. [
19] measured the effect of SiC particle size on the Fe-SiC-C composite under high velocity operating conditions. In this research, three types of particles of 10, 15, and 20% and with velocities of 25 to 35 m/s were used. They also used a small-scale braking system. The results showed that composites with larger particles and greater coating volume were effective at low speeds and reduced the adverse reactions of SiC bumping. The following results were obtained after microstructural studies on the sample: The uniform distribution of silica and graphite particles was very good, and the performance of the braking system was improved. In another study, Prabhu et al. [
19] investigated the effect of particle size and volume on the wear behavior of an iron-based composite at high-velocity conditions. In this research, the Fe composite was reinforced with SiO
2 particles in different types and modules of elasticity. Examination of braking performance at high speeds for these composites revealed that the braking performance of the composite with a higher elastic module was better. Moreover, two types of composites with different particle sizes were made. Abrasion test results showed that larger particles have better wear resistance. Baradeswaran et al.’s [
18] study of the mechanical properties of Al/Al
2O
3/C composites performed hardness, compression, tension, bending, and wear experiments, and found that with increasing Al
2O
3, the hardness increases and Al
2O
3 increases the yield strength.
Heydaripour et al. [
24] investigated designed composites for a brake pad application to be used on a train locomotive. They produced four composite samples for testing and installed them on the locomotive. By inventing a new design that created grooves on the composite surface, they achieved the best chemical composition of iron and copper composites and advantages such as: higher coefficient of friction, lower weight loss, less noise and wear, and no environmental pollution was obtained in terms of the desired results of this design, and they replaced the previous models, which were cast iron.
According to the studies, to achieve the properties of composites as brake pads, it is necessary to use several reinforcements with different properties. It can be said that the addition of carbide particles increases the hardness, copper particles act as a rapid heat transfer during wear and friction, and graphite particles act as a self-lubricant. Since several components with different properties are used, the presence of an interface layer is necessary to prevent the reaction between the components, so the presence of barium sulfate is required. However, research in this area is necessary to optimize the particles’ content.
The present study aims to design, fabricate, and investigate the optimal state of the wear-resistant part in the mechanical properties of the product. The goal is to achieve the best performance of SiC to increase wear resistance using wear tests and mechanical properties. Moreover, the use of a composite is expected to lighten the product and enhance the wear properties of the product by conducting laboratory research on the best performance of the wear-resistant part (SiC).
In this research, in addition to the study of the COF, the wear rate is important as a controller for the lifetime of the parts. Regarding weight loss, the probability of incorrect output information in the test is far less than the COF, a better criterion for the result of wear resistance. Moreover, weight loss over the entire distance determines whether the piece is worn under high-temperature and speed conditions. Important results were obtained by referring to and investigating the coefficients of friction. For example, a sample with a natural lubrication effect has a lower COF and less wear, and, consequently, less weight loss. In general, one sample with more weight loss has less wear resistance compared to other samples.
3. Results and Discussion
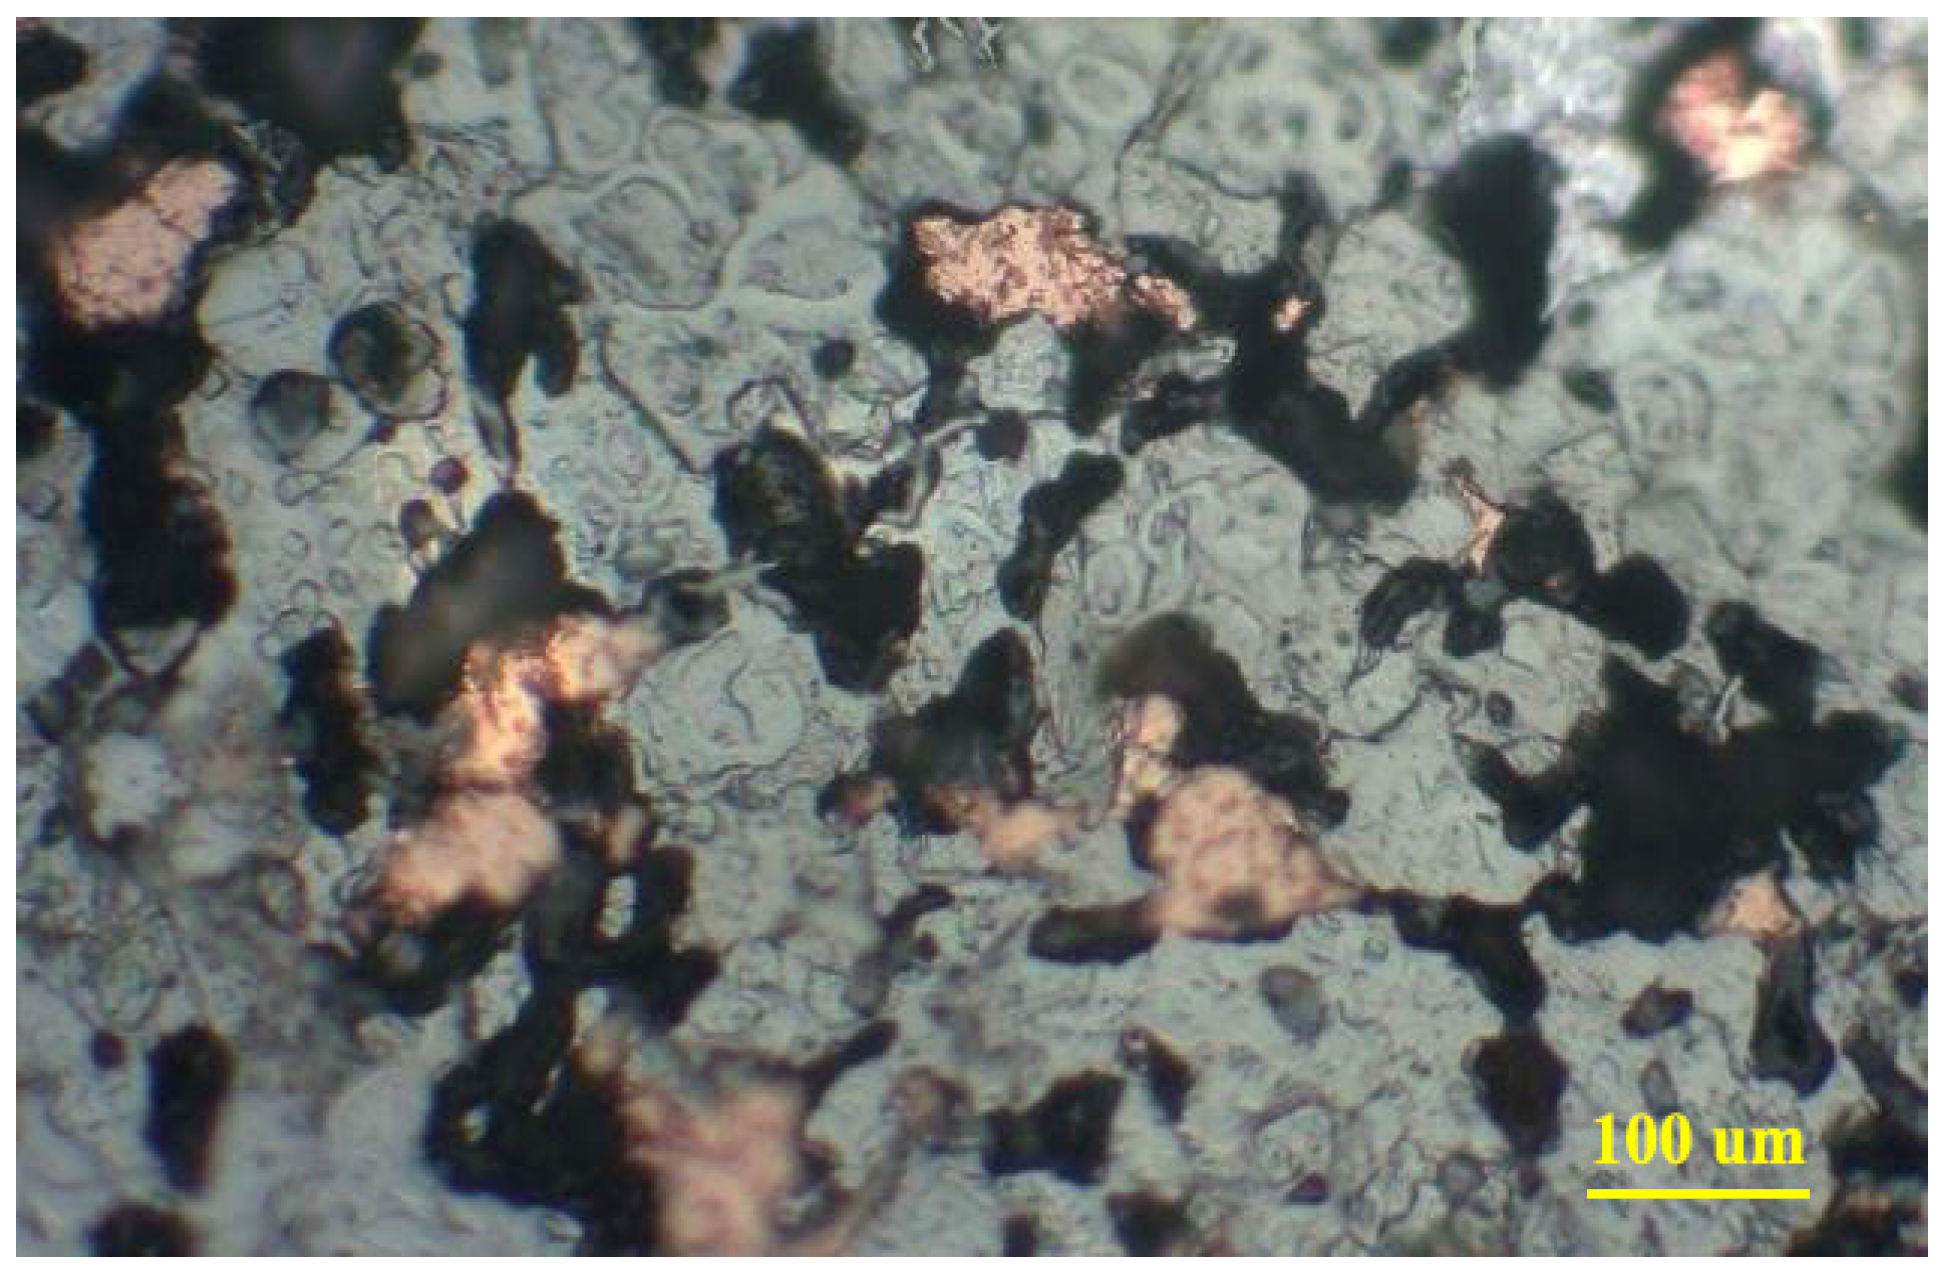
Figure 2 shows the sample 1 microstructure, which shows one of the constituent phases, Cu, was identified (Cu was identified as light golden). According to the resulting images, the black areas, seen as dark, are the graphite phase, and finally, the gray areas, with the highest volume fraction of the matrix, are Fe. According to the resulting images and the etching solution used, apparently, no other phases are available. Finally, the SiC phase was identified as white areas.
Figure 3 shows the sample 1, 3, 5, and 6 microstructures. Based on the figures, it can be observed that all sample microstructures are compact without cracks and cavities. However, due to the nature of the samples, the distinction of phases is not significant, As demonstrated in the EDS map, analyses of sample 6 are shown in
Figure 4.
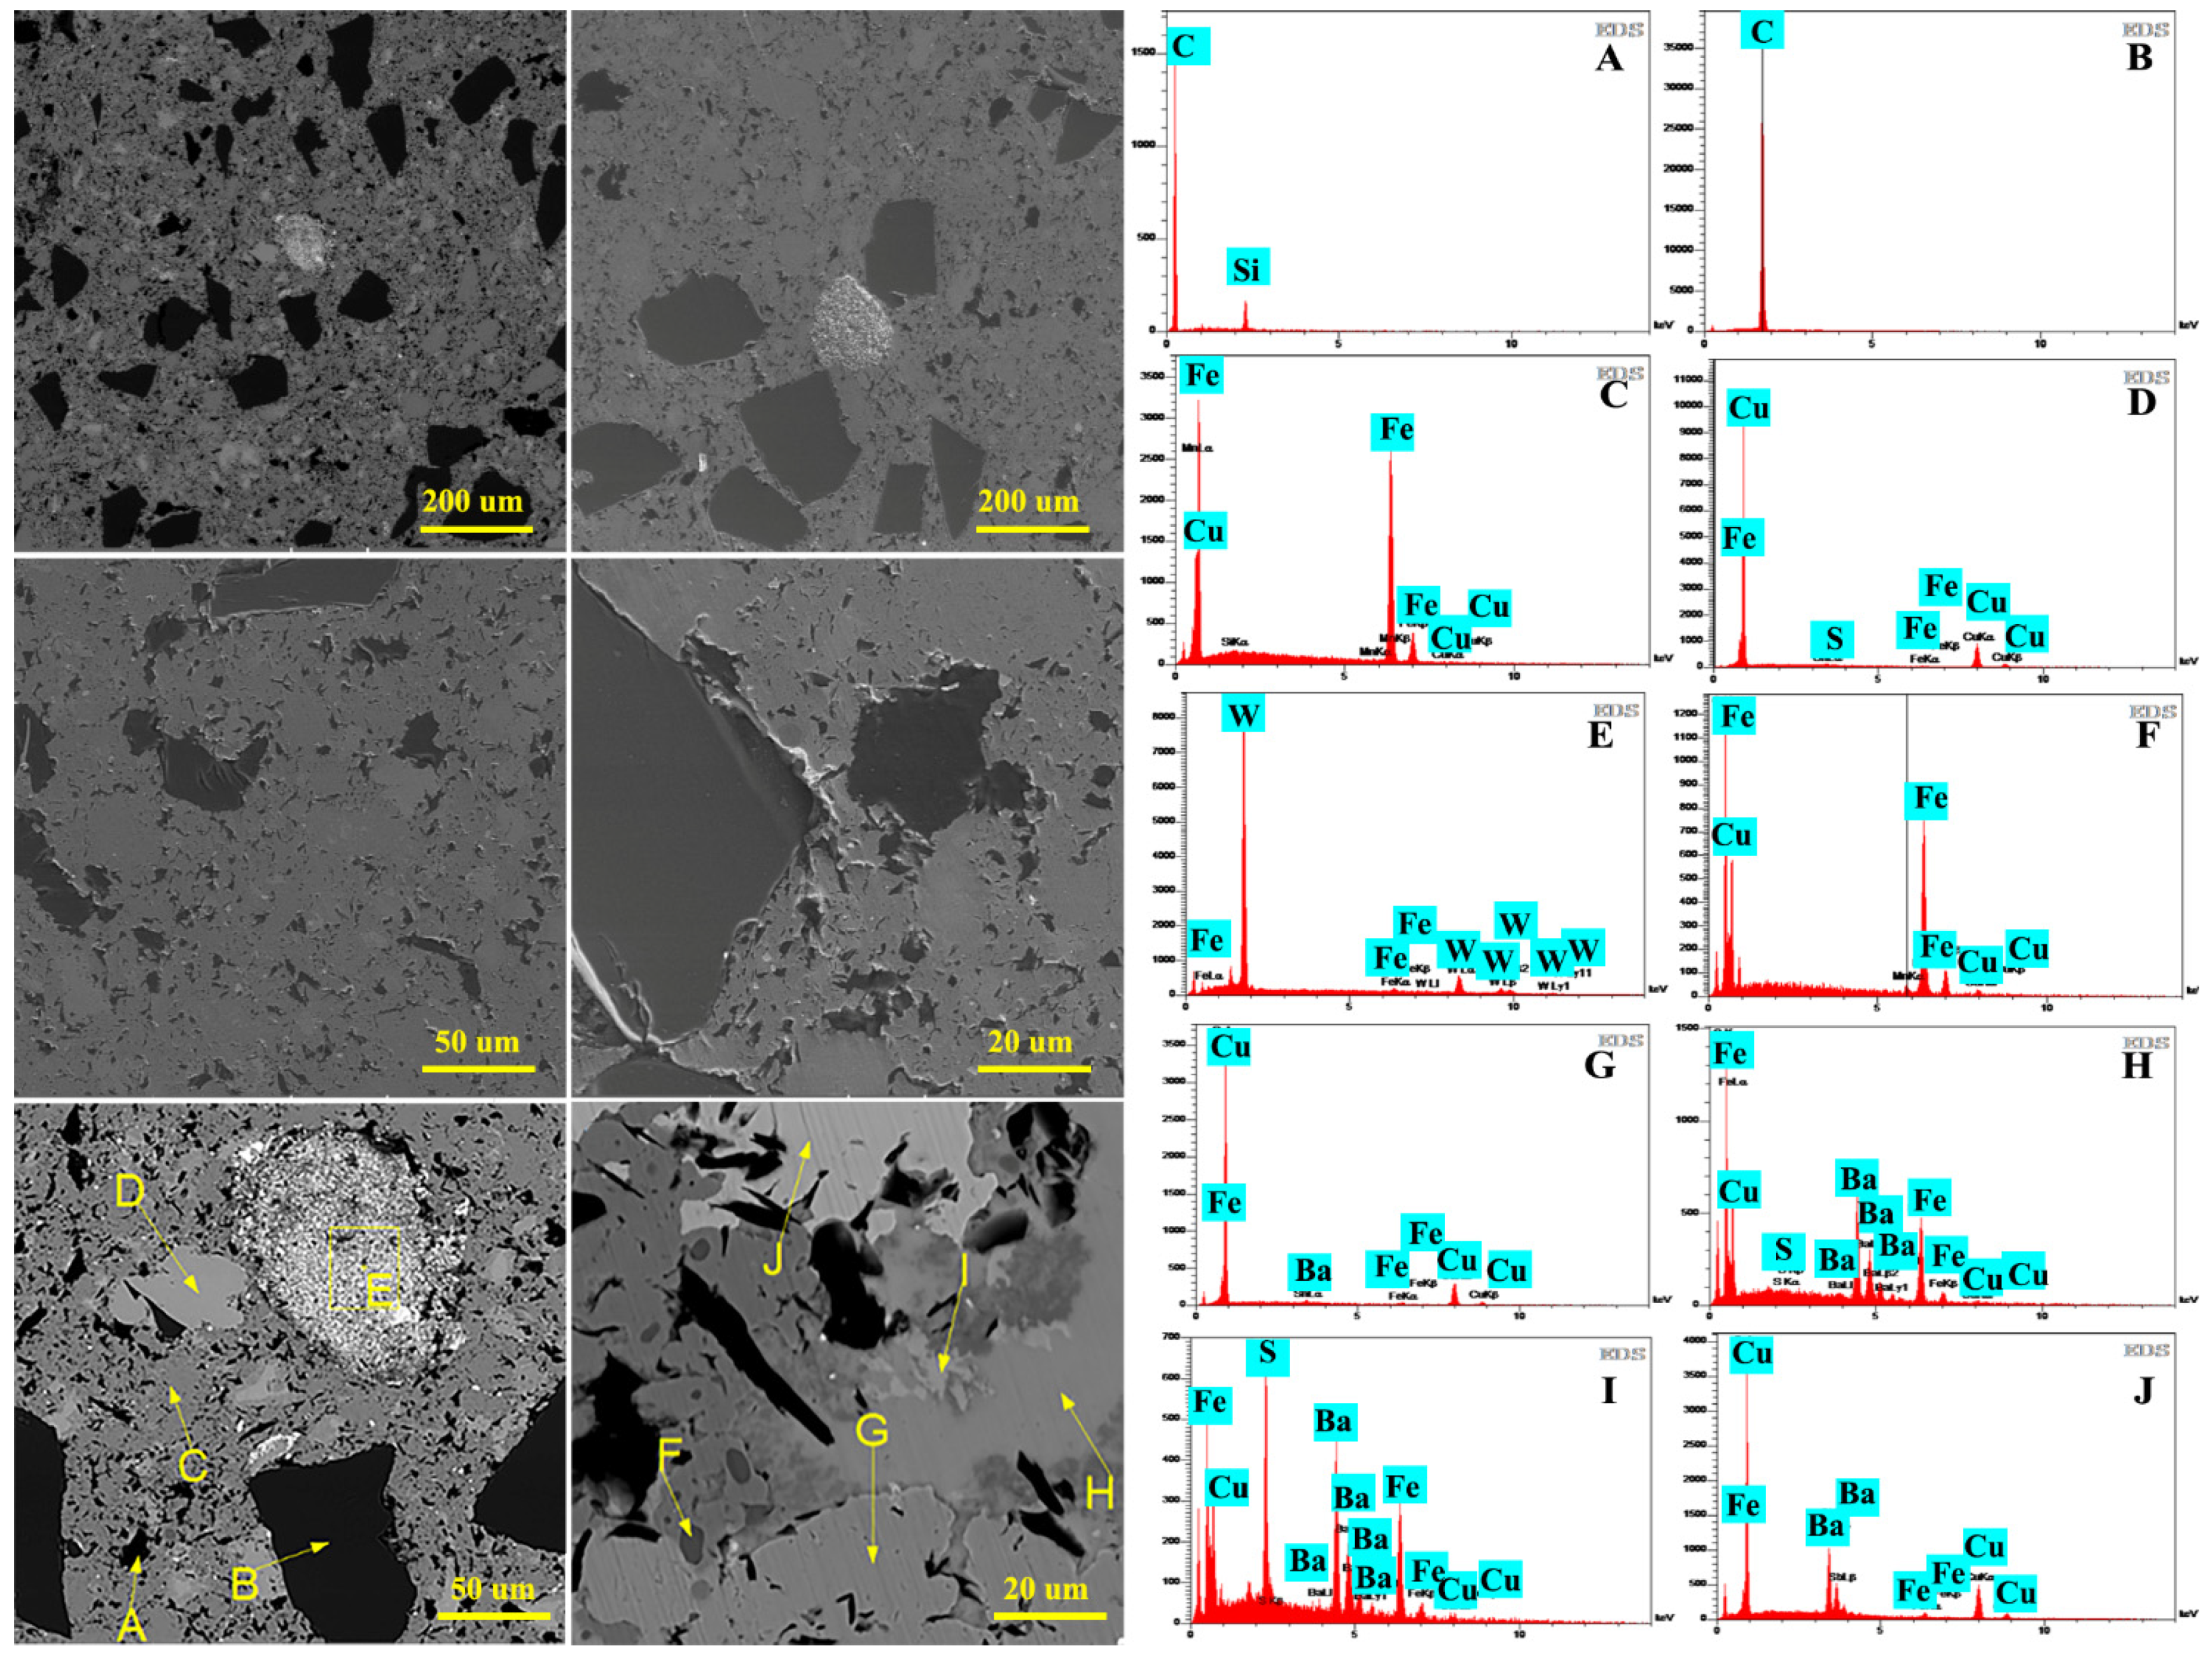
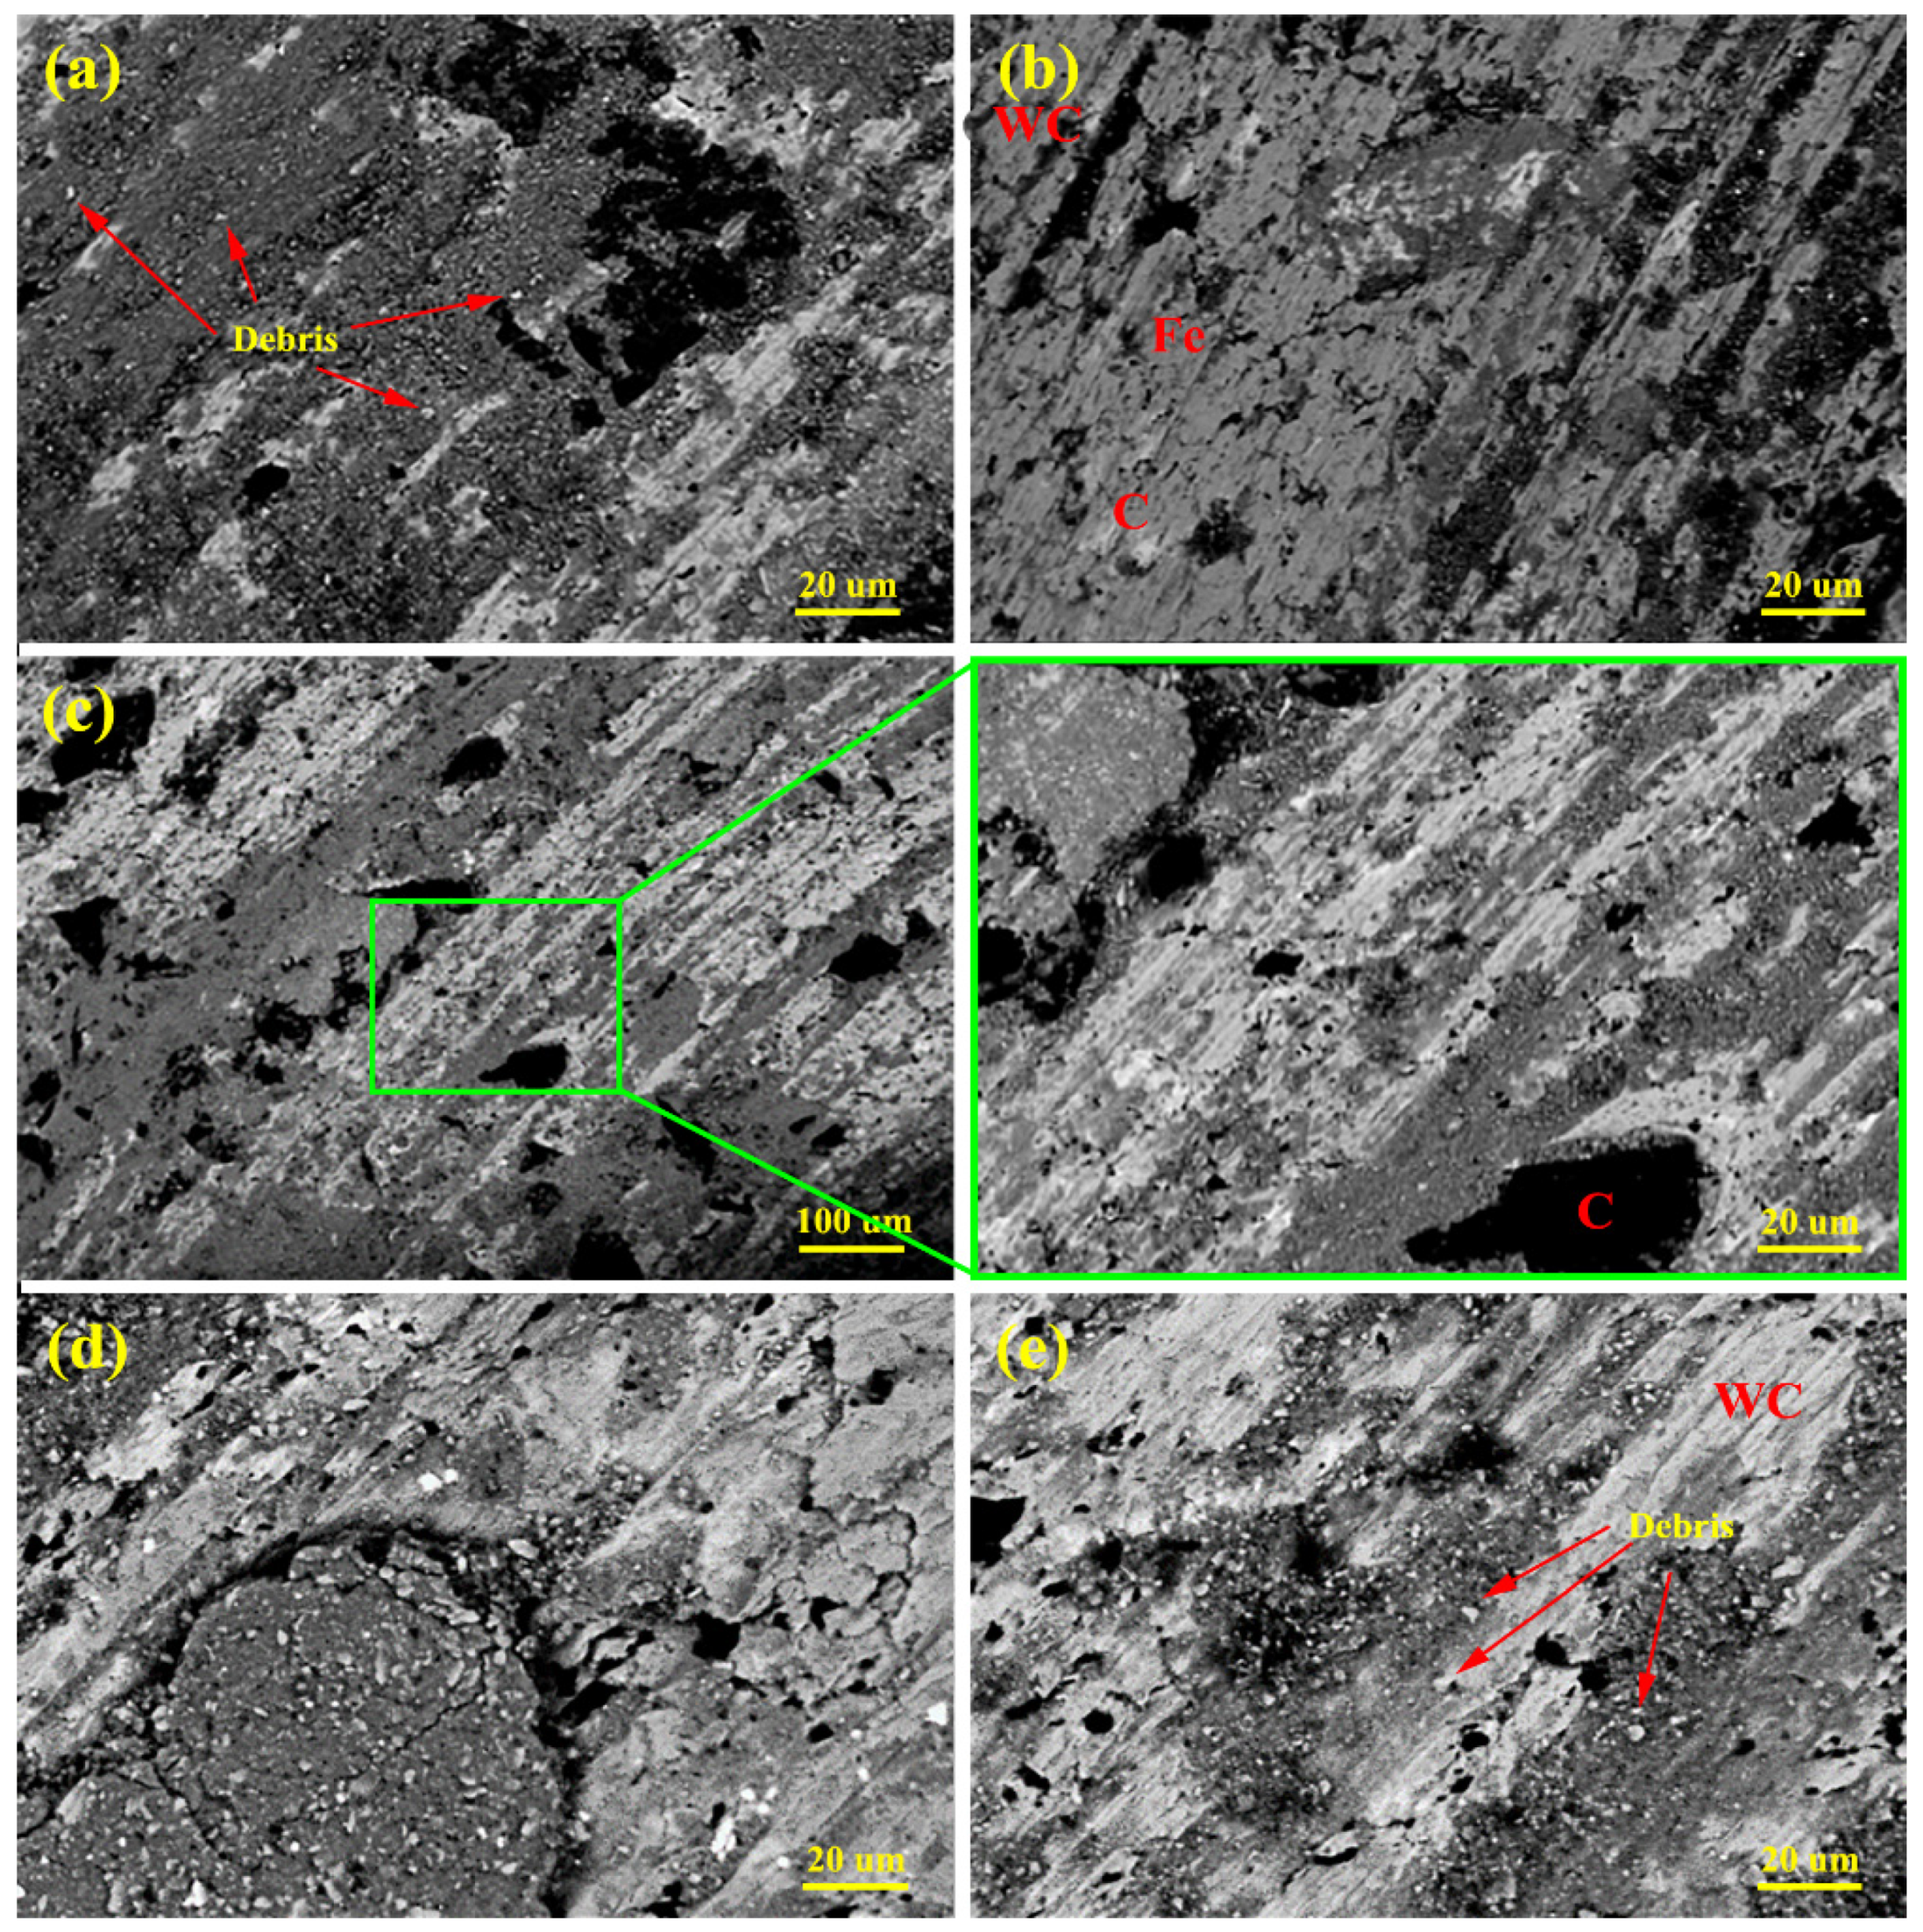
Figure 4 demonstrates the designated points for pointwise EDS point and planar analyses of sample 6. Quantitative results at Point A indicate that the highest weight percent is for graphite (dark black). The second peak, which is weaker, is sulfur. In the figure, the large black dots (Point B) correspond to SiC particles. Furthermore, at the EDS point, it is observed that silicon and carbon form the highest weight percent (65% and 34%, respectively). The analysis of this point shows that the simultaneous presence of Si and C at this point is the same combination of SiC in the raw material with 6% by volume, which accounts for the total weight percent at this point. Thus, this is the same as SiC. Point C represents the Fe matrix, the element with the highest abundance in the composite. Very small amounts of oxygen and manganese (Mn) are observed at this point (the average volume percentage of Fe is 70%, i.e., the highest percentage, and the presence of Mn can probably be attributed to impurities in the raw materials). Point D analysis shows Cu with about 96%. At Point E, tungsten (W) is seen with the highest weight percent (i.e., 91.63%). It can be observed that this element has agglomerated at this particular point. It is concluded that the distribution is not uniform at this point. The tendency to aggregation is increased by the adsorption of particles to each other at this point, probably due to fine tungsten particles and the specific surface area above them. The presence of 7.62% carbon at this point, together with tungsten, forms the composition of WC (tungsten carbide), which is present in 2% of the composite produced in sample 6. It increases the wear resistance due to the formation of carbide. At Point F, there is a mixture of elements, such as Fe (67%), Cu (about 3%), O (28%), etc., along with small amounts of Mn. Due to the percentages mainly containing Fe and O, the combination of Fe and O has formed iron oxide at this point. At Point I, BaSO
4 is present in the composite due to the presence of sulfur (S), barium (Ba), and oxygen (O). At this point, the weight percentages of each element are as follows: O: 14% (highest atomic percentage), S: 8%, Ba: 55%, Fe: 22%, with small amounts of Cu. In this study, 6% of BaSO
4 was present in all samples. The elements at point H are mainly Ba (5%), Fe (25%), and O (22%). Since the weight percent of S at this point is 0%, it cannot be claimed that BaSO
4 is present at this point. At point G, there are abundant amounts of Cu (about 94%). At point J, there are different elements with different percentages, including Cu (54%) and Sn (44%), as the most abundant constituent elements.
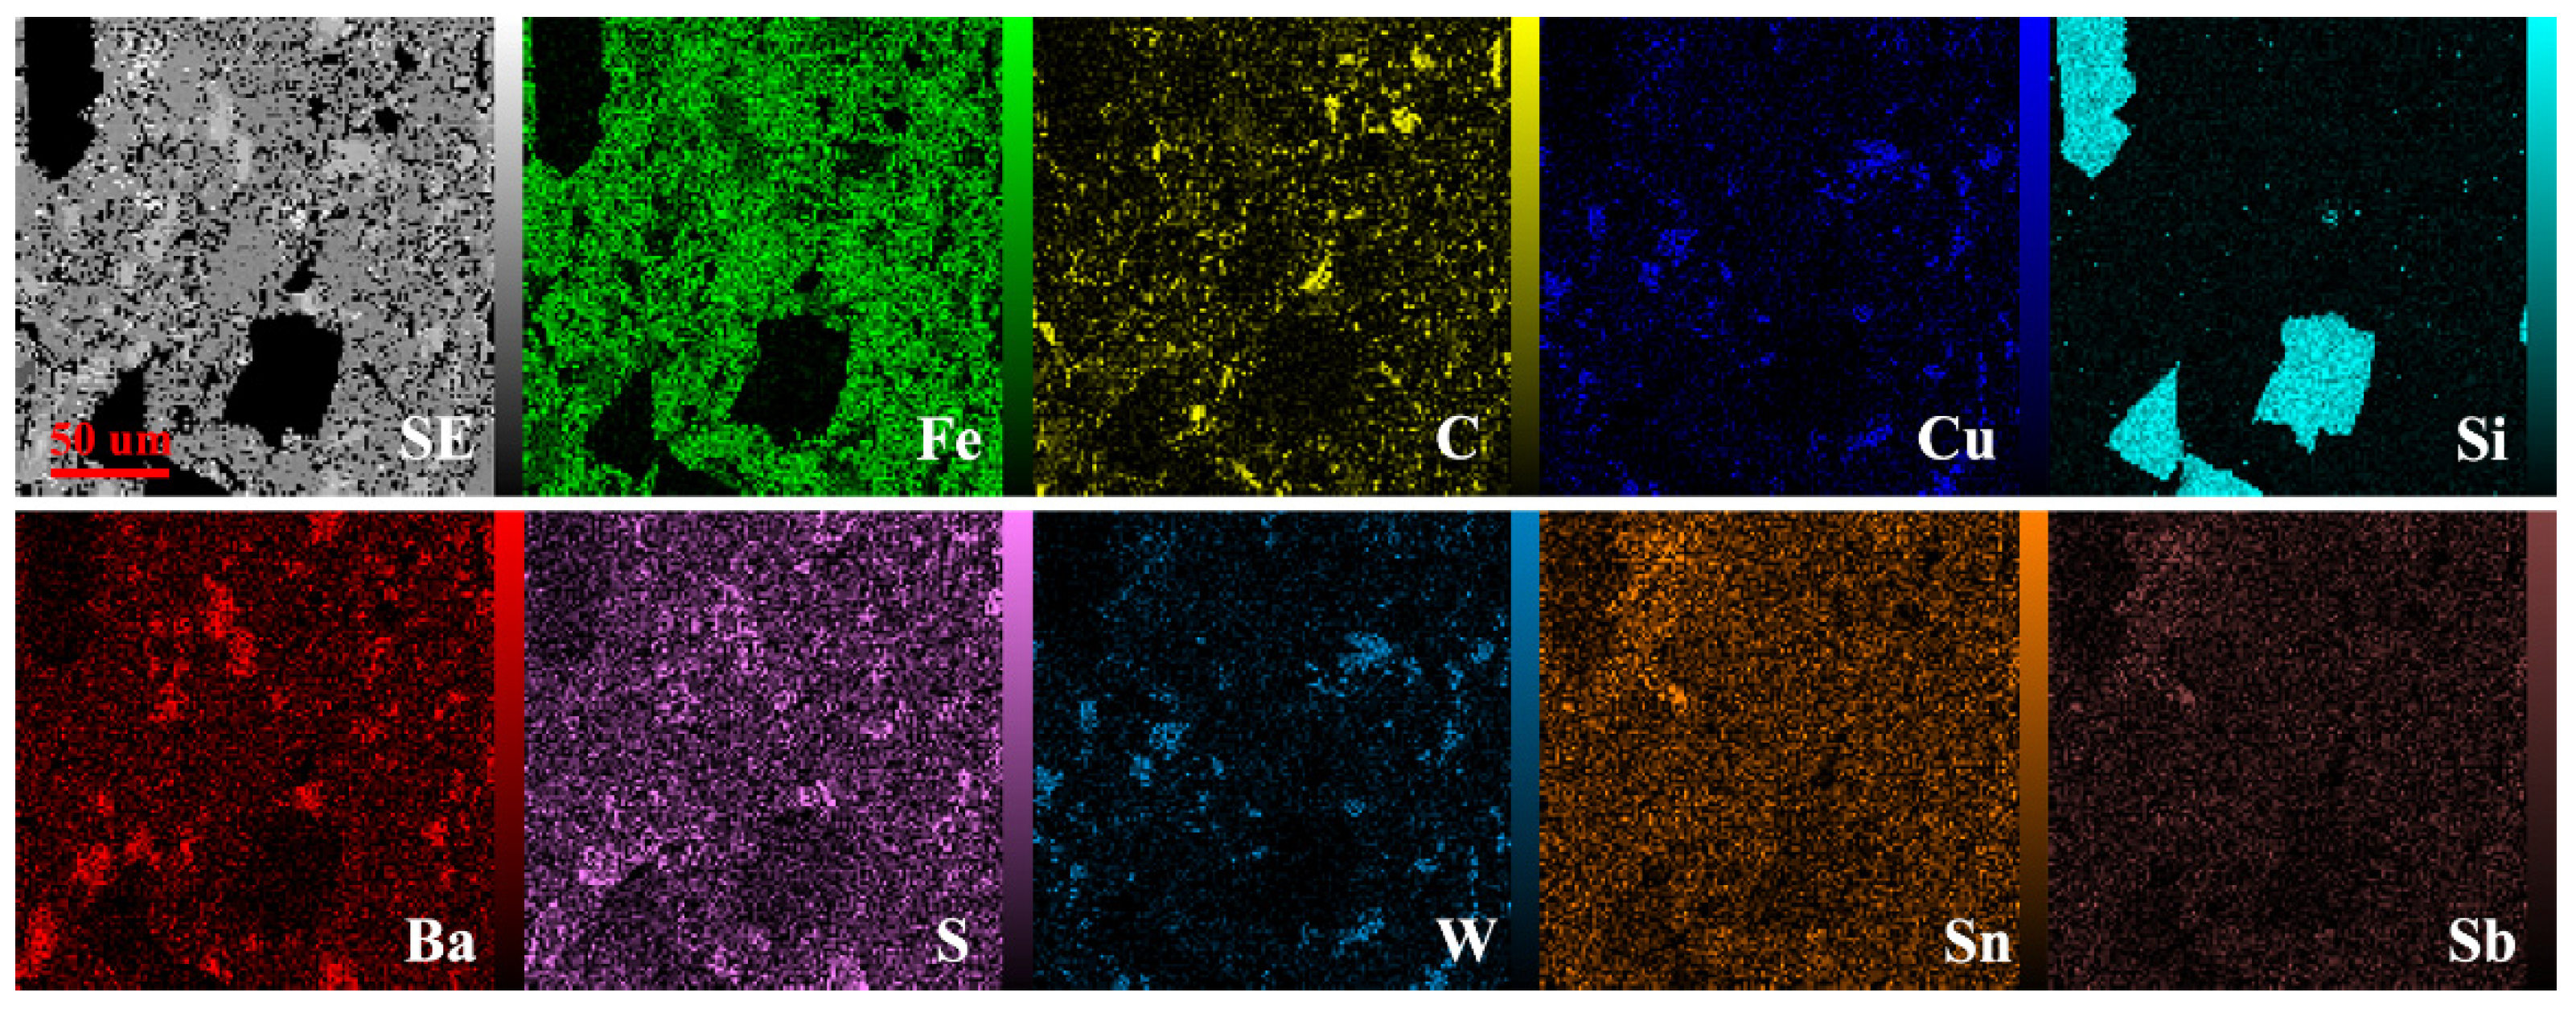
Figure 5 illustrated the elemental map analysis of sample 6. The results indicate the optimal uniform distribution of alloying elements in the Fe-based metal matrix and the uniform formation of the composite. Based on the figure, we can clearly observe W and Si distribution, which is related to the WC and SiC phases, respectively. Furthermore, surface distributions of Cu particles in the Fe matrix are clearly visible. The presence of wear debris and other additives to the Fe matrix in the composite was demonstrated.
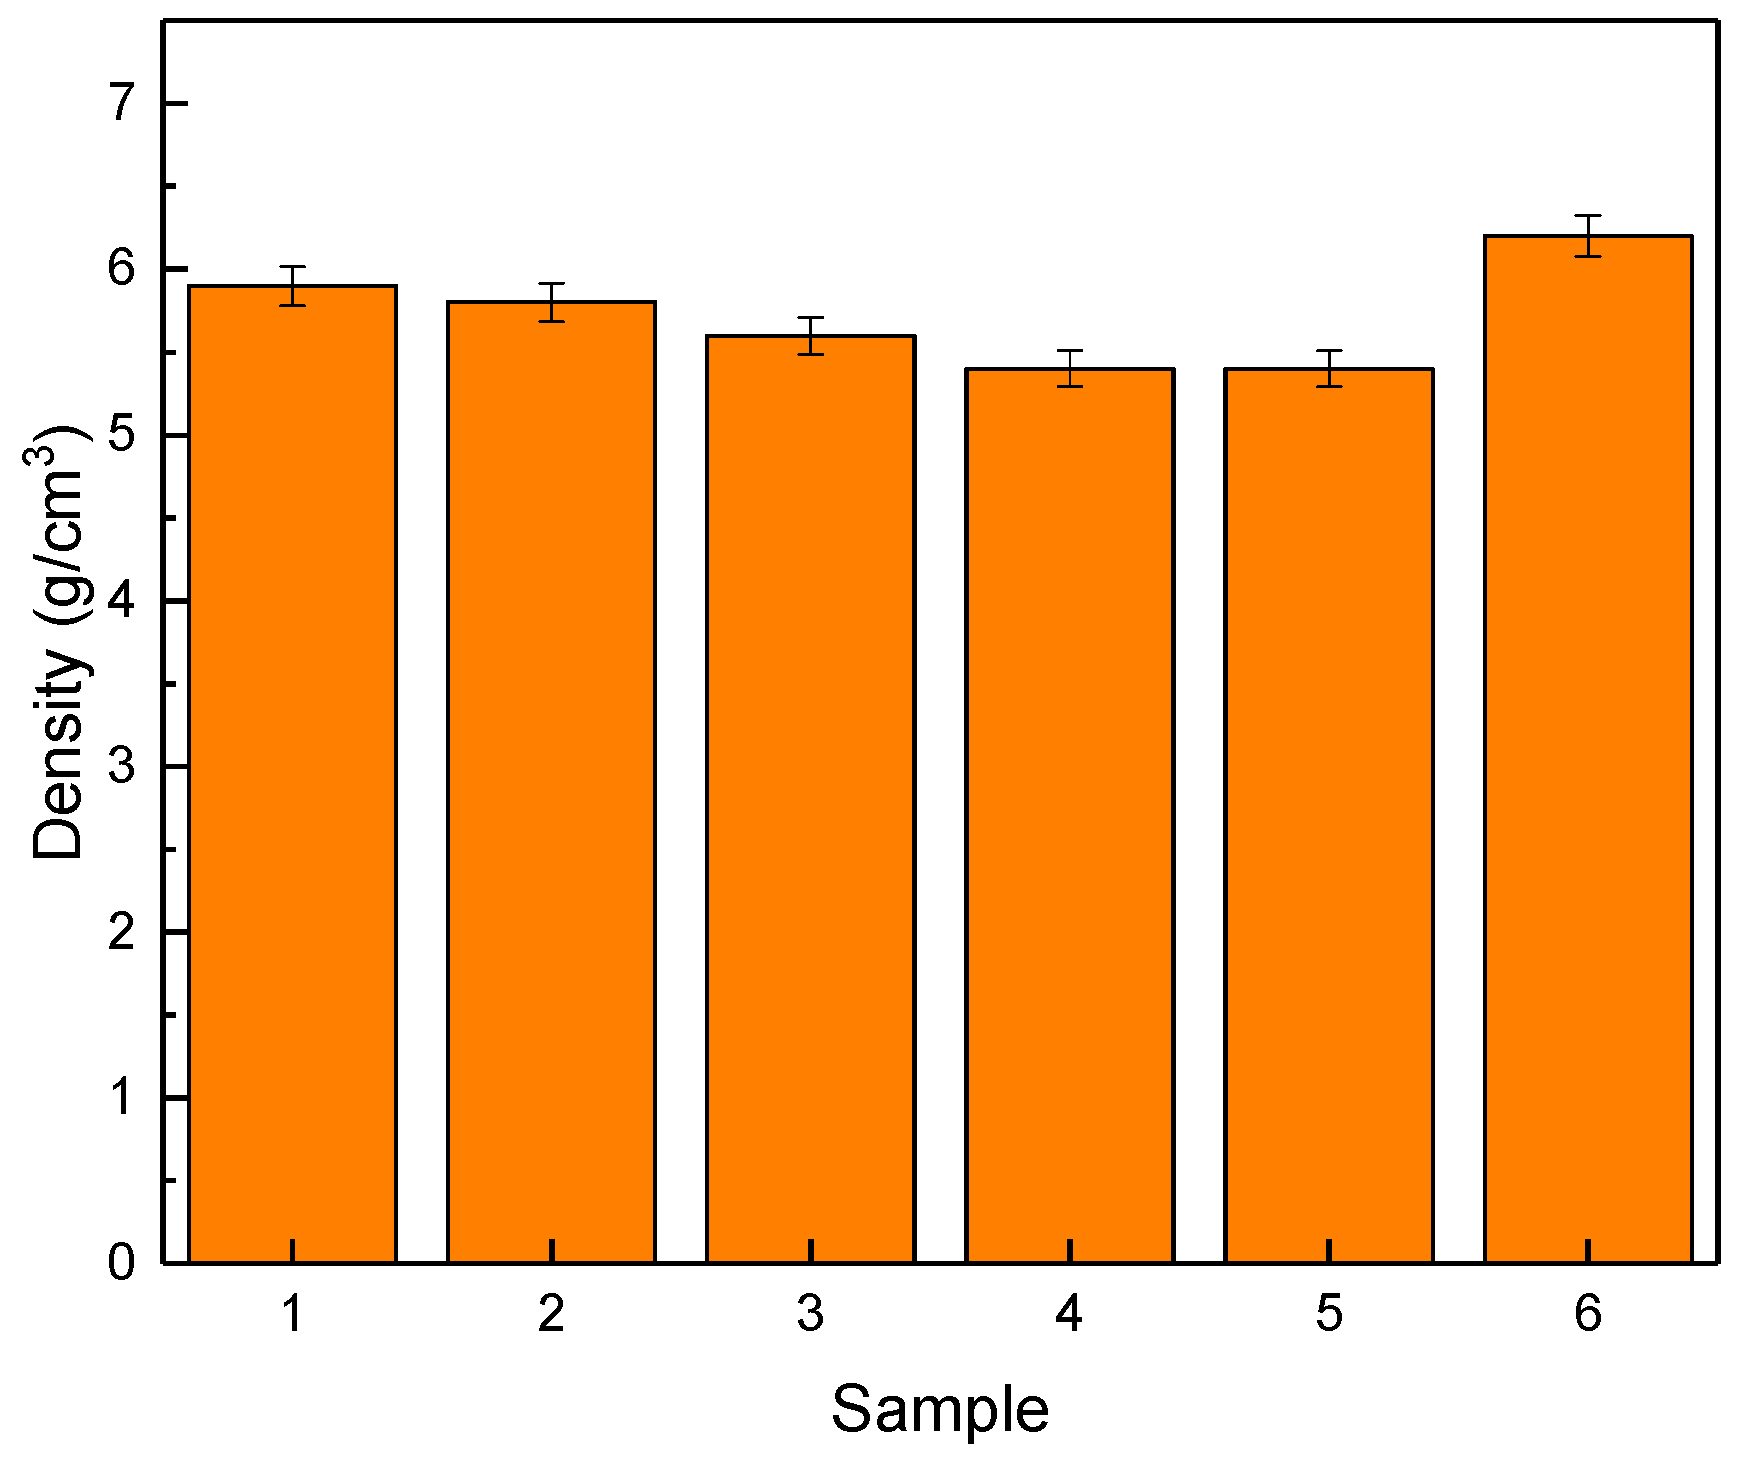
Figure 6 shows the density of the samples. As can be seen, the density of the samples with increasing SiC content decreases, which is due to their lower SiC density (3.2 g/cm
3) than other composites components (Fe/Cu and Fe/Cu/WC). Due to the large particles size, the effect of SiC particle size on the densification of the samples is negligible. Comparing sample 6 with other samples, however, shows the effect of the presence of WC particles (15.63 g/cm
3) in increasing density. On the other hand, the presence of BaSO
4 was effective in filling the space between the particles, which was not due to the effect of the irregular shape of SiC particles on porosity.
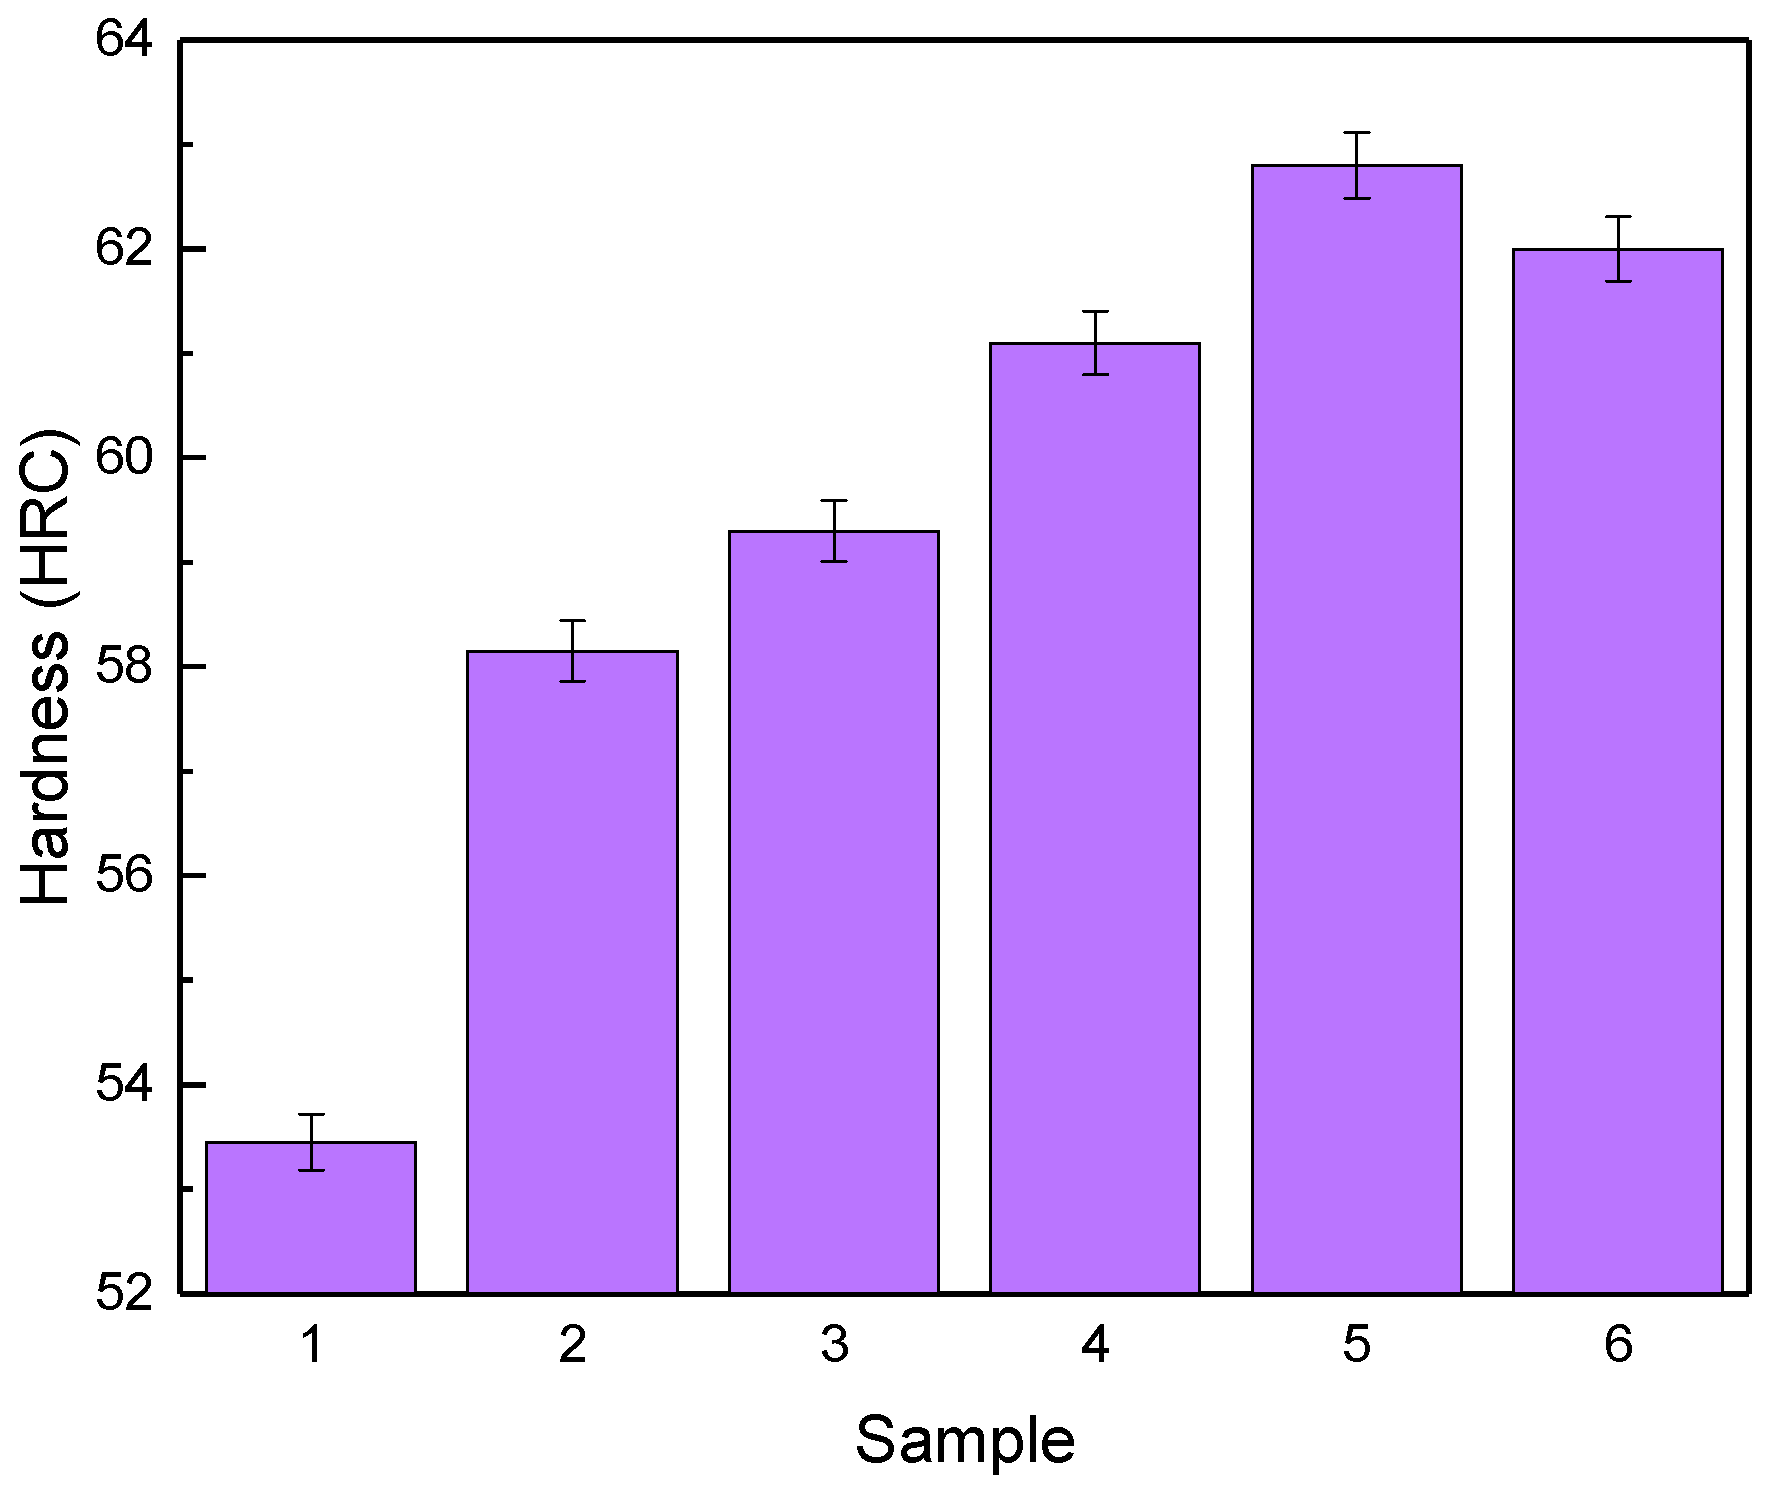
The hardness test was conducted at three different points for each sample, the results are shown in
Figure 7. SiC has higher hardness than Fe; therefore, the hardness of the samples increases due to an increase in SiC content relative to the Fe matrix. Increased hardness by increasing the percentage of SiC can be attributed to the effective load transfer from the matrix to the reinforcement. Furthermore, SiC particles act as a barrier against the movement of dislocations, which increases the composite strength. For example, sample 1, with the highest abundance of Fe, is the worst sample in terms of hardness. Sample 5, with the lowest abundance of Fe, has a relatively high hardness. In other samples (e.g., Samples 2 and 4), the hardness is altered by simultaneous changes in SiC and Fe. Hardness is increased by increasing the SiC content and at the same time decreasing Fe.
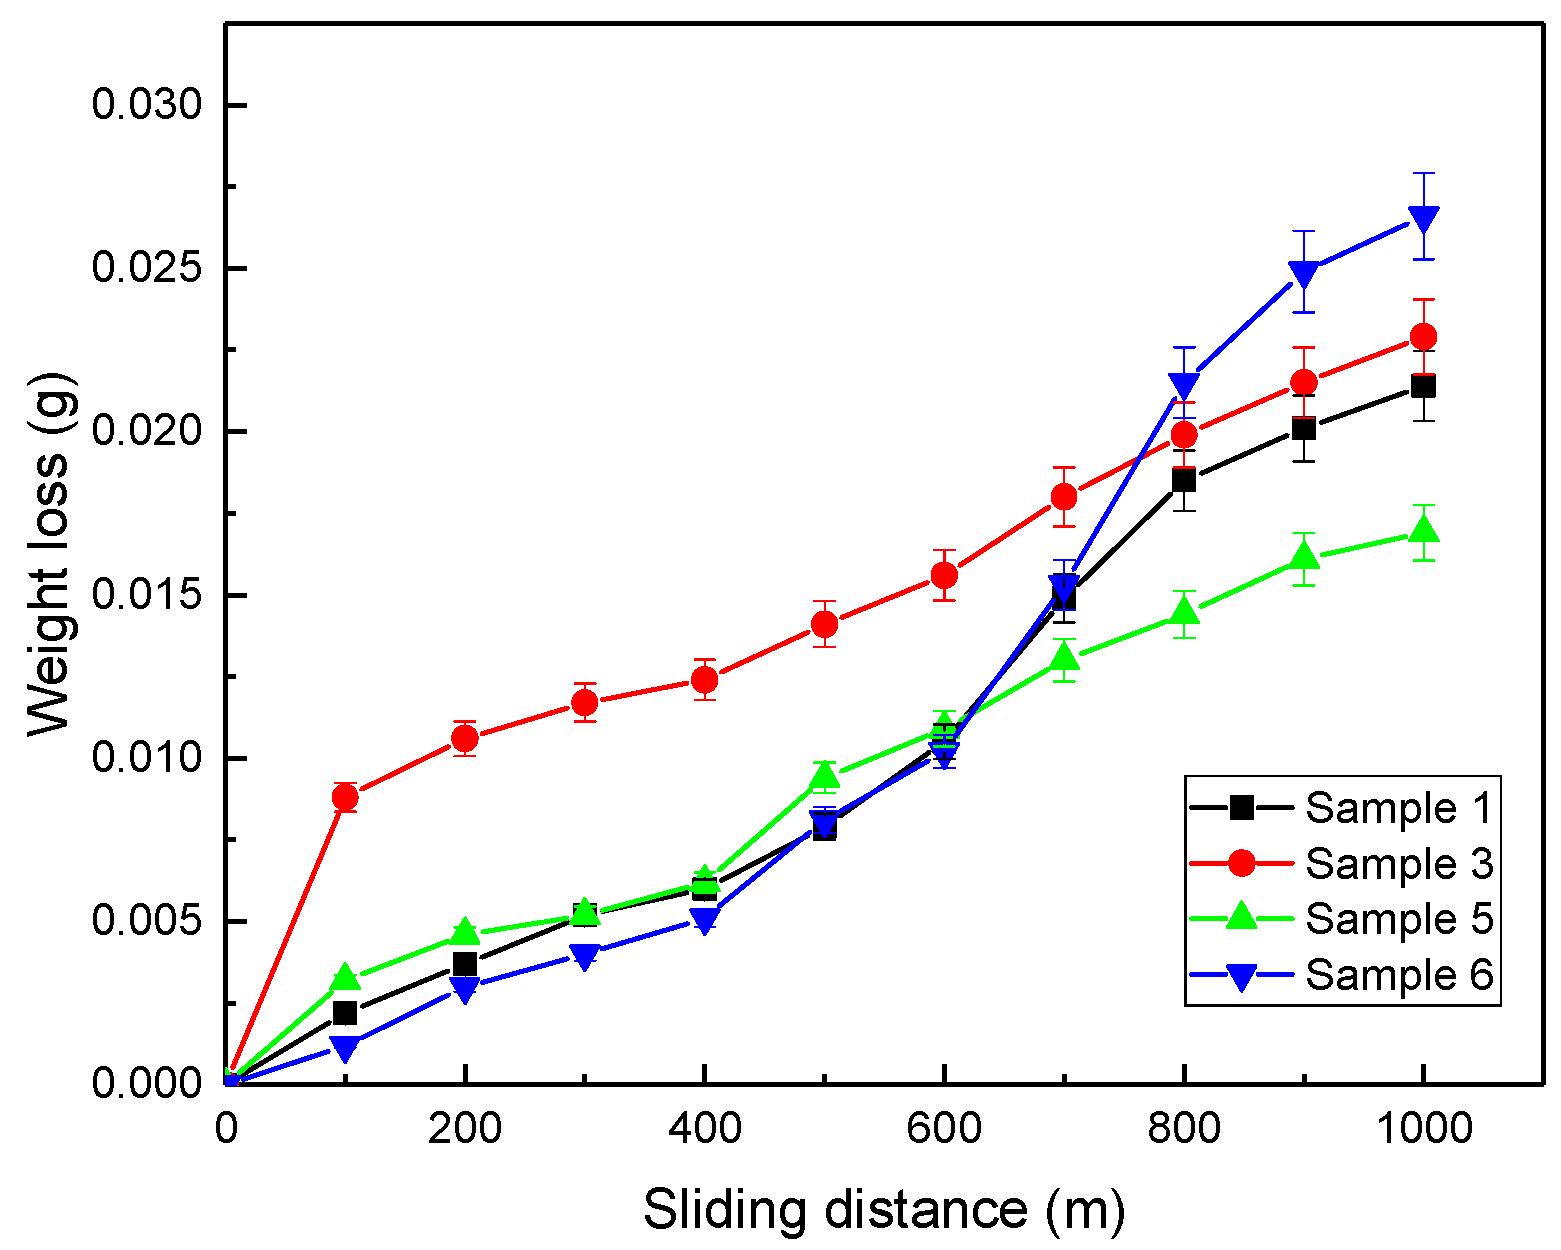
Figure 8 shows the weight loss results for Samples 1, 3, 5, and 6. Sample 1 has a desirable weight loss in the middle of the test (i.e., about 500 m), but it then increases. The weight loss difference of this sample is 0.0214 g; higher than the weight loss of sample 5, and a much smaller weight loss than Sample 6. Increasing the weight loss of sample 1 is related to the matrix softening.
Sample 3 has the worse start, and initially does not seem to have good wear resistance. However, at the end of the test, it exhibits better performance and less weight loss than sample 6 (i.e., 1000 m). Sample 5 has the best performance, the change in weight loss at 1000 m is approximately equal to 0.0169 g, indicating a low weight loss, which is due to the presence of the wear resistance SiC particles. Considering that sample 5 has the best wear performance and has the highest hardness, the results are in confirmation with Archard’s law. This behavior is also due to the reduction in the load applied by the pin to the matrix of the composite, which is tolerated by the SiC particles. This factor causes the depth of the wear-affected surface to have a significant reduction in wear, and the rate of plastic deformation decreases. In addition, due to the increase in the ceramic particles’ content in contact with the pin, the metal–metal contact decreases, which is a reducing factor in the wear rate. Furthermore, thermally dislocation punching, dislocation interaction, work hardening, and geometric constraints arising from SiC particles cause strengthening effects and a reduction in the wear rates.
The sample 6 weight loss diagram shows a large difference between this sample and other samples. Sample 6 had a lower weight loss at the beginning, and at the end of the test, the maximum weight loss indicated the inappropriate wear resistance of this sample. By adding SiC and WC particles to the composite at the beginning of the sliding distance, the weight loss is drastically reduced, and it had the best performance up to 600 m. It can be said that the advantage of adding hard ceramic particles is a factor that controls the abrasive wear. As expected, the combination of these two wear-resistance components had a positive and beneficial effect on the performance of the sample. However, with increasing sliding distance due to the weak interface between the hard particles and soft matrix, hard particles are separated from the matrix, which increases weight loss. The weight loss of this sample is approximately 0.0266 g, which is the maximum size, as mentioned earlier. In sample 6, the wear resistance of the sample is increased by combining 2% WC with SiC, whose main task is to increase wear resistance. These drastic changes can probably be attributed to wear products. Nevertheless, after a certain distance (e.g., about 500 m), the particles caused by wear between the two surfaces come in contact with the pin and disc, leading to wear and, eventually, weight loss of the sample. It is generally in a better condition than WC-free samples over the entire distance. It can be concluded that the presence of WC can optimally have a positive effect on overall wear resistance.
Figure 4 illustrates how WC is distributed in a composite. As shown in this figure, the WC particles are separated into pieces within the matrix of the sample and placed on the wear surface between the two contact surfaces. Like sandpaper, this wear debris leads to abrasion of the piece and the formation of a wear layer.
The intersection of the diagrams in
Figure 8 is at about 600–700 m due to the change in the wear mechanism. At the beginning of wear, due to the unevenness between the two surfaces, the abrasive wear mechanism is predominant, and with the continuation of the sliding distance and the plastic deformation created on the sample surface, the hardness of the sample surface increases, which changes the wear mechanism to adhesive wear, and also with the increasing local temperature due to friction, the oxidation mechanism is activated. This shows that the wear mechanism plays an important role in determining the type of composite for optimal conditions.
Comparing the results with the results of Oliveira et al. [
25], it is clear that the weight loss is less than the Fe-Cu-SiC composite, which can be due to the presence of graphite as a self-lubricant and a higher percentage of SiC.
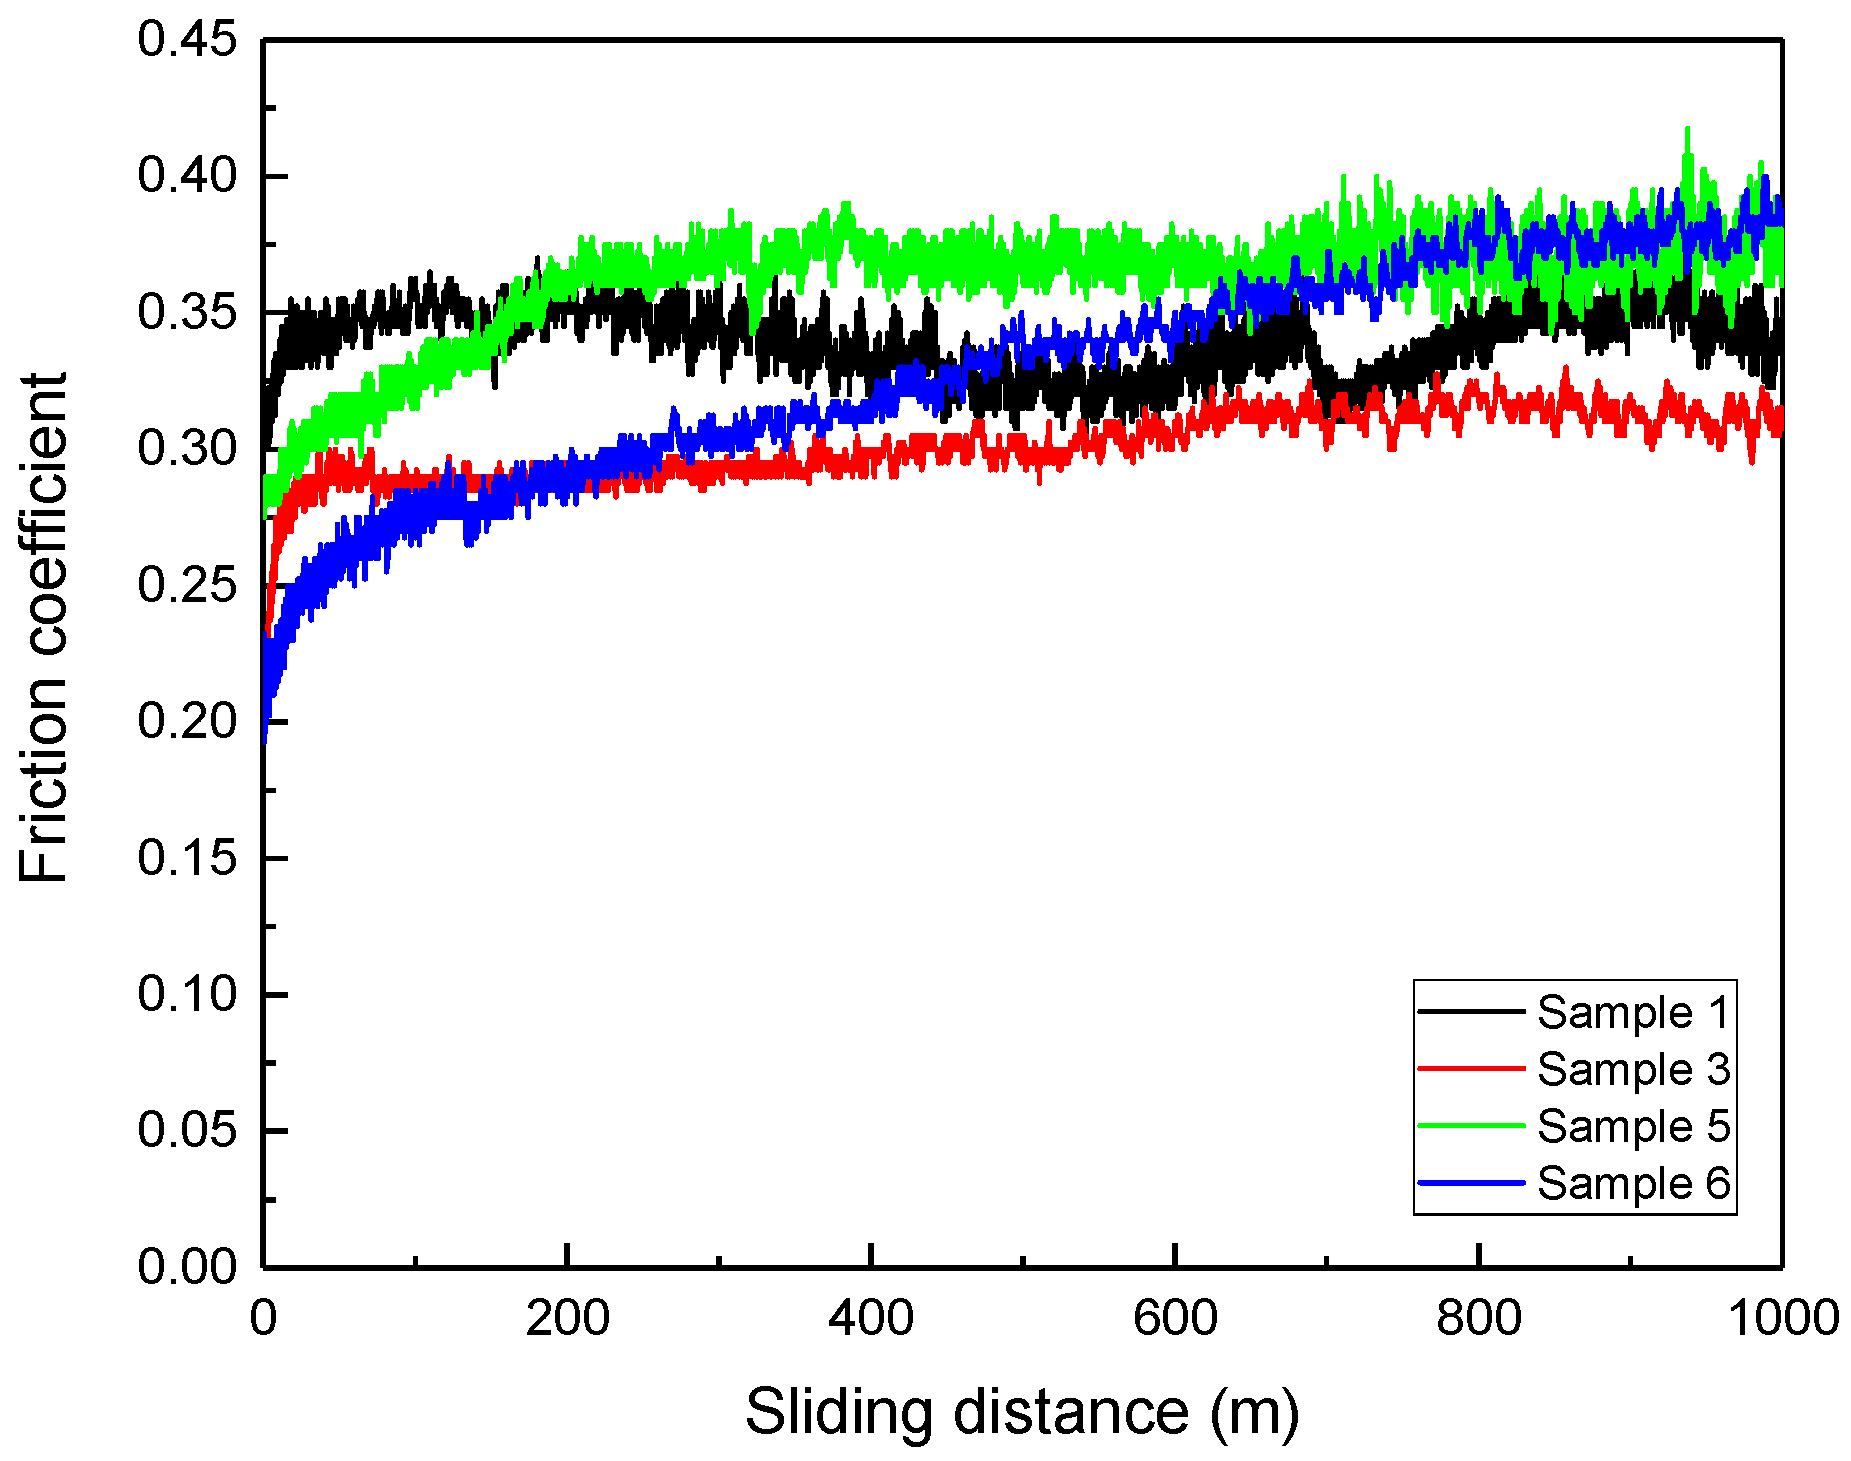
Figure 9 shows the COF graphs of the samples. As can be seen in
Figure 9, it has fluctuated a lot along the way. Reducing the COF indicates the effect of self-lubrication on the sample [
26,
27]. At the beginning of the sliding, the COF is low, after which it reaches an almost uniform trend. At the beginning of the wear test, part of the surface of the sample is abraded, which caused the pullout of carbon particles, which formed a film of carbon. Carbon films between the sample and the pin act as a solid lubricant, which reduces the COF. However, after the contacted carbon particles are removed, it again increases the COF and this cycle starts again. Another factor that reduces the COF is the presence of hard SiC particles.
Figure 9 shows that in low amounts, SiC has been effective in reducing the COF, but increasing the percentage of SiC has the inverse effect. When two surfaces come in contact with each other, it prevents continuous contact. Other factors affecting the COF are the presence of copper particles with high thermal conductivity that prevents a sharp rise in instantaneous temperature during wear and, subsequently, prevents an increase in the COF. Nonetheless, this lubrication does not mean that it has a lower weight loss parameter [
28,
29]. In Sample 1, the COF is approximately 0.35, a high COF.
In contrast, sample 3 has a lower COF than sample 1, 0.3. In this sample, the diagram experiences less fluctuation compared to sample 1 (
Figure 9). In sample 5, the slope of the diagram is initially small, but it gradually increases. Nevertheless, the diagram and COF are stable from approximately 200 m to the end of the test, stabilized at 0.35. Sample 6 has a low COF (about 0.2) at the beginning of the test. The higher the distance, the higher the COF, and the higher the slope. At the end of the test (i.e., at a distance of 1000 m), it has the highest COF in this study.
By examining the parameters simultaneously of weight loss and COF, it can be concluded that the performance of the wear resistance test and the COF are improved by increasing the SiC content value of the samples. Increased SiC has generally increased the wear resistance of the samples. In samples in which only SiC is variable, sample 5, with 10% SiC, is generally in better condition than the other samples, both in terms of weight loss and COF. Accordingly, it can be introduced as an optimal example. However, if WC is also added to the sample (sample 6) as a wear-resistant particle, wear resistance can generally be improved. By comparing the results with the results of Prabhu et al. [
30], it is clear that the COF changes are similar to that of Fe/SiC/graphite composite.
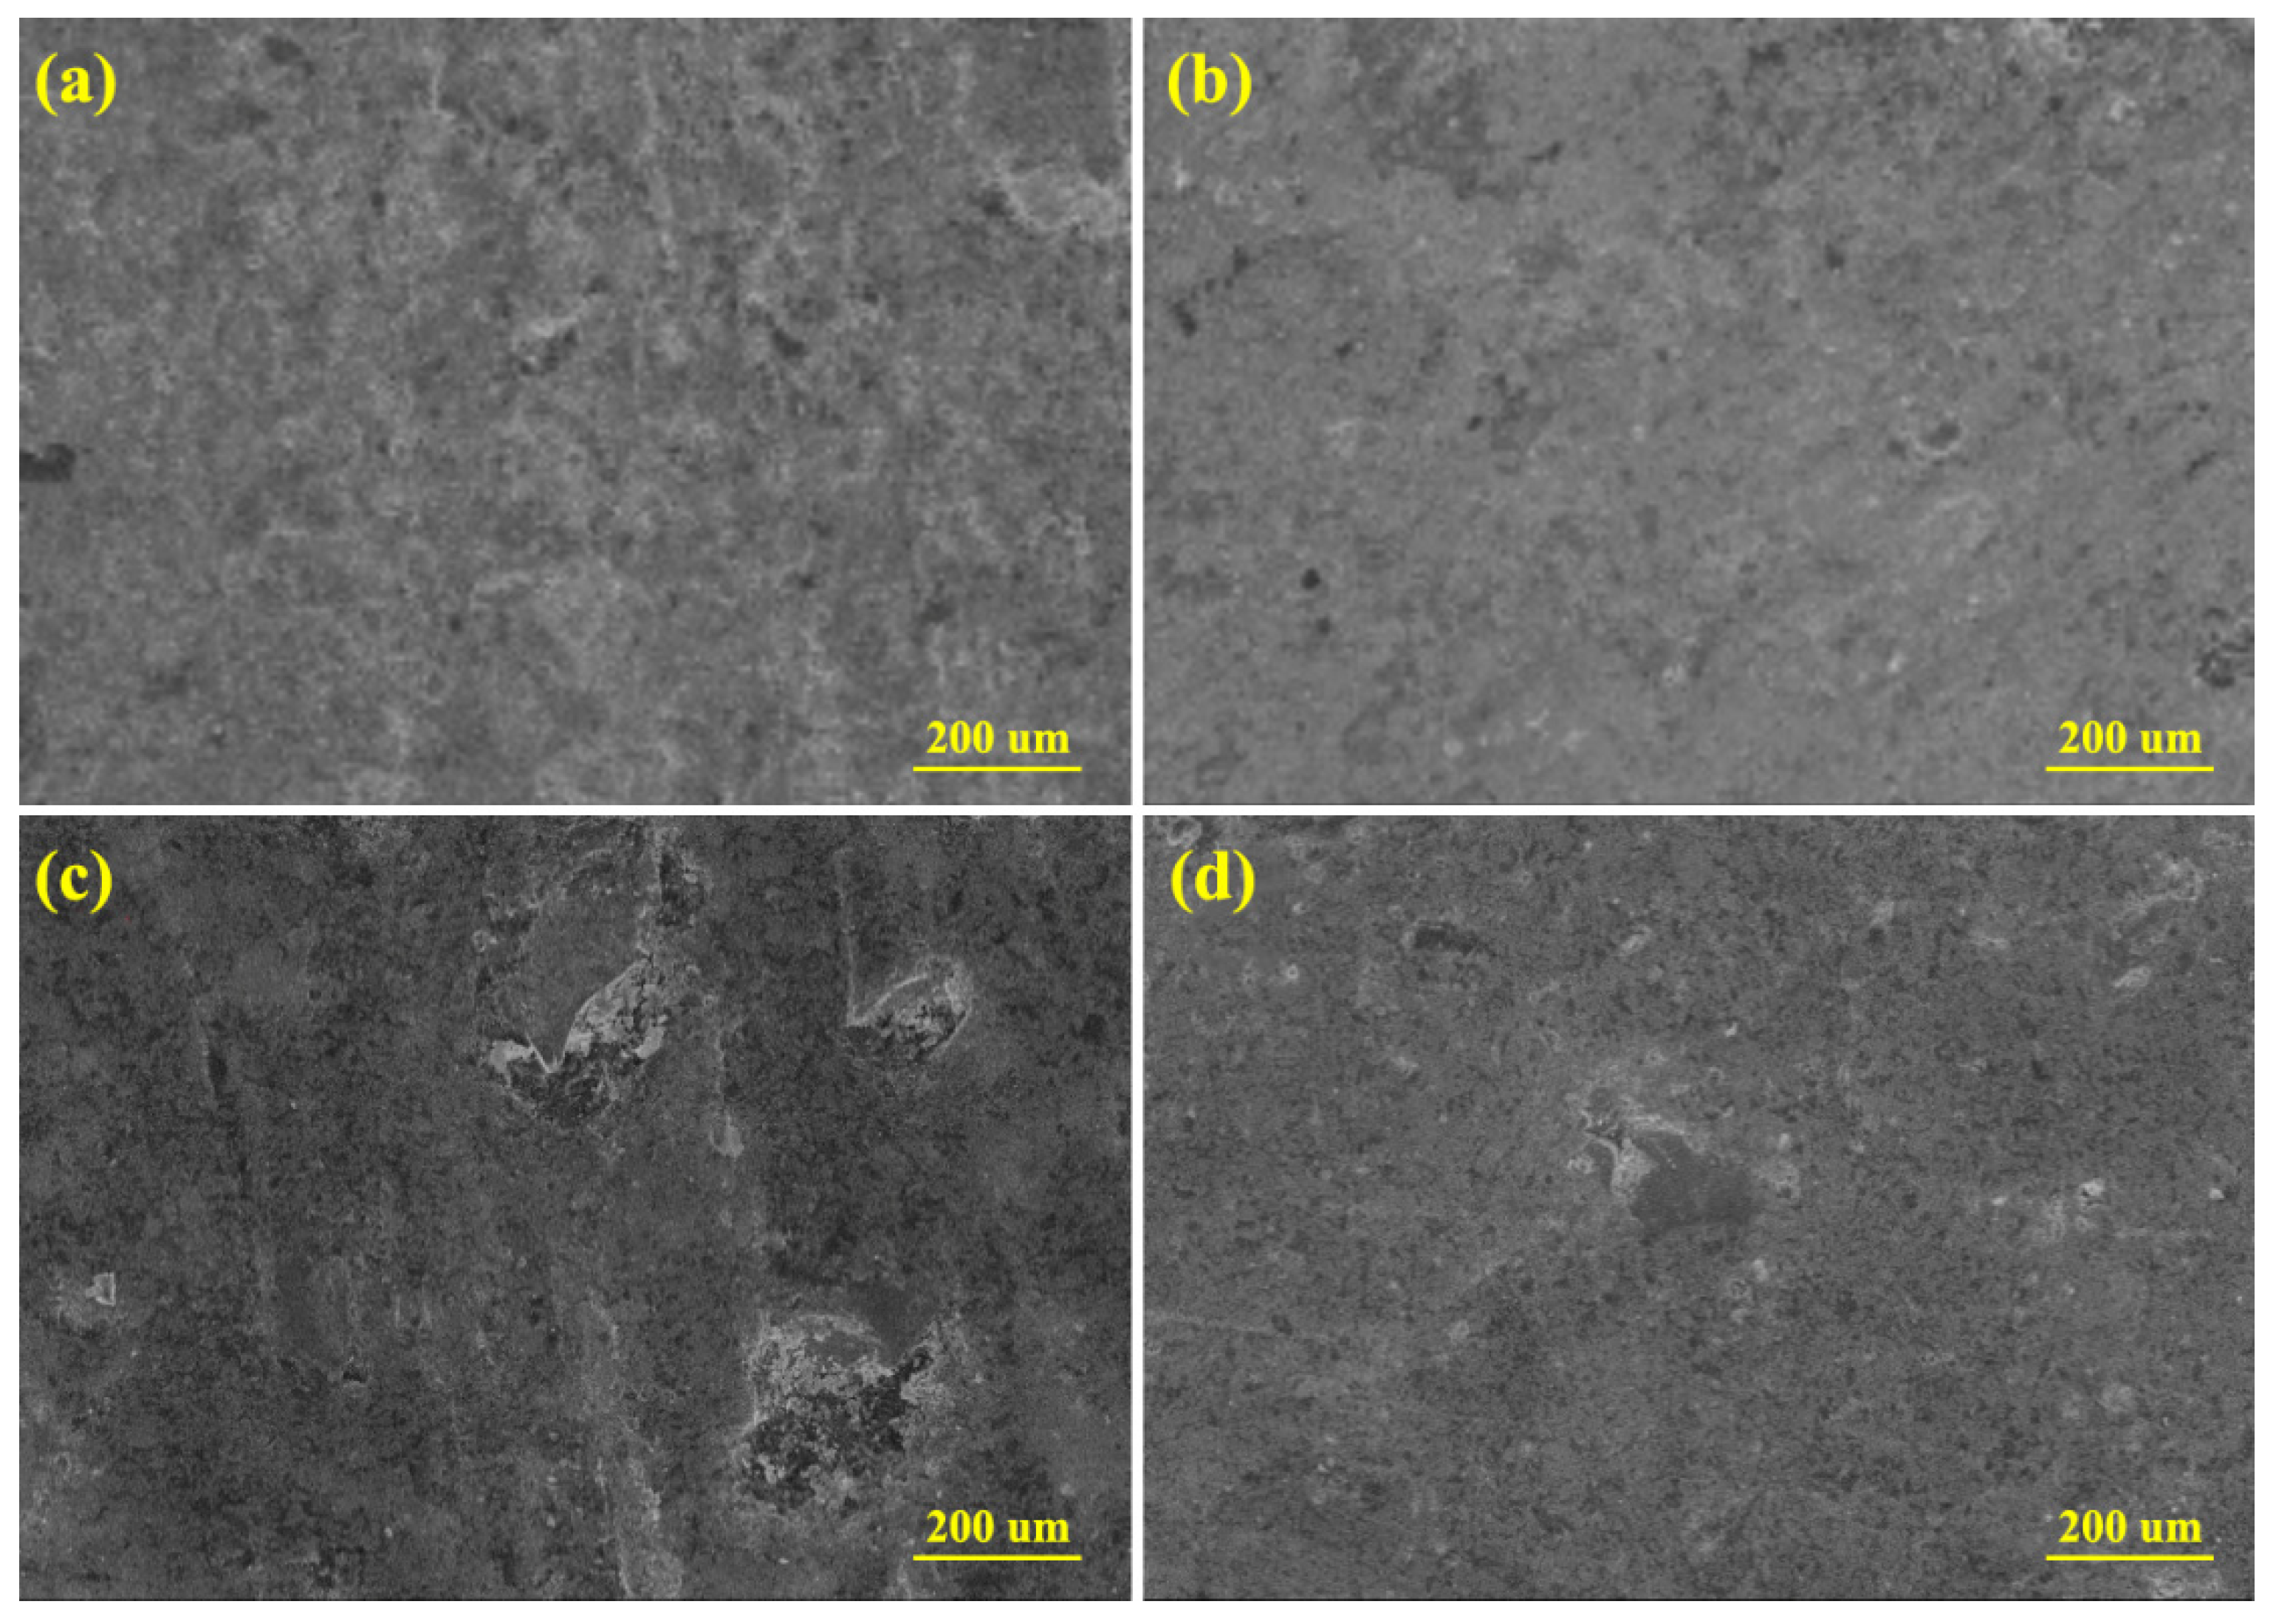
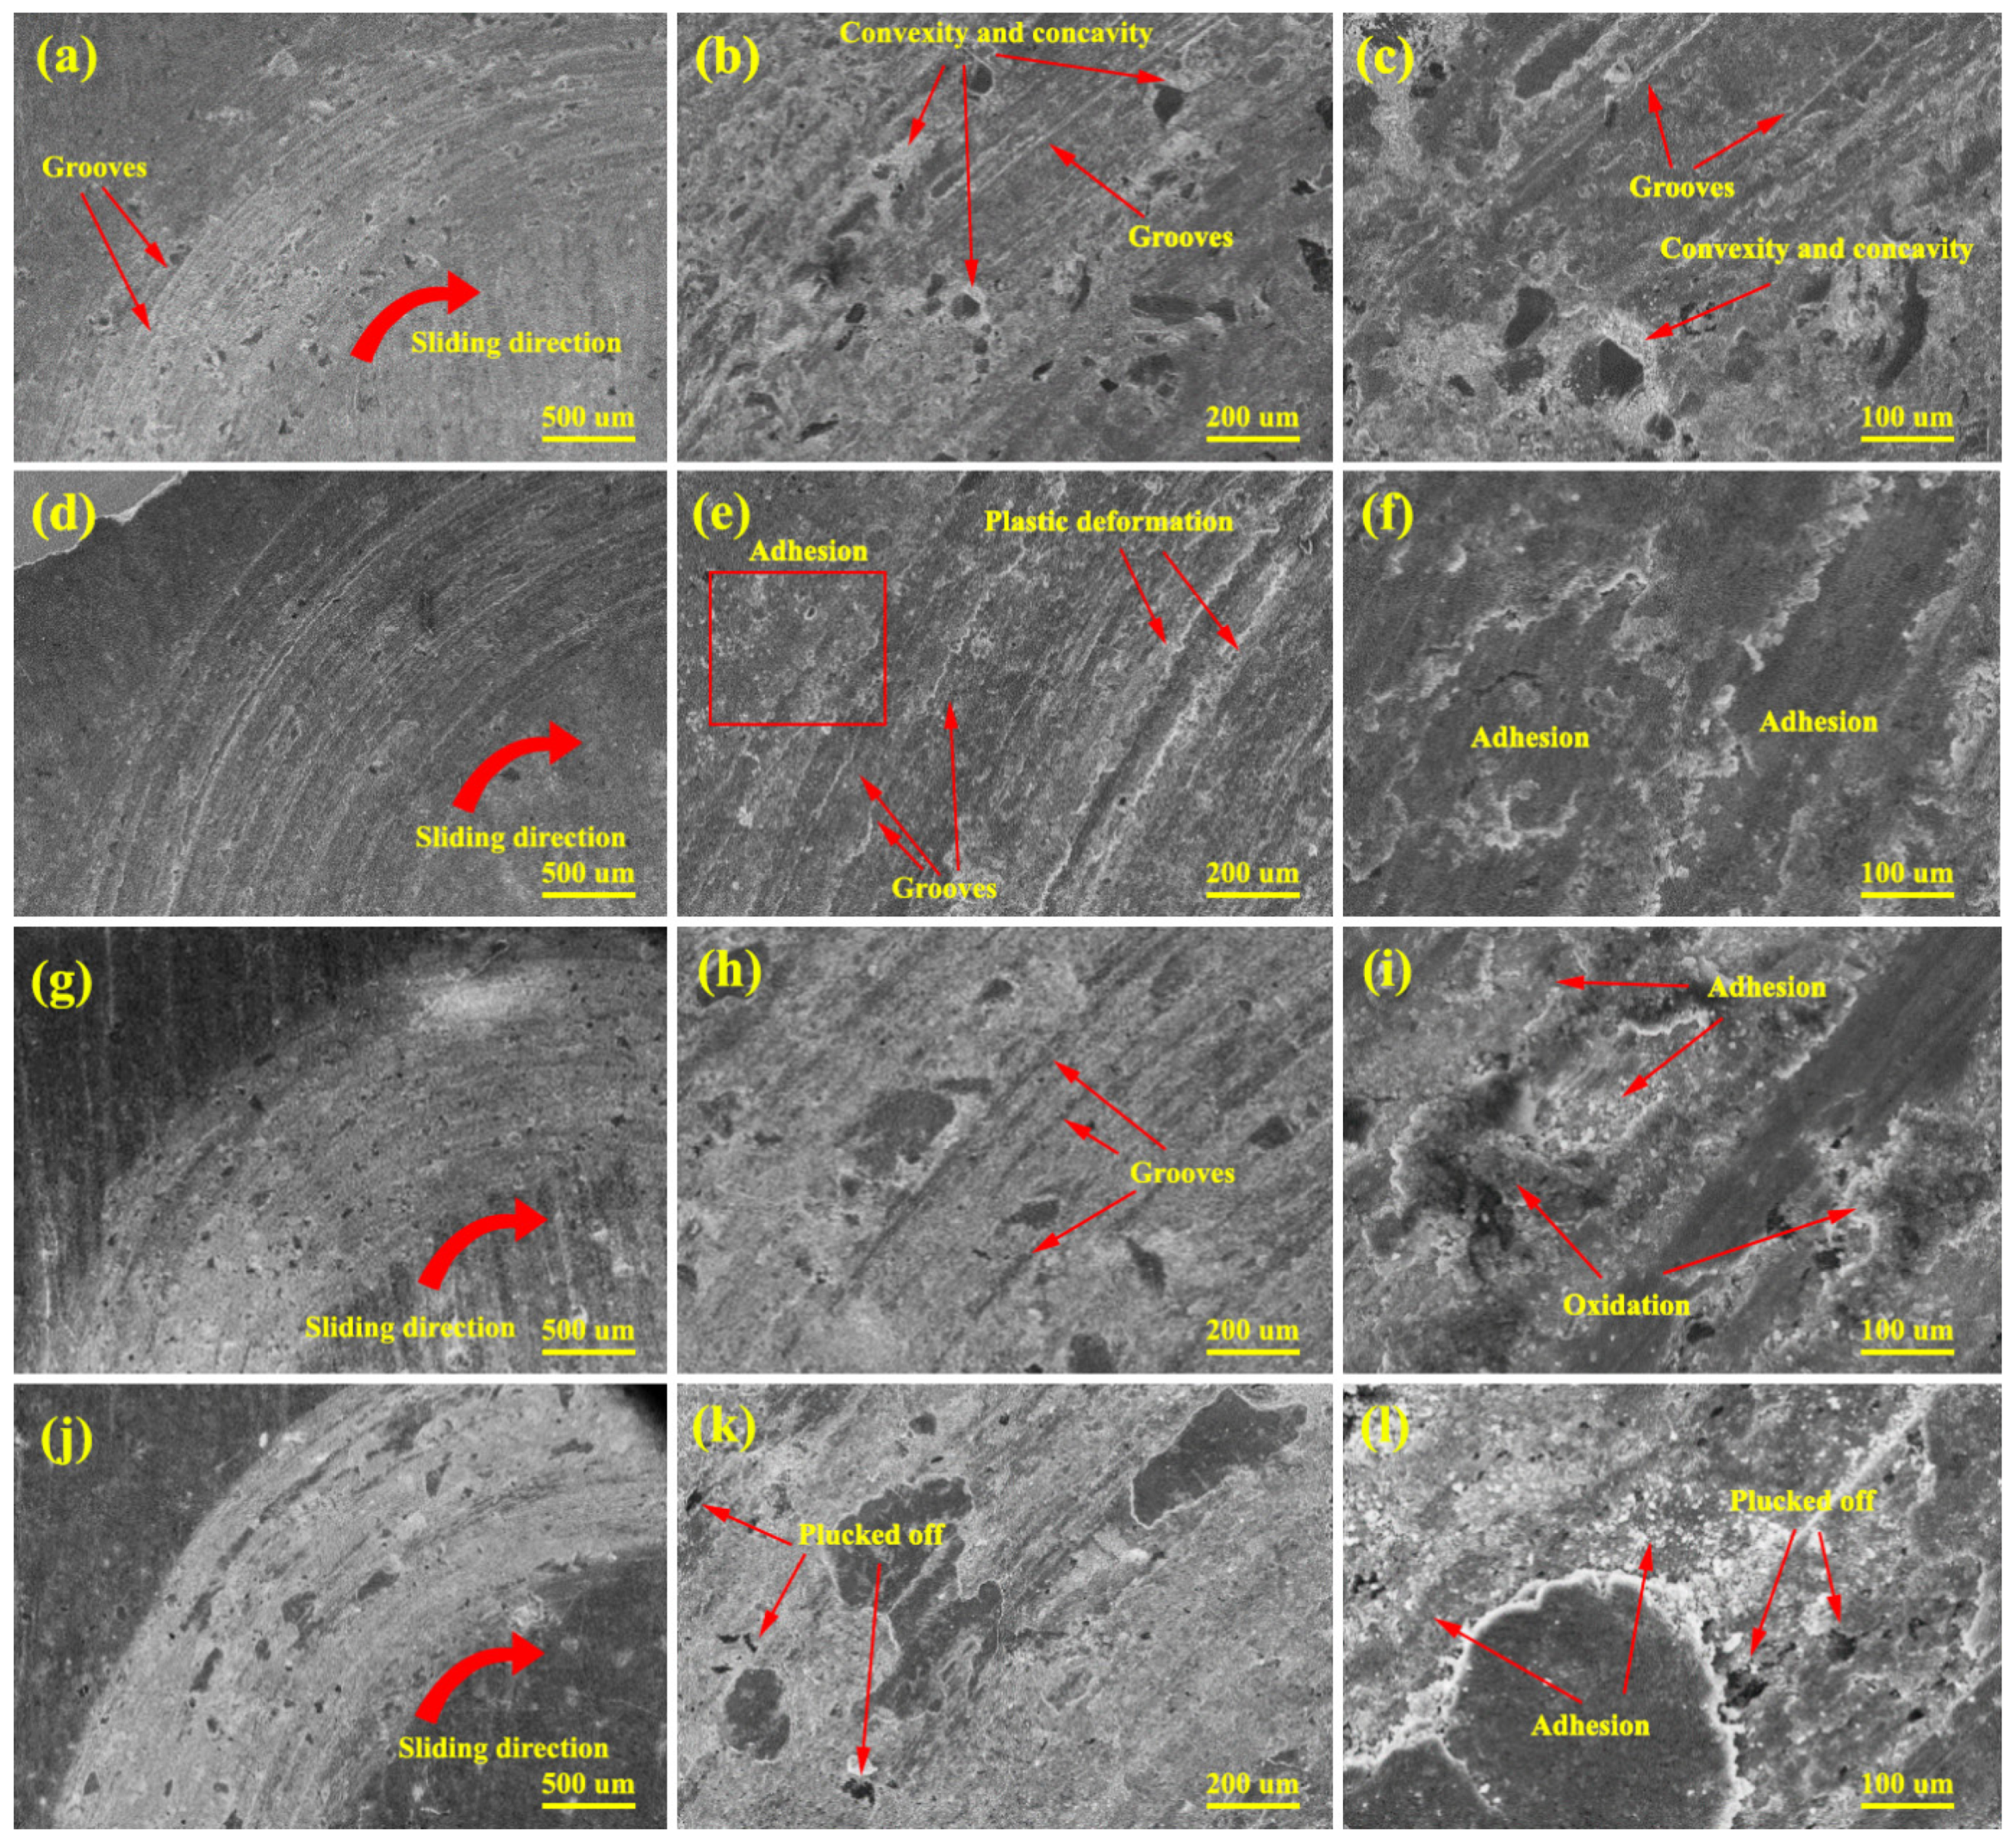
Figure 10a–c show the SEM images of sample 1. As indicated, parallel grooves can be seen in the sliding direction, which indicates abrasive wear. This mechanism occurs due to soft surface (due to 2% SiC and 74.5% Fe) and hard surface contact during sliding. The contact between the hard and soft surfaces during abrasion, causes grooves in the soft surface [
31]. This will eventually cause numerous dimples and grooves extended in the form of chips on the surface. The debris is marked with an arrow in
Figure 11. In higher magnification, images in
Figure 10b,c, show convexity and concavity of the surface around the SiC particles, which is caused by abrasive wear and causes the edge and projection of the SiC particles on the surface. As the SiC particles protrude, the wear rate and COF decrease due to greater contact of the pin with the ceramic particles, until the SiC particles are plucked off from the matrix and this process is repeated in a cyclic manner.
Figure 10d–f show the worn surface of sample 3. As can be seen, the wear mechanism in sample 3 is a combination of abrasive and adhesive wear.
Figure 10f shows the adhesive wear clearly. Adhesive wear in this sample may be due to the completely uneven surface of the fabricated sample or the surface mechanical engagement during the test. In this case, due to high temperature induced by friction, a thin piece or sheet from the surface of the material sticks to the other surface, which leads to engagement and stress at several different points. This leads to plastic deformation (
Figure 10e) and local joints and, eventually, transferring the material from one surface to another. Adhesive wear can also be attributed to the theory of penetration.
Figure 10g–i show SEM images of sample 5, whose shallow grooves are evidence that also shows a combination of wear mechanisms. Abrasive and adhesive wear is evident in these images; although, they have less abrasive wear than samples 1 and 3. On the other hand, with the increase in SiC particles, the density of dislocations due to CTE mismatches in the hard phase/soft phase interface increases, which increases the strength and thus reduces the wear rate. Abrasive wear in this sample can be due to wear particles [
32]. Specific materials may be placed between the pin and disc, resulting in wear due to the relatively high hardness of the sample (due to the presence of 10% SiC) by the micro ploughing mechanism. The force applied by the pin to the surface of the sample causes plastic deformation at the surface of the sample in the sliding path, and as the wear test continues, the hardness of the deformed surface increases, which is one of the factors that reduce the wear rate. It should be noted that there is a possibility of oxidizing compounds and the mechanism of oxidative wear in all samples (under the same conditions) due to high heat in the wear test and the presence of oxygen in the environment. The two surfaces in contact react to the adjacent environment (i.e., oxygen), and the surface layers separate from the surface as particles in the presence of oxygen. By combining oxygen with the surface layer of the sample, a ceramic layer is created that acts as a self-lubricating layer as the wear continues. Oxidation is increased by heat generated during friction.
Figure 10j–l show the SEM images of sample 6; abrasion on the wear path is less. Even though on the worn surface of the sample, the depth of abrasion is shallow, and no plowing or peeling is observed. Most likely, no further wear is allowed in this sample due to the WC. The predominant wear mechanism in this sample is mainly adhesive wear. In general, it can be said that the presence of WC in this sample has reduced the abrasive wear mode and improved the condition compared to previous samples. Samples with abrasive wear mechanisms, and more weight loss, generally have less wear resistance. However, samples with mostly adhesive wear usually have less weight loss. From all the SEM images, it can be argued that the lower the abrasive wear mechanism, the greater the wear resistance. In the image with higher magnification, the areas with particles plucked off are visible. Considering the wear rate graph, at the beginning of the sliding distance, the wear rate has decreased due to the presence of WC hard particles. As the sliding distance increases, the areas around the particles become dug out and cause the particles in the matrix to be plucked off, which increases the wear rate over long distances.


