Article

Nucleation and Post-Nucleation Growth in Diffusion-Controlled and Hydrodynamic Theory of Solidification

by
Frigyes Podmaniczky
1,* and
László Gránásy
1,2,*
1
Wigner Research Centre for Physics, P.O. Box 49, H-1525 Budapest, Hungary
2
BCAST, Brunel University, Uxbridge, Middlesex UB8 3PH, UK
*
Authors to whom correspondence should be addressed.
Crystals 2021, 11(4), 437; https://doi.org/10.3390/cryst11040437
Submission received: 13 March 2021 / Revised: 12 April 2021 / Accepted: 13 April 2021 / Published: 17 April 2021
(This article belongs to the Special Issue Modeling of Crystal Growth)

Abstract

:
Two-step nucleation and subsequent growth processes were investigated in the framework of the single mode phase-field crystal model combined with diffusive dynamics (corresponding to colloid suspensions) and hydrodynamical density relaxation (simple liquids). It is found that independently of dynamics, nucleation starts with the formation of solid precursor clusters that consist of domains with noncrystalline ordering (ringlike projections are seen from certain angles), and regions that have amorphous structure. Using the average bond order parameter q ¯ 6 , we distinguished amorphous, medium range crystallike order (MRCO), and crystalline local orders. We show that crystallization to the stable body-centered cubic phase is preceded by the formation of a mixture of amorphous and MRCO structures. We have determined the time dependence of the phase composition of the forming solid state. We also investigated the time/size dependence of the growth rate for solidification. The bond order analysis indicates similar structural transitions during solidification in the case of diffusive and hydrodynamic density relaxation.

1. Introduction

Colloid suspensions are considered as model systems for simple molecular liquids [1,2]. A wealth of information is available for the crystallization of colloids including nucleation, which was obtained via tracing the trajectories of colloid particles via optical methods [2,3,4]. For example, in colloids, two-step nucleation, assisted by amorphous/liquid precursor, appears to be a general phenomenon [5,6,7,8,9,10]. Analogous experimental information is not accessible for highly undercooled simple liquids. This raises the question, to what extent the observations made on colloids are applicable to metallic liquids. There appear to be differences: e.g., crystal growth is usually diffusion controlled for colloid suspensions, whereas it may be interface controlled for a hypercooled pure liquid. The velocity of a flat crystal–liquid interface depends on the growth mechanism. In the case of diffusionless processes a steady state velocity is established, whereas in the diffusion-controlled processes the front velocity, v, is proportional to t−1/2, where t is time [11,12]. The growth rate also depends on the curvature of the interface, as predicted by the classic kinetic model based on monomer attachment and detachment [13,14]. For spherical particles:
v = 16 D λ 2 ( 3 v a t 4 π ) 1 / 3 sinh { v a t 2 k B T ( Δ g 2 γ r ) }
where D is the self-diffusion coefficient, λ the jump distance of atoms, vat the atomic volume, kB Boltzmann’s constant, T the temperature, Δg the volumetric free energy difference between the liquid and the solid, γ the solid-liquid interfacial free energy, and r the radius of the crystallite. Note that for the critical size, r* = 2γg, the deterministic growth rate is zero, for larger particles it is positive, whereas for smaller particles it is negative. This expression is strictly valid only for diffusionless processes, where the velocity of the flat interface (r → ∞) is independent of time. The behavior of post-nucleation particles in diffusion-controlled systems is less obvious.
Recent advances made in solidification modeling [15] allow the investigation of both two-step nucleation and post-nucleation growth. For example, investigations relying on two versions of a simple dynamical density functional theory, termed the phase-field crystal (PFC) approach [16,17,18], have shown steady-state growth when combined with hydrodynamic density relaxation (a model termed HPFC henceforth [19,20]), and vt−1/2 for overdamped (diffusion controlled) relaxation dynamics (denoted as DPFC [21,22,23]), at small driving forces. The latter model yields diffusionless growth at extreme undercoolings, where the density of the growing crystal is about the same as that of the liquid [22,23]. These molecular-scale models offer a possibility to study early-stage solidification in three dimensions (3D), and to compare nucleation and post-nucleation growth for the two types of dynamics. While structural aspects of crystal nucleation in the DPFC model has been addressed in some detail in previous work [24,25,26,27,28,29,30,31], similar studies are unavailable for the hydrodynamic model.
Herein, we address nucleation and post-nucleation growth within the HPFC model, including the structural aspects, and compare the results to those from the DPFC model. We are going to investigate whether the two-step nucleation process reported for the DPFC model [27,28,29,30,31] appears in the hydrodynamic approach, and we compare the time evolution of the phase content predicted by the two models.

2. Materials and Methods

2.1. Phase-Field Crystal Method

2.1.1. Thermodynamics

The phase-field crystal approach is a simple, dynamic density functional theory of classic particles [17,30,31]. The free energy functional it relies on can be deduced from the perturbative density functional theory of Ramakrishnan and Yussouff [32], after expanding the direct correlation function in Fourier space up to fourth order, providing thus a single preferred wavelength for the density waves [17,33], hence termed “single-mode PFC” as opposed to more complex approaches that introduce further preferred wavelengths. The local state of matter is characterized by the time-averaged particle density, ρ. Introducing appropriate dimensionless quantities, a Brazowskii/Swift-Hohenberg type expression is obtained for the dimensionless free energy of the inhomogeneous system relative to a homogeneous reference fluid (of density ρ0):
Δ F = d r { ψ 2 [ ε + ( 1 + 2 ) 2 ] ψ + ψ 4 4 }
Here ψ ∝ (ρρ0)/ρ0 is the scaled density difference, whereas ε is the reduced temperature (normalized distance from the critical point). The latter can be connected to such physical properties as the bulk moduli of the fluid and crystalline phases at a reference density and temperature. The phase diagram of the 3D system is shown in Figure 1 [27,30,34]. Besides the homogeneous liquid, stability domains exist for the body-centered cubic (bcc), hexagonal close-packed (hcp), and face-centered cubic structures. With appropriate quenching procedure in the presence of noise representing the thermal fluctuations, amorphous solids of realistic radial distribution function g(r) can also be obtained in the vicinity of the linear stability limit of the liquid state [26,27,28,29,30].

2.1.2. Equations of Motion (EOMs)

Hydrodynamic PFC models: The HPFC model we proposed to describe crystalline solidification in simple liquids [19,20] relies on fluctuating nonlinear hydrodynamics [35] as formulated in [36]. The respective momentum transport and continuity equations are read as
p t + · ( v p ) = · [ R ( ρ ) + D ( v ) + S ]
ρ t + · p = 0
Here p(r, t) is the momentum, ρ(r, t) the mass density, v = p/ρ the velocity, while ∇⋅R = −ρ∇{δΔF[ρ]/δρ} ≈ −ρ0∇{δΔF[ρ]/δρ} is the reversible stress tensor, ρ0 the reference density, and D = μS{(∇ ⊗ v)+ (∇ ⊗ v)T} + [μB − (2/3)μS] (∇v) the dissipative stress tensor. S represents stochastic momentum noise, with correlation:
S i j ( r , t ) , S k l ( r , t ) = ( 2 k T μ S ) [ ( δ i k δ j l δ j k δ i l ) + ( μ B μ S 2 3 ) δ i j δ k l ] δ ( r r ) δ ( t t )
μS and μB denote the shear and bulk viscosities. To avoid violent interatomic flow in the crystalline phase that would develop due to steep density gradients, coarse-grained momentum and density were used when computing the velocity: v = p ^ / r ^ . (For further details see References [19,20].) It has been shown that this model recovers steady-state growth of velocity v ∝ 1/μS, the longitudinal and transversal quasi-phonons of proper dispersion, and capillary waves of realistic spectrum at the crystal–liquid interface [19]. While there are other hydrodynamic extensions of the PFC model [37,38,39], they have not been used for studying nucleation, and the amplitude expansion based model [38] cannot be easily formulated for detecting competing amorphous and crystalline polymorphs in the liquid.
Since numerical solution of Equations (2)–(6) in 3D proved computationally rather demanding, we propose here a simplified HPFC model (sHPFC) that relies on linearized hydrodynamics. We assume that the velocity and density gradients are small, the advection term is omitted, and then the time derivative of the continuity equation is inserted into the divergence of the equation for the momentum transport, which is the way we obtain a specific form of the DDFT/HI model by Kikkinides and Monson that was successfully applied for describing capillary waves on the nanoscale [40]:
2 ρ t 2 + α ρ t = · { ρ m ( δ Δ F δ ρ ) + ( β ρ t ) } + · · S ,
where m is the particle mass, a the damping coefficient, β = {(4/3)μS + μB}/ρ, and the free energy functional defined by Equation (1) is used in δΔF[ρ]/δρ, while S is the stochastic momentum tensor used in Equation (3). Note, assuming β = 0, and omitting the noise term, we recover the modified PFC (MPFC) model proposed earlier [41,42]. It can be shown that similarly to the full HPFC, at small undercoolings the sHPFC model recovers steady-state growth of velocity v ∝ 1/μS, and that longitudinal and transversal quasi-phonons of proper dispersion occur in the crystal. In the present work we use this simplified hydrodynamic approach to study crystal nucleation and early stage growth in simple liquids in 3D.
The diffusive PFC model: In the original PFC model [16,17,18,21,22,23,24,25,26,27,28,29,30,31], the time evolution of the scaled number density is described using conserved overdamped dynamics, which is realized by the following dimensionless EOM:
ψ t = · { δ Δ F δ ψ } + ζ .
Here δΔF[ψ]/δψ stands for the functional derivative of the free energy difference, ΔF, with respect to the scaled number density difference. ζ is a colored Gaussian flux noise with correlation 〈ζ(r,t)ζ(rt′)〉 = ξ22g(|rr′|, σ)δ(tt′), where ξ is the noise strength, and g(|rr′|, σ) is a high-frequency cutoff function [27,28], to remove wavelengths shorter than the interatomic spacing (σ). In this model different growth modes occur at large and small driving forces for crystallization: (i) at small undercoolings or supersaturations growth is diffusion controlled and vt−1/2, whereas (ii) at large driving forces, where diffusion length lD = D/v becomes comparable to the interface thickness, a transition is observed to a diffusionless fast growth mode displaying steady-state growth (v = const.) [22,23], as expected for colloids [43].

2.2. Numerical Methods

The dimensionless kinetic equations were solved in three dimensions, using a pseudospectral scheme combined with a second-order Runge-Kutta time stepping, while employing periodic boundary conditions on uniform rectangular grid. Unless stated otherwise, the grid size was 5123 that, under the conditions used, corresponds to about 3.6 × 10⁵ atoms. The computations were performed on high-end Graphics Processing Units.

2.3. Materials Parameters

The computations we present were performed at a scaled density of ψ0 = −0.2720 and different constant reduced temperatures chosen between the values corresponding to the liquidus line εL = 0.1548 and the linear stability limit εc = 0.2220. The time and spatial steps used in the numerical computations were Δt = 0.01 and Δx = 1. Note that the single PFC model can be fitted to iron [44,45], yielding realistic structural properties for the amorphous state [26,27,28], and combined with the sHPFC dynamics it can be viewed as a model for bcc metals. A noise strength of ξ = 0.005 was used in all three models. When transforming the results to dimensional form, the diffusion coefficient (DPFC) or the viscosity/damping coefficient (sHPFC and DPFC) sets the physical time scale of the process.

2.4. Structural Analysis

The structure of the solid phases was analyzed in terms of the average bond order parameters q ¯ l k introduced by Lechner and Dellago [46], which incorporates structural information from the first and second neighbor shells:
q ¯ l k = { 4 π 2 l + 1 m = l l q ¯ l m k 2 } 1 / 2 ,   where   q ¯ l m k = 1 N b k + 1 i = 0 N b k q l m i   and   q l m i = 1 n b i j = 1 n b i Y l m ( r i j )
Here Nbk is the number of neighbors of the particle k, nbi is the number of the first neighbors of the ith neighbor or particle k, whereas Ylm is the spherical harmonics of degree l and order m, while rij is the vector between the first neighbor atom i and its jth first neighbor.
For reference, the q ¯ 4 q ¯ 6 map evaluated for bulk bcc, hcp, fcc and liquid phases from molecular dynamics simulations performed for the Lennard-Jones (LJ) system is shown in Figure 2 [46]. This order parameter map distinguishes the bulk crystal and liquid structures reasonably well.

3. Results and Discussion

3.1. Two-Step Nucleation

First, we investigate whether the amorphous-precursor-assisted crystal nucleation [26,27,28,29,30] observed in the DPFC model prevails in the sHPFC model. We have performed isothermal simulations for scaled density of ψ0 = −0.2720 at reduced undercoolings of ε = 0.200, 0.202, and 0.204. Snapshots of these simulations taken at different instances are shown in Figure 3, showing nucleation and post-nucleation growth.
We adopted a q ¯ 6 -based coloring scheme, introduced by Kawasaki and Tanaka [47], to characterize the pre-nucleation local ordering in the liquid: q ¯ 6 > 0.4 (green)—crystalline (bcc in our case); 0.4 > q ¯ 6 > 0.28 (red)—MRCO; which we complemented with the white color for solid peaks of 0.28 > q ¯ 6 , indicating amorphous solid.
As expected, with increasing undercooling, increasing number of solid nuclei formed. Coloring according to the value of q ¯ 6 indicates that in all the cases studied, nucleation of the solid started with the formation of an amorphous structure, which was followed by the appearance of MRCO structure, whereas the stable bcc phase formed slightly later but almost together with the MRCO, indicating an essentially two-step process mediated by the amorphous precursor and MRCO structures, akin to that reported in previous work for diffusive dynamics [27,28,29,30]. This sequence is clearly displayed by the time dependence of the phase fractions presented in Figure 3d,h,l. One may conclude that under the conditions investigated, the kinetic preference that determines the sequence by which the different structures appear is similar for diffusion controlled and hydrodynamic solidification mechanisms.
Snapshots of the q ¯ 4 q ¯ 6 map displaying the transition from the initial amorphous state to the bcc crystal is shown in Figure 4 for the simulation depicted in Figure 3a–d. The position of the initial amorphous domain agreed well with the liquid domain in the q ¯ 4 q ¯ 6 map for the LJ system (see Figure 2), suggesting structural similarity between the sHPFC amorphous phase and the LJ liquid. This behavior is very similar to the one reported for DPFC [29]. Unfortunately, the q ¯ 4 q ¯ 6 map does not give a detailed characterization of the structure. Therefore, we further investigated the structures appearing during early-stage solidification.

3.2. Structure Evolution during Nucleation

An intriguing question is what solid structures form first from the uniform liquid. In the classic density functional theories, the local state is characterized by a time-averaged particle density, which is uniform (apart from fluctuations) in the liquid due to the motions of atoms/molecules during time averaging. An important question is, what indeed is this timescale. It is longer than the timescale of thermal vibrations of the particles, and it is so long that it smoothens the particle density in the liquid. It is interesting, therefore, to have a closer look at the first forming structures these models predict. A state appears “solid” on this time scale, when its particles become localized, i.e., move slowly on this time scale. To understand the microscopic processes governing solidification, it may be interesting to find out what type of structures become localized first according to these theories. In the single-mode PFC model, the geometrical constraint exerted by the preferred wavelength of density changes (provided by the approximate two-particle direct correlation function) will determine these structures. Further natural questions are: Is this the dominant factor, or are there others? To what extent can one rely on such predictions?
In this section, we study the structures that form during early stages of solidification in the DPFC and sHPFC simulations. This may offer us hints on how particle “localization” happens, a process that may be more difficult to capture in molecular dynamics simulations.
Sequences of snapshots of atom assemblies formed preceding crystallization are shown in Figure 5, Figure 6 and Figure 7. Apparently, non-crystalline structures formed first; however, with some degree of ordering, there were directions from which concentric ring-like arrangements of atoms could be seen, while viewing from some other directions, definite ordering could not be recognized. This structure occurred frequently in the DPFC, MPFC, and sHPFC simulations. During further evolution of the solid cluster, a mixture of non-crystalline order and liquid-like disorder appeared. Coloring according to the magnitude of q ¯ 6 did not separate these two types of solid structures. We have employed other structural characterization methods such as polyhedral template matching; however, besides a somewhat higher fraction of icosahedral-like neighborhoods than in the LJ liquid, no conclusive results were obtained for such mixture. Finally, it is worth mentioning that a DFT study indicates “onion” structures [48] as possible initial perturbations in the pre-solidification liquid; however, it does not seem to be related to the ring-like structure observed here, which might indicate ordering in a lower dimension (2D). A couple of different views of the same early-stage cluster are presented in Figure 8. Remarkably, a mixture of order and disorder is present. Whether these structures are akin to the icosahedral aggregates predicted by Dzugutov and coworkers [49,50], using a potential similar to the effective pair-potential we derived for the PFC model [28], is unclear at present. Work is underway to clarify further the nature of the non-crystalline ordering observed during the early stage of solidification.

3.3. Post-Nucleation Growth

An effective linear size (n1/3) was evaluated as a function of time from the number n of density peaks for the DPFC, MPFC, and sHPFC clusters shown in Figure 5, Figure 6 and Figure 7, respectively. The results are shown in Figure 9a, whereas the prediction for pure Fe at 1500 K obtained by integrating Equation (1) is shown in Figure 9b. It is found that predictions of the three models for post-nucleation growth were qualitatively similar: after a plateau corresponding roughly to the critical size, a smooth transition into an apparently steady-state growth was seen. In the case of the DPFC model this probably indicates that the system entered the fast diffusionless growth regime. The transition to steady-state growth was somewhat longer for the sHPFC model than for the other two. The differences in the growth mechanisms, according to the three models, were perceptible only for longer time scales.

3.4. Flat-Front Growth in the sHPFC Model

First, we compared the time dependence of growth in the three models for a reduced undercooling of ε = 0.1750. Figure 10 shows the number of atoms in the solid (bcc) phase as a function of time in a slab geometry of aspect ratio 1:32. Remarkably, the MPFC model obtained by substituting α = 1 and β = 0 into Equation (1), showed a practically identical behavior to the DPFC model. After a short initial transient, the position of the growth front varied proportionally to τ1/2 in the whole-time window covered, indicating a dominantly diffusion-controlled process (see Figure 10a). Deviation from this behavior is expected at much longer times, when the diffusion field ahead of the front interacts with the boundary condition. In contrast, the sHPPC model obtained with α = 0 and β = 1 showed a linear position–time relationship for short times (t < 1000) (Figure 10a), yet for longer times the growth rate decreased due to flow-controlled depletion of the liquid (Figure 10b) and converged towards a stationary state. Note the stepwise change of the number of atoms in all three models, indicating a layerwise growth of the slab.
Next, we evaluated the steady-state growth rate as a function of driving force and viscosity in the sHPFC model. As in the case of the HPFC model that relies on full fluctuating nonlinear hydrodynamics, it was found that the steady-state velocity vs. reduced undercooling Δε = εεL plot was somewhat curved (see Figure 11a) as reported for the MPFC model [51], which may follow either from a deviation from Turnbull’s linear relationship for the thermodynamic driving force [52], or may originate from a relaxation effect Ankudinov and Galenko identified in the case of the MPFC model [53]. The growth velocity, in turn, is about inversely proportional with the viscosity term β (see Figure 11b).

4. Conclusions

We investigated two-step nucleation and post nucleation growth in the framework of PFC models supplemented with diffusive dynamics (DPFC), and two types of linearized hydrodynamics that differ in the dissipation term: α = 0 (sHPFC) and β = 0 (MPFC). It has been shown that
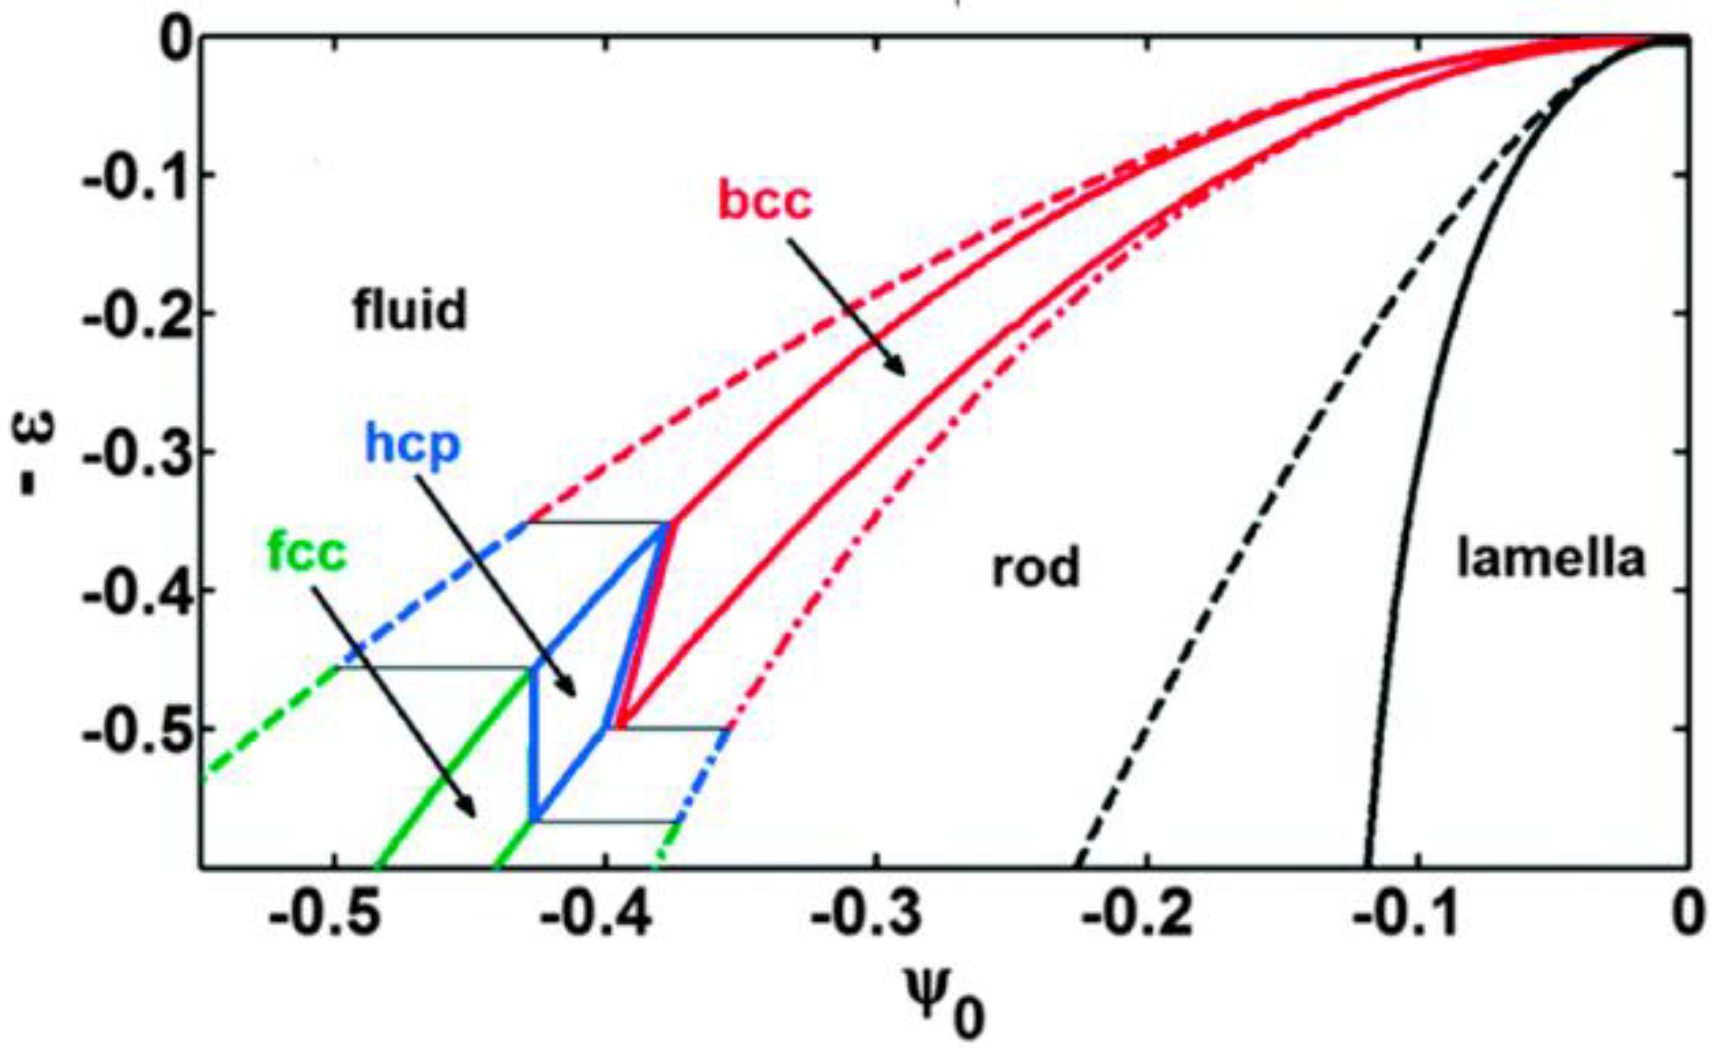
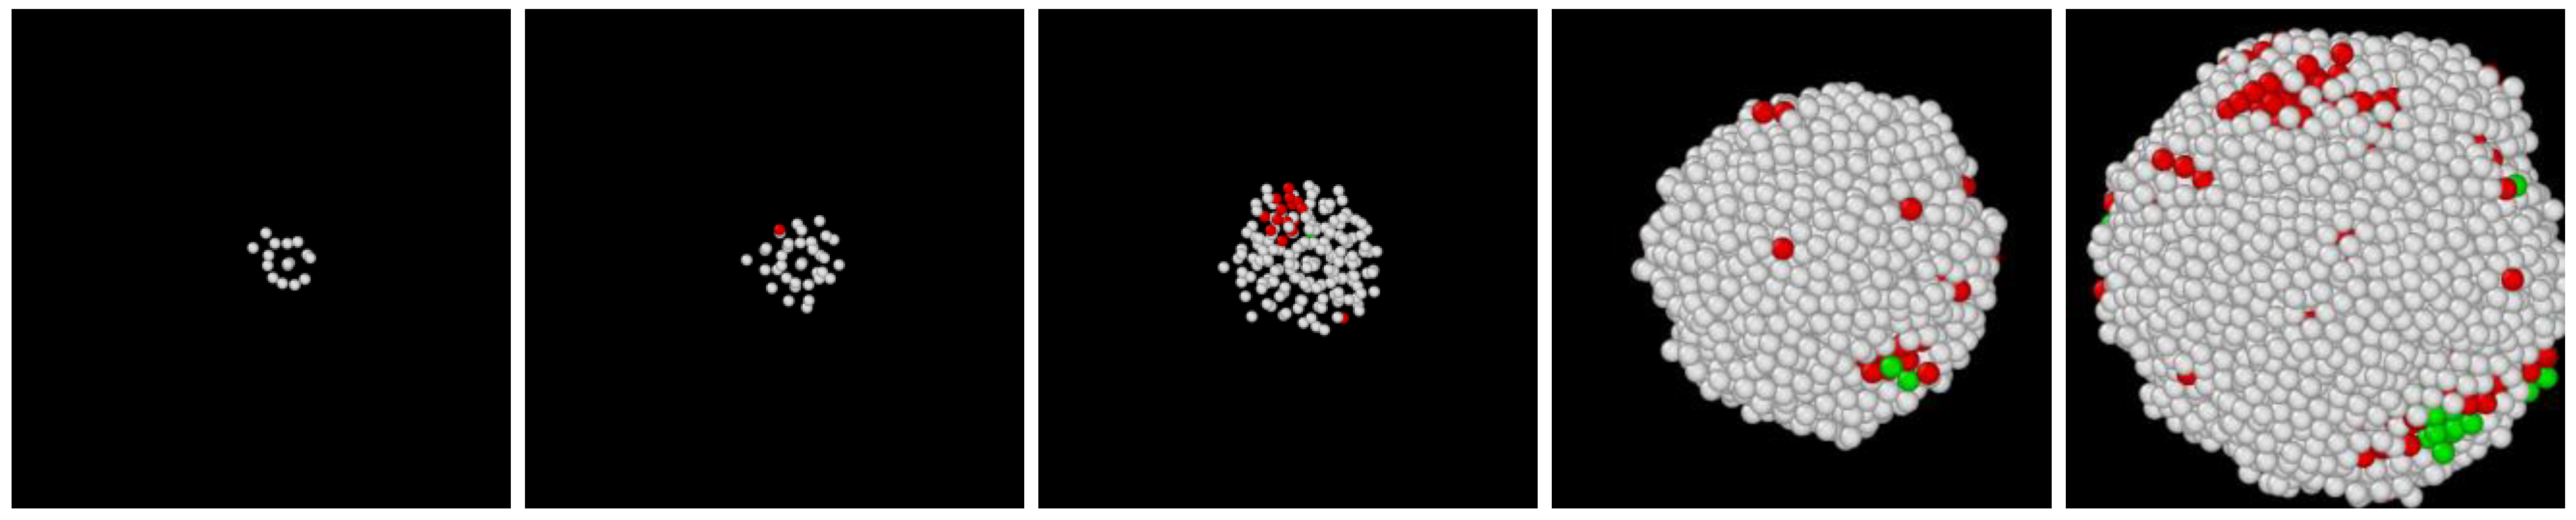
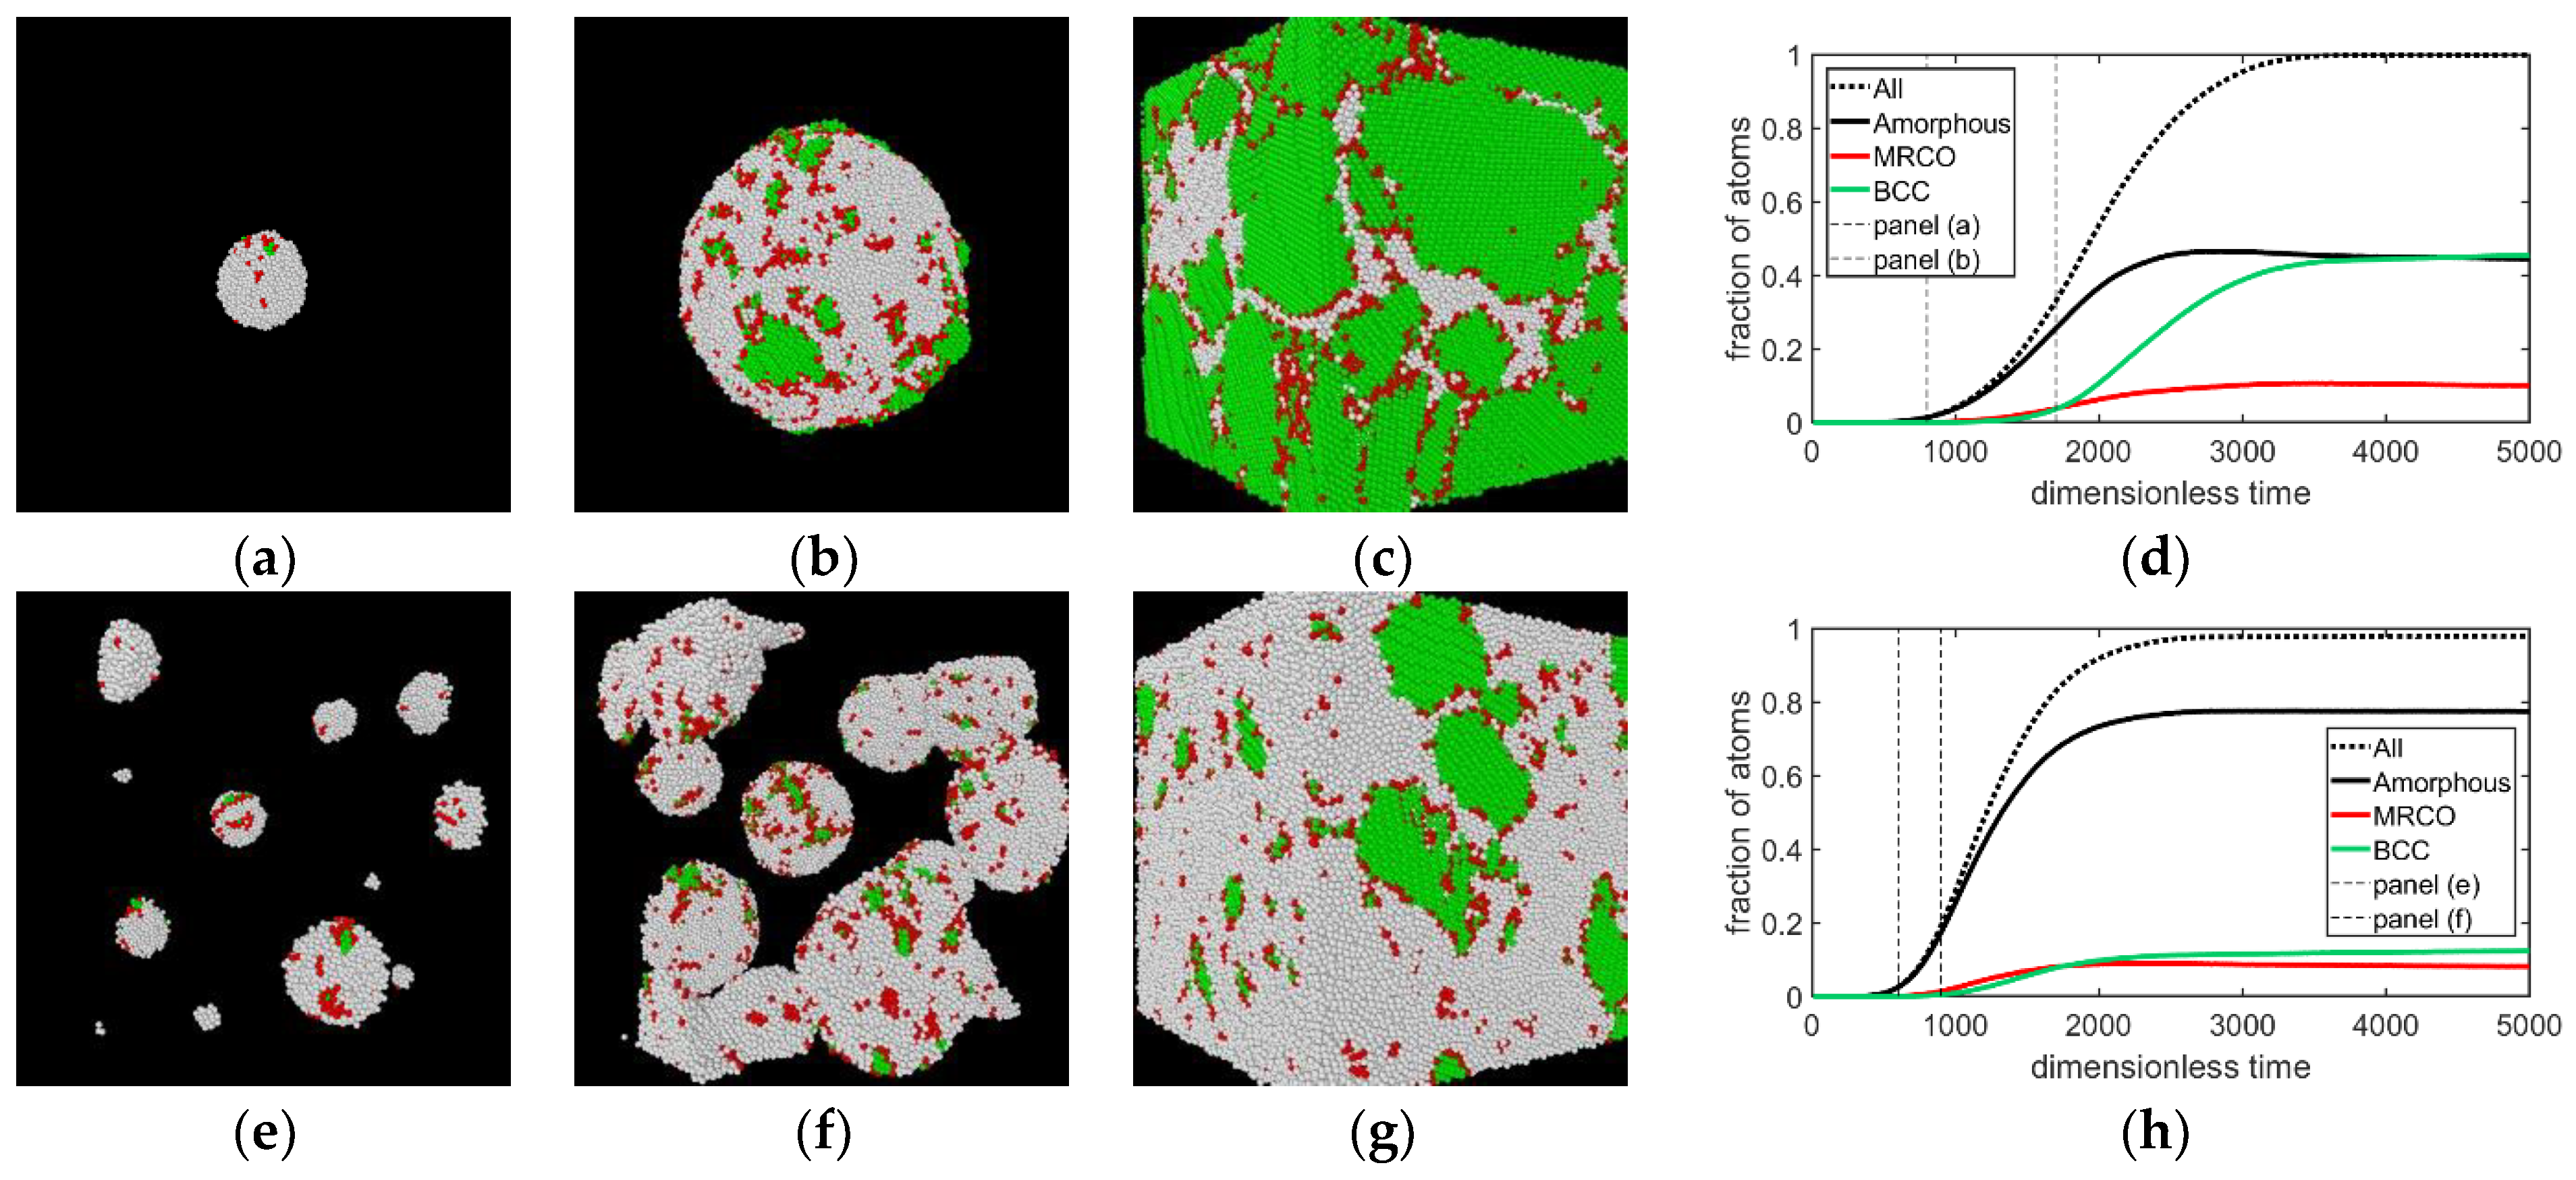
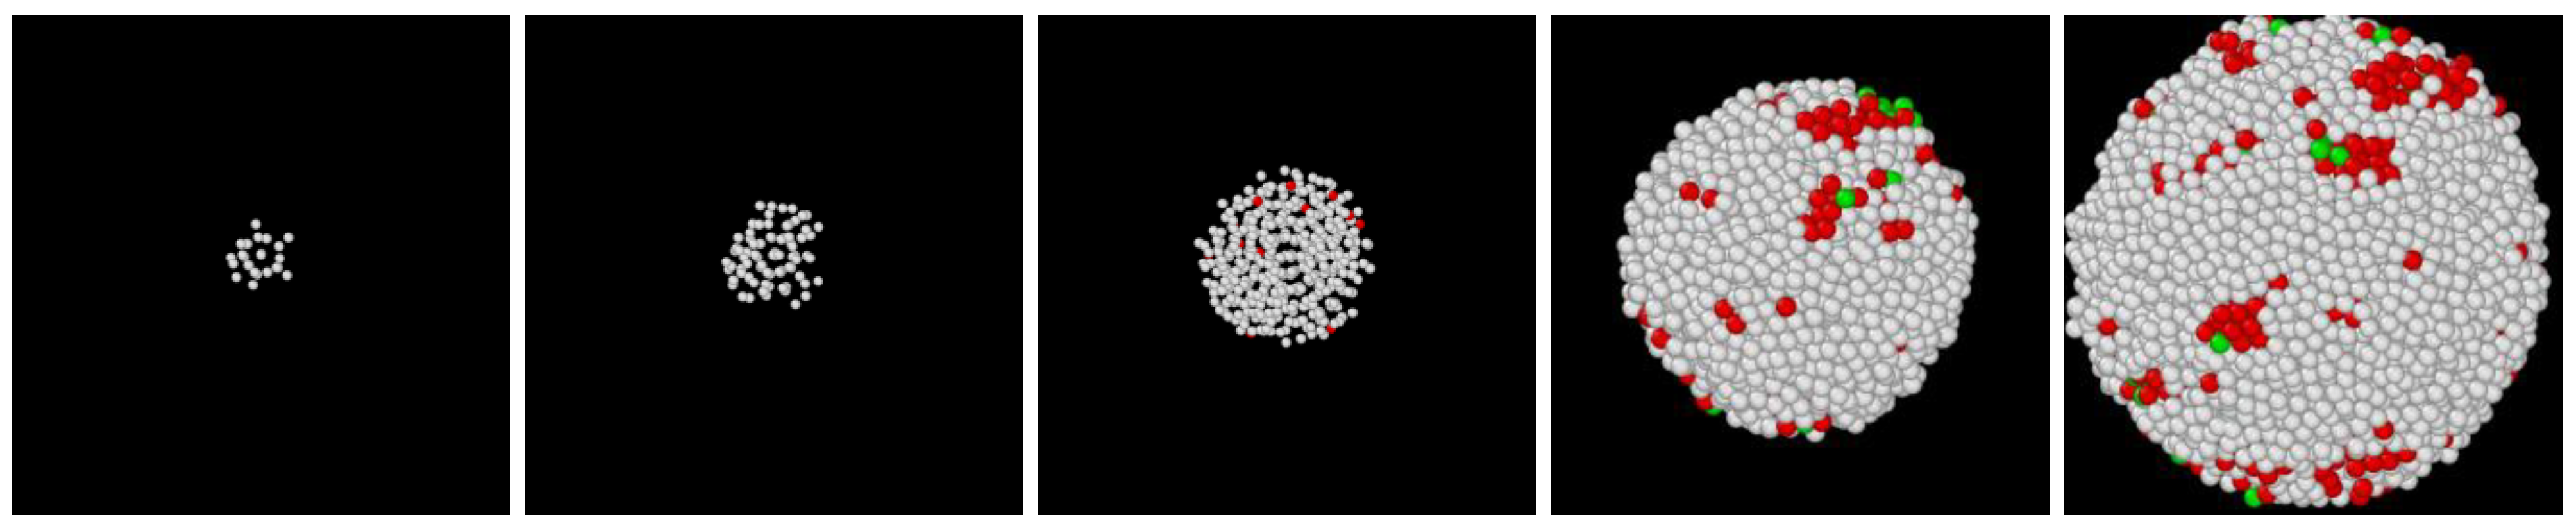
  • In all three models the stable bcc phase appears via two-step nucleation.
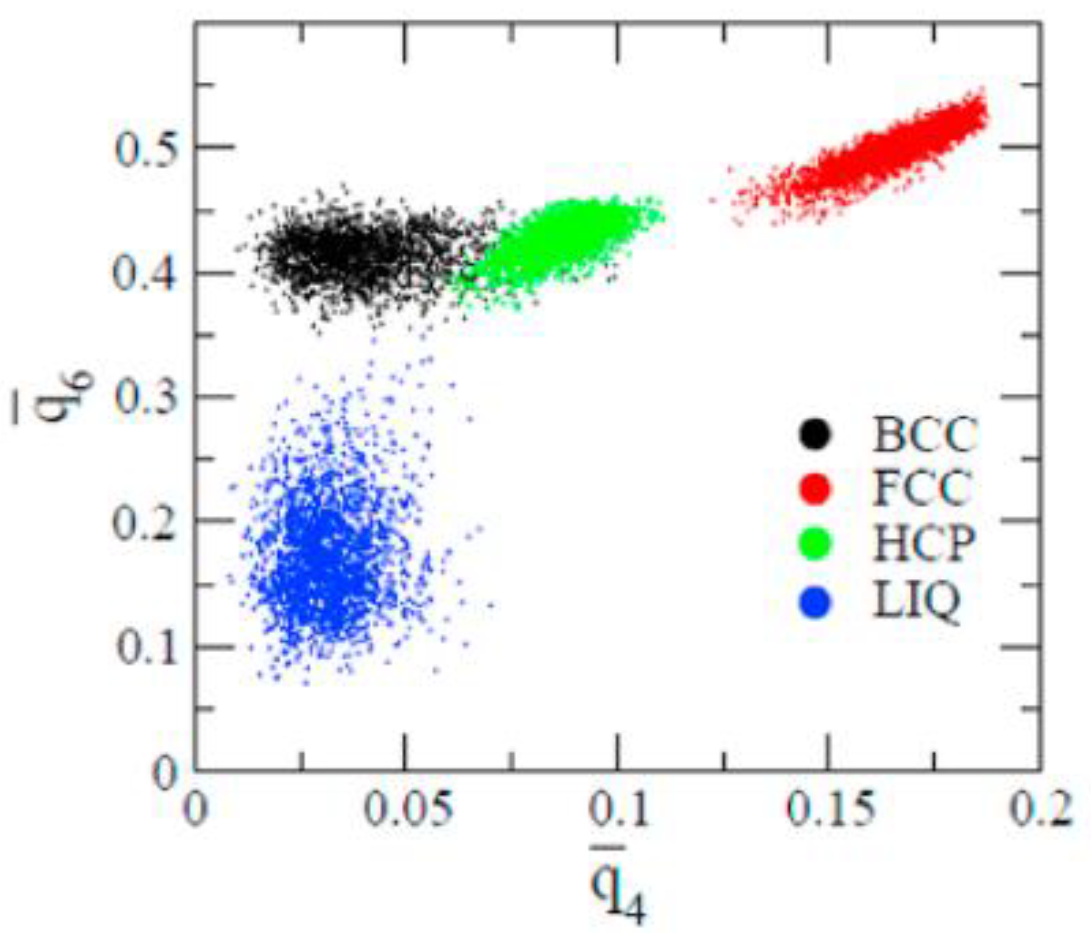
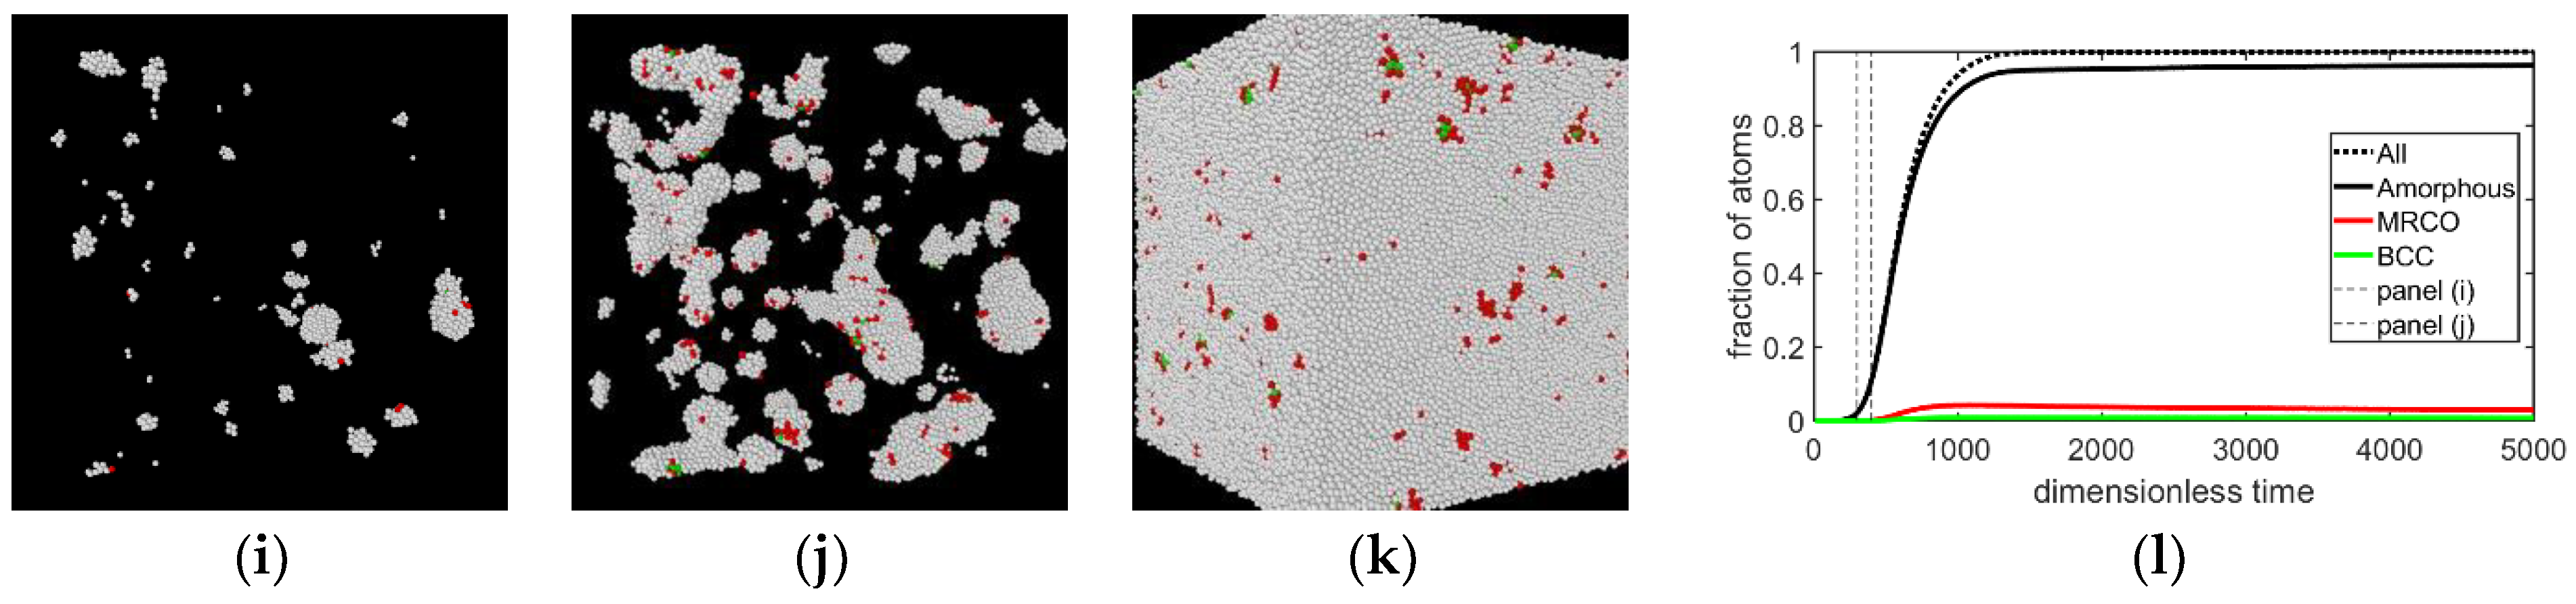
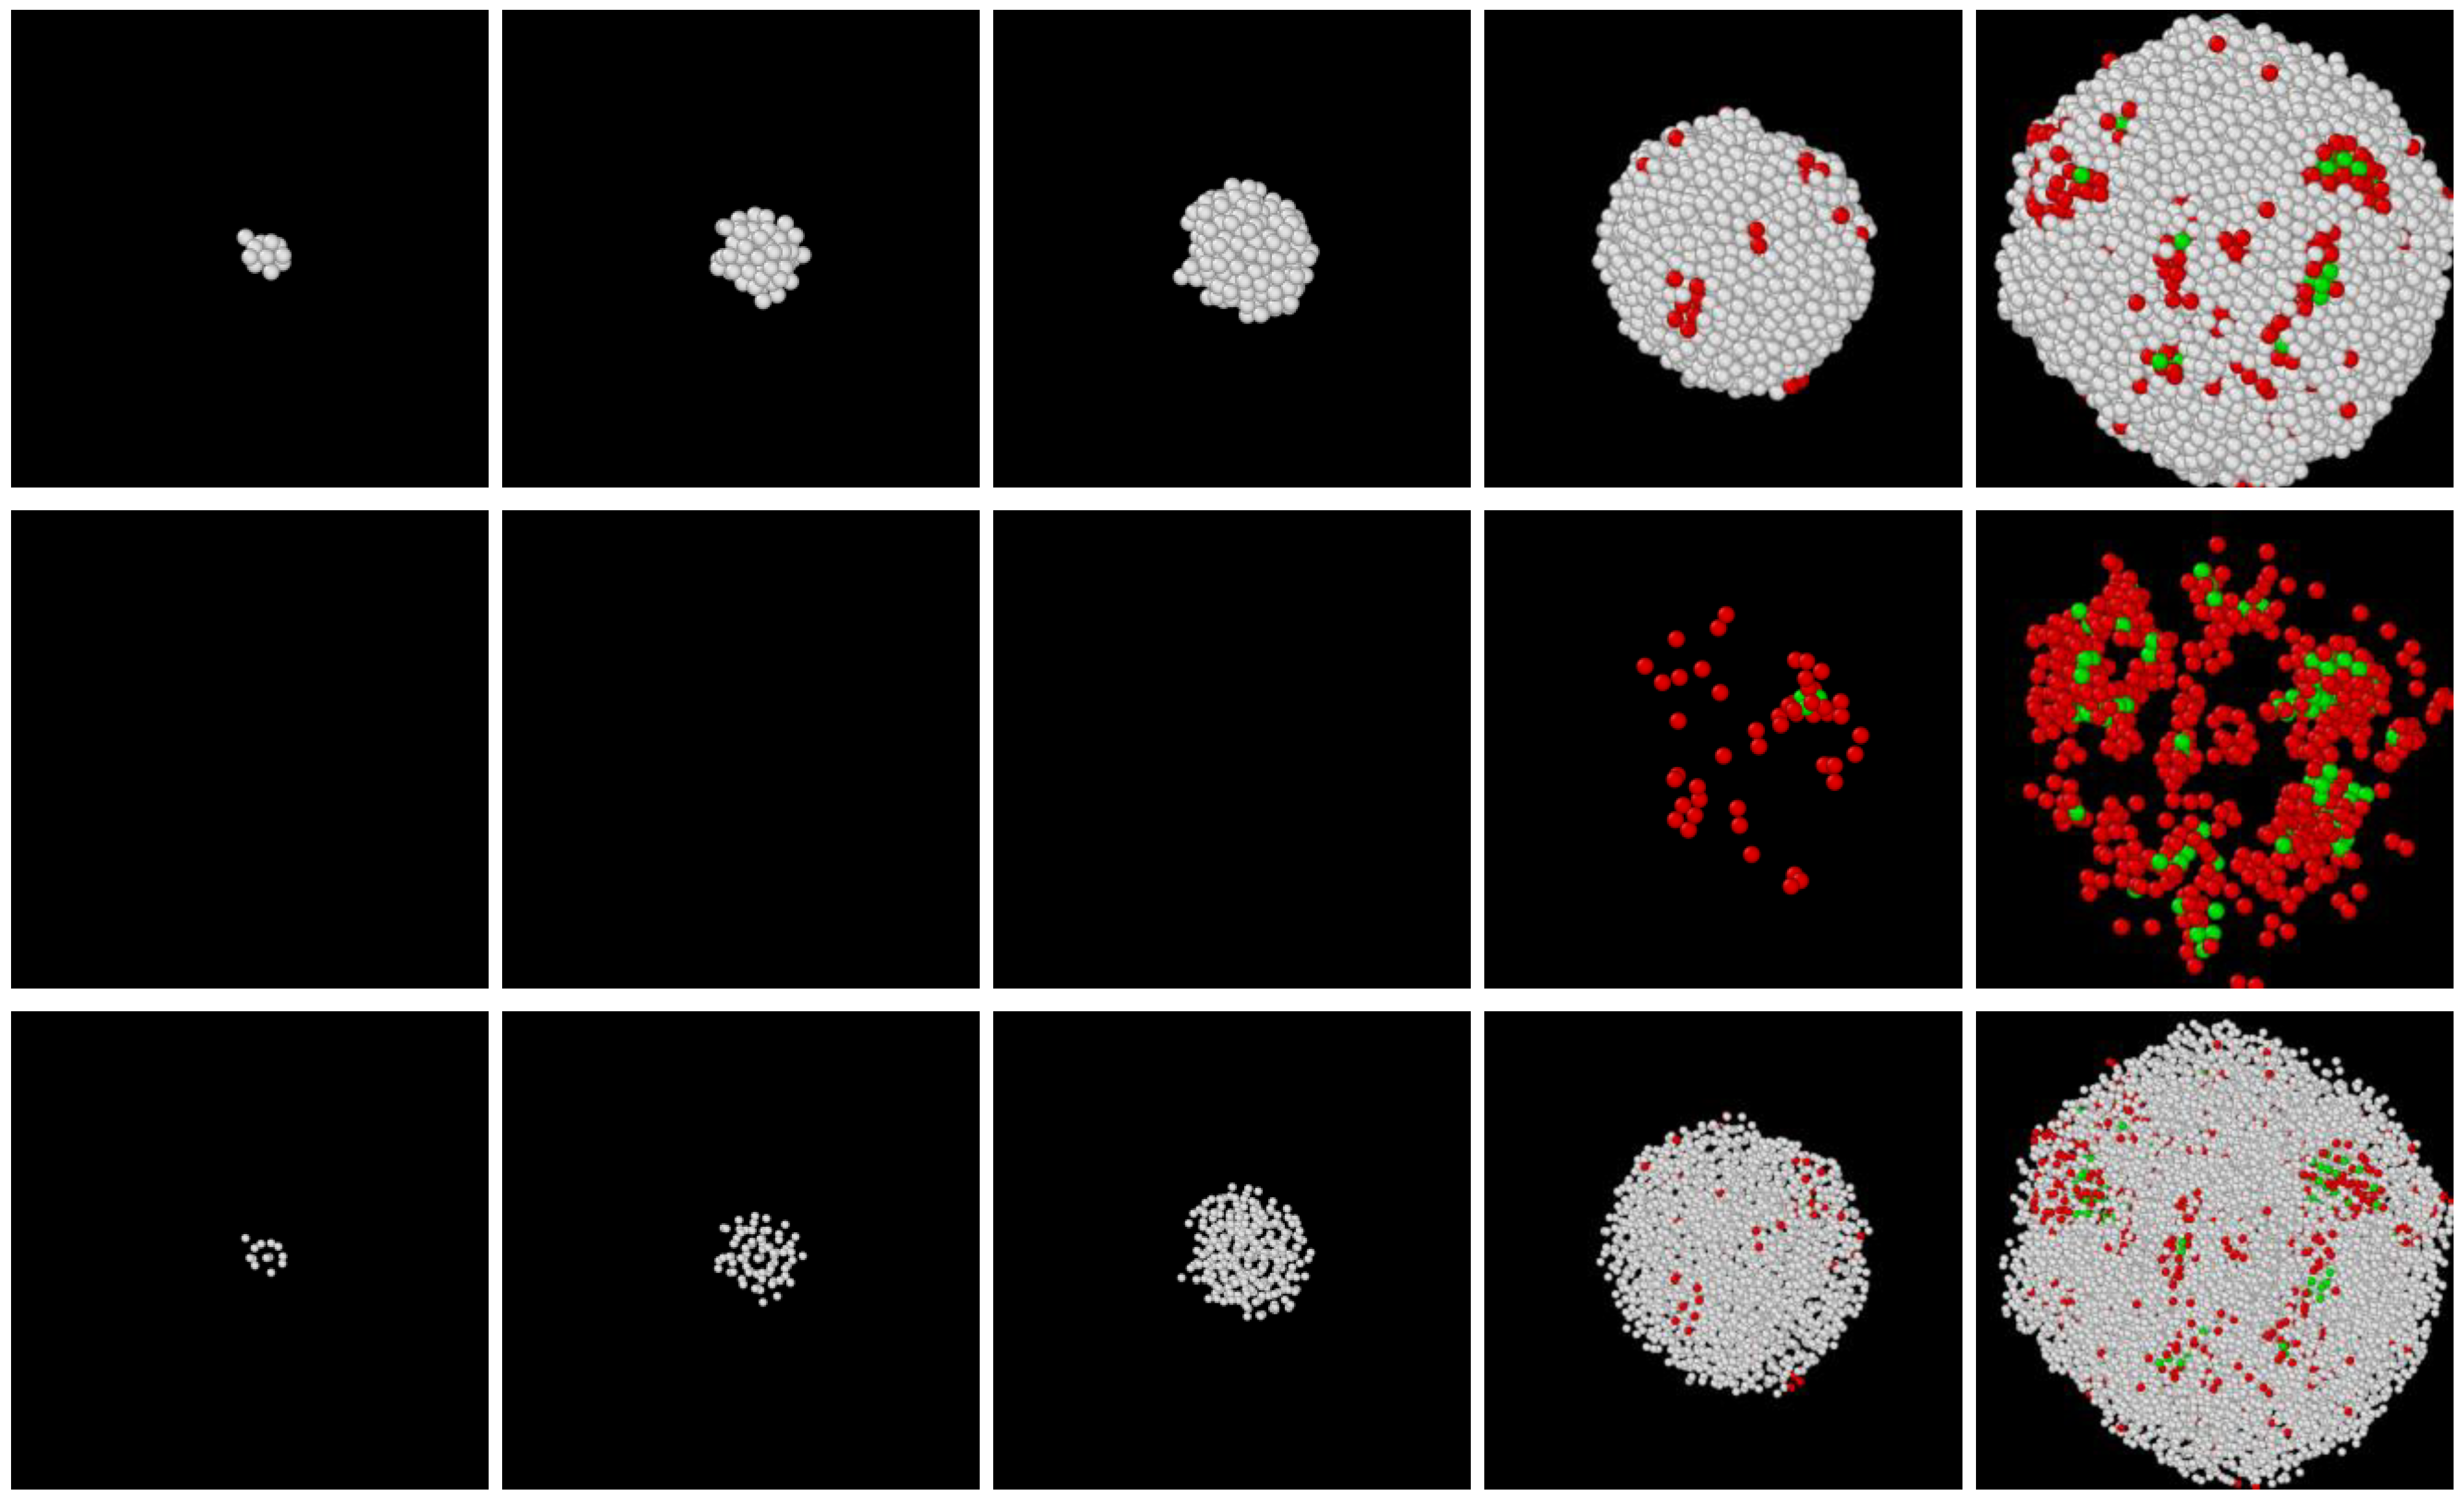
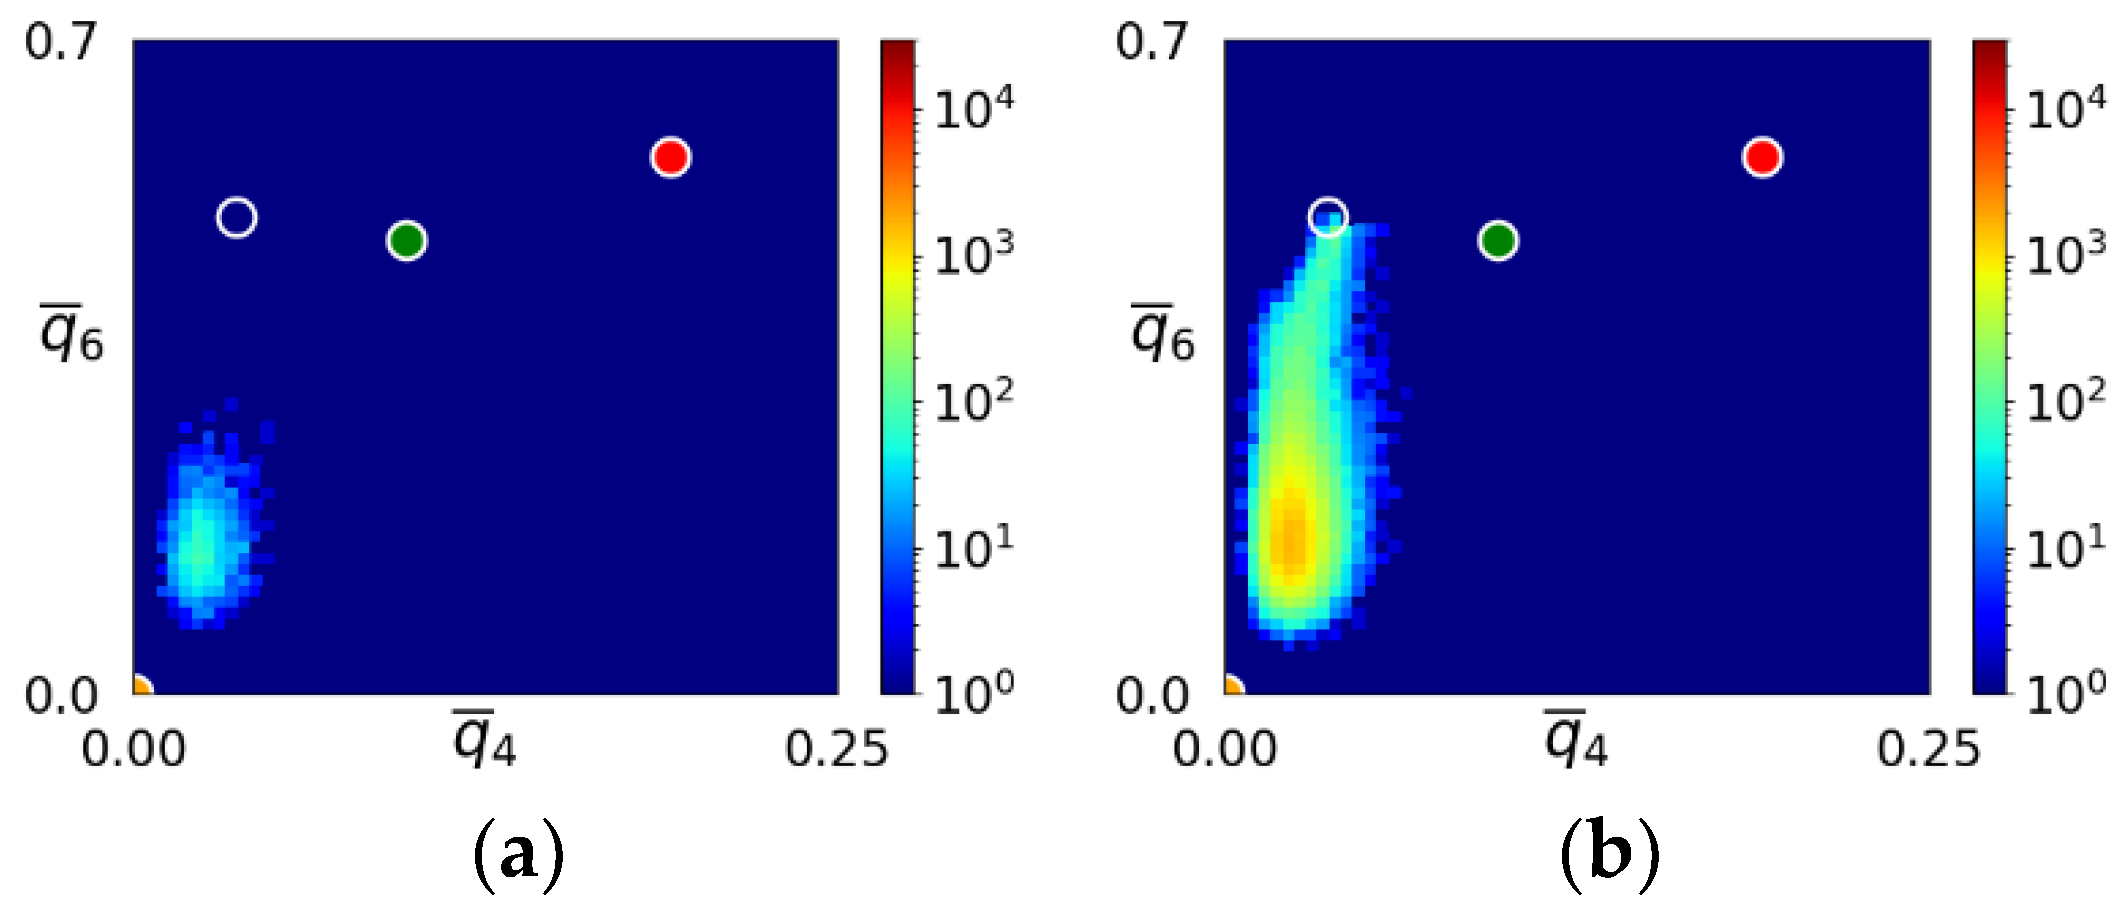
  • During the early stage of nucleation, a disordered solid of liquid-like structure (0.28 > q ¯ 6 ) appears, followed by the formation of MRCO (0.28 < q ¯ 6 < 0.4), which precede the formation of the stable bcc structure.
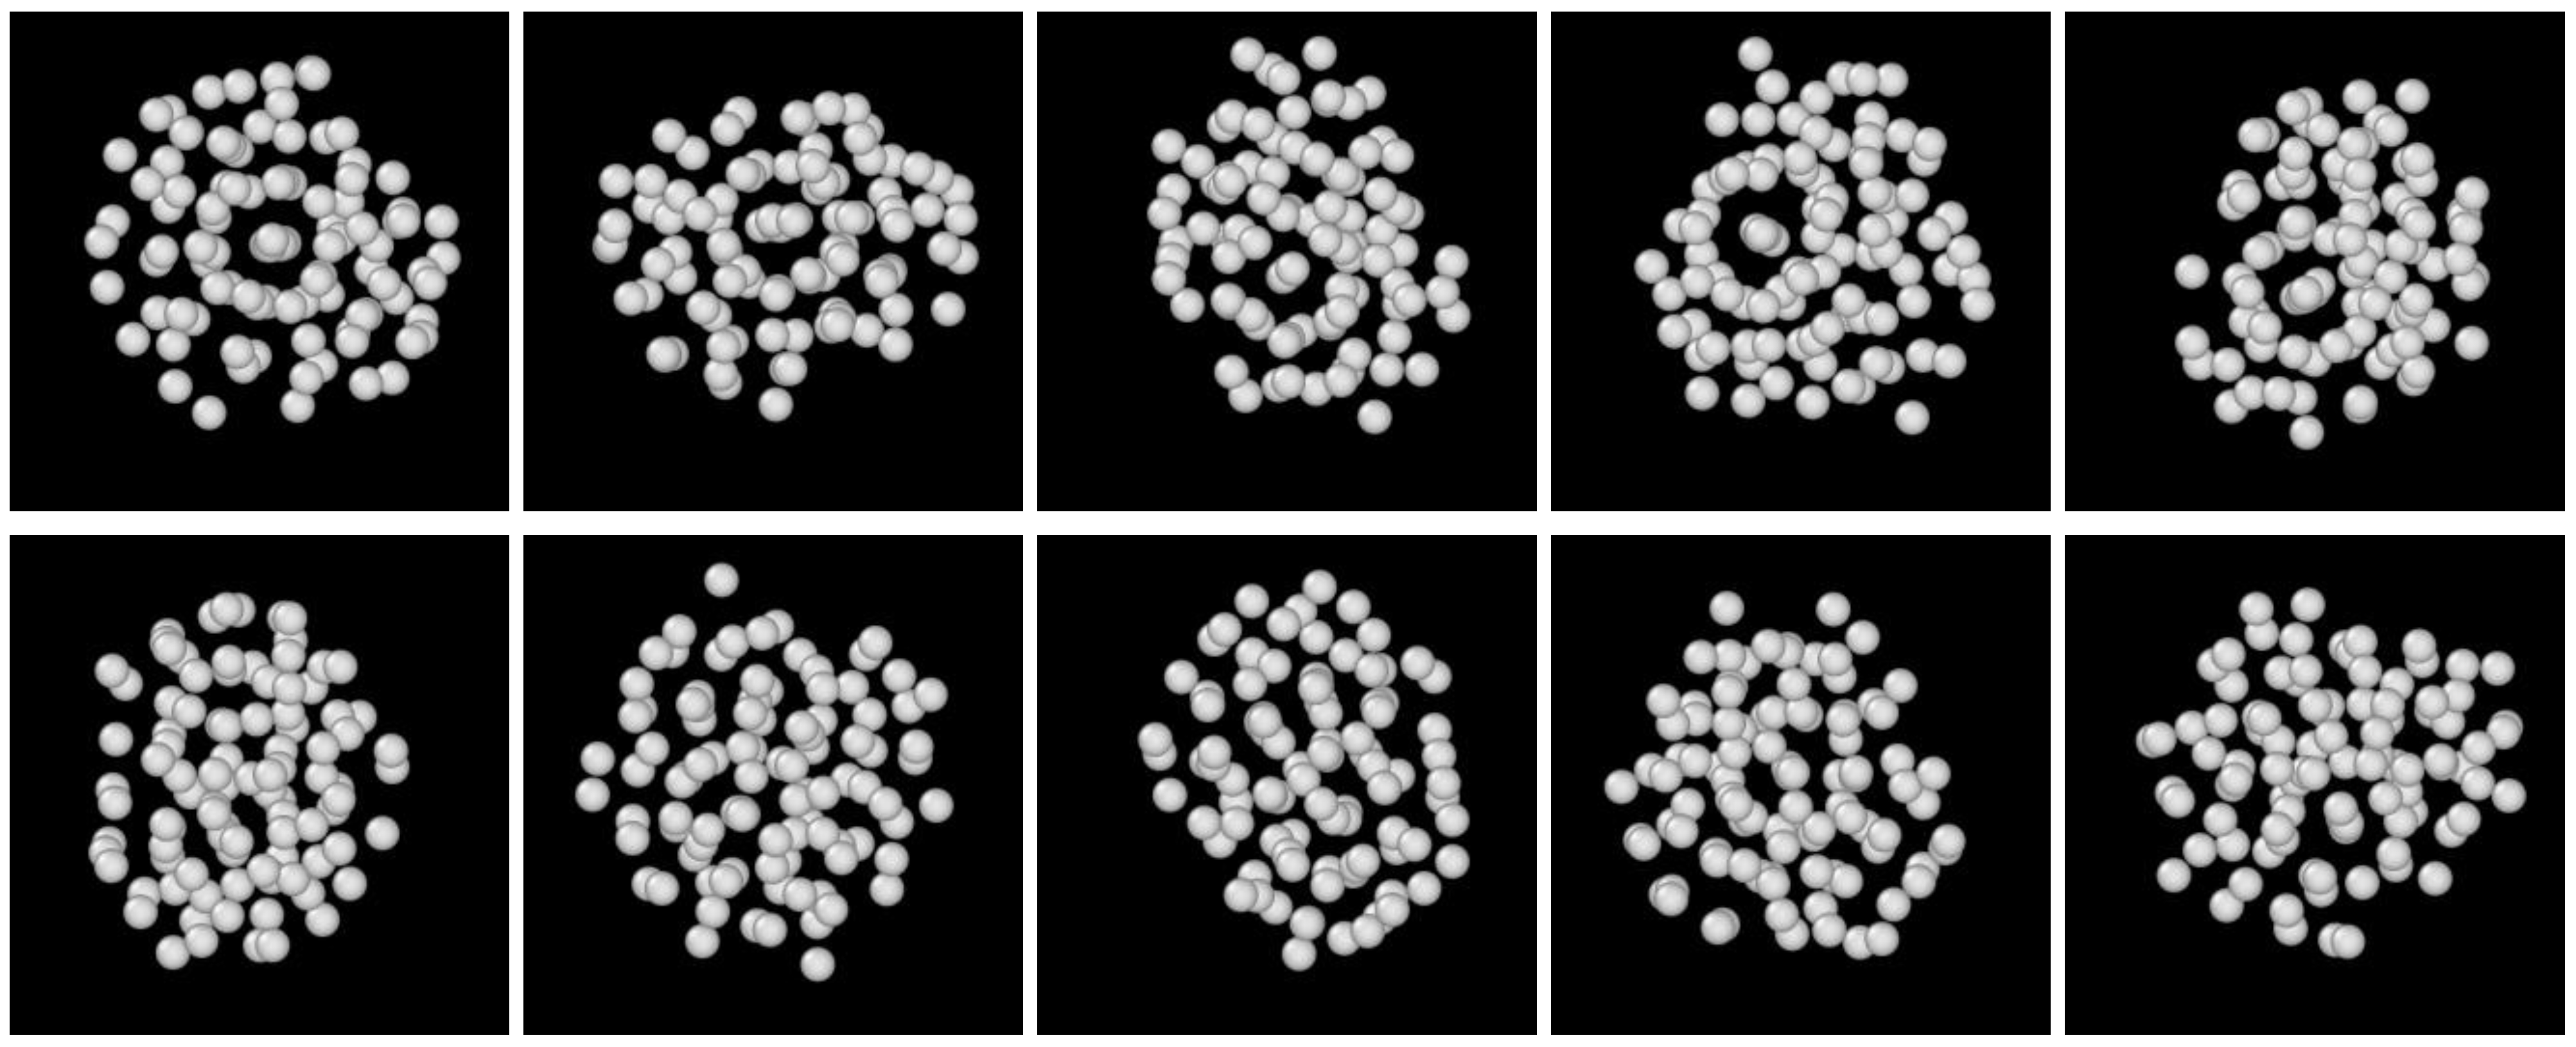
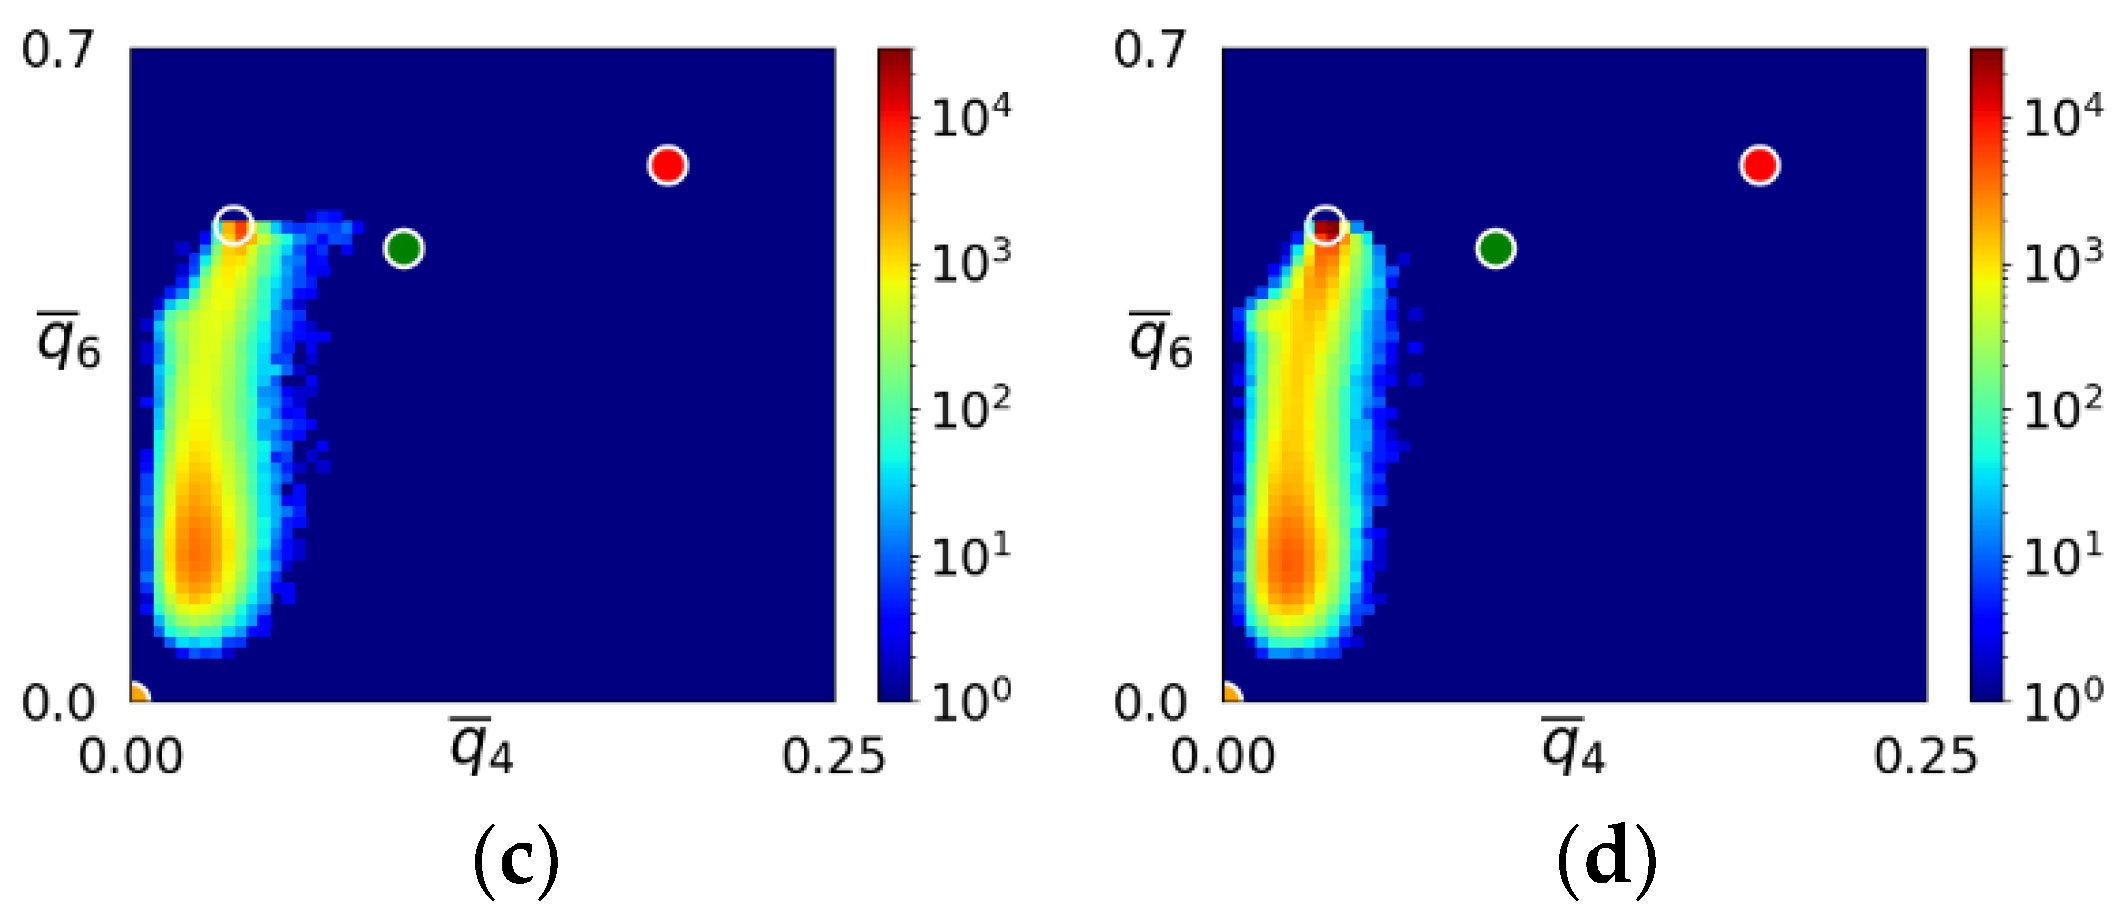
  • The first appearing solid structure is ordered so that it has a concentric ring-like view from certain directions. The number of icosahedral neighborhoods is higher in this domain than in the LJ fluid. This structure may coexist with a disordered solid structure of liquid-like order. Remarkably, these two structures are not distinguished by the q ¯ 6 -based color scheme of Kawasaki and Tanaka.
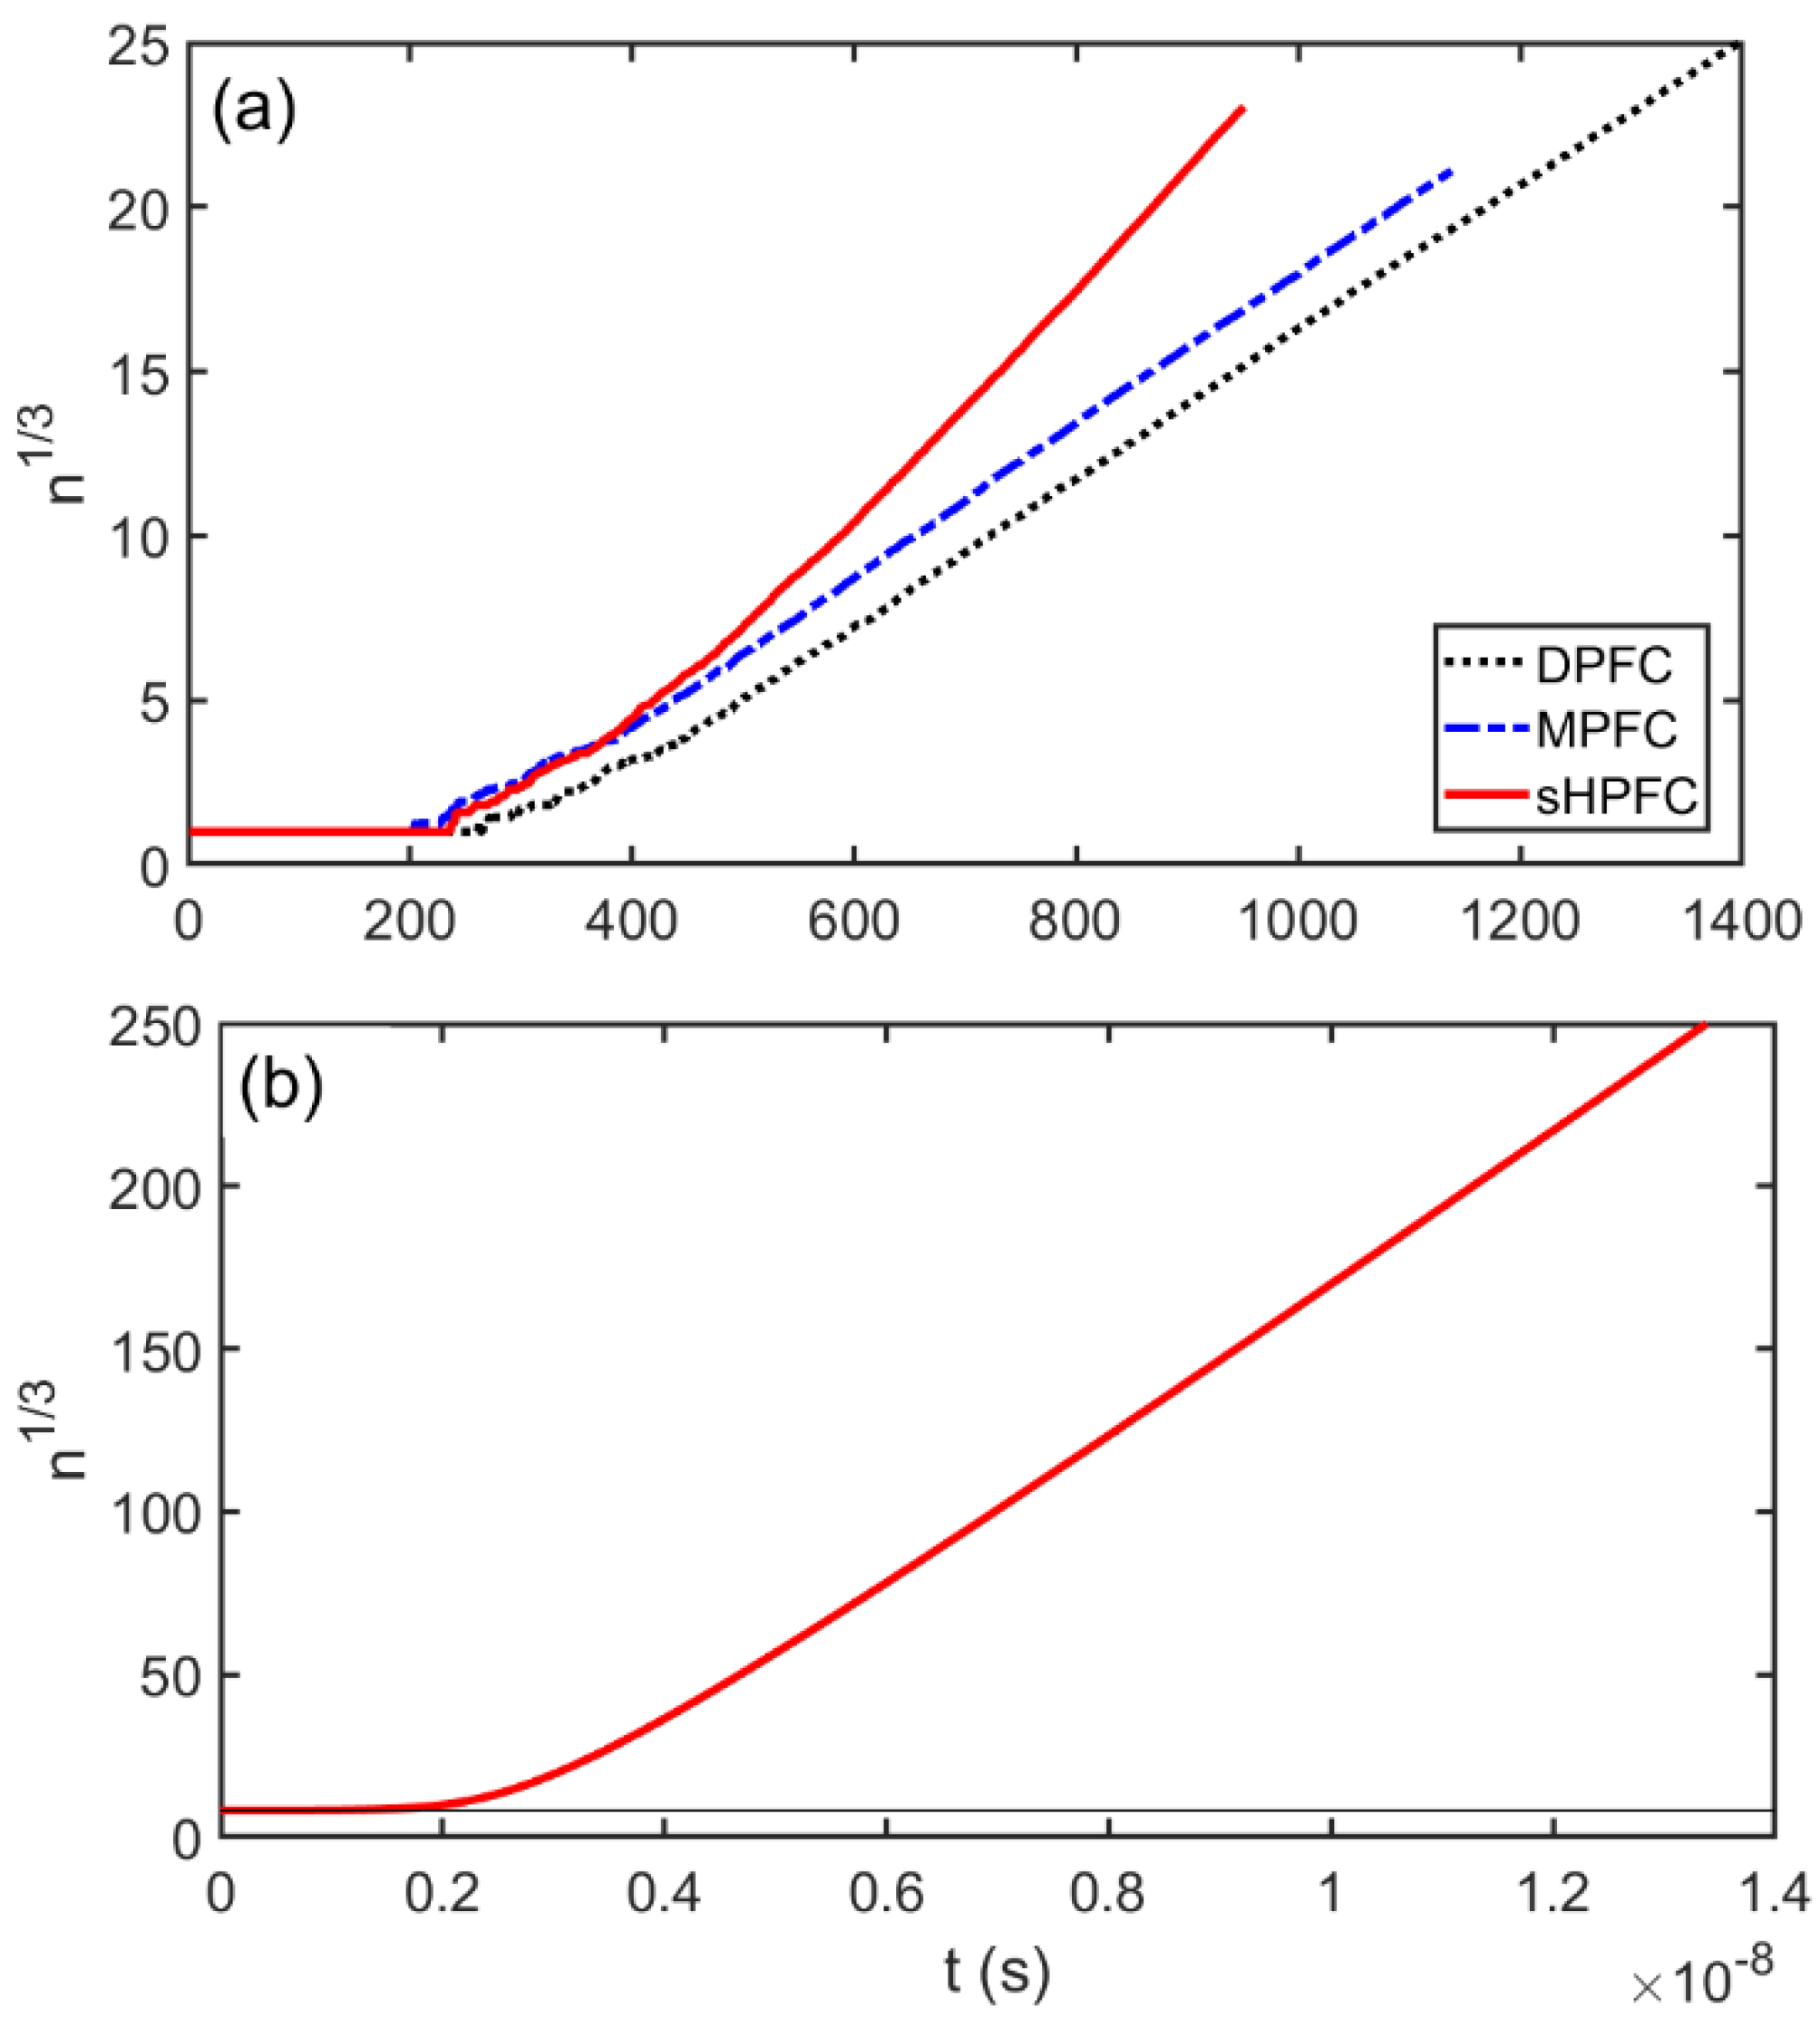
  • The time dependence of grain size emerging from the post-nucleation growth was evaluated from DPFC, MPFC, and sHPFC simulations. At short times the predictions are rather similar to each other and agree reasonably well with the dependence obtained by integrating the size-dependent growth rate given by Equation (1). Differences in the growth mechanism become perceptible only on a longer time scale.
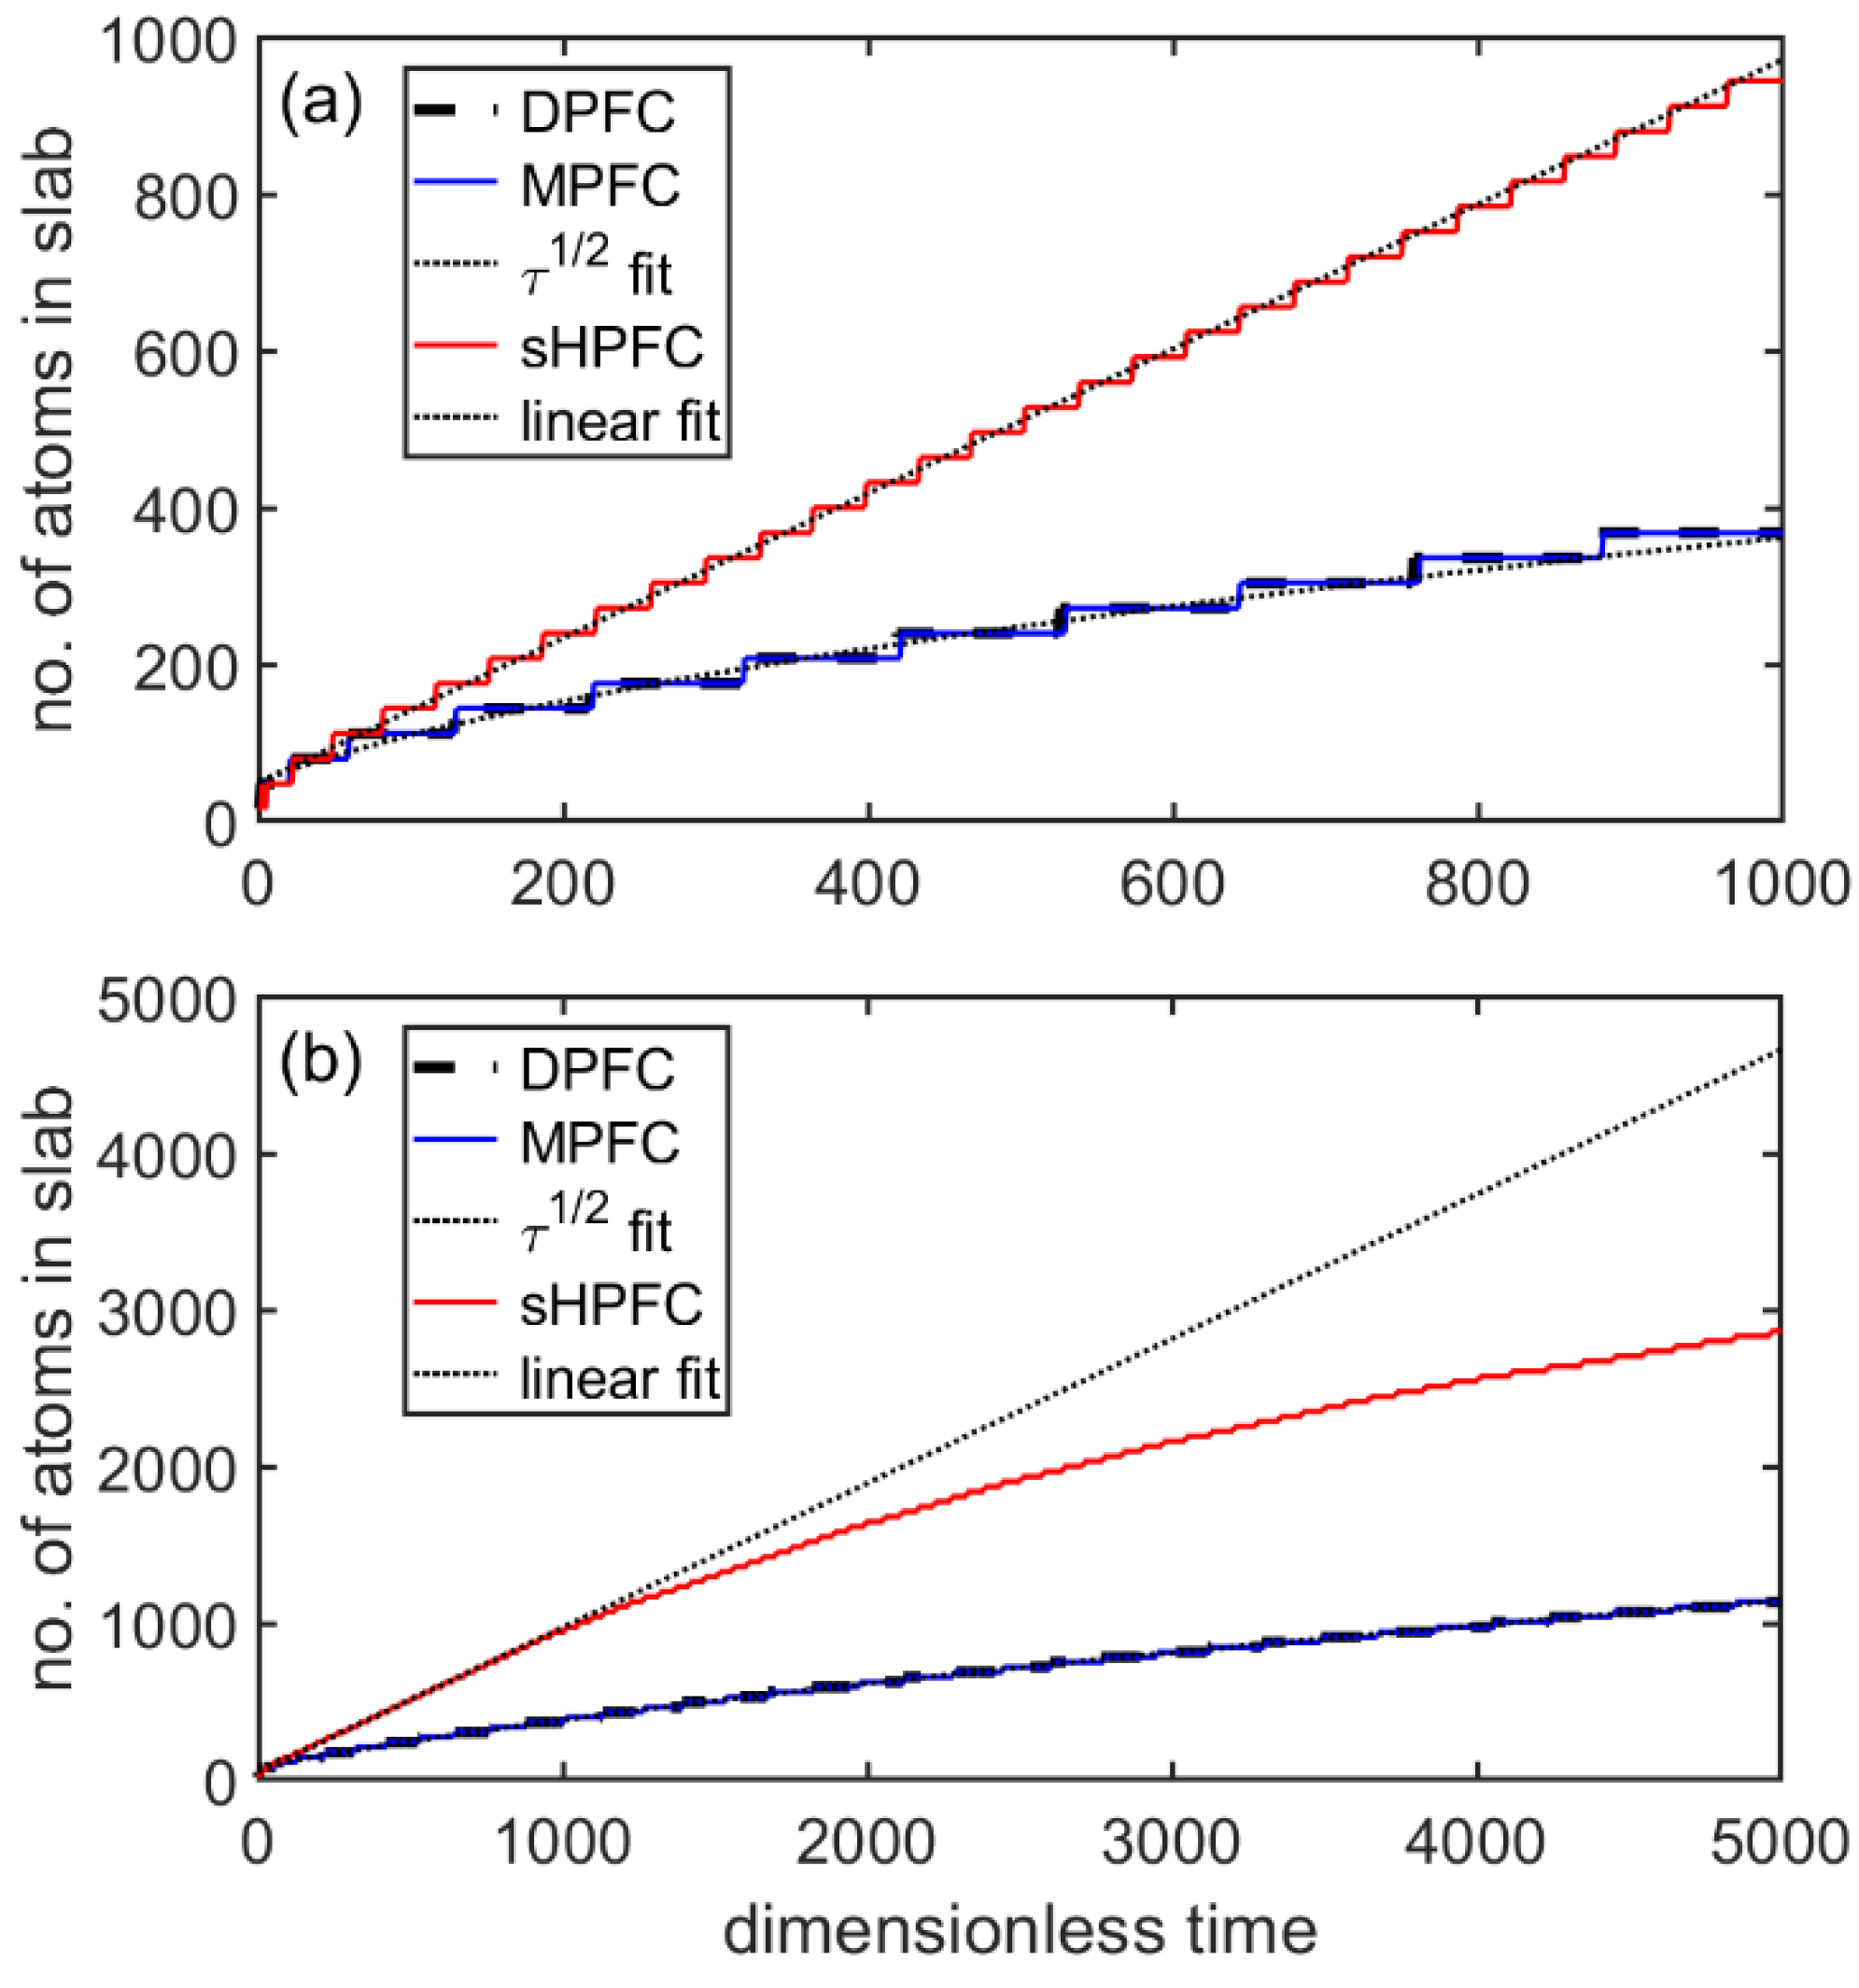
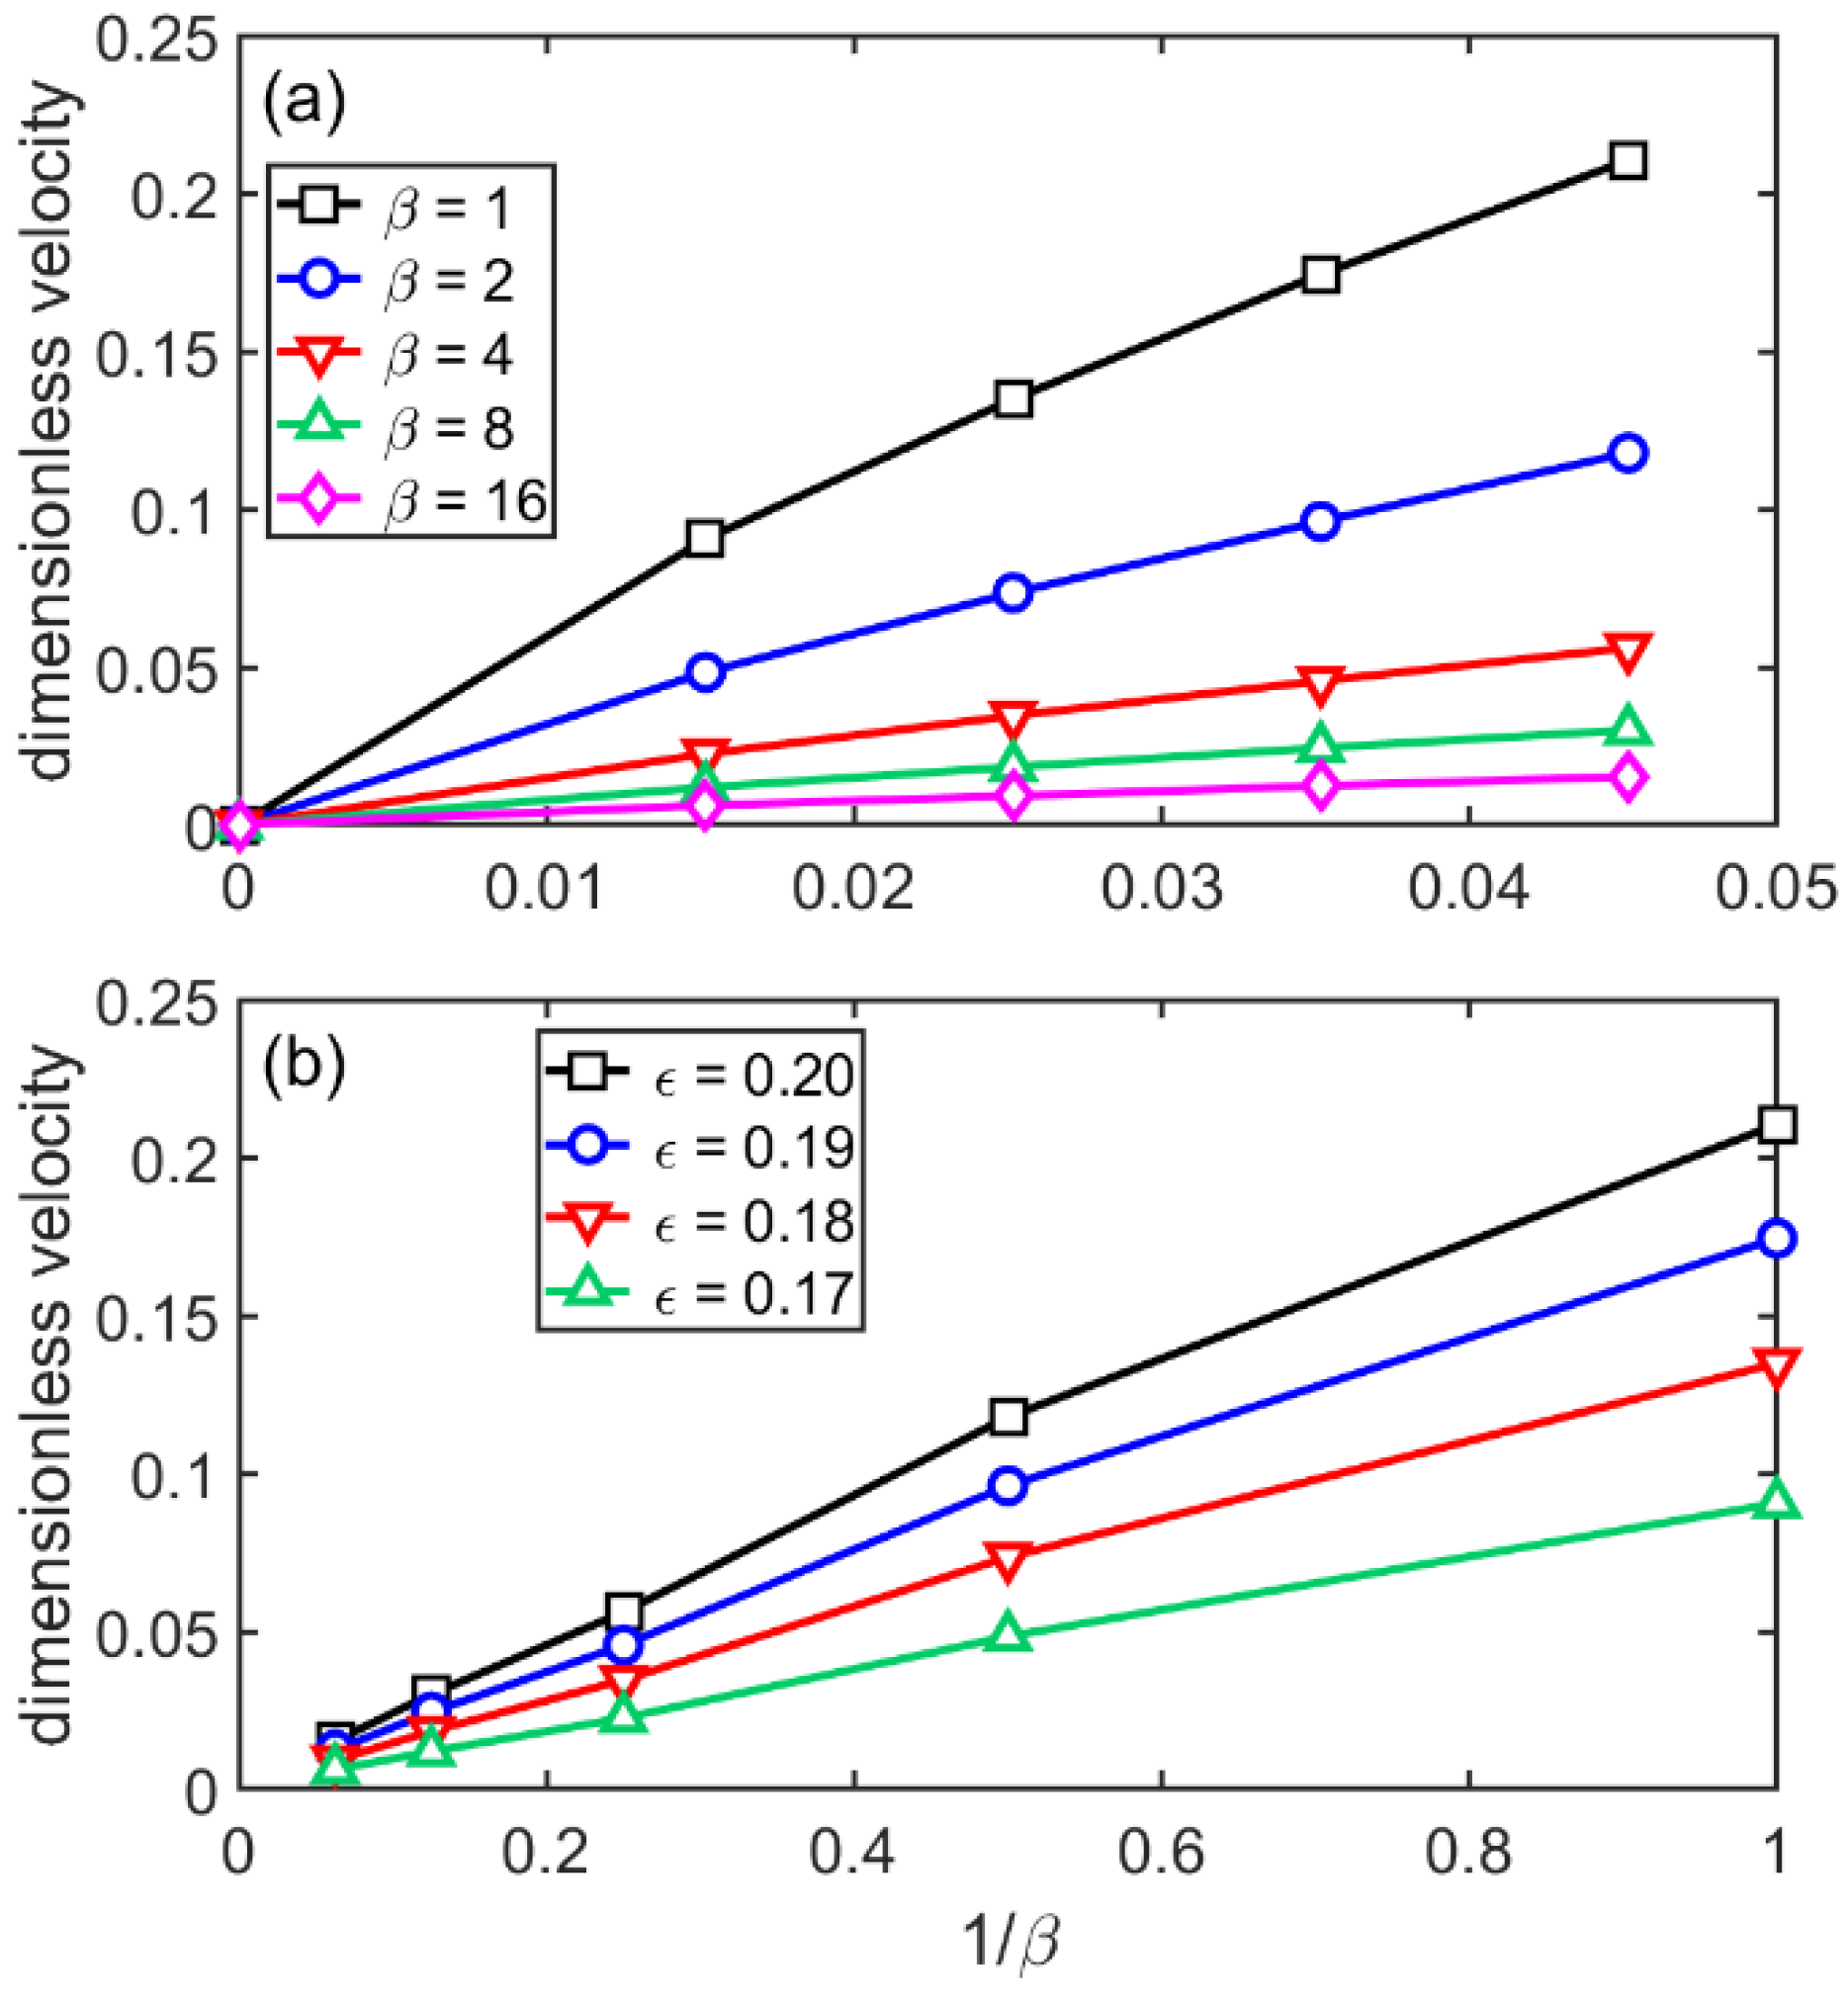
  • The steady-state growth velocity the sHPFC predicts increasingly deviates downwards from a linear relationship with increasing undercooling, and it is roughly inversely proportional to the viscosity.
  • Finally, we note that nucleation and the post nucleation behavior appear to be less sensitive to the mechanism of density relaxation than the kinetics of crystal growth. This is so, despite the fact that in the present studies the nucleation that took place via intermediate states preferred kinetically relative to direct bcc nucleation.

Author Contributions

F.P. performed the model development, numerical implementation, testing, and the computations, and wrote the original manuscript; L.G. reviewed the manuscript and supervised the work. All authors have read and agreed to the published version of the manuscript.

Funding

This work was supported by the National Agency for Research, Development, and Innovation (NKFIH), Hungary under contract No. KKP-126749.

Data Availability Statement

Data available on request due to restrictions, e.g., privacy or ethical.

Acknowledgments

Research infrastructure was provided by the Hungarian Academy of Sciences (MTA).

Conflicts of Interest

The authors declare no conflict of interest.

References

  1. Herlach, D.M. Colloids as Model Systems for Metals and Alloys: A Case Study of Crystallization. Eur. Phys. J. Spec. Top. 2014, 223, 591–608. [Google Scholar] [CrossRef]
  2. Yethiraj, A. Tunable Colloids: Control of Colloidal Phase Transitions with Tunable Interactions. Soft Matter 2007, 3, 1099–1115. [Google Scholar] [CrossRef] [PubMed] [Green Version]
  3. Gasser, U.; Weeks, E.R.; Schofield, A.; Pusey, P.N.; Weitz, D.A. Real-Space Imaging of Nucleation and Growth in Colloidal Crystallization. Science 2001, 292, 258–262. [Google Scholar] [CrossRef] [PubMed] [Green Version]
  4. Prasad, V.; Semwogerere, D.; Weeks, E.R. Confocal Microscopy of Colloids. J. Phys. Condens. Matter 2007, 19, 113102. [Google Scholar] [CrossRef]
  5. Schöpe, H.J.; Bryant, G.; van Megen, W. Two-Step Crystallization Kinetics in Colloidal Hard-Sphere Systems. Phys. Rev. Lett. 2006, 96, 175701. [Google Scholar] [CrossRef] [Green Version]
  6. Zhang, T.H.; Liu, X.Y. How Does a Transient Amorphous Precursor Template Crystallization. J. Am. Chem. Soc. 2007, 129, 13520–13526. [Google Scholar] [CrossRef]
  7. Tanaka, H. Roles of Bond Orientational Ordering in Glass Transition and Crystallization. J. Phys. Condens. Matter 2011, 23, 285115. [Google Scholar] [CrossRef]
  8. Tan, P.; Xu, N.; Xu, L. Visualizing Kinetic Pathways of Homogeneous Nucleation in Colloidal Crystallization. Nat. Phys. 2014, 10, 73–79. [Google Scholar] [CrossRef] [Green Version]
  9. Peng, Y.; Wang, F.; Wang, Z.; Alsayed, A.M.; Zhang, Z.; Yodh, A.G.; Han, Y. Two-Step Nucleation Mechanism in Solid–Solid Phase Transitions. Nat. Mater. 2014, 14, 101–108. [Google Scholar] [CrossRef]
  10. Zhang, F. Nonclassical Nucleation Pathways in Protein Crystallization. J. Phys. Condens. Matter 2017, 29, 443002. [Google Scholar] [CrossRef]
  11. Kurz, W.; Fisher, D.J. Fundamentals of Solidification; Trans Tech Publications: Aedermannsdorf, Switzerland, 1998. [Google Scholar]
  12. Dantzig, J.A.; Rappaz, M. Solidification; EPFL Press: Lausanne, Switzerland, 2009. [Google Scholar]
  13. Kelton, K.F.; Greer, A.L. Transient Nucleation Effect in Glass Formation. J. Non Cryst. Solids 1986, 79, 295–309. [Google Scholar] [CrossRef]
  14. Kelton, K.F. Crystal nucleation in liquids and glasses. Solid State Phys. 1991, 45, 75–177. [Google Scholar]
  15. Provatas, N.; Elder, K.R. Phase-Field Methods in Materials Science and Engineering; Wiley-VCH Verlag GmbH & Co. KGaA: Weinheim, Germany, 2010. [Google Scholar]
  16. Elder, K.R.; Katakowski, M.; Haataja, M.; Grant, M. Modeling Elasticity in Crystal Growth. Phys. Rev. Lett. 2002, 88, 245701. [Google Scholar] [CrossRef] [PubMed] [Green Version]
  17. Elder, K.R.; Provatas, N.; Berry, J.; Stefanovic, P.; Grant, M. Phase-Field Crystal Modeling and Classical Density Functional Theory of Freezing. Phys. Rev. B 2007, 75, 064107. [Google Scholar] [CrossRef] [Green Version]
  18. Emmerich, H.; Löwen, H.; Wittkowski, R.; Gruhn, T.; Tóth, G.I.; Tegze, G.; Gránásy, L. Phase-Field-Crystal Models for Condensed Matter Dynamics on Atomic Length and Diffusive Time Scales: An Overview. Adv. Phys. 2012, 61, 665–743. [Google Scholar] [CrossRef] [Green Version]
  19. Tóth, G.I.; Gránásy, L.; Tegze, G. Nonlinear Hydrodynamic Theory of Crystallization. J. Phys. Condens. Matter 2014, 26, 055001. [Google Scholar] [CrossRef] [PubMed] [Green Version]
  20. Podmaniczky, F.; Tóth, G.I.; Tegze, G.; Gránásy, L. Hydrodynamic Theory of Freezing: Nucleation and Polycrystalline Growth. Phys. Rev. E 2017, 95, 052801. [Google Scholar] [CrossRef] [PubMed] [Green Version]
  21. Tegze, G.; Gránásy, L.; Tóth, G.I.; Podmaniczky, F.; Jaatinen, A.; Ala Nissila, T.; Pusztai, T. Diffusion-Controlled Anisotropic Growth of Stable and Metastable Crystal Polymorphs in the Phase-Field Crystal Model. Phys. Rev. Lett. 2009, 103, 035702. [Google Scholar] [CrossRef] [PubMed] [Green Version]
  22. Tegze, G.; Tóth, G.I.; Gránásy, L. Faceting and Branching in 2D Crystal Growth. Phys. Rev. Lett. 2011, 106, 195502. [Google Scholar] [CrossRef] [Green Version]
  23. Tegze, G.; Gránásy, L.; Tóth, G.I.; Douglas, J.F.; Pusztai, T. Tuning the Structure of Non-Equilibrium Soft Materials by Varying the Thermodynamic Driving Force for Crystal Ordering. Soft Matter 2011, 7, 1789–1799. [Google Scholar] [CrossRef] [Green Version]
  24. Backofen, R.; Voigt, A. A Phase-Field-Crystal Approach to Critical Nuclei. J. Phys. Condens. Matter 2010, 22, 364104. [Google Scholar] [CrossRef]
  25. Backofen, R.; Voigt, A. A Phase Field Crystal Study of Heterogeneous Nucleation–Application of the String Method. Eur. Phys. J. Special Top. 2014, 223, 497–509. [Google Scholar] [CrossRef]
  26. Berry, J.; Elder, K.R.; Grant, M. Simulation of an Atomistic Dynamic Field Theory for Monatomic Liquids: Freezing and Glass Formation. Phys. Rev. E 2008, 77, 061506. [Google Scholar] [CrossRef] [Green Version]
  27. Tóth, G.I.; Tegze, G.; Pusztai, T.; Tóth, G.; Gránásy, L. Polymorphism, Crystal Nucleation and Growth in the Phase-Field Crystal Model in 2D and 3D. J. Phys. Condens. Matter 2010, 22, 364101. [Google Scholar] [CrossRef]
  28. Tóth, G.I.; Pusztai, T.; Tegze, G.; Tóth, G.; Gránásy, L. Amorphous Nucleation Precursor in Highly Nonequilibrium Fluids. Phys. Rev. Lett. 2011, 107, 175702. [Google Scholar] [CrossRef] [Green Version]
  29. Podmaniczky, F.; Tóth, G.I.; Tegze, G.; Pusztai, T.; Gránásy, L. Phase-Field Crystal Modeling of Heteroepitaxy and Exotic Modes of Crystal Nucleation. J. Cryst. Growth 2017, 457, 24–31. [Google Scholar] [CrossRef] [Green Version]
  30. Gránásy, L.; Tóth, G.I.; Warren, J.A.; Podmaniczky, F.; Tegze, G.; Rátkai, L.; Pusztai, T. Phase-Field Modeling of Crystal Nucleation in Undercooled Liquids–A Review. Prog. Mater. Sci. 2020, 106, 100569. [Google Scholar] [CrossRef]
  31. Te Vrugt, M.; Löwen, H.; Wittkowski, R. Classical Dynamical Density Functional Theory: From Fundamentals to Applications. Adv. Phys. 2020, 69, 121–247. [Google Scholar] [CrossRef]
  32. Ramakrishnan, T.V.; Yussouff, M. First-Principles Order-Parameter Theory of Freezing. Phys. Rev. B 1979, 19, 2775–2794. [Google Scholar] [CrossRef]
  33. Van Teeffelen, S.; Backofen, R.; Voigt, A.; Löwen, H. Derivation of the Phase-Field-Crystal Model for Colloidal Solidification. Phys. Rev. E 2009, 79, 051404. [Google Scholar] [CrossRef]
  34. Jaatinen, A.; Ala-Nissila, T. Extended Phase Diagram of the Three-Dimensional Phase Field Crystal Model. J. Phys. Condens. Matter 2010, 22, 205402. [Google Scholar] [CrossRef] [PubMed]
  35. Landau, L.D.; Lifshitz, E.M. Fluid Mechanics; Pergamon: New York, NY, USA, 1959. [Google Scholar]
  36. Shang, B.Z.; Voulgarakis, N.K.; Chu, J.-W. Fluctuating Hydrodynamics for Multiscale Simulation of Inhomogeneous Fluids: Mapping All-Atom Molecular Dynamics to Capillary Waves. J. Chem. Phys. 2011, 135, 044111. [Google Scholar] [CrossRef] [PubMed] [Green Version]
  37. Baskaran, A.; Baskaran, A.; Lowengrub, J. Kinetic Density Functional Theory of Freezing. J. Chem. Phys. 2014, 141, 174506. [Google Scholar] [CrossRef] [Green Version]
  38. Heinonen, V.; Achim, C.V.; Kosterlitz, J.M.; Ying, S.-C.; Lowengrub, J.; Ala-Nissila, T. Consistent Hydrodynamics for Phase Field Crystals. Phys. Rev. Lett. 2016, 116, 024303. [Google Scholar] [CrossRef]
  39. Praetorius, S.; Voigt, A. A Navier-Stokes Phase-Field Crystal Model for Colloidal Suspensions. J. Chem. Phys. 2015, 142, 154904. [Google Scholar] [CrossRef] [Green Version]
  40. Kikkinides, E.S.; Monson, P.A. Dynamic Density Functional Theory with Hydrodynamic Interactions: Theoretical Development and Application in the Study of Phase Separation in Gas-Liquid Systems. J. Chem. Phys. 2015, 142, 094706. [Google Scholar] [CrossRef]
  41. Stefnovic, P.; Haataja, M.; Provatas, N. Phase-Field Crystals with Elastic Interactions. Phys. Rev. Lett. 2006, 96, 225504. [Google Scholar] [CrossRef] [Green Version]
  42. Galenko, P.; Danilov, D.; Lebedev, V. Phase-Field-Crystal and Swift-Hohenberg Equations with Fast Dynamics. Phys. Rev. E 2009, 72, 051110. [Google Scholar] [CrossRef]
  43. Russel, W.B.; Chaikin, P.M.; Zhu, J.; Meyer, W.V.; Rogers, R. Dendritic Growth of Hard Sphere Crystals. Langmuir 1997, 13, 3871–3881. [Google Scholar] [CrossRef]
  44. Wu, K.-A.; Karma, A. Phase-Field Crystal Modeling of Equilibrium BCC-Liquid Interfaces. Phys. Rev. B 2007, 76, 184107. [Google Scholar] [CrossRef] [Green Version]
  45. Jaatinen, A.; Achim, C.V.; Elder, K.R.; Ala-Nissila, T. Thermodynamics of BCC Metals in Phase-Field-Crystal Models. Phys. Rev. E 2009, 80, 031602. [Google Scholar] [CrossRef] [PubMed] [Green Version]
  46. Lechner, W.; Dellago, C. Accurate Determination of Crystal Structures Based on Averaged Local Bond Order Parameters. J. Chem. Phys. 2008, 129, 114707. [Google Scholar] [CrossRef] [PubMed]
  47. Kawasaki, T.; Tanaka, H. Formation of a Crystal Nucleus from Liquid. Proc. Nat. Acad. Sci. USA 2010, 107, 14036–14041. [Google Scholar] [CrossRef] [Green Version]
  48. Barros, K.; Klein, W. Liquid to Solid Nucleation via Onion Structure Droplets. J. Chem. Phys. 2013, 139, 174505. [Google Scholar] [CrossRef] [PubMed] [Green Version]
  49. Dzugutov, M.; Simdyakin, S.I.; Zetterling, F.H.M. Decoupling of Diffusion from Structural Relaxation and Spatial Heterogeneity in a Supercooled Simple Liquid. Phys. Rev. Lett. 2002, 89, 195701. [Google Scholar] [CrossRef] [Green Version]
  50. Elenius, M.; Oppelstrup, T.; Dzugutov, M. Evidence for a Simple Monatomic Ideal Glass Former: The Thermodynamic Glass Transition from a Stable Liquid Phase. J. Chem. Phys. 2010, 133, 174502. [Google Scholar] [CrossRef]
  51. Galenko, P.K.; Sanches, F.J.; Elder, K.R. Traveling Wave Profiles for a Crystalline Front Invading Liquid States: Analytical and Numerical Solutions. Phys. D 2015, 308, 1–10. [Google Scholar] [CrossRef] [Green Version]
  52. Turnbull, D. Formation of Crystal Nuclei in Liquid Metals. J. Appl. Phys. 1950, 21, 1022–1028. [Google Scholar] [CrossRef]
  53. Ankudinov, A.; Galenko, P.K. Growth of Different Faces in a Body Centered Cubic Lattice: A Case of the Phase-Field-Crystal modeling. J. Cryst. Growth 2020, 539, 125608. [Google Scholar] [CrossRef] [Green Version]
Figure 1. Phase diagram of the single-mode phase-field crystal model in 3D. (Reproduced with permission from Reference [30]). Besides the 3D crystalline phases, see the presence of 2D periodic phases such as the triangular rod phase and the lamellar phase.
Crystals 11 00437 g001
Figure 2. q ¯ 4 q ¯ 6 map evaluated from molecular dynamics simulations performed using the Lennard-Jones potential for the bulk bcc, hcp, fcc, and liquid structures. (Reproduced with permission from Reference [46]).
Crystals 11 00437 g002
Figure 3. Nucleation and growth in the sHPFC model after instantaneous quenching to reduced temperatures ε = 0.200 (top row), 0.202 (central row), and 0.204 (bottom row). Coloring indicates the magnitude of the average bond order parameter q ¯ 6 . White (amorphous): q ¯ 6 < 0.28; red (MRCO): 0.28 < q ¯ 6 < 0.4; green (bcc): q ¯ 6 > 0.4. The deeper the quench, the larger the nucleation rate for the amorphous phase, and the smaller the bcc fraction forming during solidification. The bcc phase forms via heterogeneous nucleation on the surface of amorphous globules. Instances for the snapshots—upper row: t = (a) 800, (b) 1700, and (c) 5900; central row: t = (e) 600, (f) 900, (g) 7700; bottom row: t = (i) 300, (j) 400, and (k) 7700. Panels (d,h,l) show the time dependence of phase fractions. The incubation time is not shown.
Crystals 11 00437 g003aCrystals 11 00437 g003b
Figure 4. Snapshots of the q ¯ 4 q ¯ 6 map during solidification in the sHPFC system for the simulation shown in the upper row of Figure 3. The time elapses from left to right. Maps corresponding to dimensionless times t = (a) 800, (b) 1400, (c) 2000, and (d) 5900 are presented. The transparent, green, red, and yellow circles indicate the ideal bcc, hcp, fcc, and icosahedral neighborhoods, respectively. Note the gradual transition from the liquidlike initial amorphous state towards the bcc structure. The “bridge” between the liquidlike and bcc domains indicates transition states corresponding to the MRCO.
Crystals 11 00437 g004aCrystals 11 00437 g004b
Figure 5. Snapshots of a solid cluster forming in a DPFC simulation performed at ε = 0.2 and ψ0 = −0.2720. The snapshots were taken at dimensionless times t = 520, 600, 700, 1000, and 1400. Coloring indicates the magnitude of q ¯ 6 . White (amorphous): q ¯ 6 < 0.28; red (MRCO): 0.28 < q ¯ 6 < 0.4; green (bcc): q ¯ 6 > 0.4. In the upper and central rows atom-size circles denote the density peaks. In the upper row atoms with all three types of neighborhoods are shown, whereas in the central row only particles of MRCO and bcc-type neighborhoods. In agreement with previous results for the DPFC model [28,29,30], the early stage of solidification is dominated by the formation of an amorphous precursor. In the bottom row, we used smaller spheres to indicate the position of the density peaks, which then allows us to see the presence of an ordered but non-crystalline initial structure. The ring-like ordering can only be seen from certain directions. A fraction of a 5123 simulation is shown.
Crystals 11 00437 g005
Figure 6. Snapshots of a solid cluster forming in an MPFC simulation performed under the same conditions as the simulation shown in Figure 5. In the left three panels, small spheres are used to indicate the position of the density peaks, which allows us to see the presence of an ordered but non-crystalline initial structure. On the right atom-size spheres are displayed. The snapshots were taken at dimensionless times t = 460, 500, 600, 900, and 1100. The same coloring is used as in Figure 3. A fraction of a 5123 simulation is shown.
Crystals 11 00437 g006
Figure 7. Snapshots of a solid cluster forming in an sHPFC simulation performed under the same conditions as the simulation shown in Figure 5. In the left three panels, small spheres are used to indicate the position of the density peaks, which allows us to see the presence of an ordered but non-crystalline initial structure. On the right atom-size spheres are displayed. The snapshots were taken at dimensionless times t = 450, 500, 600, 800, and 950. The same coloring is used as in Figure 3. A fraction of a 5123 simulation is shown.
Crystals 11 00437 g007
Figure 8. Different views of an early-stage cluster from the sHPFC simulation shown in Figure 7. The snapshots were taken at a dimensionless time of t = 550. Views in the upper row show some degree of order, combined with disorder, whereas structural order in the bottom row is less obvious. A fraction of a 5123 simulation is shown.
Crystals 11 00437 g008
Figure 9. Post-nucleation growth: (a) effective linear size vs. time for the clusters shown in Figure 5, Figure 6 and Figure 7; (b) effective linear size vs. time for an iron cluster nucleated at 1500 K as follows from integrating Equation (1). Note the similarity of the curves presented in panels (a,b).
Crystals 11 00437 g009
Figure 10. Flat-interface slab growth in 3D within the DPFC, MPFC (α = 1 and β = 0), and the sHPFC model (α = 0 and β = 1). The number of atoms in the crystalline slab is shown as a function of dimensionless time for (a) short times and (b) long times. A linear function fitted to the sHPFC result for t < 500, and an Aτ1/2 function fitted to the DPFC result for τ < 5000 are also shown (dotted lines).
Crystals 11 00437 g010
Figure 11. Dimensionless growth velocity, v as a function of (a) the reduced undercooling, and (b) the inverse of the viscosity parameter β as predicted by the sHPFC model (α = 0).
Crystals 11 00437 g011
Publisher’s Note: MDPI stays neutral with regard to jurisdictional claims in published maps and institutional affiliations.

