Article

Effect of Argon Flow on Oxygen and Carbon Coupled Transport in an Industrial Directional Solidification Furnace for Crystalline Silicon Ingots

1
School of Energy and Power Engineering, Jiangsu University, Zhenjiang 212013, China
2
School of Energy and Power Engineering, Xi’an Jiaotong University, Xi’an 710049, China
3
Jiangsu Key Laboratory of Green Process Equipment, Changzhou University, Changzhou 213164, China
*
Author to whom correspondence should be addressed.
Crystals 2021, 11(4), 421; https://doi.org/10.3390/cryst11040421
Submission received: 26 February 2021 / Revised: 30 March 2021 / Accepted: 4 April 2021 / Published: 14 April 2021
(This article belongs to the Special Issue Modeling of Crystal Growth)

Abstract

:
Transient global simulations were carried out to investigate the effect of argon flow on oxygen and carbon coupled transport in an industrial directional solidification furnace for quasi-single crystalline silicon ingots. Global calculation of impurity transport in the argon gas and silicon melt was based on a fully coupled calculation of the thermal and flow fields. Numerical results show that the argon flow rate affects the flow intensity along the melt–gas surface, but has no significant effect on the flow patterns of silicon melt and argon gas above the melt–gas surface. It was found that the evaporation flux of SiO along the melt–gas surface decreases with the increasing argon flow rate during the solidification process. However, the net flux of oxygen atoms (SiO evaporation flux minus CO dissolution flux) away from the melt–gas surface increases with the increasing argon flow rate, leading to a decrease in the oxygen concentration in the grown ingot. The carbon concentration in the grown ingot shows an exponential decrease with the increase of the argon flow rate, owing to the fact that the dissolution flux of CO significantly decreases with the increasing argon flow rate. The numerical results agree well with the experimental measurements.

Graphical Abstract

1. Introduction

Quasi-single crystalline silicon ingots grown by the seeded directional solidification (DS) technique are one of the main materials for solar cells, and have lower cost and a less favorable crystalline structure compared to the monocrystalline silicon. To improve silicon ingot quality, the seeded DS process still needs considerable work. The impurities in the silicon ingots significantly influence the quality of the silicon ingots and the photoelectric conversion efficiency of solar cells [1,2]. Typically, oxygen and carbon are the main impurities in the DS furnace affecting solar cell wafers. Oxygen-related defects, like thermal donors and boron–oxygen complexes, can reduce the minority carrier lifetime and cause serious light-induced degradation in solar cells [3]. Carbon-related defects, such as silicon carbide (SiC) precipitates, can lead to severe ohmic shunting, jeopardizing the electrical behavior of solar cells [4]. Therefore, it is quite necessary to control the oxygen and carbon concentrations of the DS process to produce high quality silicon ingots.
Considerable research has been carried out to control the oxygen and carbon concentrations and transport during the DS process, such as hot-zone design of furnace and optimization of operating parameters. The former method is dedicated to the configuration or the material of the local components, such as gas flow guidance device [5,6,7,8,9], graphite heaters [10,11], crucible cover [12,13,14] and heat exchanger block [15], to control the gas flow and pathway of impurity transport. The latter technique mainly focuses on modifying furnace pressure [16,17,18], gas flow rate [16,19] and growth rate [20], which is a more efficient and easier way to operate for producing high purity silicon ingots in industrial production. Liu et al. [8] pointed out that it is essential to control the argon flow in the furnace to prevent impurities from being transported to the melt–gas surface. Gao et al. [16] found that an increase in the argon flow rate can reduce both oxygen and carbon impurities in the crystals. Li et al. [19] also numerically investigated the argon flow effect on oxygen and carbon transport with a fully coupled calculation of the thermal and flow fields. However, their studies for the effects of argon flow on impurities were implemented in a small laboratory-scale DS furnace and the oxygen and carbon segregation during the DS process were neglected. Therefore, it is essential to investigate the effect of argon flow rate on the oxygen and carbon transport based on a total coupled global model to find a relative economical flow rate for industrial production.
In this study, we performed transient global simulation of coupled oxygen and carbon transport, taking into account oxygen and carbon impurities segregation during the entire solidification process. The effects of argon flow rate on the melt and gas flows, as well as the evaporation of SiO and dissolution of CO at the melt–gas surface during the growth process, were investigated. The concentrations of oxygen and carbon in the grown silicon ingot were also analyzed. The numerical results of oxygen concentration in the silicon ingot were compared with the experimental measurements acquired using Fourier transform infrared (FTIR) spectrometry.

2. Model Description

Figure 1 shows the configuration of the industrial seeded DS furnace for growing quasi-single crystalline silicon ingots. The quartz crucible has a volume of 84 × 84 × 42 cm3. The height of the as-grown silicon ingot is about 26.5 cm. The furnace was sealed with a water-cooled wall and inert argon gas with a pressure of 0.6 bar was used for purifying the growth environment. The furnace was equivalently simplified to be axisymmetric and subdivided into a number of block regions. Each region was discretized by structured or unstructured grids, as shown in the left part of Figure 1. For the silicon domain, a grid size of 1.5 × 1.5 mm2 with refinement at the boundaries was adopted, which is fine enough to obtain a grid-independent solution. In-house software (CGeMoS) for modeling and simulation of crystal growth/epitaxy was used in this study. This software has been developed and used in our research [8,13,18,19] for more than 10 years. For the current grid scheme, a transient global simulation of the silicon ingot solidification process requires about 7 days on the computer with four 4.00 GHz CPUs.
Based on some assumptions, a two dimensional (2D) transient global heat transfer model, involving solid thermal conduction, thermal radiation, argon flow, melt convection and the phase change was developed for the seeded DS furnace. The basic principle of geometry simplification from 3D to 2D axisymmetric is to keep the thermal resistance unchanged in the DS furnace. Specifically, an enthalpy formulation technique based on a fixed-grid method [21] was used to model the phase change problem of the silicon region during the DS process. After obtaining the global thermal and flow fields, coupled oxygen and carbon transport in the whole furnace based on five major chemical reactions [16,19] was calculated. In the enthalpy formulation technique, the silicon melt and crystal were treated as a unitary domain and the melt–crystal interface was not solved explicitly. Instead, a liquid fraction g l was introduced to each cell volume. Therefore, the governing equations for oxygen transport in the silicon melt and crystal are given as follows [13]:
t ( ρ ω O ) + · ( ρ g l u ω O , m ) = · ( g l ρ D O , m ω O , m ( 1 g l ) ρ D O , c ω O , c ) ω O = g l ω O , m + ( 1 g l ) ω O , c ω O , c = k O s e g ω O , m
where ρ is the velocity, ω O is the mass fraction of oxygen atoms, u is the density, D O , m and D O , c are the molecular diffusivity for oxygen atoms in the silicon melt and crystal, respectively, and k O s e g is the segregation coefficient of oxygen in silicon. The index symbols O, m and c denote the oxygen, melt and crystal, respectively. In the current simulation, the molecular diffusivities for both oxygen and carbon in the melt and crystal are taken to be 5.0 × 10⁻⁸ m2/s [22] and 5.0 × 10⁻¹¹ m2/s [19], respectively. Detailed governing equations and boundary conditions for the global heat transfer model have been described in our previous work [13]. The time step was set to 10 s.
The governing equations for the transport of the SiO and CO species in the argon gas are as follows:
( ρ ω S i O ) t + · ( ρ ω S i O u A r ) = · [ ( ρ D S i O + μ t S c t ) ω S i O ]
( ρ ω C O ) t + · ( ρ ω C O u A r ) = · [ ( ρ D C O + μ t S c t ) ω C O ]
where ω S i O and ω C O are the mass fractions of SiO and CO in the argon gas region, respectively, u A r is the argon gas flow velocity and D S i O and D C O are the molecular diffusivities of SiO and CO in the argon gas, respectively, which can be expressed as:
D S i O = 8.62611 × 10 6 T 1.75 p
D C O = 1.79548 × 10 5 T 1.75 p
The boundary conditions for the impurity species transport in the silicon and argon gas regions are as follows:
(a) On the inside wall of the quartz crucible, the equilibrium concentrations of O atoms are expressed as:
c 0 = 0.5 × 10 23 × a 1 a     atom / cm 3
a = 1.32 × exp ( 7150 T 6.99 )
For the C atoms at the inside wall of the crucible, zero flux boundary condition is applied.
(b) At the melt–gas interface, O, C, SiO and CO coexist. Equilibrium relationships for the same element between the silicon melt and argon gas, as well as the law of mass conservation, is given as follows:
c S i O = 101,325 R g T c O c S i e 21,000 / T + 17.8
c C O = 101,325 R g T c O c S i c C c S i e 5210 / T + 14.6
c A r ( D S i O + μ t ρ A r S c t ) ( c S i O c A r ) + c A r ( D C O + μ t ρ A r S c t ) ( c C O c A r ) = c S i ( D O + μ t ρ S i S c t ) ( c O c S i )
c A r ( D C O + μ t ρ A r S c t ) ( c C O c A r ) = c S i ( D C + μ t ρ S i S c t ) ( c C c S i )
where c S i O and c C O are the molar concentrations of SiO and CO in the argon gas, respectively, c O and c C are the molar concentrations of O and C in the silicon melt, respectively, and R g is the universal gas constant, which is equal to 8.314 J/(mol·K).
(c) The SiO reacts with carbon at the surfaces of the hot graphite fixtures to generate CO. The reaction is assumed to be reversible and the Gibbs free energy of the reaction is expressed as follows:
Δ G = 81,300 + 3.02 T   J / mol ,   T < 1640   K , Δ G = 22,100 33.1 T   J / mol ,   1640   K < T < 1687   K , Δ G = 72,100 3.44 T   J / mol ,   T > 1687   K .
The equilibrium constant of the reaction is K = e Δ G / R T . The coupled boundary conditions at the graphite fixtures’ surfaces can be expressed as:
c A r ( D S i O + μ t ρ A r S c t ) ( c S i O c A r ) = c A r ( D C O + μ t ρ A r S c t ) ( c C O c A r )
c C O c S i O = K
(d) At the argon gas inlet, the concentrations of SiO and CO are set to zero. On other solid component surfaces, zero fluxes of SiO and CO are applied. At the argon gas outlet, zero gradients of SiO and CO are used. Zero radial gradients for all the species are applied along the centerline of the fluid regions in the furnace.
The relationship between the mass fraction ω and the molar concentration c in the aforementioned equations and boundary conditions is c = ρ ω / M , where M is the atomic weight of the impurity species.

3. Results and Discussion

3.1. Effect on Heat Transfer

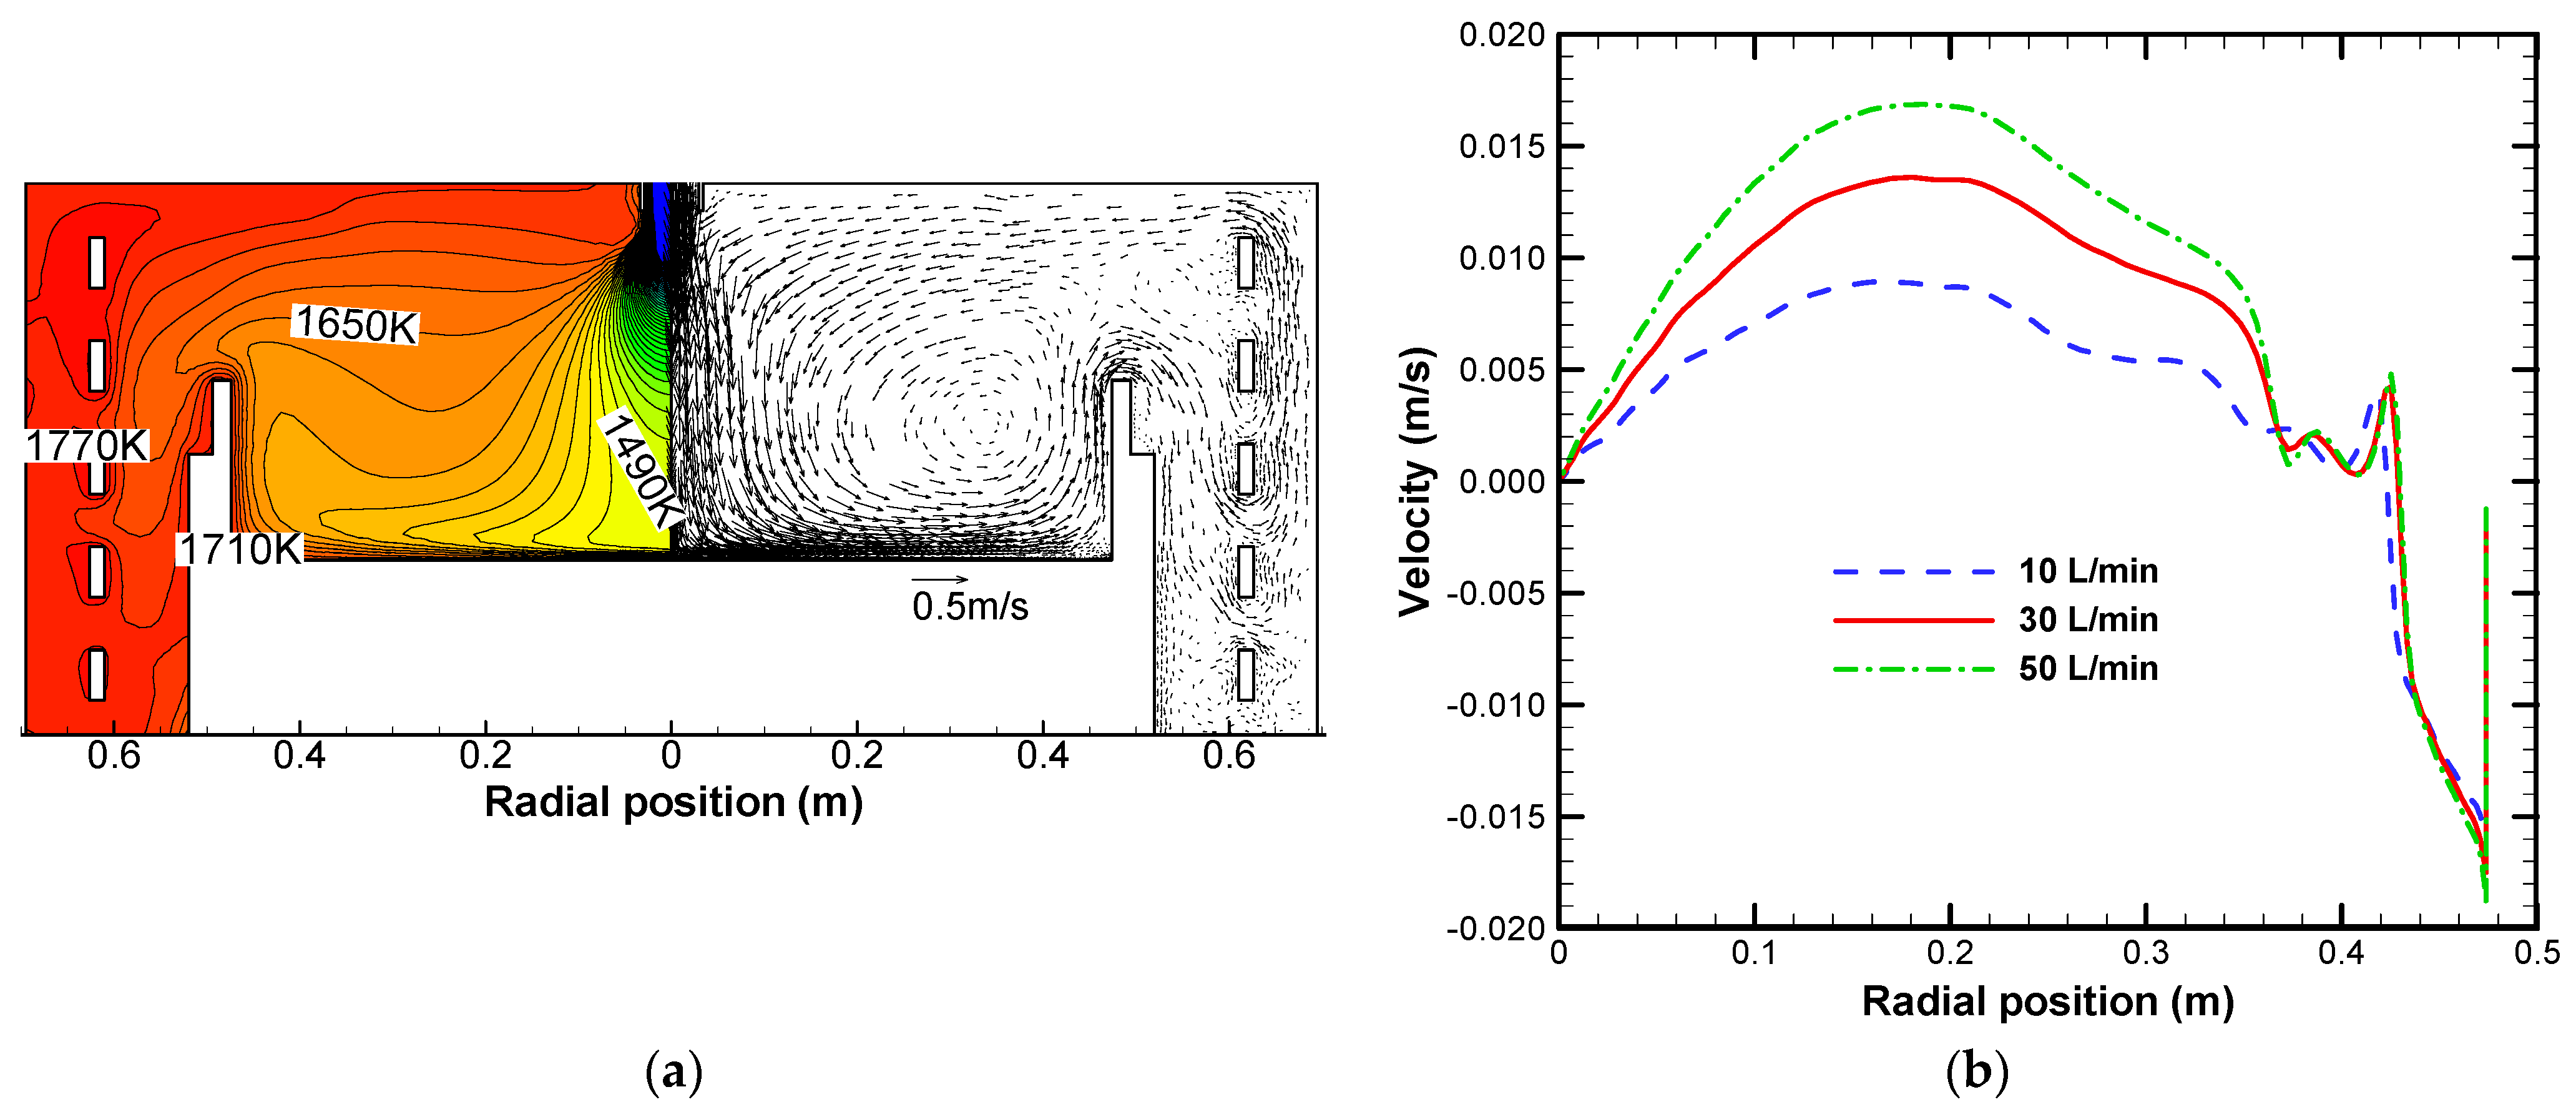
Argon gas is used to maintain the furnace pressure and to purify the chamber during the DS process. A proper argon gas flow rate can influence the local thermal and flow fields, which is conducive to removing oxygen and carbon impurities from the melt–gas surface for better quality ingot [23]. In this section, five cases with different flow rates (5, 10, 30, 50 and 70 L/min) at the furnace inlet were simulated to analyze their effects on the argon and melt flow during the DS process. Considering that the extreme ones, 5 and 70 L/min, are rarely used in the real industrial DS process for quasi-single crystalline silicon ingots, only the middle three cases were analyzed and presented in order to control the length of the paper. Figure 2a shows the local temperature and velocity distribution above the melt–gas surface for the argon flow rate of 30 L/min, when the solidification fraction (S.F.) of silicon melt is 50%. The injected cool argon gas flow through the centrally positioned gas inlet gives rise to a large recirculation covering the regions above the melt–gas surface and around the heaters. Figure 2b gives the velocity along the melt–gas surface for different argon flow rates. Positive values mean that the melt flows outward in the radial direction and the negative ones mean that melt flows inward. As can be found in this figure, the argon flow rate significantly influences the melt flow at the central part of the melt–gas surface. As the argon flow rate increases, argon shear stress becomes stronger and the velocity of the outward melt increases. However, the velocity shows insignificant difference at the outer part of the melt–gas surface, where the Marangoni tension dominates inward flows and the influence of argon flow is weak. The velocity along the melt–gas surface will further affect the evaporation flux of SiO and dissolution flux of CO.
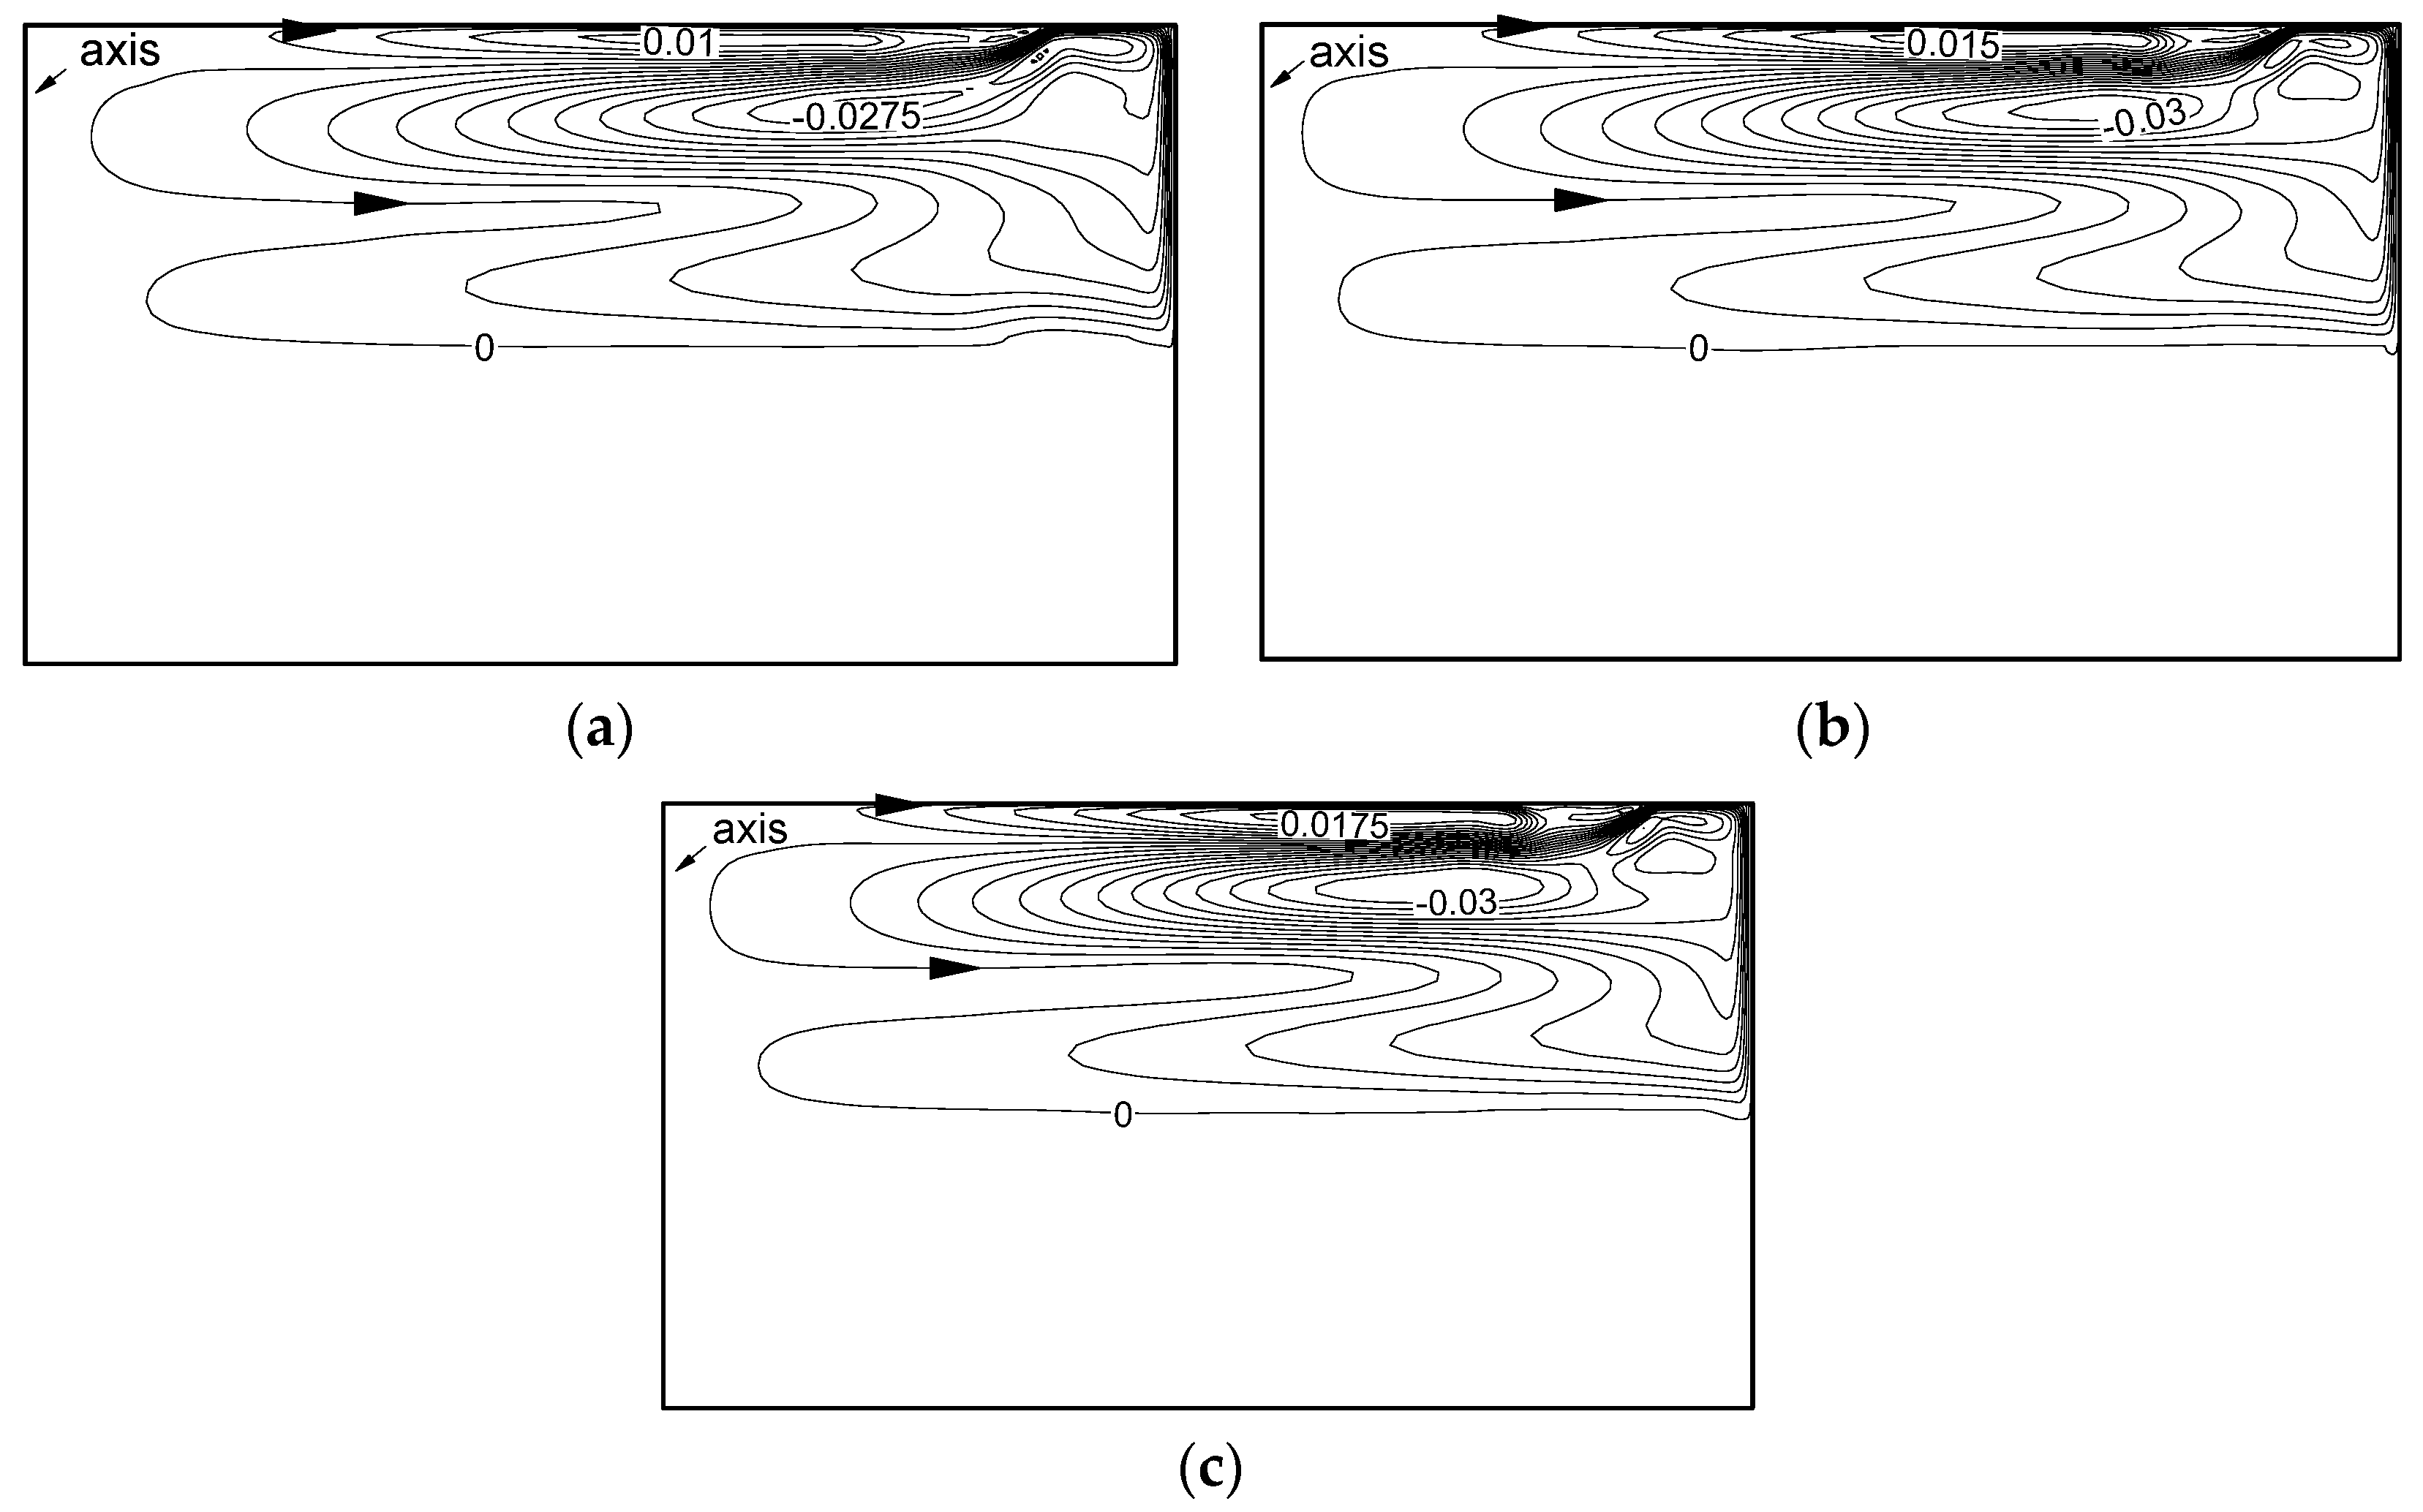
Figure 3 presents the stream function of the silicon melt for different argon flow rates at S.F. = 50%. It can be found that the flow structure of the silicon melt is almost the same for different flow rates. The argon flow only influences the flow intensity of the upper thin layer of the silicon melt. The stream function of the upper layer increases from 0.01 kg/s to 0.0175 kg/s as the argon flow rate increases, while the stream function of the lower layer shows insignificant change. This also implies that dissolved oxygen impurities from the silica crucible into the silicon melt and the stability of Si3N4 coating are independent of the argon flow rate in the selected range of argon flow rate in our simulations.

3.2. Effect on Impurities Transport

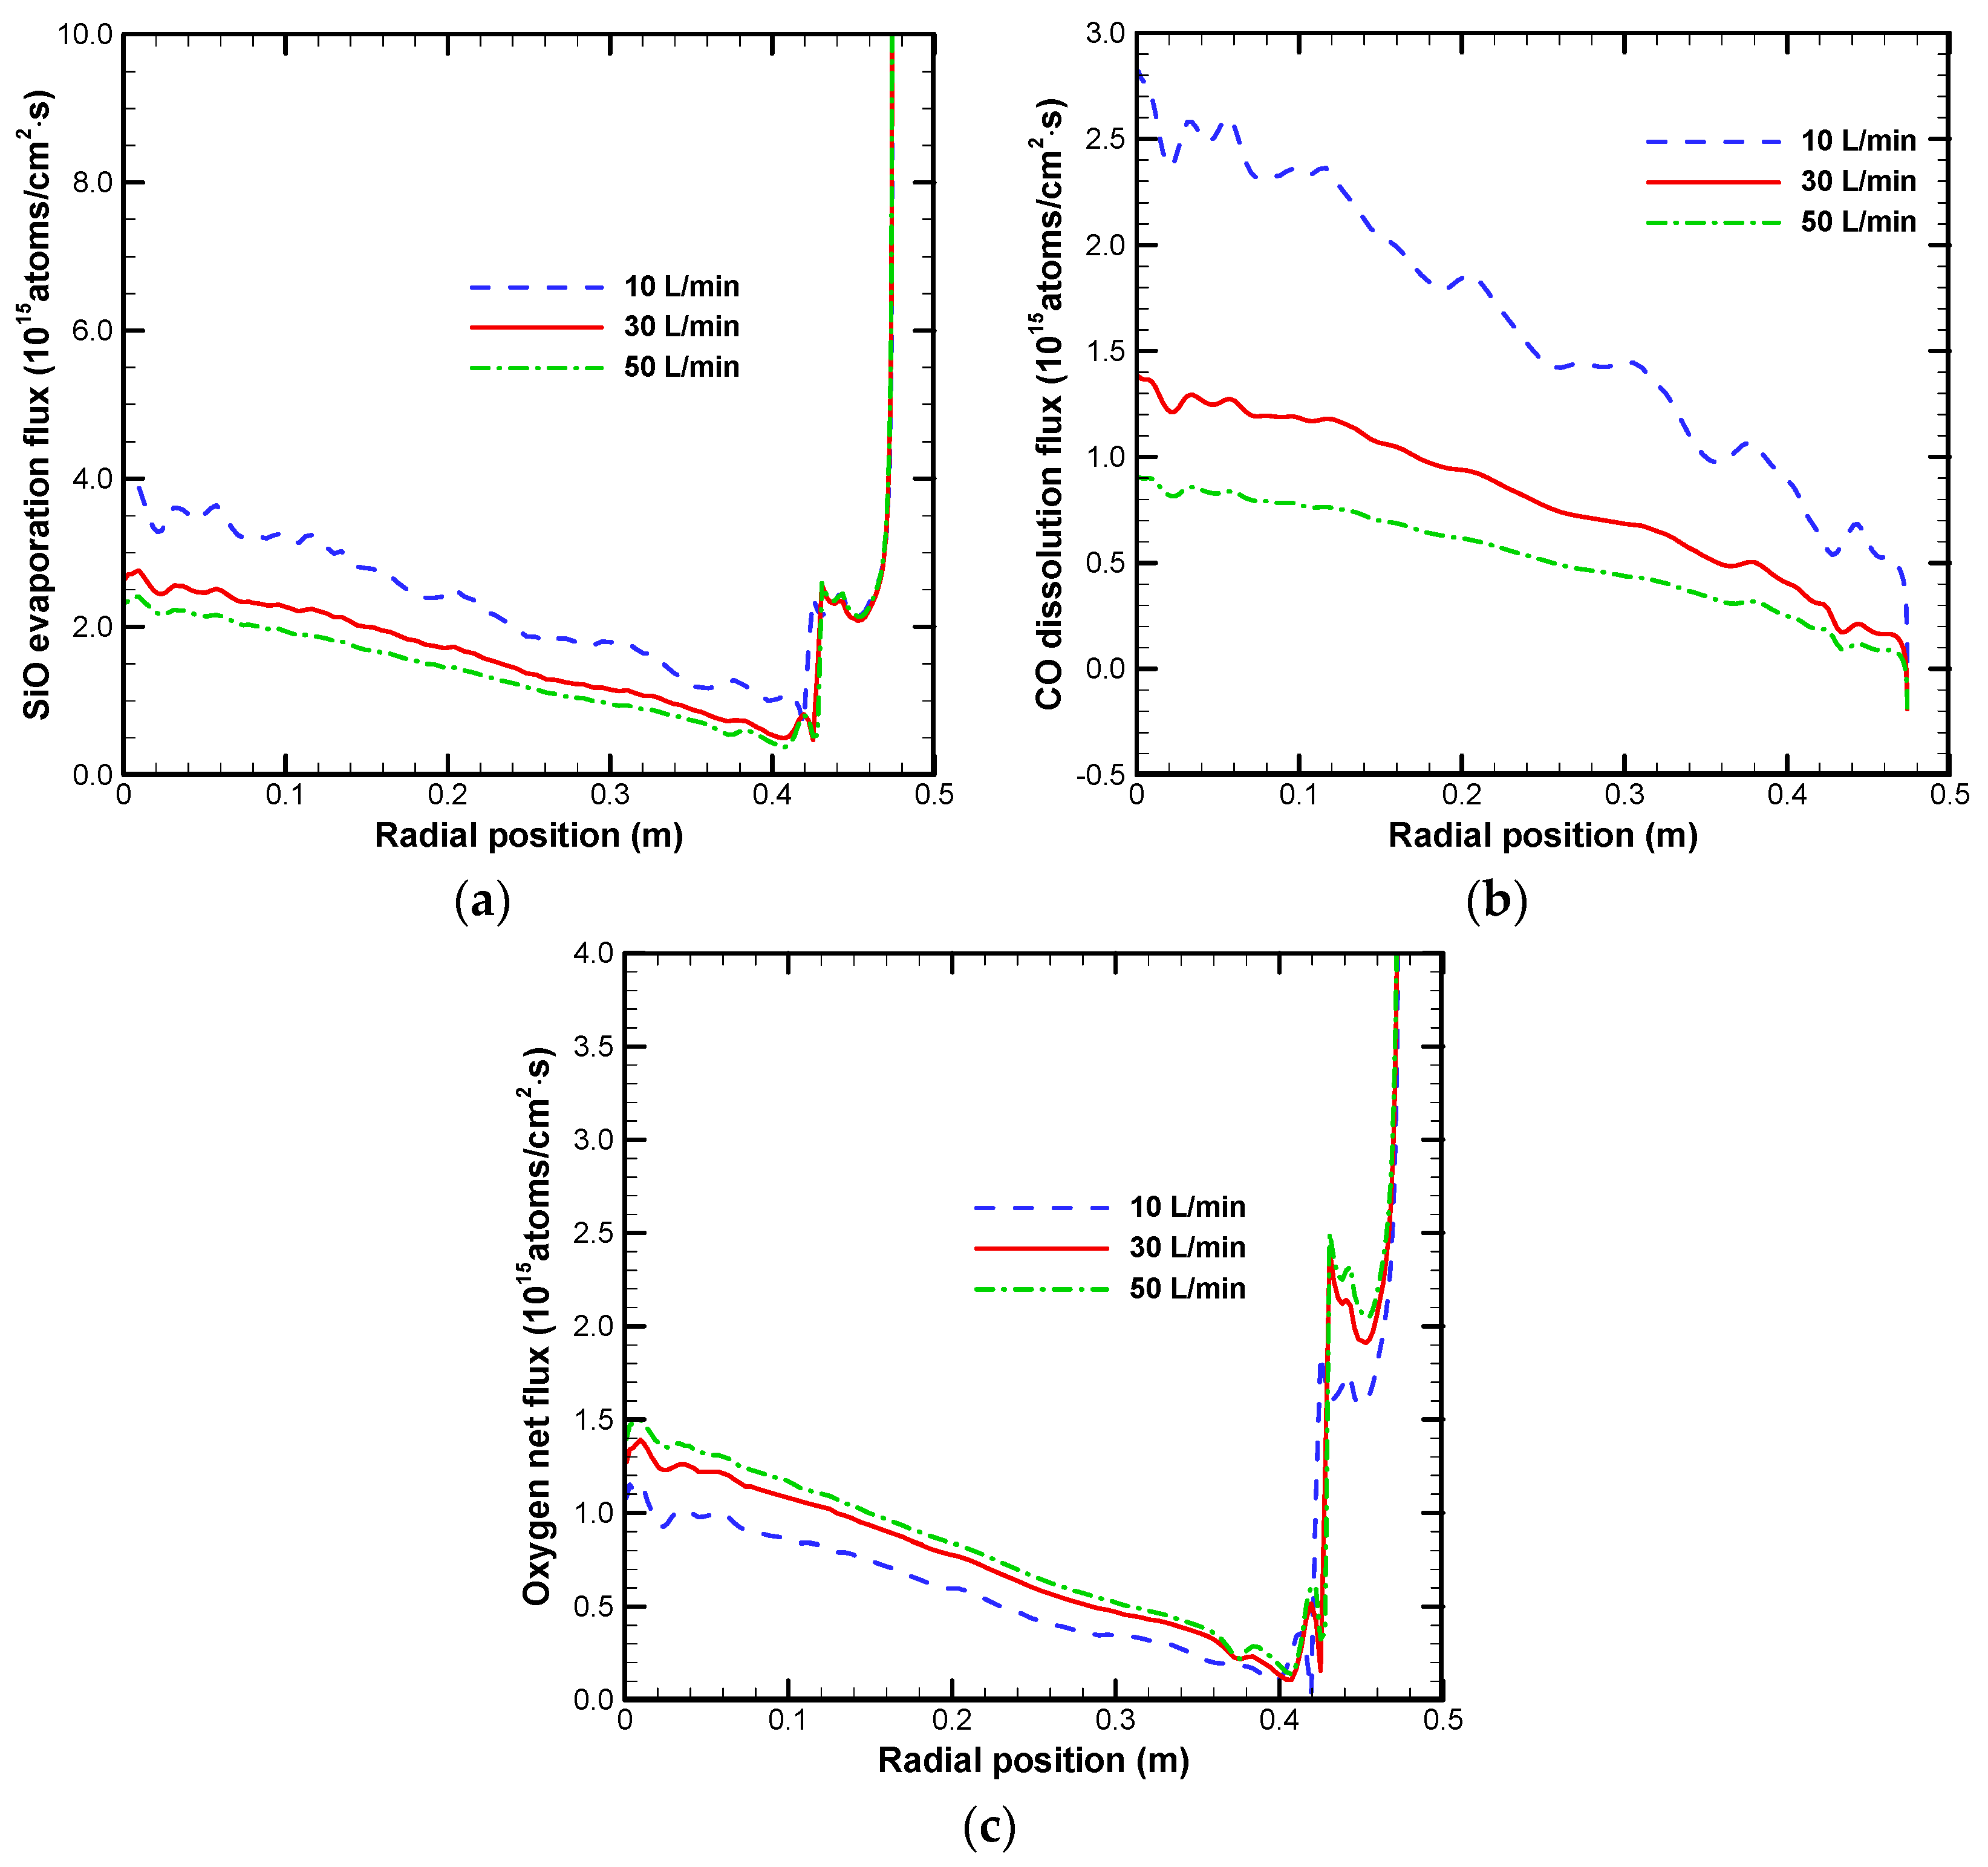
Analysis of the effect of argon flow rate on heat transfer is aimed at understanding the transport mechanisms of oxygen and carbon impurities in the DS furnace. Figure 4 shows the SiO evaporation flux, CO dissolution flux and net flux of oxygen atoms along the melt–gas surface at S.F. = 50%. In Figure 4a, the result shows that the evaporation flux of SiO decreases significantly with the increasing argon flow rate. This is because the strength of the convection recirculation above the melt–gas surface becomes stronger with the increase of the argon flow rate, leading to more SiO transported back to the melt–gas surface with the recirculation which subsequently suppressed the evaporation of SiO. It is worth noting that the lowest value of the evaporation flux of SiO is located at the point of about 0.42 m along the radial position, where the outgoing and ingoing flows along the melt–gas surface meet, as shown in Figure 2b. In Figure 4b, the dissolution flux of CO also significantly decreases as the argon flow rate increases from 10 to 50 L/min, since less CO is formed and transported back to the melt–gas surface due to the decreasing of evaporation flux of SiO. To better track the transport of oxygen atoms, the net flux of oxygen atoms (SiO evaporation flux minus CO dissolution flux) along the melt surface is presented in Figure 4c. We find that the net flux of oxygen atoms along the melt–gas surface (except the peripheral region) increases with the increasing argon flow rate. The above results mean that more oxygen atoms are transported out from melt silicon and fewer carbon atoms are transported into the melt during the DS process with the increasing argon flow rate.
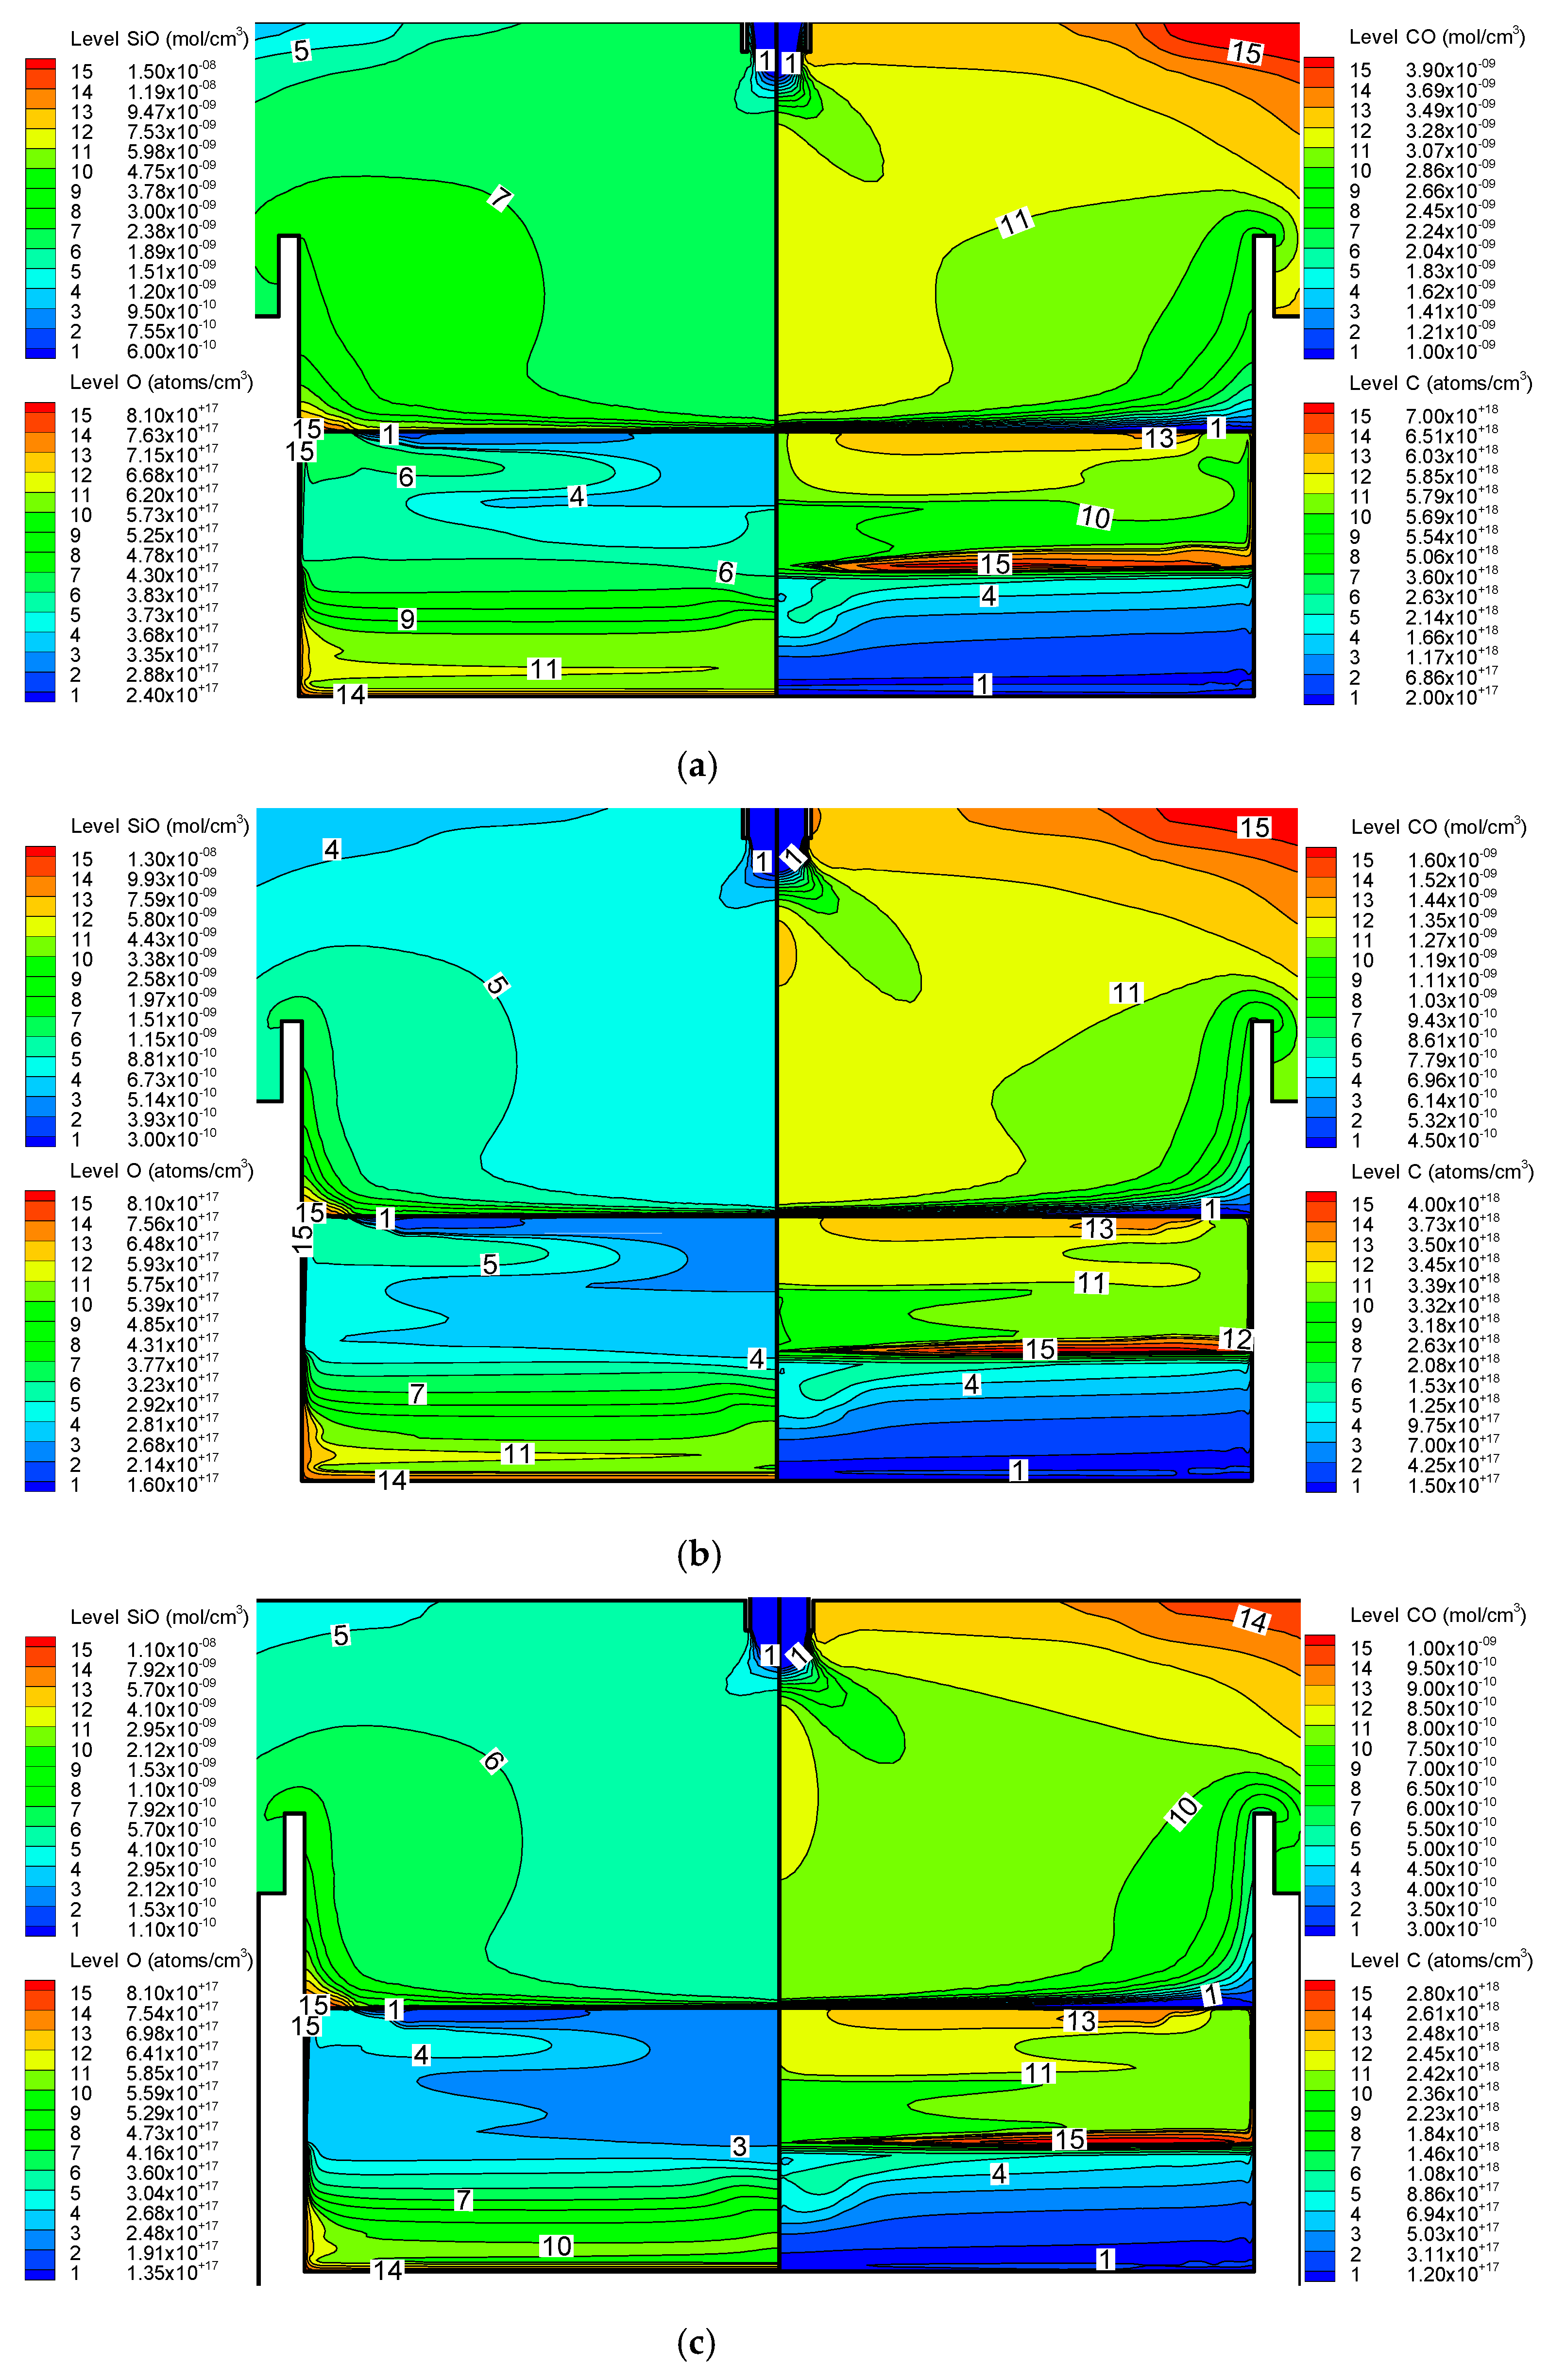
Figure 5 shows the local distributions of SiO and CO concentrations above the melt surface (upper part) and the distributions of oxygen and carbon concentrations distributions in the silicon melt and crystal (bottom part) for different argon flow rates at S.F. = 50%. As discussed before, the vapor phase SiO reacts with the hot heater to form CO and then the reactant CO is transported back to the melt surface and dissolves into the silicon melt. Since the evaporation flux of SiO decreases with the increasing argon flow rate, both the SiO and CO concentrations decrease in the argon gas above the melt–gas surface. From the bottom part of Figure 5, we can find that the concentrations of oxygen and carbon decrease with increasing the argon flow rate. The decrease of oxygen concentration is attributed to the increasing net flux of oxygen atoms with the increasing argon flow rate, leading to more oxygen atoms taken away from the melt–gas surface, as shown in Figure 4c. The decrease of dissolution flux of CO with the increasing argon flow rate results in a decline of carbon concentration in the silicon melt and crystal. As can be seen, most of the carbon atoms were pushed into the melt due to the small segregation coefficient, which causes a relatively high carbon concentration above the melt–crystal interface and a great carbon concentration gradient along the melt–crystal interface.
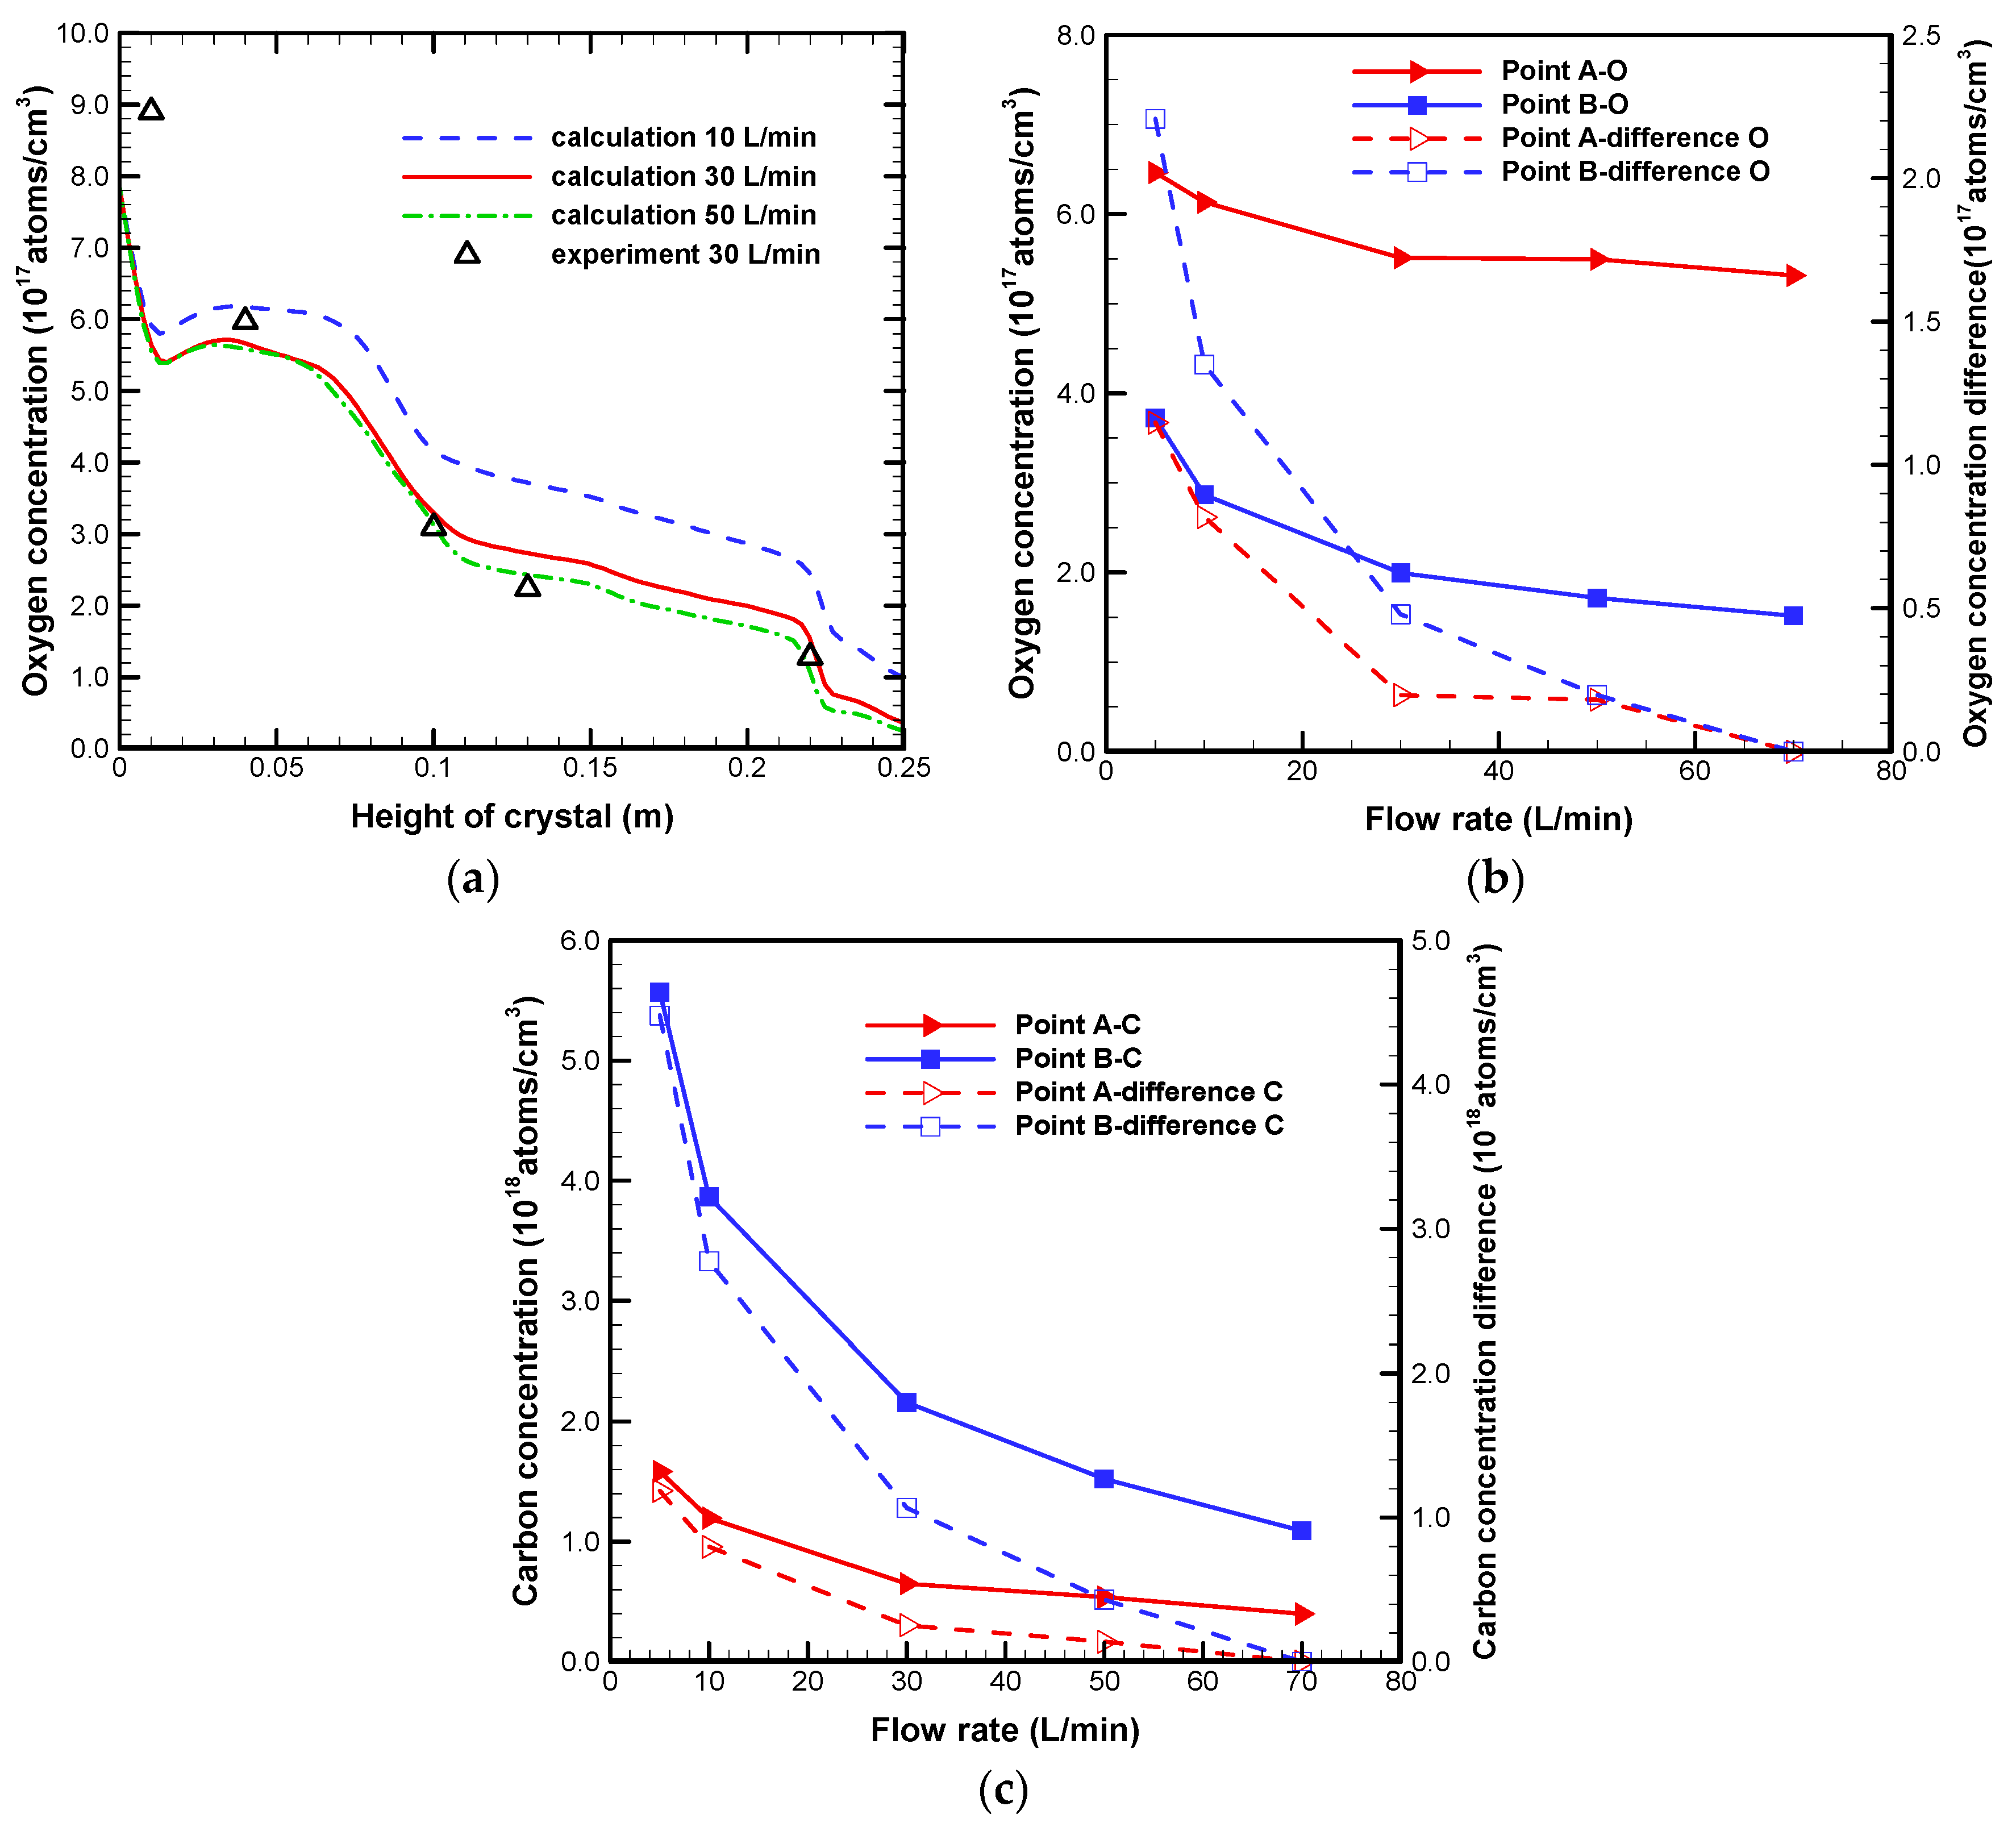
Silicon ingots were grown in the seeded DS furnace with a furnace pressure of 600 mbar and an argon flow rate of 30 L/min. The oxygen concentrations along the centerline of silicon ingot under different growth height were measured by the FTIR. Figure 6a shows the oxygen concentration along the centerline of the grown ingots. It can be found that the oxygen concentration decreases with the increasing argon flow rate due to more oxygen atoms leaving the melt–gas surface. The calculated values of the oxygen concentration show a good agreement with the experimental measurements at the argon flow rate of 30 L/min. Figure 6b,c display the concentration and concentration differences of oxygen and carbon concentrations at Point A and Point B of the grown ingots for different argon flow rates. Point A and Point B in Figure 6 are located at 0.05 m and 0.20 m away from the ingot bottom surface along the centerline, respectively. The concentration differences of oxygen and carbon with respect to the highest argon flow rate of 70 L/min are presented. It can be found that the oxygen and carbon concentrations strongly decrease with the increasing argon flow rate when the flow rate is lower than 30 L/min, while the reduction rate becomes small as the flow rate further increases. To compromise the production cost of the argon gas and the impurity concentrations in the crystal, the argon flow rate unnecessarily increases much higher in the actual production run.

4. Conclusions

Transient global simulations of oxygen and carbon coupled transport in an industrial seeded DS furnace were performed to investigate the effects of argon flow rate on heat transfer and impurities transport. The numerical results show that the argon flow rate has significant influence on the flow intensity along the melt–gas surface. An increase in the argon flow rate can obviously reduce the evaporation of SiO and dissolution of CO along the melt–gas surface. However, the net flux of oxygen atoms away from the melt surface increases with the increasing argon flow rate. Both oxygen and carbon concentrations in the grown ingots exponentially decrease with the increasing argon flow rate. The numerical results of oxygen concentration along the centerline of the grown ingots agree well with the experimental measurements.

Author Contributions

Conceptualization, W.M. and L.L.; methodology, X.Q.; software, X.Q. and Y.X.; writing—original draft preparation, X.Q. and Y.X.; writing—review and editing, W.M., W.S. and L.L.; supervision, L.L.; funding acquisition, W.M. All authors have read and agreed to the published version of the manuscript.

Funding

This research was funded by the Key Research and Development Program for Jiangsu Province, China (No. BE2019009-003), Jiangsu Key Laboratory of Green Process Equipment (No. GPE202003), National Natural Science Foundation of China (No. 51906086) and China Postdoctoral Science Foundation (No. 2019M651731).

Data Availability Statement

The data presented in this study are available within the article.

Acknowledgments

The authors thank Genxiang Zhong for providing the experimental data.

Conflicts of Interest

The authors declare no conflict of interest.

References

  1. Stelian, C. Numerical modeling of carbon distribution and precipitation during directional solidification of photovoltaic silicon. Int. J. Heat Mass Tran. 2019, 145, 118775. [Google Scholar] [CrossRef]
  2. Bellmann, M.P.; Panjwani, B.; Syvertsen, M.; Meese, E.A. Dynamic simulation of impurity transport and chemical reactions in a Bridgman furnace for directional solidification of multi-crystalline silicon. J. Cryst. Growth 2013, 369, 47–54. [Google Scholar] [CrossRef]
  3. Saitoh, T.; Wang, X.; Hashigami, H.; Abe, T.; Igarashi, T.; Glunz, S.; Rein, S.; Wettling, W.; Yamasaki, I.; Sawai, H.; et al. Suppression of light degradation of carrier lifetimes in low-resistivity CZ-Si solar cells. Sol. Energy Mat. Sol. Cells 2001, 65, 277–285. [Google Scholar] [CrossRef]
  4. Richter, S.; Bauer, J.; Breitenstein, O. Growth of carbon and nitrogen containing precipitates in crystalline solar silicon and their influence on solar cells. Phys. Status Solidi RRL 2017, 11, 1600354. [Google Scholar] [CrossRef]
  5. Teng, Y.Y.; Chen, J.C.; Lu, C.W.; Chen, C.Y. Numerical investigation of oxygen impurity distribution during multicrystalline silicon crystal growth using a gas flow guidance device. J. Cryst. Growth 2012, 360, 12–17. [Google Scholar] [CrossRef]
  6. Bellmann, M.P.; Lindholm, D.; M’Hamdi, M. A novel method for gas flow and impurity control in directional solidification of multi-crystalline silicon. J. Cryst. Growth 2014, 399, 33–38. [Google Scholar] [CrossRef]
  7. Teng, Y.Y.; Chen, J.C.; Huang, B.S.; Chang, C.H. Numerical simulation of impurity transport under the effect of a gas flow guidance device during the growth of multicrystalline silicon ingots by the directional solidification process. J. Cryst. Growth 2014, 385, 1–8. [Google Scholar] [CrossRef]
  8. Liu, L.J.; Qi, X.F.; Ma, W.C.; Li, Z.Y.; Zhang, Y.F. Control of the gas flow in an industrial directional solidification furnace for production of high purity multicrystalline silicon ingots. Int. J. Photoenergy 2015, 2015, 513639. [Google Scholar] [CrossRef] [Green Version]
  9. Su, W.J.; Li, C.; Qi, X.F.; Yang, W.; Wang, J.F. Numerical analysis and optimization of gas flow and impurity control in directional solidification multi-crystalline Si. J. Cryst. Growth 2019, 527, 125244. [Google Scholar] [CrossRef]
  10. Kesavan, V.; Srinivasan, M.; Ramasamy, P. Optimizing oxygen impurities using different heater design in the directional solidification of multi-crystalline silicon. Mater. Res. Express 2019, 6, 106323. [Google Scholar] [CrossRef]
  11. Kesavan, V.; Srinivasan, M.; Ramasamy, P. The influence of multiple-heaters on the reduction of impurities in mc-Si for directional solidification. Silicon 2019, 11, 1335–1344. [Google Scholar] [CrossRef]
  12. Gao, B.; Nakano, S.; Kakimoto, K. Effect of crucible cover material on impurities of multicrystalline silicon in a unidirectional solidification furnace. J. Cryst. Growth 2011, 318, 255–258. [Google Scholar] [CrossRef]
  13. Liu, L.J.; Ma, W.C.; Qi, X.F.; Li, Z.Y.; Zhang, Y.F. Global simulation of coupled oxygen and carbon transport in an industrial directional solidification furnace for crystalline silicon ingots: Effect of crucible cover coating. Int. J. Heat Mass Tran. 2017, 108, 2355–2364. [Google Scholar] [CrossRef]
  14. Kumar, M.A.; Srinivasan, M.; Ramasamy, P. Reduction of carbon and oxygen impurities in mc-silicon ingot using molybdenum gas shield in directional solidification process. Silicon 2020. [Google Scholar] [CrossRef]
  15. Vishnuwaran, M.; Srinivasan, M.; Kesavan, V.; Ramasamy, P. Effect of titanium carbide heat exchanger block and retort on oxygen impurities in Mc-silicon: Numerical modelling. Silicon 2019, 12, 799–803. [Google Scholar] [CrossRef]
  16. Gao, B.; Nakano, S.; Kakimoto, K. Global simulation of coupled carbon and oxygen transport in a unidirectional solidification furnace for solar cells. J. Electrochem. Soc. 2010, 157, H153–H159. [Google Scholar] [CrossRef]
  17. Teng, Y.Y.; Chen, J.C.; Lu, C.W.; Chen, H.I.; Chuck, H.; Chen, C.Y. Effects of the furnace pressure on oxygen and silicon oxide distributions during the growth of multicrystalline silicon ingots by the directional. J. Cryst. Growth 2011, 318, 224–229. [Google Scholar] [CrossRef]
  18. Qi, X.F.; Liu, L.J.; Ma, W.C. Effects of furnace pressure on oxygen and carbon coupled transport in an industrial directional solidification furnace for crystalline silicon ingots. J. Cryst. Growth 2017, 468, 933–938. [Google Scholar] [CrossRef]
  19. Li, Z.Y.; Liu, L.J.; Ma, W.C.; Kakimoto, K. Effects of argon flow on impurities transport in a directional solidification furnace for silicon solar cells. J. Cryst. Growth 2011, 318, 304–312. [Google Scholar] [CrossRef]
  20. Trempa, M.; Reimann, C.; Friedrich, J.; Müller, G. The influence of growth rate on the formation and avoidance of C and N related precipitates during directional solidification of multi crystalline silicon. J. Cryst. Growth 2010, 312, 1517–1524. [Google Scholar] [CrossRef]
  21. Voller, V.R.; Prakash, C. A fixed grid numerical modelling methodology for convection-diffusion mushy region phase-change problems. Int. J. Heat Mass Tran. 1987, 30, 1709–1719. [Google Scholar] [CrossRef]
  22. Liu, L.J.; Nakano, S.; Kakimoto, K. Investigation of oxygen distribution in electromagnetic CZ–Si melts with a transverse magnetic field using 3D global modeling. J. Cryst. Growth 2007, 299, 48–58. [Google Scholar] [CrossRef]
  23. Ma, X.; Zheng, L.L.; Zhang, H.; Zhao, B.; Wang, C.; Xu, F.H. Thermal system design and optimization of an industrial silicon directional solidification system. J. Cryst. Growth 2011, 318, 288–292. [Google Scholar] [CrossRef]
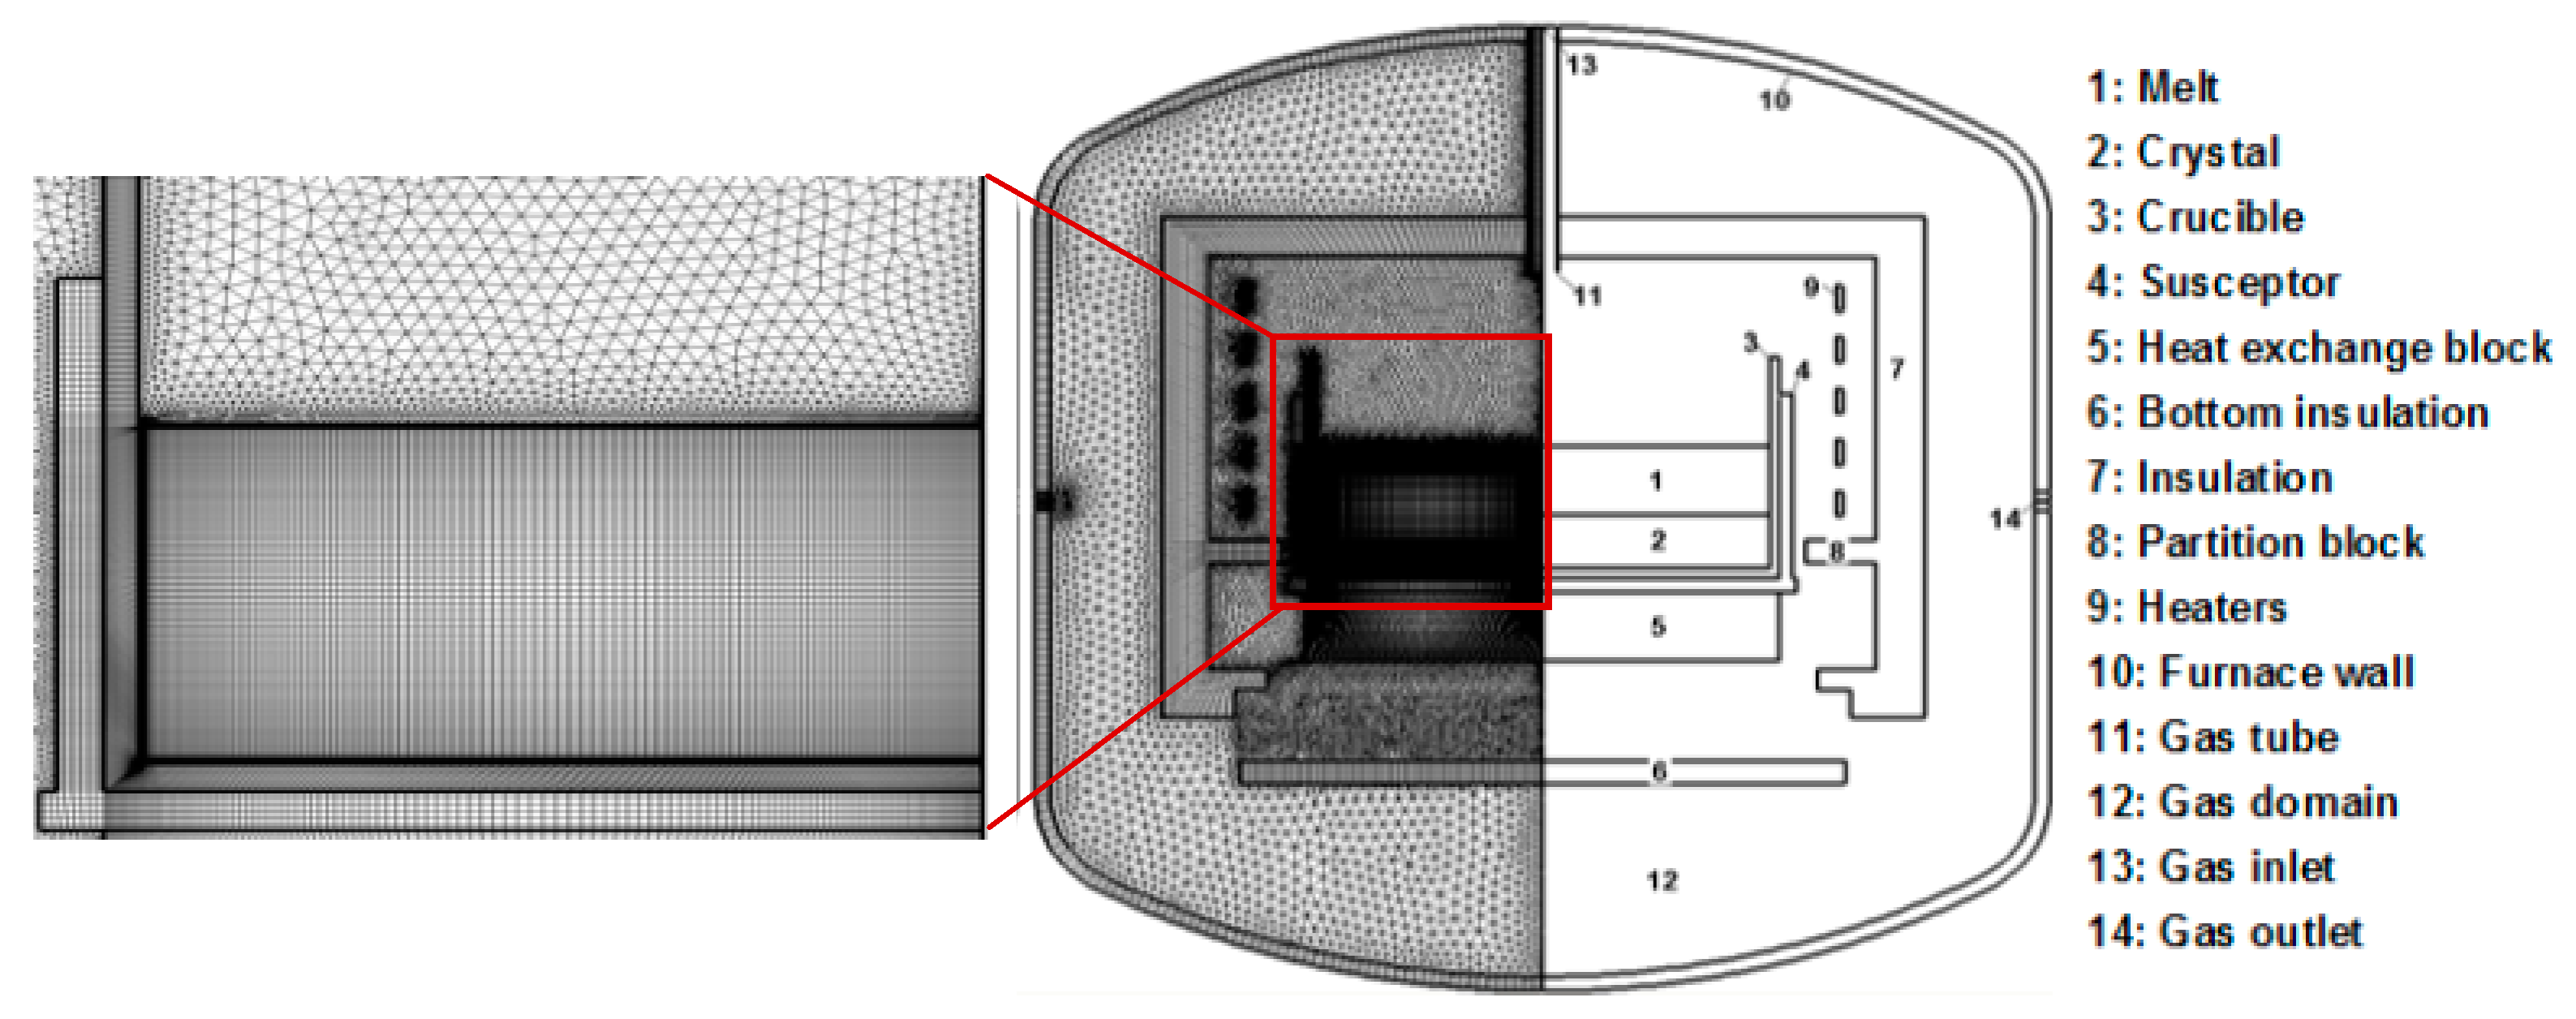
Figure 1. Configuration and computational grids of an industrial seeded DS (directional solidification) furnace.
Crystals 11 00421 g001
Figure 2. Local temperature (ΔT = 20 K) and velocity fields for the flow rate of 30 L/min at S.F. (solidification fraction) = 50% (a) and velocity along the melt–gas surface under different flow rates (b).
Crystals 11 00421 g002
Figure 3. Stream function (unit: kg/s) of the silicon melt at S.F. = 50%: (a) 10 L/min, (b) 30 L/min, (c) 50 L/min.
Crystals 11 00421 g003
Figure 4. SiO evaporation flux (a), CO dissolution flux (b) and oxygen net flux (c) along the melt–gas surface for different argon flow rates at S.F. = 50%.
Crystals 11 00421 g004
Figure 5. Local impurity distribution for different argon flow rates at S.F. = 50%: (a) 10 L/min, (b) 30 L/min, (c) 50 L/min. Contour numbers in the silicon and argon region represent the contour value.
Crystals 11 00421 g005
Figure 6. Oxygen concentration along the centerline of the solidified ingot (a), and the concentration and concentration differences of oxygen (b) and carbon (c) at Point A and Point B of the solidified ingots for different argon flow rates.
Crystals 11 00421 g006
Publisher’s Note: MDPI stays neutral with regard to jurisdictional claims in published maps and institutional affiliations.