
Study on Size Effect in Indentation Tests

1
State Key Laboratory for Strength and Vibration of Mechanical Structures, Department of Engineering Mechanics, School of Aerospace Engineering, Xi’an Jiaotong University, Xi’an 710049, China
2
State Key Laboratory of Long-Life High Temperature Materials, Dongfang Electric Corporation Dongfang Turbine Co., Ltd., Deyang 618000, China
*
Author to whom correspondence should be addressed.
Coatings 2022, 12(12), 1962; https://doi.org/10.3390/coatings12121962
Submission received: 11 November 2022
/
Revised: 2 December 2022
/
Accepted: 10 December 2022
/
Published: 14 December 2022
(This article belongs to the Section Surface Characterization, Deposition and Modification)
Abstract
:The depth dependence of the indentation hardness, i.e., the indentation size effect (ISE), was manifested as an increase or decrease in hardness when penetration depth decreases, which was observed by previous experiments. Most scholars believe it is generated by strain gradient. However, additional opinions argue that other factors, similar to the strain gradient, can also contribute to the ISE. Importantly, if such an ISE occurs in an experiment, one needs to distinguish its causes. In this study, two external factors were considered, i.e., the specimen surface defect and indenter tip irregularity, which can lead to the hardness–depth-dependent relationships of the ISE. Moreover, a theoretical model was established to interpret the two dependent relationships and validated via finite element simulations. The simulation results showed that both external factors lead to significant hardness–depth dependences, in great agreement with theoretical derivations. Moreover, the simulation results demonstrated that the surface defect and indenter tip irregularity have a unified influence on the ISE, which is attributed to a sole depth deviation δ. Lastly, the ISE based on both external factors was eliminated and the real hardness was obtained. Based on this, when an ISE appears, it can be distinguished whether it is caused by external factors or strain gradient.
1. Introduction
Over the past several decades, indentation techniques have become an effective method to characterize the micromechanical properties of solid materials [1,2]. At the micron or nanoscale, it has been extensively confirmed that mechanical behaviors of small structures can exhibit strong size dependence. This fantastic phenomenon is often observed and presented as the depth dependence of hardness in shallow indentation tests, namely, the indentation size effect (ISE) [3,4,5,6,7,8,9,10,11,12,13,14,15,16]. Numerous experiments showed that the ISE becomes intense when the penetration depths of indenters are less than 1 μm [6,8,13,14,16].
For a geometric self-similar shallow indentation, measured hardness is often manifested as an increase or decrease with decreasing indentation depth, so the ISE is divided into the normal ISE and the reverse ISE [13,16,17]. Specifically, the normal ISE is often observed and is expressed as an increase in hardness when the indentation depth decreases. In contrast to the normal ISE, the reverse ISE is infrequent and is manifested as a decreasing hardness with a decreasing depth. For instance, Ma et al. [8] experimentally examined the nanohardness of single-crystal Ni and observed a normal ISE phenomenon. Wang et al. [13] reported that the hardness of sintered EPD ZrO2 first appears as a reverse ISE and then turns to a normal ISE behavior. Pöhl et al. [14] exhibited the extensive normal ISE phenomenon of C45. Kathavate et al. [16] showed the normal ISE and reverse ISE of three PMN-PT piezoceramics. Of great significance, Pharr et al. [17] reviewed previous experimental observations and presented the hardness–depth dependences of the ISE, as shown in Figure 1.
For the size dependence of strength, most scholars believe that ISE is determined by the inherent property of materials. Fleck et al. [18] used geometrically necessary dislocation to invoke the strain gradient plasticity theory and developed a phenomenological plasticity law to explain this phenomenon. Ma and Clarke [19] used a simple model of geometrically necessary dislocation to describe the hardness–depth-dependent relationship. As a hot topic, the ISE has been interpreted by several models [3,20,21], among which classical Nix and Gao’s model is usually recognized. Nix and Gao [3] developed the model through the geometrically necessary dislocation to interpret the ISE phenomena, and derived hardness–depth relation through the theory of strain gradient plasticity, i.e.,
where H is the measured hardness for a given penetration depth h, H0 is the hardness of infinite depth, and h* is the characteristic depth, related to indenter shape, shear modulus, and H0. Gao and Huang et al. proposed the mechanism-based on strain gradient plasticity [22,23], which was used to interpret the size effect of indentation hardness [24,25,26,27]. As a result, Nix and Gao’s model not only explained the ISE, but also promoted the further development of strain plasticity theory. This model can interpret normal ISE but did not explain the hardness change of the reverse ISE. Sangwal [28] examined reverse ISE phenomena through the analysis of experimental data from previous reported literature and introduced the possible causes of the reverse ISE origin. Additionally, Muslić et al. [29] used Meyer’s law to describe the relationship between the applied load and indentation size and validated that Meyer’s law can reveal both normal ISE and reverse ISE phenomena by the Vickers hardness tests of a metal-matrix-based composite. Based on Nix and Gao’s work, Liu et al. [30] proposed a new analytical model involving the role of elastic deformation to describe the ISE and suggested that neglecting elastic deformation can give rise to significant changes in hardness; more importantly, this model can describe both the normal ISE and the reverse ISE. Cui et al. [31] linked nanoindentation and uniaxial compression to obtain the constitutive relation of Ti6Al4V, and then established an ISE-predicated model based on this constitutive law and strain gradient, and this model agrees well with experimental measurements; importantly, the use of uniaxial compression provides a theoretical foundation and method guideline for ISE investigations. Due to numerous studies, the ISE has been reported endlessly [32,33,34,35], which facilitates the formation of a cognition that the ISE is based on the strain gradient of materials. Subsequent scholars have gradually approved that the hardness–depth dependence is affected by the strain gradient and have attributed much of the hardness inaccuracy to the strain gradient of materials.
At present, the strain gradient plasticity theory is sometimes not sufficient to explain all ISE phenomena. At the nanoscale, other uncertainties can contribute to hardness–depth dependence and lead to an appearance of the ISE. Gerberich et al. [36] suggested that hardness–depth dependence still exists even without incorporating the strain gradient for the shallow indentation of single crystals W, Al, and Au, and they pointed out that the strain gradient theory is insufficient to interpret the ISE when indentation depth is less than a few hundred nanometers. Ma et al. [37] confirmed that specimen surface oxidation and strain hardening play an important role in the appearance of the ISE. Liu et al. [38] investigated the hardness–depth dependence of polished single-crystal copper through nanoindentation experiments and showed that the ISE is related to the polishing techniques of specimens. Manika et al. [39] argued the intricate nature of the ISE is due to various elements such as the strain gradient, surface effect, and non-dislocation mechanisms, etc.
In addition, specimen surface defects and indenter tip irregularity are two focuses in indentation tests, which significantly affect the inaccuracy in the hardness measurement [40]. Because of the limitations in processing and manufacturing technology, it is difficult to ensure the idealization of specimen preparations, as, for instance, with sprayed coatings or films with an irregular microstructure [41,42]. The effects of specimen surface defect and irregular indenter tip on indentation tests are not negligible, and some previous studies reported the relation between them and the ISE. For instance, for the effect of surface defects, Jiang et al. [43] simulated the indentation process of the copper thin film with straight-groove defects and found that surface defects lead to an increase in hardness with decreasing indentation depth. Kim et al. [44] proposed a new defective surface ISE model and discussed the critical indentation depth at which surface defects affect the ISE through nanoindentation experiments of different roughness Ni samples. For the effect of indenter tip shapes, Qiao et al. [45] developed a new model incorporating tip wear effect to explain the ISE, and the worn shape was determined through the fitting area function. Swadener et al. [46] suggested that the ISE of a conical indenter is related to the penetration depth, while the ISE of a spherical indenter is dependent on sphere radius. In short, for shallow indentation tests, the ISE nature is complicated and depends on external causes besides the internal heterogeneous properties of the materials.
For the shallow indentation tests, the ISE’s nature is complicated and its origin has not been completely analyzed. Herein, surface defect and indenter tip irregularity are considered as two external factors leading to the ISE, which bring an important deviation in measured hardness. However, the influence mechanism by both the non-strain gradient factors promoting ISE emergence is not clear, and the theoretical analytical model is lacking. This makes it impossible to quantitively characterize its impact on the ISE. Further, it is more difficult to determine a method to eliminate the ISE resulting from the non-strain gradient and improve the accuracy of the measured hardness.
In this paper, we proposed a theoretical model of hardness–depth dependence to interpret the normal ISE and the reverse ISE based on non-strain gradient factors. Without involving strain gradient plasticity, a classical material model was used to simulate indentation tests, and the effects of surface defects and irregular tip irregularity on the ISE were assessed. Finite element simulation ensures that the effect of the strain gradient on the ISE is excluded and the ISE is only related to both external factors. Furthermore, the simulation results are compared with the theoretical model. For inaccurate hardness from the ISE, a correction method was introduced to eliminate the dependent relationship.
2. Theoretical Model
Indentation tests are based on a smooth plane, and surface defects of specimens can lead to either high or low inaccurate deviation of the measured hardness for a shallow indentation. With an increasing indentation depth, the effect of surface defects will decrease and the measured hardness will gradually approach the true hardness of the sample, which is manifested as a hardness–depth dependence. For the effect of indenter tip irregularity, it can also generate an important deviation of measured hardness at a small penetration depth. When indentation volume is large enough, the volume of irregular tip is negligible compared to the entire geometrically self-similar indentation. Similarly, measured hardness is close to true hardness as the depth increases, which also presents a dependent relationship. As stated above, both surface defects and tip irregularity can result in an ISE for a shallow indentation. Therefore, a feature size δ is introduced to characterize surface defects and tip irregularities to carry out theoretical analysis, as shown in Figure 2 and Figure 3.
For the surface with defects, it has long been reported that undulated surface models were established through sinusoidal curves [40,47,48]. Here, a sinusoidal curve was introduced to establish an undulated surface, including convex defects and groove defects, as shown in Figure 2. When the indenter is pressed at these defective positions, the defect height δ will produce a deviation of measured depth, and then the depth deviation will affect measured hardness accuracy. For irregular indenter tip shapes, such as tip sharpness or bluntness, as shown in Figure 3, these irregular tip shapes also will produce a depth deviation δ and lead to an inaccuracy in measured hardness. Especially for shallow indentations, the displacement deviation δ plays an important role in hardness measurements.
Indentation hardness is an index of the ability of samples to withstand contact load. Oliver and Pharr [1,2] developed the Oliver–Pharr method, and hardness was often defined as average contact stress:
where H represents hardness, A is the projected area of elastic contact, and f represents area function and f(h) = 24.504h2 for conical indenters. Additionally, A is not directly measured, which is calculated through the indentation depth h and the geometry of the indenter. Most indentation instruments are preset calculation equations of hardness [49,50]. The penetration depth h is calculated through an initial point that the indenter begins to contact the tested surface of the specimen. Hence, the surface defect and indenter tip irregularity will generate an important deviation in the measured depth. Then, the depth deviation significantly affects the hardness measurement. In short, both the surface defect and the irregular tip irregularity affect the measured hardness through depth deviation to lead to an uncertain hardness–depth-dependent relationship.
Therefore, a theoretically dependent relationship between the hardness and depth was deduced and an analytical model that involves the surface defect and indenter tip irregularity to interpret the ISE was developed. Figure 2 and Figure 3 show that the depth deviation δ is introduced to Equation (4), and the area function f is expanded by the Taylor formula.
According to Equation (2), it deduced that
where Aδ represents the projected area deviation depending on δ, and Aδ approaches ο(A) with increasing depth. Moreover, when the depth is deep enough, the influence of the area deviation Aδ on load P can be ignored. Putting Equation (3)–(6) into Equation (2), the two dependent relationships of the hardness and depth are given as follows:
where H is dependent on h. Equations (7) and (8) show these hardness–depth-dependent relationships. Obviously, when an ISE results from two effects of strain gradient plasticity and external factors, the measured hardness H is related to two variables of and , where involves strain gradient plasticity and depends on external factors of the surface defect or indenter tip irregularity. This implies that the ISE phenomenon results from multiple factors such as the strain gradient and non-strain gradient. For classical materials, the load–displacement relationship during loading is expressed by Equation (9), as follows [51]:
where P is the load, h is the indentation depth, a and m are constants, depending on indenter shape, and m is 2 for the conical indenter. Without the strain gradient, in Equations (7) and (8) is a constant H0. At this time, putting Equation (9) into Equations (7) and (8), it obtains that
Equations (10) and (11) show the hardness–depth-dependent relationships of the ISE based on nonstrain gradient factors. Because of the deviation δ, H is still dependent on h even without the strain gradient, which is manifested as a phenomenon similar to the ISE based on the strain gradient. The hardness deviations are expressed by and for conical indenters. Importantly, an analytical model about the ISE was established in Figure 4 which can explain both the normal ISE and the reverse ISE. When indentation is large enough, the influence of the surface defect and tip irregularity can be ignored, and the measured hardness is the true hardness of the sample. The above inferences are based on this assumption.
Importantly, our analytical model is based on external factors, independent of inherent properties, and is universal for all materials. The classical Nix–Gao model is based on inherent properties, which was validated by experimental analysis of the indentation effect size on single crystal Ag [3]. Furthermore, the comparison of our model and the Nix–Gao model is shown in Figure 5. The result shows that the normal ISE resulting from the surface defect or irregular tip is close to that based on the strain gradient. This implies that theoretical forms of the ISE based on the strain gradient and non-strain gradient are approximate for shallow indentation tests.
3. Simulation and Validation
3.1. FEM of the Size Effect
To highlight the influence mechanism of δ on the ISE, a classical material model without the strain gradient plasticity is used to simulate indentation tests with an axisymmetric model in ABAQUS. TA2 is selected as simulated material and mechanical properties, as shown in Table 1. The simulated material is assumed as homogeneous and isotropic, and it is characterized by an ideal elastoplastic model. The stress–strain relationship is as follows:
where and are the stress and strain corresponding to yield strength. This material model is rate-independent and is usually used to characterize metal plasticity. The Mises yield function with the associated flow is used, and volume strain is as:
the deviatoric strain is
The strain incremental decomposition is
Using the standard definition of corotational measures, it can be written an integrated form as
The elasticity is linear and isotropic. The bulk modulus K and shear modulus G are computed readily from Young’s modulus E and Poisson’s ratio v, as
and
The elasticity can be written in volumetric and deviatoric components as follow. Volumetric:
where
is the equivalent pressure stress. Deviatoric:
where S is the deviatoric stress,
The flow rule is
where
and is the equivalent plastic strain rate. Due to the material model being rate independent, the yield condition:
where is the yield stress and is defined as a function of equivalent plastic strain () and temperature (). From what has been discussed above, material behavior is defined. That is to say, the strain gradient plasticity is absent in this model. This ensures that the ISE presented in simulation is independent of the strain gradient. The diamond indenter is regarded as a rigid body in simulation, which can greatly reduce calculation.
According to actual indentation tests, the boundary conditions of the finite element model were set. A fixed constraint is implemented to sample bottom edge. A displacement loading mode was used and two analysis steps of loading and unloading was set. A vertical displacement load is exerted to the indenter top.
Depth deviation is usually much smaller than the indentation depth but has a great impact on measurement accuracy. Figure 6 shows four depth deviations resulting from surface defects and tip irregularities. In the simulations, the depth deviation δ = 10 nm and the indentation depth h = 400 nm. Stress contours of the simulations are shown in Figure 7. The stresses are mainly concentrated at these indenter tips and diffuse outward from the indenter tips. Moreover, Figure 7 shows that the stress contours are not affected by substrates.
The load–depth curves are obtained by measuring the relationships between reaction force and indenter displacement during loading and unloading, as shown in Figure 8. From Figure 8a, at the same depth, the required load on groove defects is larger and that on convex defects is smaller. From Figure 8b, the required load of tip bluntness is larger and that of the tip sharpness is smaller. These indirectly reflect the deviation of measured hardness.
Through the Oliver–Pharr method [1,2], the hardness–depth curves are calculated in Figure 9. Due to indentation tests being based on a smooth plane, the measured hardness of plane is the true hardness and its hardness change is small and negligible. From Figure 9, the results strongly show four ISE phenomena that are manifested as either an increase or decrease in hardness with decreasing depth. For the groove defect and tip bluntness, they lead to a normal ISE. For the convex defect and tip sharpness, they lead to a reverse ISE. This confirms our conjecture that the surface defect and tip irregularity are also responsible for the ISE. Previous studies reported that the phenomena of normal ISE are usual, while reverse ISE phenomena are less so. In the past, most mentions of the normal ISE would be associated with the strain gradient plasticity theory [3,32,33,52,53], but there is no satisfactory explanation for the reverse ISE [28]. Of great significance, this paper not only adds two causes of the reverse ISE, but also gives clear explanations for the reverse ISE’s existence.
Lastly, the simulation results were compared with our theoretical model, as shown in Figure 10. The results show that simulations are generally consistent with our theory for both surface defect and tip irregularity. Moreover, the simulation results are increasingly in agreement with our theoretical model as h/δ increases. This demonstrates that our theoretical model is sufficient to explain the ISE incorporating surface defect and tip irregularity.
3.2. Comparison of Both Effects
The complicated nature of the ISE depends on various factors, on which uniform classifying and analyzing is necessary. The influences of surface defect and tip irregularity on the ISE are expressed through the depth deviation δ. Our analytical model can reveal the unified effects of both factors. In other words, the ISE based on the surface defect is similar to that based on tip irregularity for deep indentation. To be specific, as shown in Figure 11, the convex defect can be regarded as the tip sharpness, while the groove defect can be regarded as the tip bluntness. Their stress contours are shown in Figure 12.
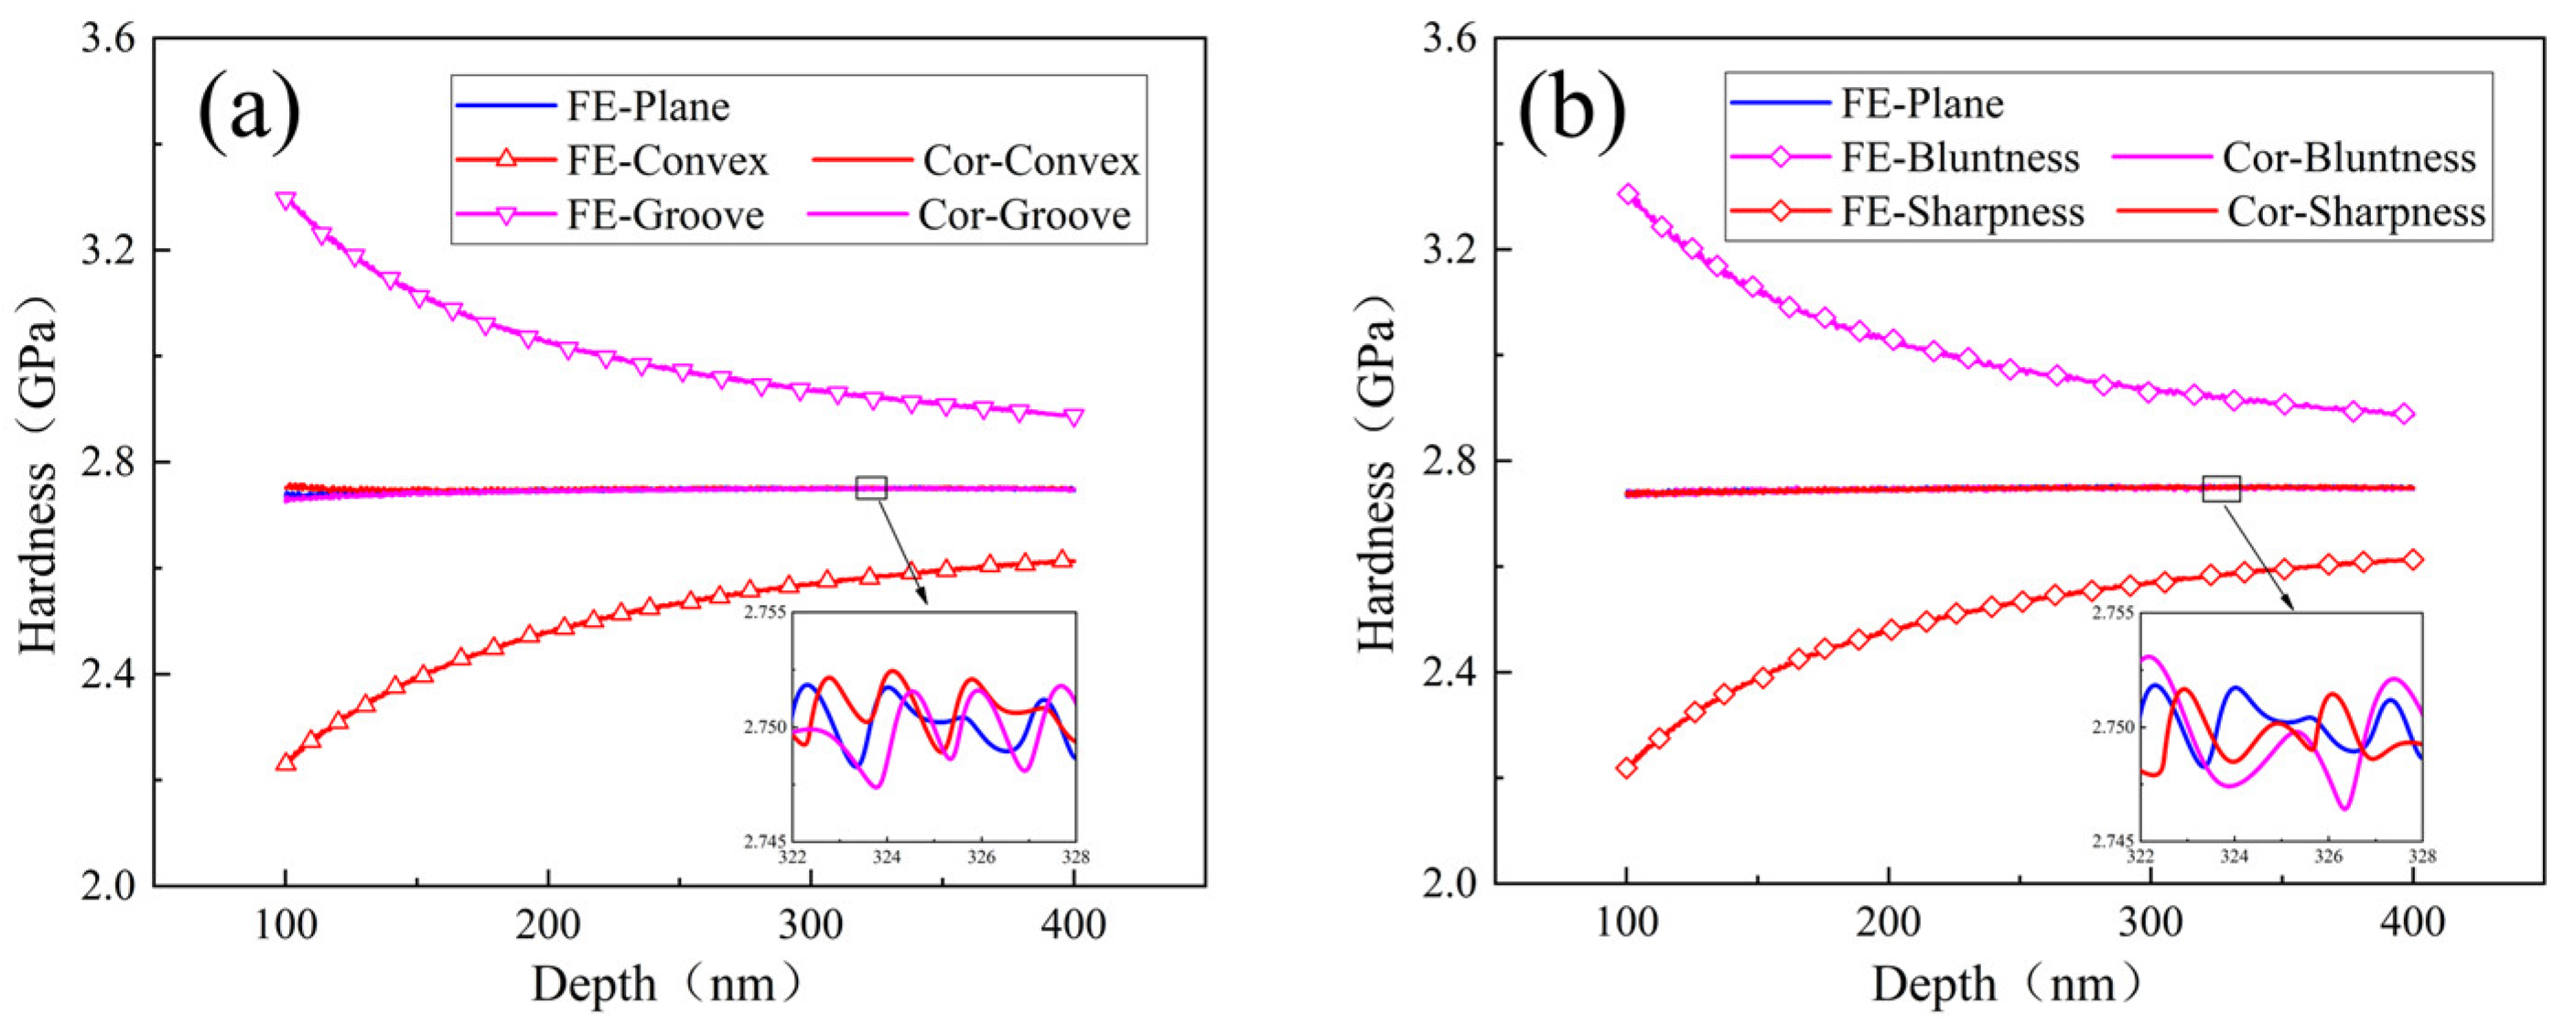
The comparisons of the hardness–depth relationships resulting from both surface defect and tip irregularity are shown in Figure 13. Specifically, Figure 13a shows that hardness–depth dependence caused by groove defect is consistent with what tip bluntness results in. Figure 13b shows that hardness–depth dependence caused by the convex defect is consistent with what tip sharpness results in. The results demonstrate that the effects of two factors on the ISE are expressed through the depth deviation δ.
Moreover, impurities stuck at indenter tip can affect hardness measurements, especially the indenter tip is easy to stick impurities in high-temperature experiments. The impurity can also generate a depth deviation δ to lead to an inaccuracy in measured hardness, which is similar to the effects of tip sharpness or convex defect in Figure 14. Thus, tip impurity can be also considered a cause of the ISE. As shown in Figure 15, two indentation tests, considering tip impurity and tip sharpness, were simulated. respectively. Then, two corresponding hardness–depth dependencies were compared in Figure 16. The result shows that the two dependencies are similar, which demonstrates that the tip impurity effect is consistent with that of tip sharpness.
In a word, we concluded that both surface defect and tip irregularity lead to the ISE through the depth deviation δ, and these two influence mechanisms can be transformed into each other.
3.3. Experimental Comparison
The nature of the ISE is complicated, as it results from multiple causes [39,54,55]. In addition to surface defect and tip irregularity, other non-strain gradient factors can result in the ISE, such as the friction between indenter and specimen [54], the structural nonuniformity of the deformed volume [56], the effect of mixed elastic and plastic deformation [30], the heterogeneity or damage of specimen structure [57,58], etc. Hence, it is difficult to find out the cause if an ISE phenomenon appears in an experiment. This is because most ISE phenomena are very similar. For instance, Figure 17 exhibits an ISE phenomenon resulting from strain gradient plasticity, which can also be interpreted by our model based on surface defect and tip irregularity. This implies that some ISE phenomena can be explained by both models based on strain gradient plasticity and non-strain gradient factors. In this case, it is necessary to distinguish whether the ISE is due to strain gradient or other causes. How to distinguish which cause is responsible for the ISE in experiments? So far there is no good method.
3.4. Elimination of ISE Based on External Factors
To distinguish the causes on which the ISE is based, the influence of non-strain gradient factors should be excluded. Here, our analyses showed that all the influence of external geometrical defects can be attributed to a geometrical parameter δ, i.e., the depth deviation. Generally, the ISE is gradually decreased with increasing depth. For obtaining accurate hardness, most scholars increase indentation depth to decrease the influence of the ISE. However, this method is insufficient for thin films whose thickness is only several nanometers.
Here, taking the ISE resulting from surface defect and tip irregularity as an example, a method was proposed to eliminate the hardness deviation and correct the true hardness through compensating the defect height. In other words, the depth deviation δ should be considered when calculating contact area, and A = f(h) is changed into A = f(h ± δ). In experiments, the feature size δ of sample morphology and indenter tip irregularity can be obtained through scanning electron microscopes. As shown in Figure 18, whether the effect of surface defect or tip irregularity, the corrected hardness is very consistent with the true hardness. Hence, this method can solve the inaccuracy of measured hardness due to the ISE based on surface defect and tip irregularity.
Many factors can lead to the depth dependence of hardness and contribute to the appearance of ISE. If a solution incorporating one factor cannot eliminate ISE, this indicates there are other factors affecting the ISE. For inaccurate data that the ISE affected, more solutions need to be explored. Only by analyzing the causes of the ISE can one improve the whole system of ISE origin.
4. Conclusions
In this work, we critically reviewed previous experimental phenomena about the indentation size effect (ISE) and summarized the causes of the ISE based on non-strain gradient. Herein, the surface defect and indenter tip irregularity were considered two important factors leading to the ISE for shallow indentation. An analytical model based on classical plasticity was developed to explain that the ISE can be from surface defects of materials and/or indentation tip irregularity. Moreover, this model is validated through numerical simulation without the strain gradient. For the ISE resulting from non-strain gradient plasticity, its hardness deviation can be eliminated. The following conclusions are drawn in this work:
- Surface defects and indenter tip irregularity can lead to the emergence of the ISE. To be specific, both groove defect and tip bluntness can result in a normal ISE that is manifested as an increase in hardness with decreasing depth. Both convex defect and tip sharpness can result in a reverse ISE that is manifested as a decrease in hardness with decreasing depth.
- The ISE based on surface defect was compared with that based on tip irregularity. The groove defect can be equivalently expressed as tip bluntness and the convex defect can be equivalently expressed as tip sharpness.
- The developed analytical model revealed the hardness–depth-dependent relationships of both the normal ISE and the reverse ISE. To be specific, the normal ISE is expressed as and the reverse ISE is expressed as .
- The effect of both external factors on the ISE is uniformly equivalent to a depth deviation δ. The ISE based on δ is eliminated and the deviation of measured hardness is corrected. The core idea of this method is based on the calibration of depth deviation.
The origin of the ISE is complicated and induced by multiple causes including the strain gradient and the non-strain gradient factors of materials. The ISE based on non-strain gradient factors is similar to that based on strain gradient, which may lead to confusion about the explanation of experimental measurements. This work suggests that only after eliminating the effect of non-strain gradient factors in indentation tests can one determine whether the ISE results from the strain gradient plasticity.
Author Contributions
Conceptualization: X.L. and W.Z.; Methodology: X.L. and W.Z.; Validation: X.L. and Z.D.; Data analysis: D.L. and J.Z.; Investigation: X.L., Z.D. and Z.W.; Resources: D.L. and J.Z.; Visualization: X.L., Z.D. and Z.W.; Supervision: W.Z.; Writing—original draft preparation: X.L.; Writing—review and editing: W.Z.; Funding acquisition: W.Z. All authors have read and agreed to the published version of the manuscript.
Funding
This work is supported by the National Natural Science Foundation of China or by NSFC (grant nos. U21B2058, 11972025, and 11772246) and the National Science and Technology Major Project (2019-VII-0007-0147).
Institutional Review Board Statement
Not applicable.
Informed Consent Statement
Not applicable.
Data Availability Statement
The data that support this study are available from the corresponding author upon reasonable request.
Acknowledgments
The authors thank Tony J. Zhang for polishing the language of the paper. Finally, the authors thank Huajian Gao for the valuable comments on the paper.
Conflicts of Interest
The authors declare no conflict of interest.
References
- Oliver, W.C.; Pharr, G.M. Measurement of hardness and elastic modulus by instrumented indentation: Advances in understanding and refinements to methodology. J. Mater. Res. 2004, 19, 3–20. [Google Scholar] [CrossRef]
- Oliver, W.C.; Pharr, G.M. An improved technique for determining hardness and elastic modulus using load and displacement sensing indentation experiments. J. Mater. Res. 1992, 7, 1564–1583. [Google Scholar] [CrossRef]
- Nix, W.D.; Gao, H. Indentation size effects in crystalline materials: A law for strain gradient plasticity. J. Mech. Phys. Solids 1998, 46, 411–425. [Google Scholar] [CrossRef]
- Begley, M.R.; Hutchinson, J.W. The mechanics of size-dependent indentation. J. Mech. Phys. Solids 1998, 46, 2049–2068. [Google Scholar] [CrossRef]
- Elmustafa, A.; Eastman, J.; Rittner, M.; Weertman, J.; Stone, D. Indentation size effect: Large grained aluminum versus nanocrystalline aluminum-zirconium alloys. Scr. Mater. 2000, 43, 951–955. [Google Scholar] [CrossRef]
- Durst, K.; Franke, O.; Böhner, A.; Göken, M. Indentation size effect in Ni–Fe solid solutions. Acta Mater. 2007, 55, 6825–6833. [Google Scholar] [CrossRef]
- Durst, K.; Backes, B.; Franke, O.; Göken, M. Indentation size effect in metallic materials: Modeling strength from pop-in to macroscopic hardness using geometrically necessary dislocations. Acta Mater. 2006, 54, 2547–2555. [Google Scholar] [CrossRef]
- Ma, X.; Higgins, W.; Liang, Z.; Zhao, D.; Pharr, G.M.; Xie, K.Y. Exploring the origins of the indentation size effect at submicron scales. Proc. Natl. Acad. Sci. USA 2021, 118, e2025657118. [Google Scholar] [CrossRef]
- Jang, J.-I.; Yoo, B.-G.; Kim, Y.-J.; Oh, J.-H.; Choi, I.-C.; Bei, H. Indentation size effect in bulk metallic glass. Scr. Mater. 2011, 64, 753–756. [Google Scholar] [CrossRef]
- Wang, J.; Volz, T.; Weygand, S.M.; Schwaiger, R. The indentation size effect of single-crystalline tungsten revisited. J. Mater. Res. 2021, 36, 2166–2175. [Google Scholar] [CrossRef]
- Feng, G.; Nix, W.D. Indentation size effect in MgO. Scr. Mater. 2004, 51, 599–603. [Google Scholar] [CrossRef]
- Liu, M.; Lu, C.; Tieu, A.K. Crystal plasticity finite element method modelling of indentation size effect. Int. J. Solids Struct. 2015, 54, 42–49. [Google Scholar] [CrossRef]
- Wang, L.; Asempah, I.; Li, X.; Zang, S.-Q.; Zhou, Y.-F.; Ding, J.; Jin, L. Indentation size effect in aqueous electrophoretic deposition zirconia dental ceramic. J. Mater. Res. 2019, 34, 555–562. [Google Scholar] [CrossRef]
- Pöhl, F.; Huth, S.; Theisen, W. Detection of the indentation-size-effect (ISE) and surface hardening by analysis of the loading curvature C. Int. J. Solids Struct. 2016, 84, 160–166. [Google Scholar] [CrossRef]
- Kim, Y.-C.; Gwak, E.-J.; Ahn, S.-M.; Jang, J.-I.; Han, H.N.; Kim, J.-Y. Indentation size effect in nanoporous gold. Acta Mater. 2017, 138, 52–60. [Google Scholar] [CrossRef]
- Kathavate, V.S.; Kumar, B.P.; Singh, I.; Prasad, K.E. Analysis of indentation size effect (ISE) in nanoindentation hardness in polycrystalline PMN-PT piezoceramics with different domain configurations. Ceram. Int. 2021, 47, 11870–11877. [Google Scholar] [CrossRef]
- Pharr, G.M.; Herbert, E.G.; Gao, Y. The indentation size effect: A critical examination of experimental observations and mechanistic interpretations. Annu. Rev. Mater. Res. 2010, 40, 271–292. [Google Scholar] [CrossRef]
- Fleck, N.; Muller, G.; Ashby, M.F.; Hutchinson, J.W. Strain gradient plasticity: Theory and experiment. Acta Metall. Mater. 1994, 42, 475–487. [Google Scholar] [CrossRef]
- Ma, Q.; Clarke, D.R. Size dependent hardness of silver single crystals. J. Mater. Res. 1995, 10, 853–863. [Google Scholar] [CrossRef]
- Sangwal, K.; Surowska, B.; Błaziak, P. Analysis of the indentation size effect in the microhardness measurement of some cobalt-based alloys. Mater. Chem. Phys. 2003, 77, 511–520. [Google Scholar] [CrossRef]
- Peng, Z.; Gong, J.; Miao, H. On the description of indentation size effect in hardness testing for ceramics: Analysis of the nanoindentation data. J. Eur. Ceram. Soc. 2004, 24, 2193–2201. [Google Scholar] [CrossRef]
- Gao, H.; Huang, Y.; Nix, W.; Hutchinson, J. Mechanism-based strain gradient plasticity—I. Theory. J. Mech. Phys. Solids 1999, 47, 1239–1263. [Google Scholar] [CrossRef]
- Huang, Y.; Gao, H.; Nix, W.; Hutchinson, J. Mechanism-based strain gradient plasticity—II. Analysis. J. Mech. Phys. Solids 2000, 48, 99–128. [Google Scholar] [CrossRef]
- Huang, Y.; Qu, S.; Hwang, K.; Li, M.; Gao, H. A conventional theory of mechanism-based strain gradient plasticity. Int. J. Plast. 2004, 20, 753–782. [Google Scholar] [CrossRef]
- Huang, Y.; Xue, Z.; Gao, H.; Nix, W.; Xia, Z. A study of microindentation hardness tests by mechanism-based strain gradient plasticity. J. Mater. Res. 2000, 15, 1786–1796. [Google Scholar] [CrossRef]
- Huang, Y.; Zhang, F.; Hwang, K.; Nix, W.; Pharr, G.; Feng, G. A model of size effects in nano-indentation. J. Mech. Phys. Solids 2006, 54, 1668–1686. [Google Scholar] [CrossRef]
- Qu, S.; Huang, Y.; Pharr, G.; Hwang, K. The indentation size effect in the spherical indentation of iridium: A study via the conventional theory of mechanism-based strain gradient plasticity. Int. J. Plast. 2006, 22, 1265–1286. [Google Scholar] [CrossRef]
- Sangwal, K. On the reverse indentation size effect and microhardness measurement of solids. Mater. Chem. Phys. 2000, 63, 145–152. [Google Scholar] [CrossRef]
- Muslić, M.; Orešković, L.; Rede, V.; Maksimović, V. Indentation Size Effect of Composite A356+ 6% FA Subjected to ECAP. Metals 2022, 12, 821. [Google Scholar] [CrossRef]
- Liu, W.; Chen, L.; Cheng, Y.; Yu, L.; Yi, X.; Gao, H.; Duan, H. Model of nanoindentation size effect incorporating the role of elastic deformation. J. Mech. Phys. Solids 2019, 126, 245–255. [Google Scholar] [CrossRef]
- Cui, W.; Qiu, J.; Wang, H.; Su, B. Indentation Size Effect Model of Ti6Al4V Alloy by Combining the Macroscopic Power-Law Constitutive Relation and Strain Gradient Theory. Adv. Eng. Mater. 2022, 24, 2101735. [Google Scholar] [CrossRef]
- Elmustafa, A.; Stone, D. Nanoindentation and the indentation size effect: Kinetics of deformation and strain gradient plasticity. J. Mech. Phys. Solids 2003, 51, 357–381. [Google Scholar] [CrossRef]
- Al-Rub, R.K.A.; Voyiadjis, G.Z. Analytical and experimental determination of the material intrinsic length scale of strain gradient plasticity theory from micro-and nano-indentation experiments. Int. J. Plast. 2004, 20, 1139–1182. [Google Scholar] [CrossRef]
- Jung, B.-B.; Lee, H.-K.; Park, H.-C. Effect of grain size on the indentation hardness for polycrystalline materials by the modified strain gradient theory. Int. J. Solids Struct. 2013, 50, 2719–2724. [Google Scholar] [CrossRef] [Green Version]
- Xiao, X.; Chen, L.; Yu, L.; Duan, H. Modelling nano-indentation of ion-irradiated FCC single crystals by strain-gradient crystal plasticity theory. Int. J. Plast. 2019, 116, 216–231. [Google Scholar] [CrossRef]
- Gerberich, W.; Tymiak, N.; Grunlan, J.; Horstemeyer, M.; Baskes, M. Interpretations of indentation size effects. J. Appl. Mech. 2002, 69, 433–442. [Google Scholar] [CrossRef]
- Ma, Z.; Long, S.; Pan, Y.; Zhou, Y. Indentation depth dependence of the mechanical strength of Ni films. J. Appl. Phys. 2008, 103, 043512. [Google Scholar] [CrossRef]
- Liu, Y.; Ngan, A. Depth dependence of hardness in copper single crystals measured by nanoindentation. Scr. Mater. 2001, 44, 237–241. [Google Scholar] [CrossRef]
- Manika, I.; Maniks, J. Size effects in micro-and nanoscale indentation. Acta Mater. 2006, 54, 2049–2056. [Google Scholar] [CrossRef]
- Li, X.; Zhang, W.; Li, D.; Zhang, J.; Long, B. Numerical Study on the Regression Method to Eliminate the Influence of Surface Morphology on Indentation Hardness of Thin Films. Coatings 2022, 12, 1447. [Google Scholar] [CrossRef]
- Wei, Z.-Y.; Meng, G.-H.; Chen, L.; Li, G.-R.; Liu, M.-J.; Zhang, W.-X.; Zhao, L.-N.; Zhang, Q.; Zhang, X.-D.; Wan, C.-L. Progress in ceramic materials and structure design toward advanced thermal barrier coatings. J. Adv. Ceram. 2022, 11, 985–1068. [Google Scholar] [CrossRef]
- Li, L.; Zhang, W. Thickness effects on the delamination energy release rate of thermal barrier coating subjected to thermo-mechanical loads. Int. J. Solids Struct. 2022, 254, 111937. [Google Scholar] [CrossRef]
- Jiang, W.-G.; Su, J.-J.; Feng, X.-Q. Effect of surface roughness on nanoindentation test of thin films. Eng. Fract. Mech. 2008, 75, 4965–4972. [Google Scholar] [CrossRef]
- Kim, J.-Y.; Kang, S.-K.; Lee, J.-J.; Jang, J.-I.; Lee, Y.-H.; Kwon, D. Influence of surface-roughness on indentation size effect. Acta Mater. 2007, 55, 3555–3562. [Google Scholar] [CrossRef]
- Qiao, X.G.; Starink, M.J.; Gao, N. The influence of indenter tip rounding on the indentation size effect. Acta Mater. 2010, 58, 3690–3700. [Google Scholar] [CrossRef] [Green Version]
- Swadener, J.; George, E.; Pharr, G. The correlation of the indentation size effect measured with indenters of various shapes. J. Mech. Phys. Solids 2002, 50, 681–694. [Google Scholar] [CrossRef]
- Chen, Z.; Diebels, S. Modelling and parameter re-identification of nanoindentation of soft polymers taking into account effects of surface roughness. Comput. Math. Appl. 2012, 64, 2775–2786. [Google Scholar] [CrossRef] [Green Version]
- Liu, M.; Proudhon, H. Finite element analysis of frictionless contact between a sinusoidal asperity and a rigid plane: Elastic and initially plastic deformations. Mech. Mater. 2014, 77, 125–141. [Google Scholar] [CrossRef]
- Sudharshan Phani, P.; Oliver, W.; Pharr, G. Measurement of hardness and elastic modulus by load and depth sensing indentation: Improvements to the technique based on continuous stiffness measurement. J. Mater. Res. 2021, 36, 2137–2153. [Google Scholar] [CrossRef]
- Lu, L.; Dao, M.; Kumar, P.; Ramamurty, U.; Karniadakis, G.E.; Suresh, S. Extraction of mechanical properties of materials through deep learning from instrumented indentation. Proc. Natl. Acad. Sci. USA 2020, 117, 7052–7062. [Google Scholar] [CrossRef]
- Sneddon, I.N. The relation between load and penetration in the axisymmetric Boussinesq problem for a punch of arbitrary profile. Int. J. Eng. Sci. 1965, 3, 47–57. [Google Scholar] [CrossRef]
- Zhao, M.; Slaughter, W.S.; Li, M.; Mao, S.X. Material-length-scale-controlled nanoindentation size effects due to strain-gradient plasticity. Acta Mater. 2003, 51, 4461–4469. [Google Scholar] [CrossRef]
- Guha, S.; Sangal, S.; Basu, S. Finite element studies on indentation size effect using a higher order strain gradient theory. Int. J. Solids Struct. 2013, 50, 863–875. [Google Scholar] [CrossRef] [Green Version]
- Li, N.; Liu, L.; Zhang, M. The role of friction to the indentation size effect in amorphous and crystallized Pd-based alloy. J. Mater. Sci. 2009, 44, 3072–3076. [Google Scholar] [CrossRef]
- Ye, D.; Matsuoka, S.; Nagashima, N. Determination of fatigue mesoscopic mechanical properties of an austenitic stainless steel using depth-sensing indentation (DSI) technique. Mater. Sci. Eng. A 2007, 456, 120–129. [Google Scholar] [CrossRef]
- Gane, N.; Cox, J. The micro-hardness of metals at very low loads. Philos. Mag. 1970, 22, 881–891. [Google Scholar] [CrossRef]
- Wang, T. A continuum damage model for ductile fracture of weld heat affected zone. Eng. Fract. Mech. 1991, 40, 1075–1082. [Google Scholar] [CrossRef]
- Wang, T.-J. Unified CDM model and local criterion for ductile fracture—I. Unified CDM model for ductile fracture. Eng. Fract. Mech. 1992, 42, 177–183. [Google Scholar] [CrossRef]
Figure 1.
Schematic of indentation size effect (ISE) for geometrically self-similar indenters (Adapted and reported based on Pharr et al. [17]).
Figure 1.
Schematic of indentation size effect (ISE) for geometrically self-similar indenters (Adapted and reported based on Pharr et al. [17]).
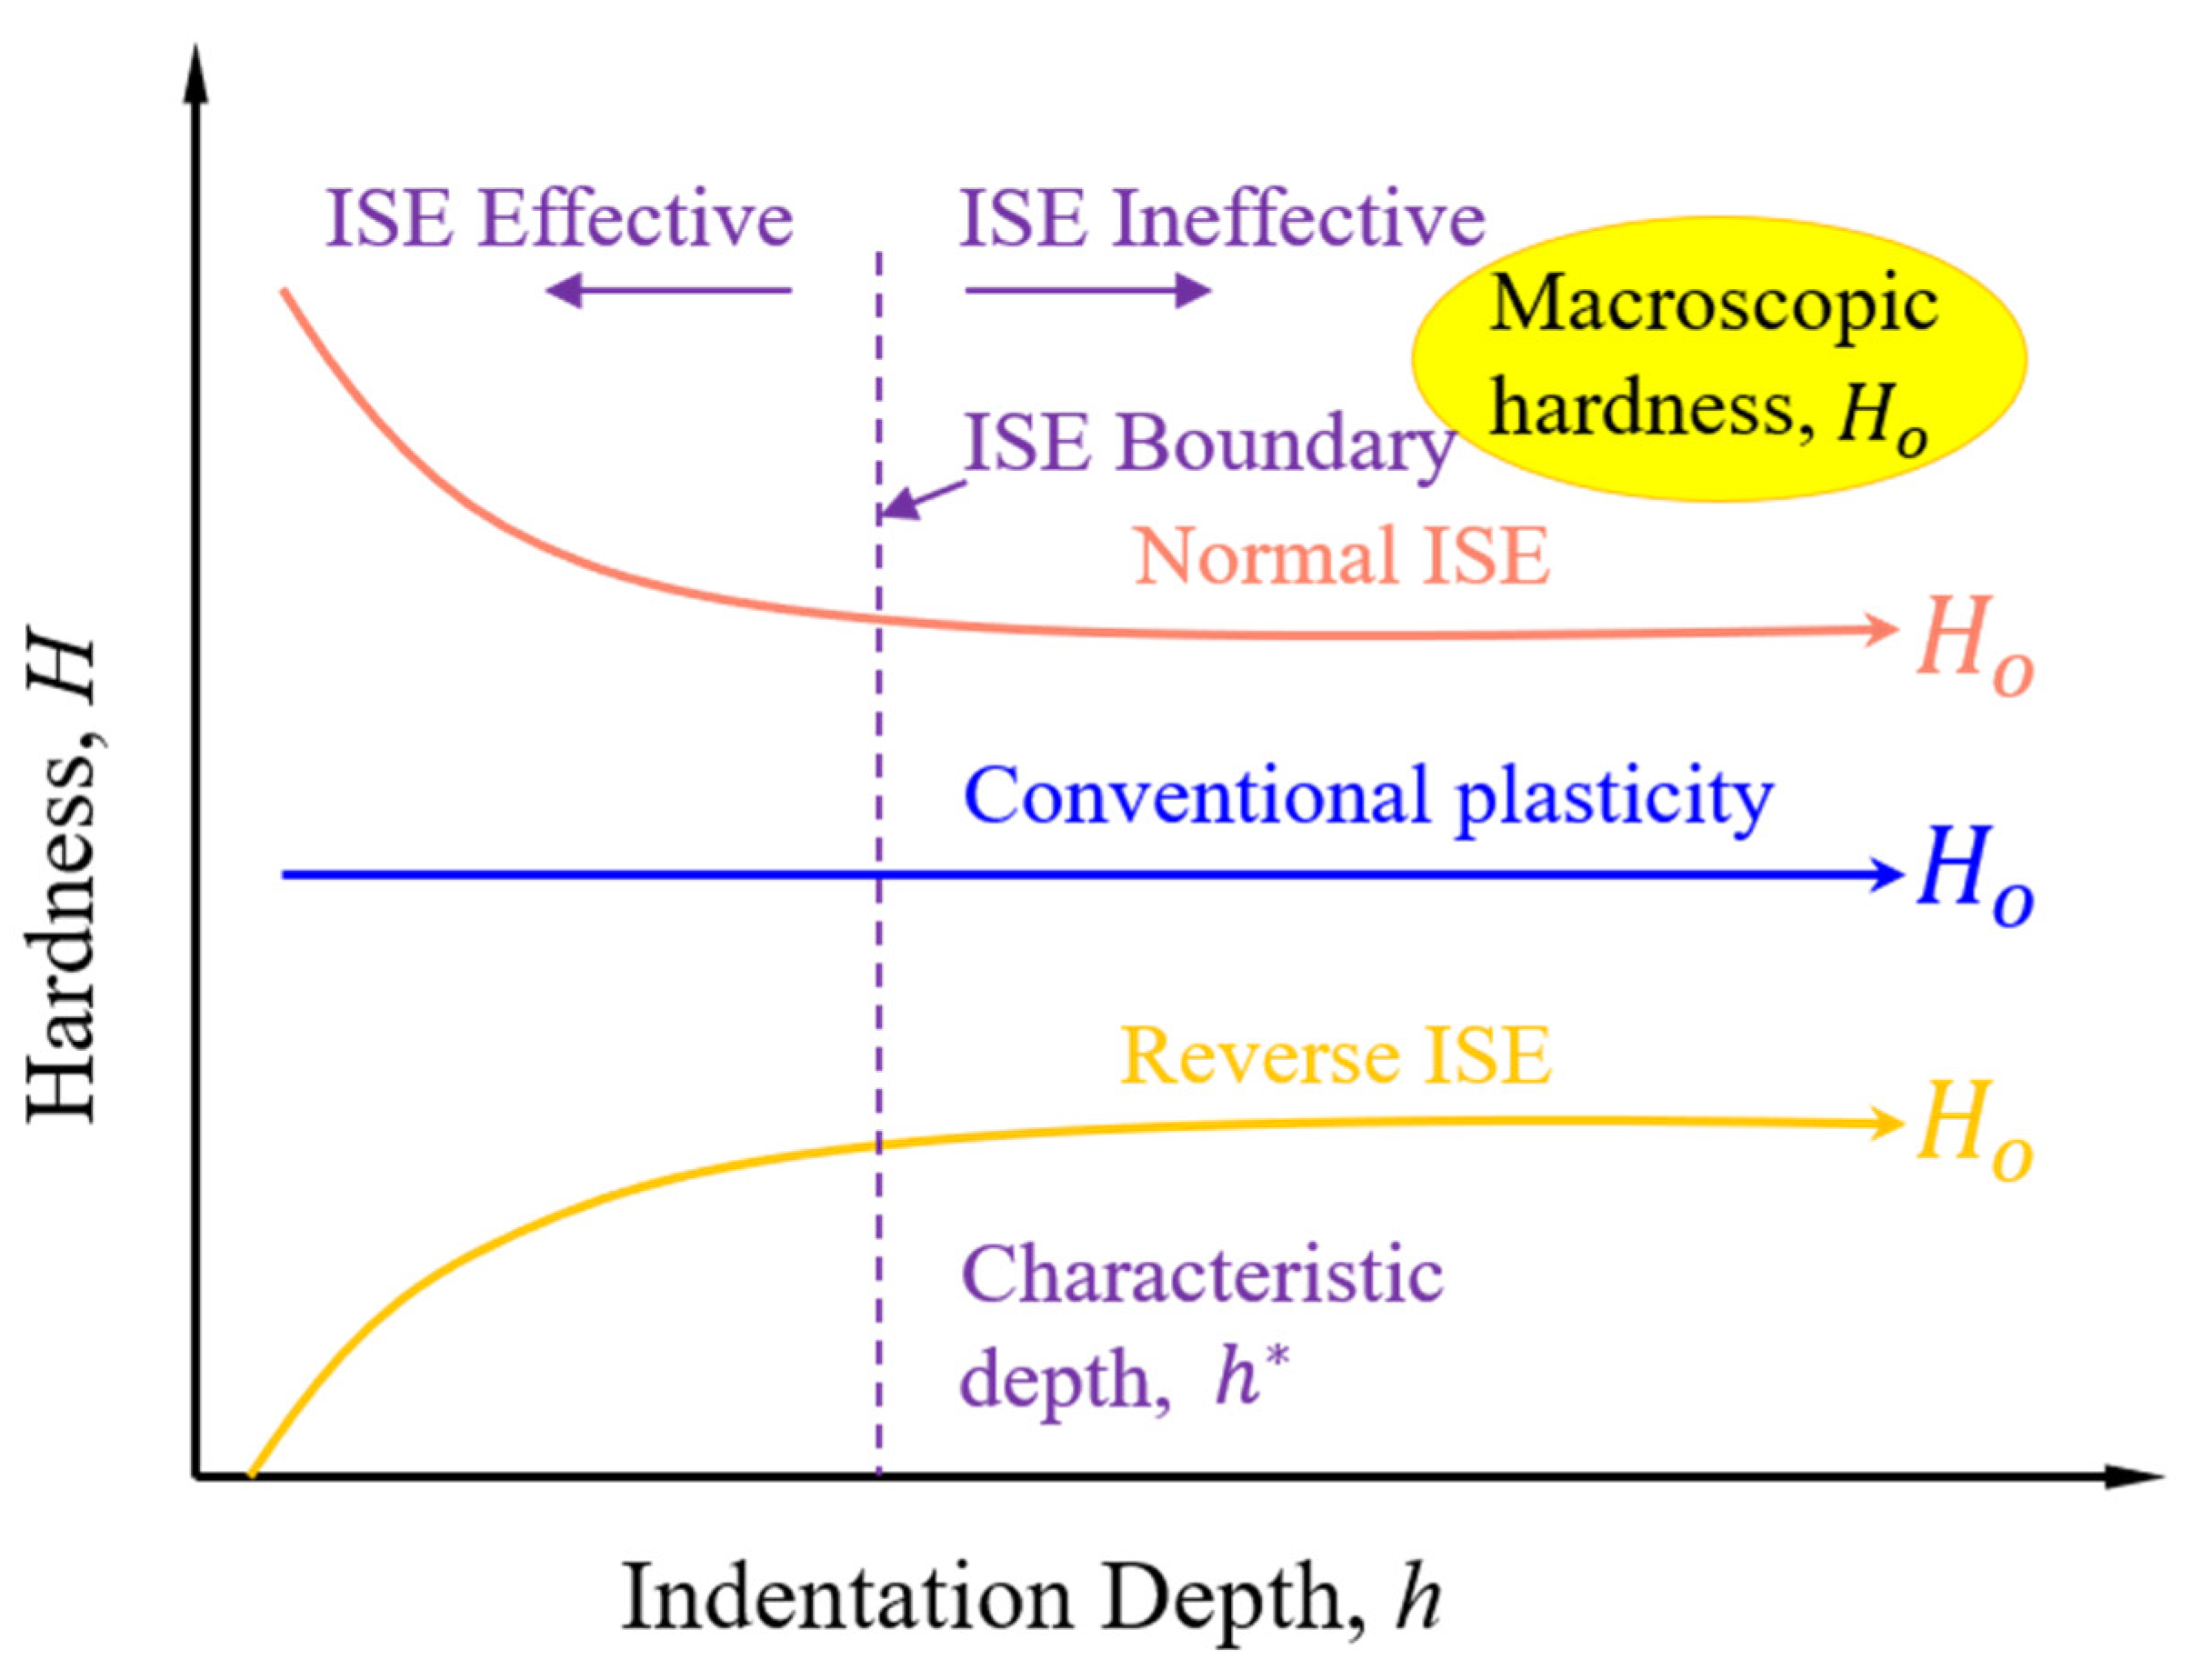
Figure 2.
A sine curve is introduced to establish the defective surface, including groove defects and convex defects. D is the horizontal size of defects and δ is the height of defects. Contact positions of the indenter and the defective surface are groove position and convex position.
Figure 2.
A sine curve is introduced to establish the defective surface, including groove defects and convex defects. D is the horizontal size of defects and δ is the height of defects. Contact positions of the indenter and the defective surface are groove position and convex position.
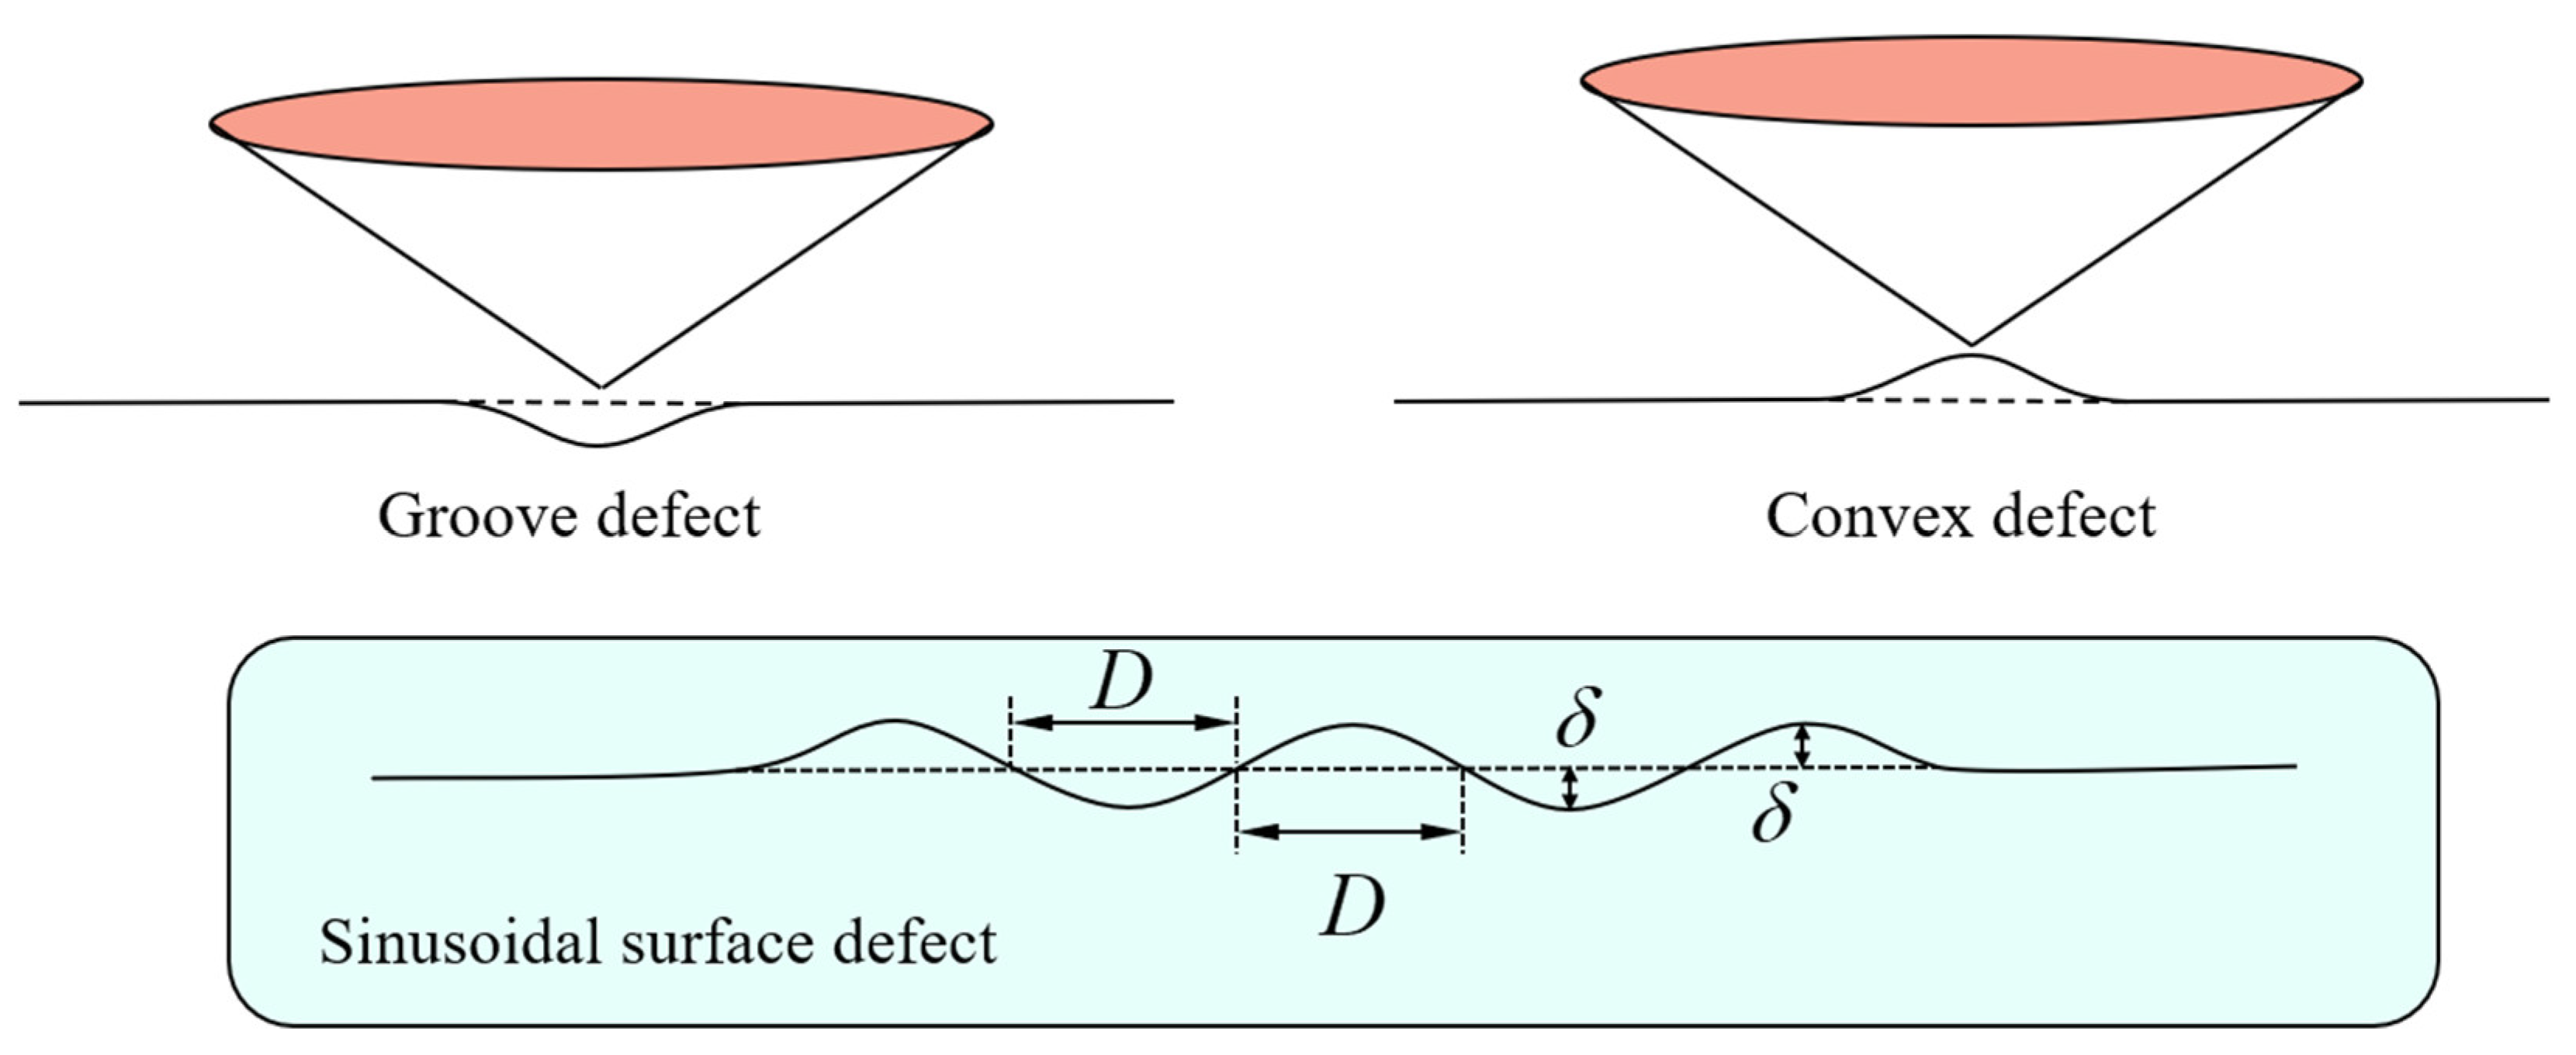
Figure 3.
The indenter tip irregularity includes tip bluntness and tip sharpness. Here, δ represents the length scale of irregular tip shapes.
Figure 3.
The indenter tip irregularity includes tip bluntness and tip sharpness. Here, δ represents the length scale of irregular tip shapes.

Figure 4.
An analytical model about ISE incorporating surface defect and indenter tip irregularity. The normal ISE can model the effect of groove defect effect and tip bluntness, while the effect of convex defect and tip sharpness is expressed by the reverse ISE.
Figure 4.
An analytical model about ISE incorporating surface defect and indenter tip irregularity. The normal ISE can model the effect of groove defect effect and tip bluntness, while the effect of convex defect and tip sharpness is expressed by the reverse ISE.
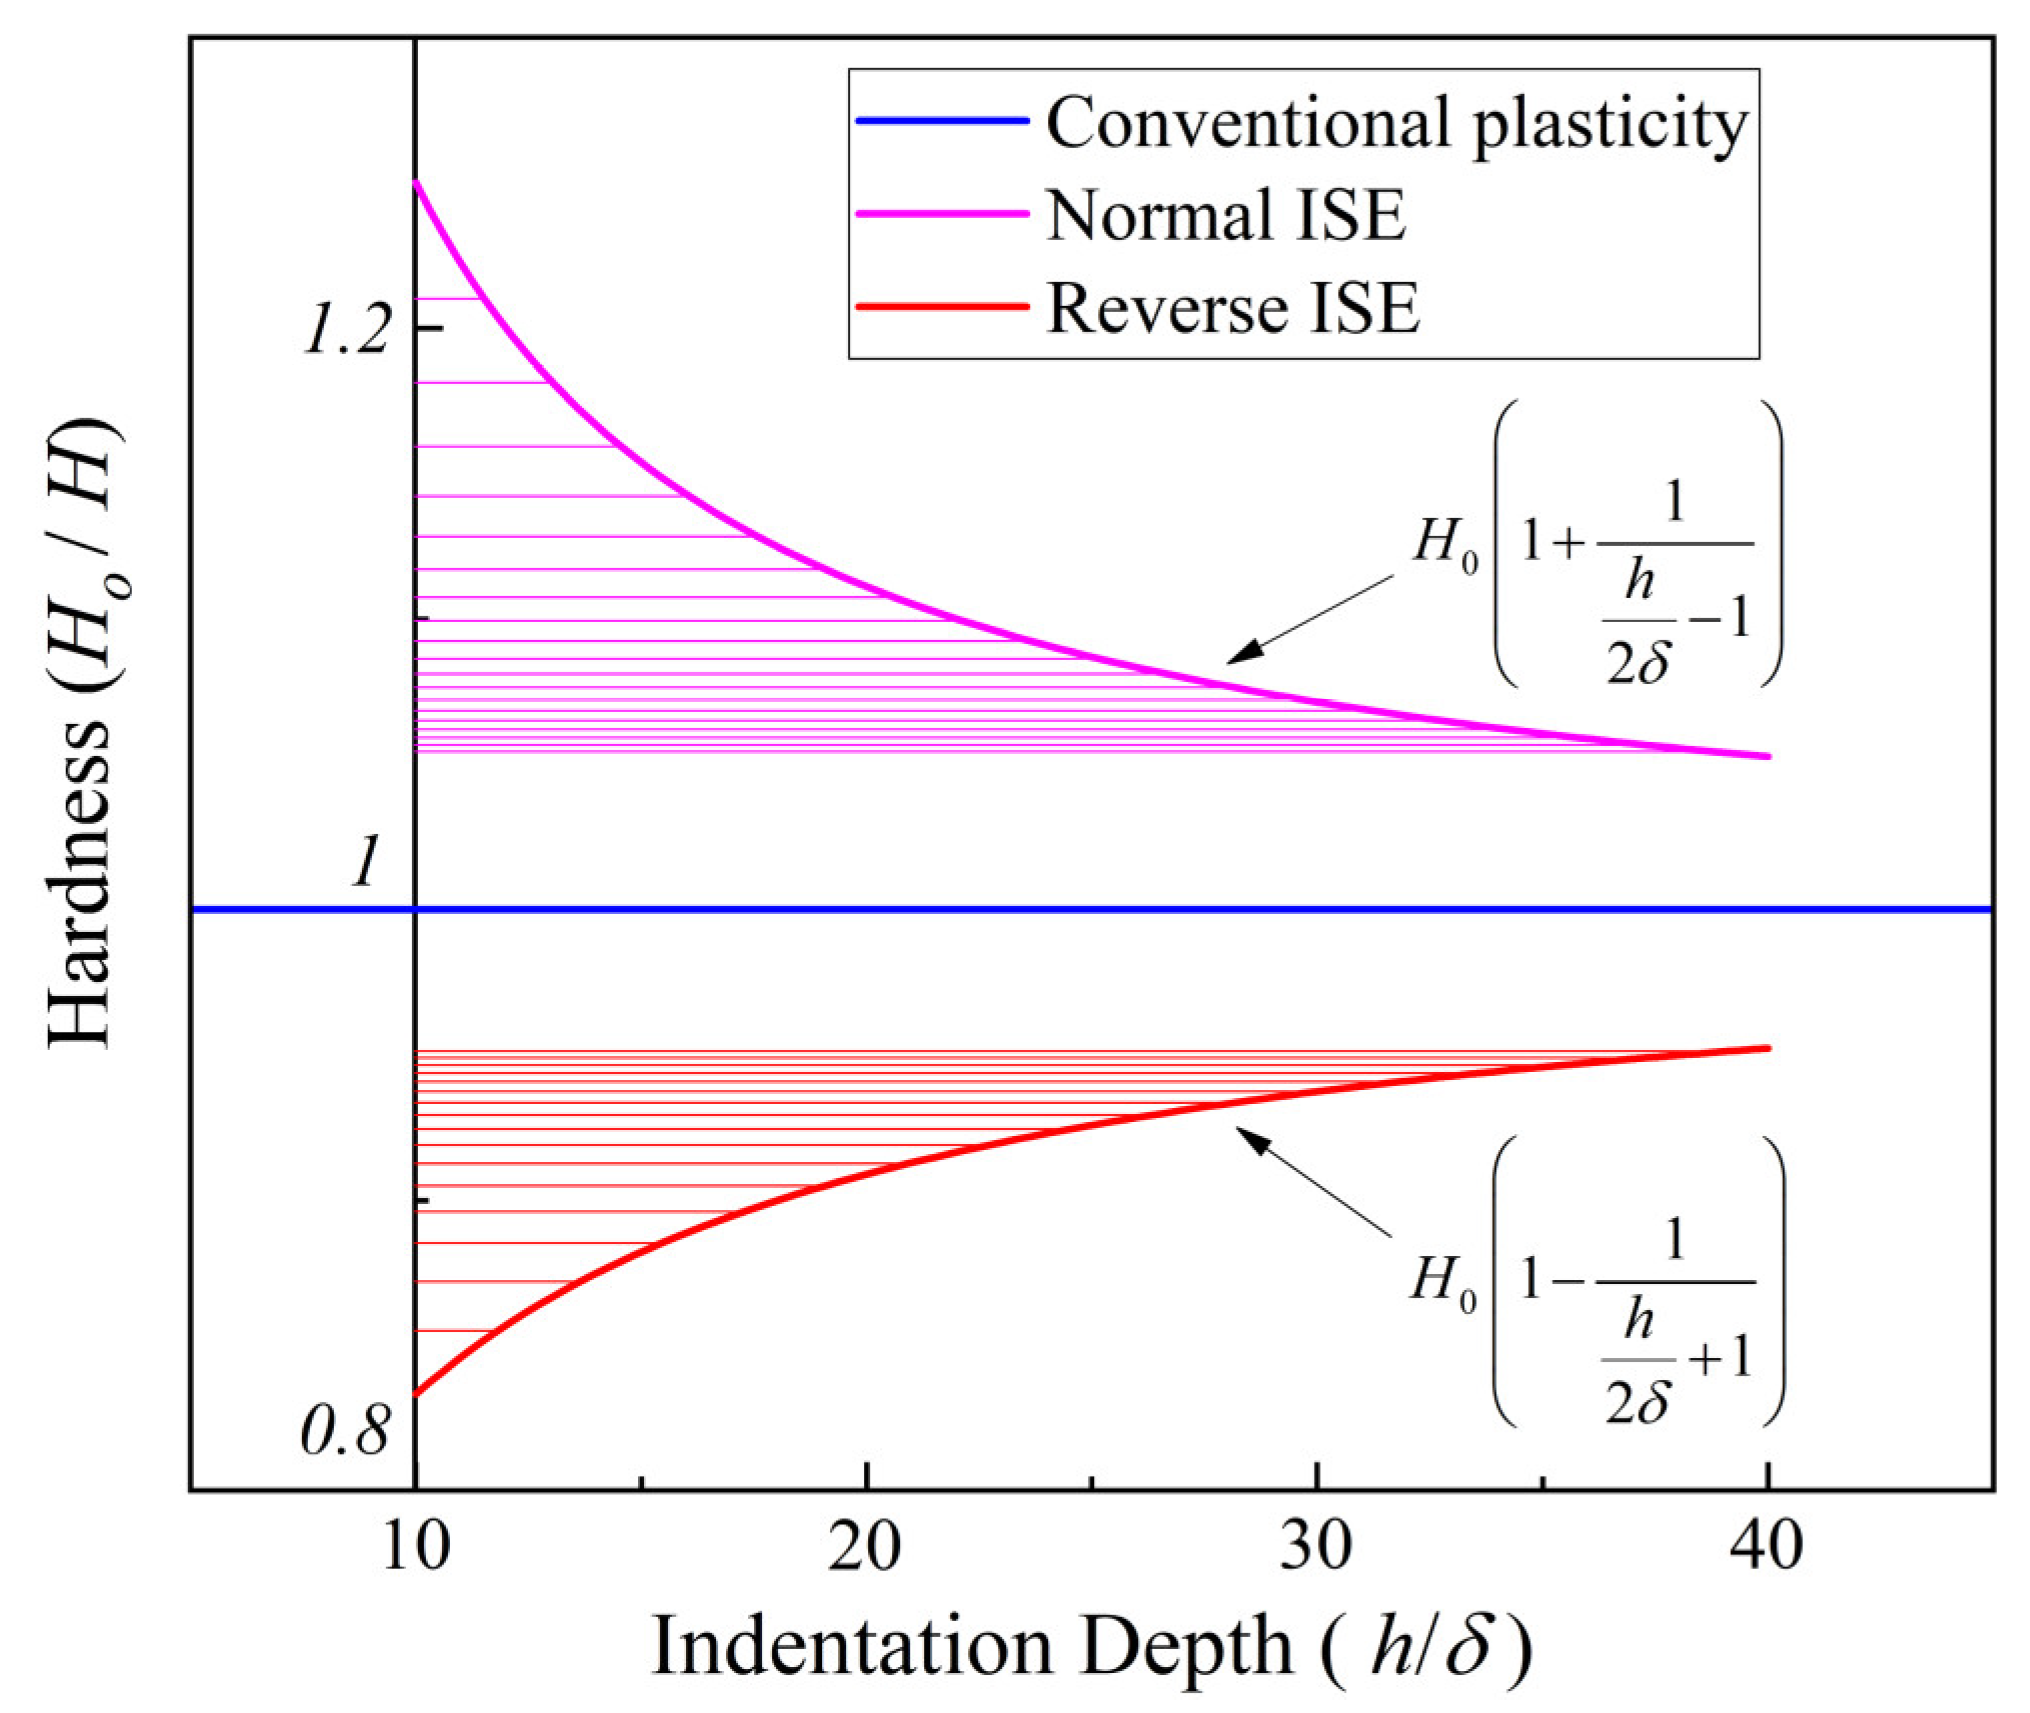
Figure 5.
Comparison of our model and the conventional Nix–Gao model. Both models are related to their own characteristic constants respectively. Here, it simply takes h*/δ = 10.
Figure 5.
Comparison of our model and the conventional Nix–Gao model. Both models are related to their own characteristic constants respectively. Here, it simply takes h*/δ = 10.
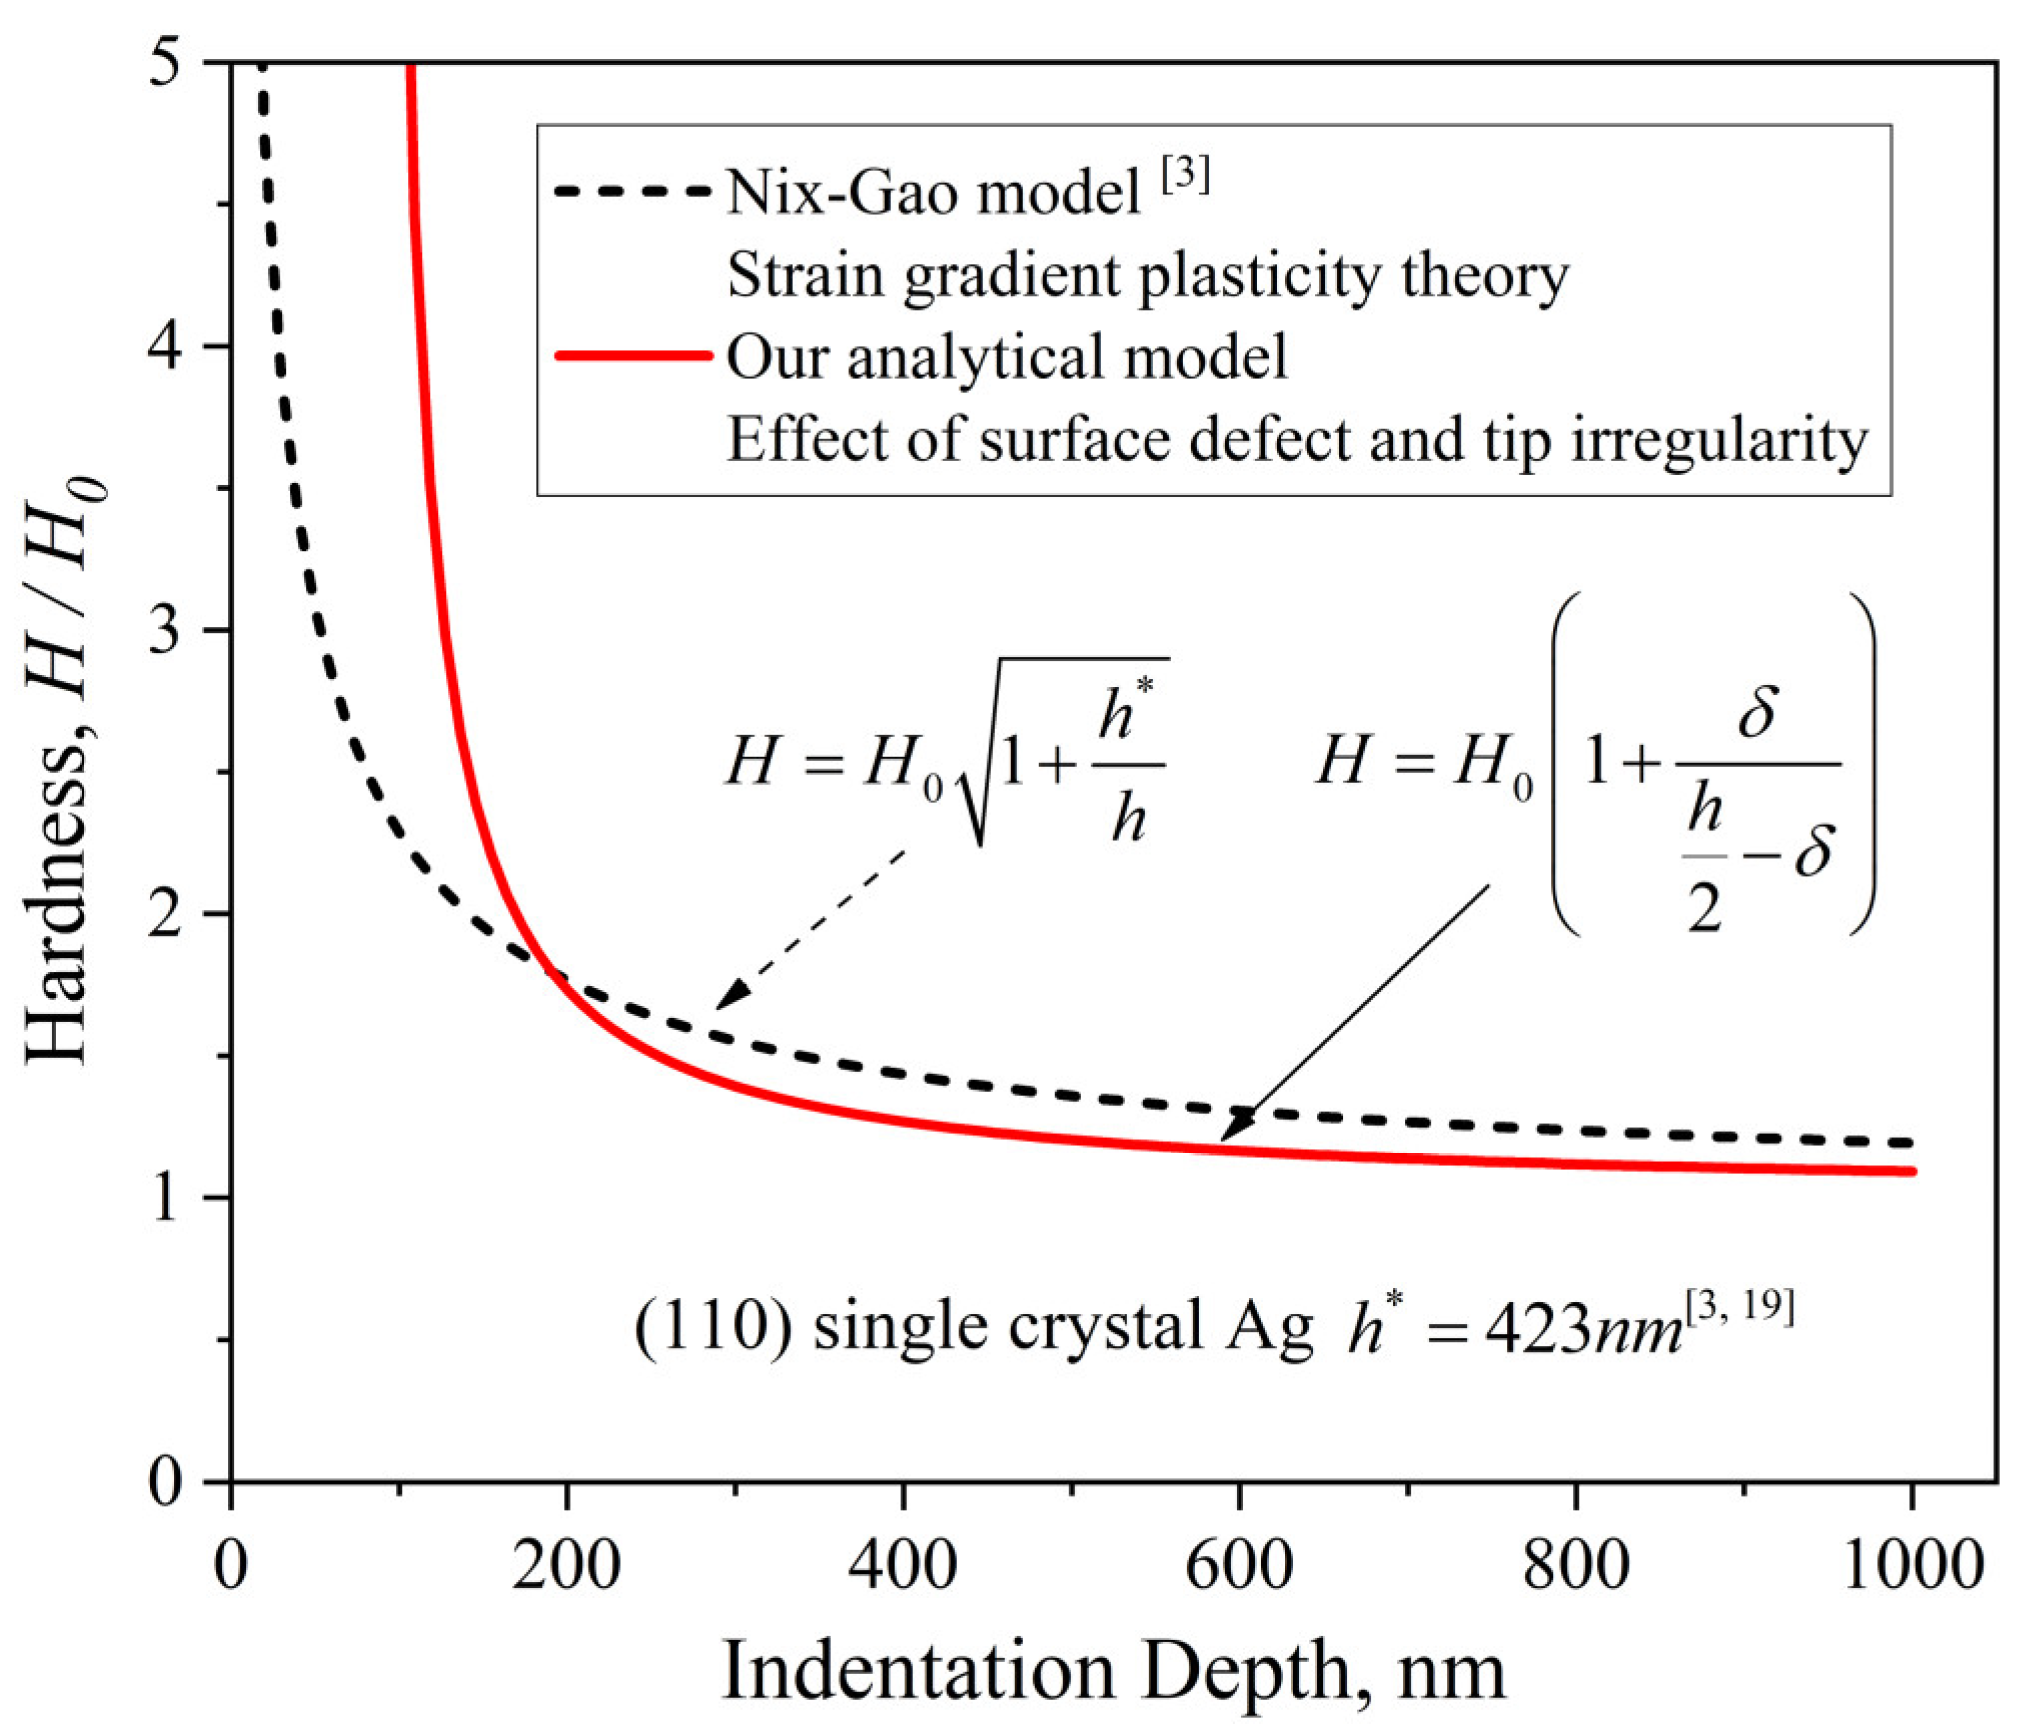
Figure 6.
Different kinds of contacts between indenter and sample.
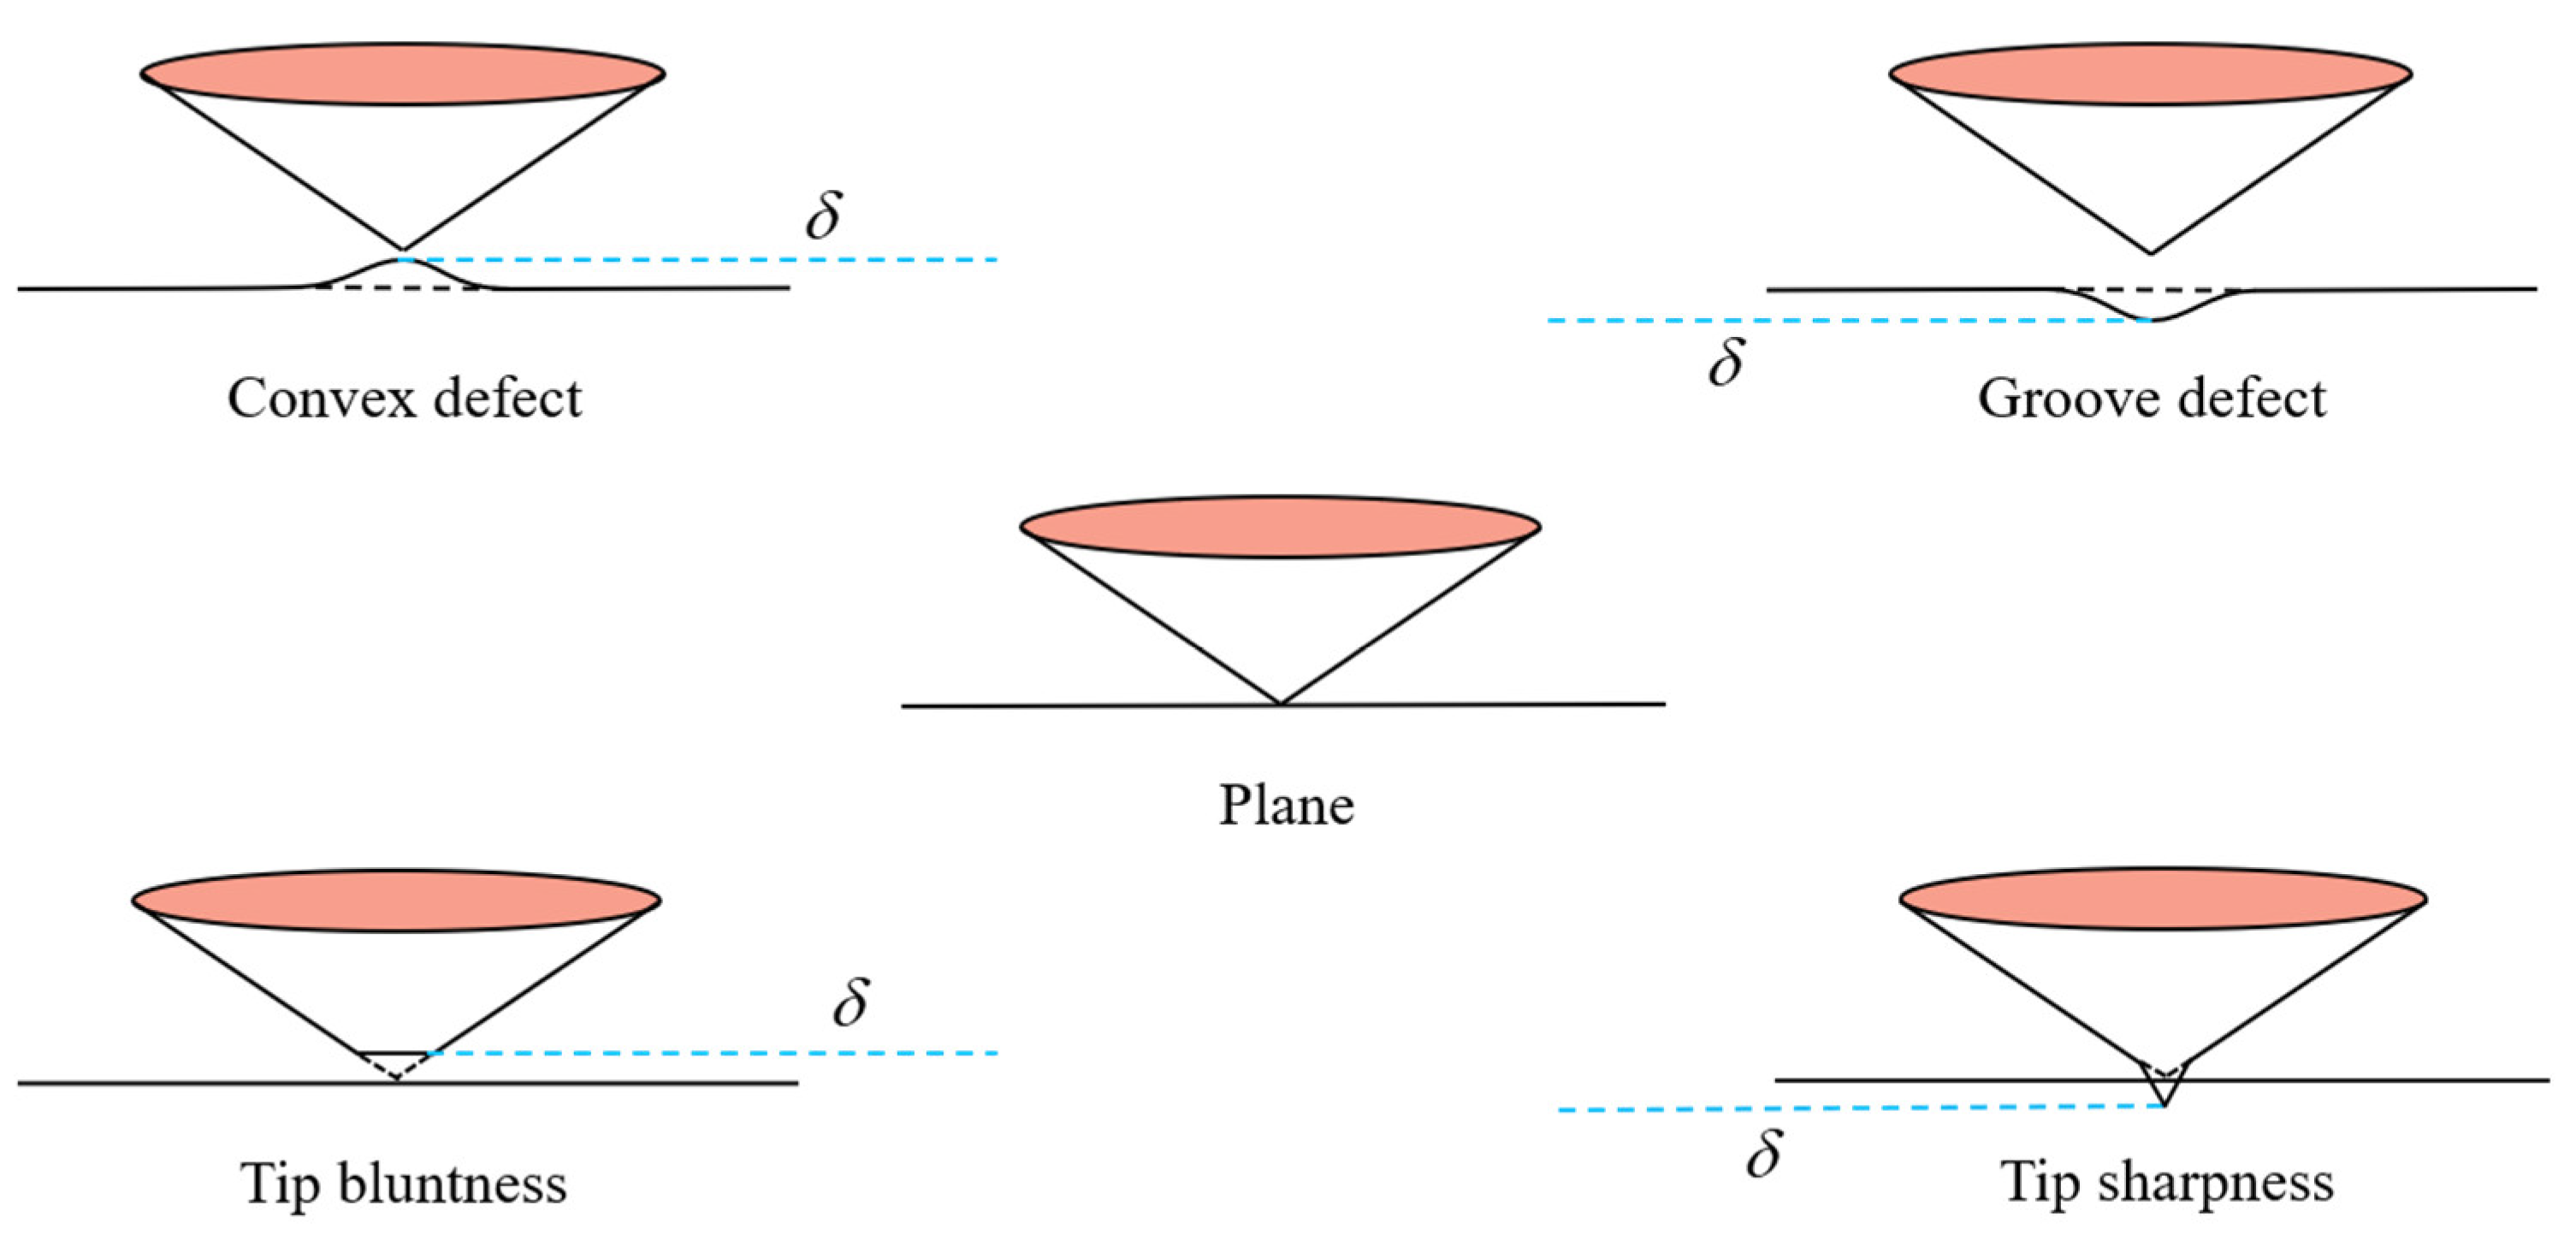
Figure 7.
Stress distributions: (a) convex defect; (b) groove defect; (c) tip bluntness; (d) tip sharpness; (e) plane.
Figure 7.
Stress distributions: (a) convex defect; (b) groove defect; (c) tip bluntness; (d) tip sharpness; (e) plane.
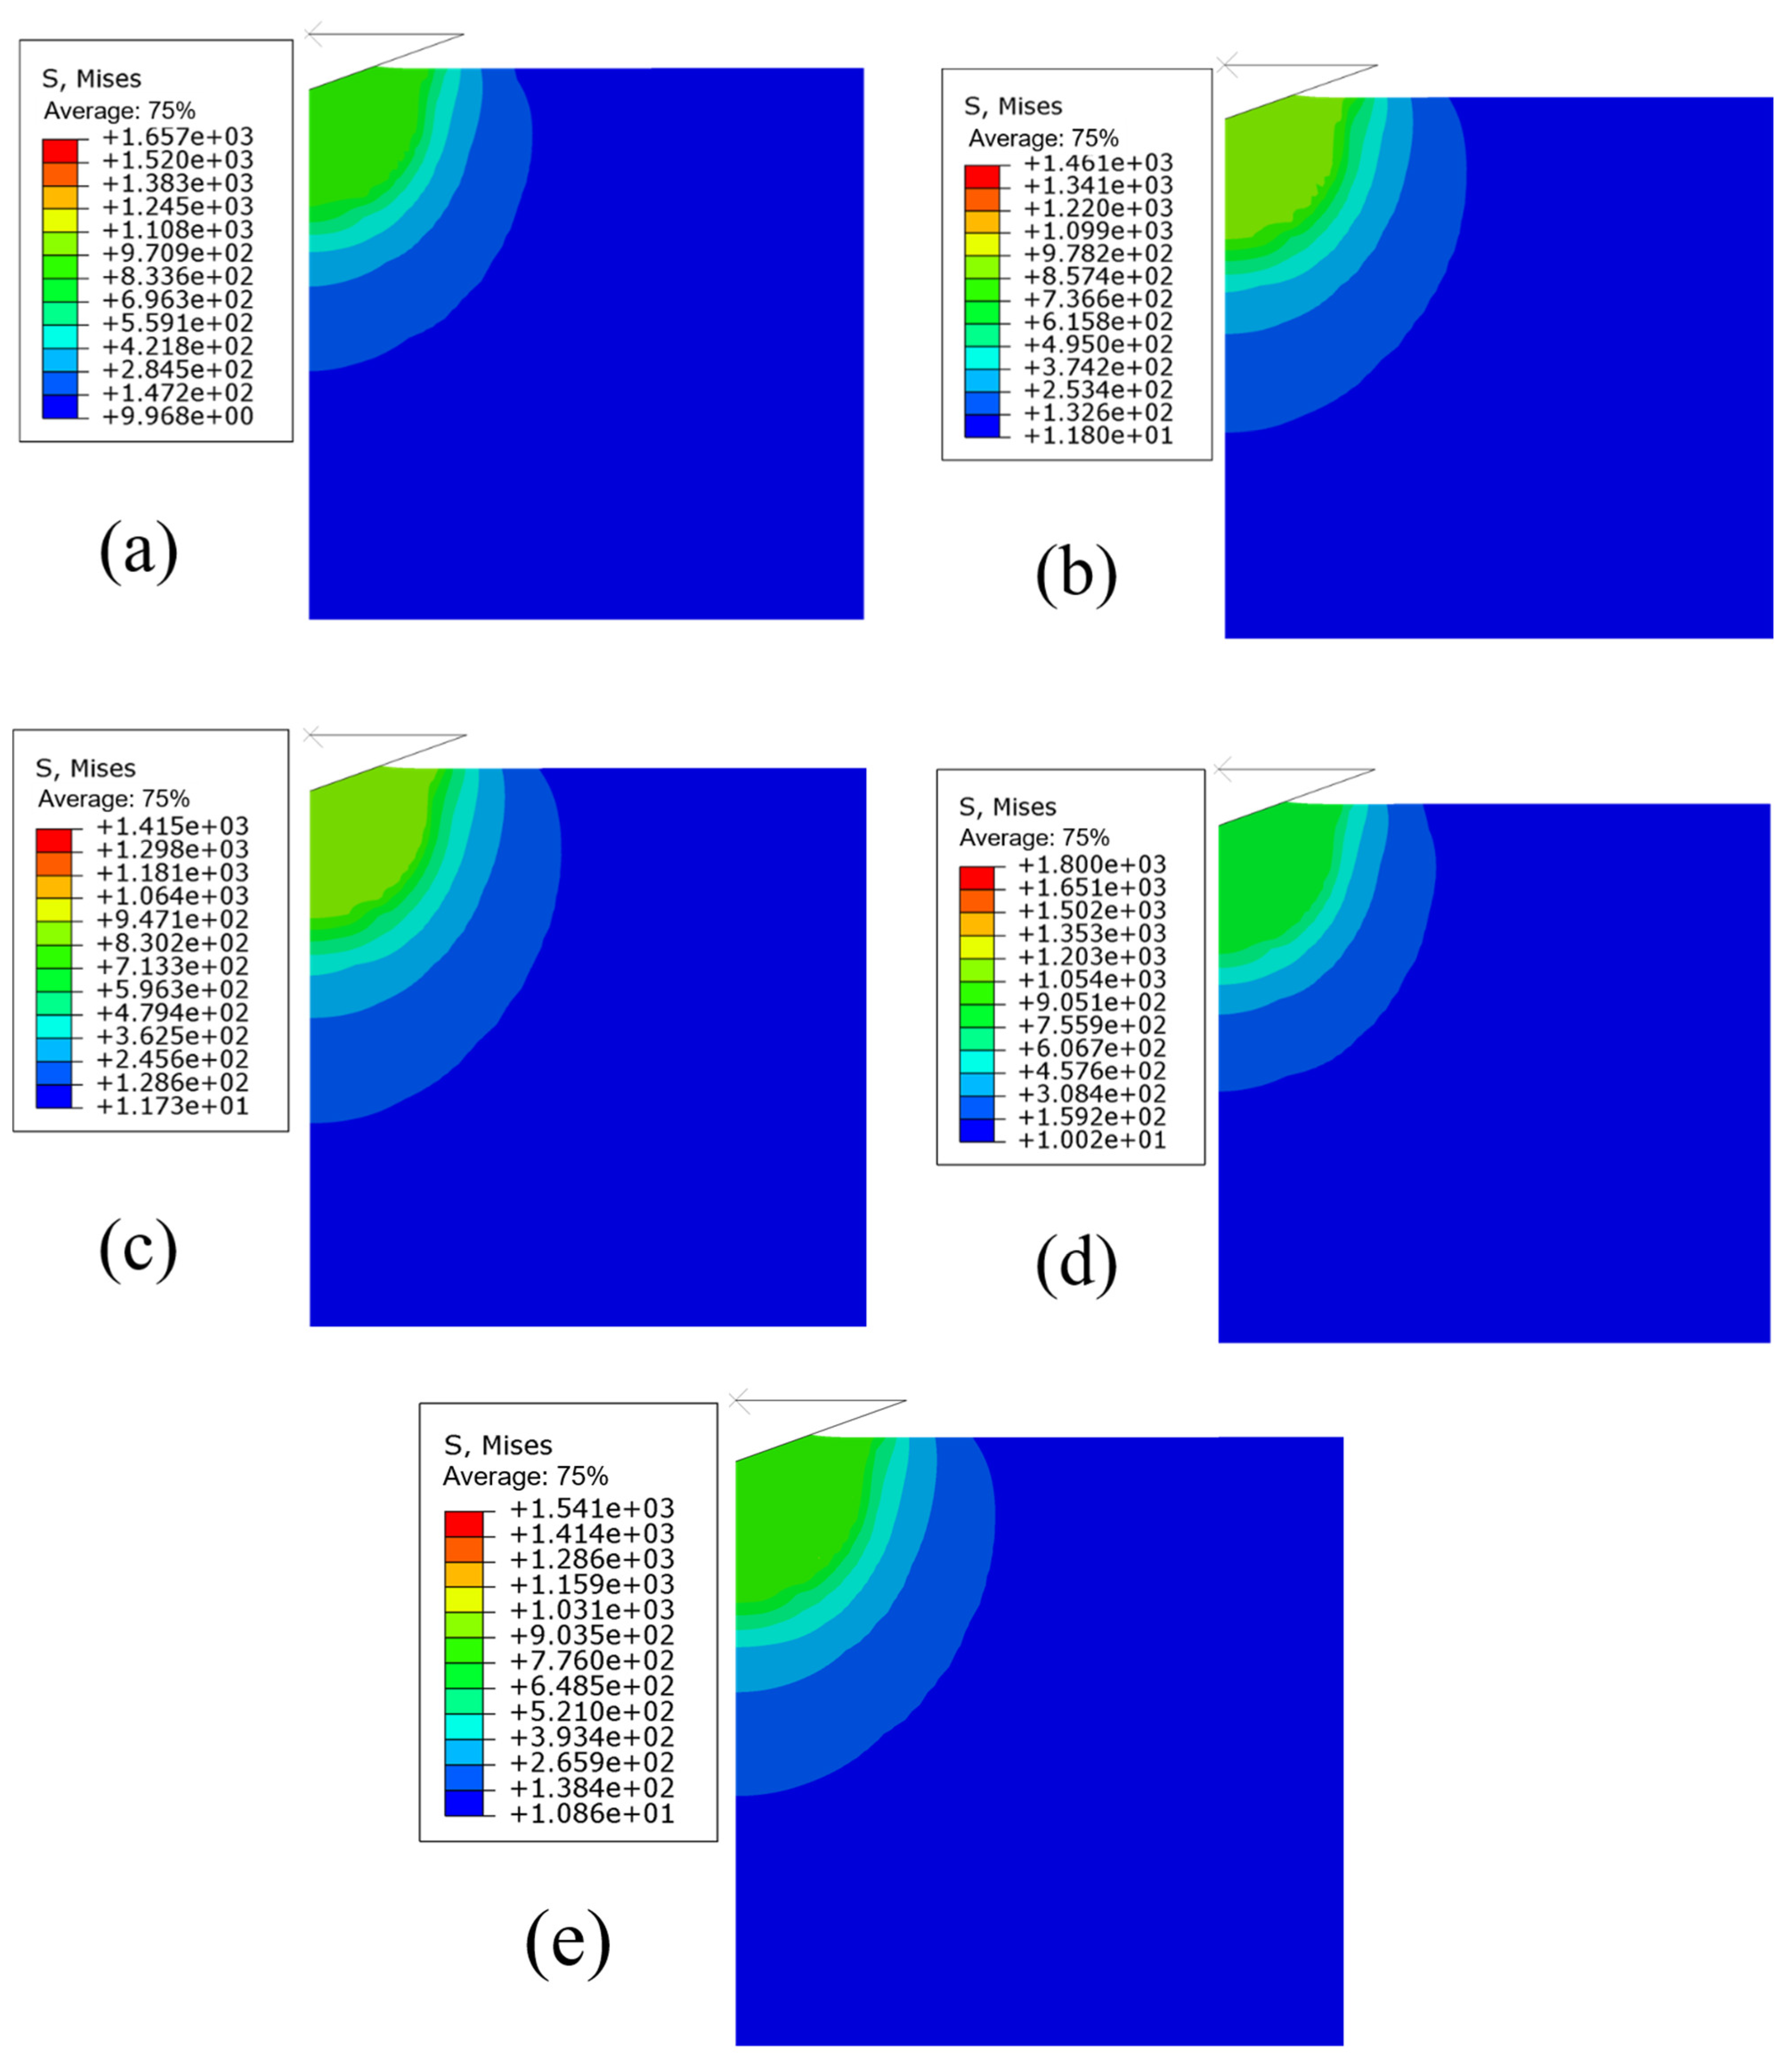
Figure 8.
Load–depth curves: (a) surface defect; (b) indenter tip irregularity.
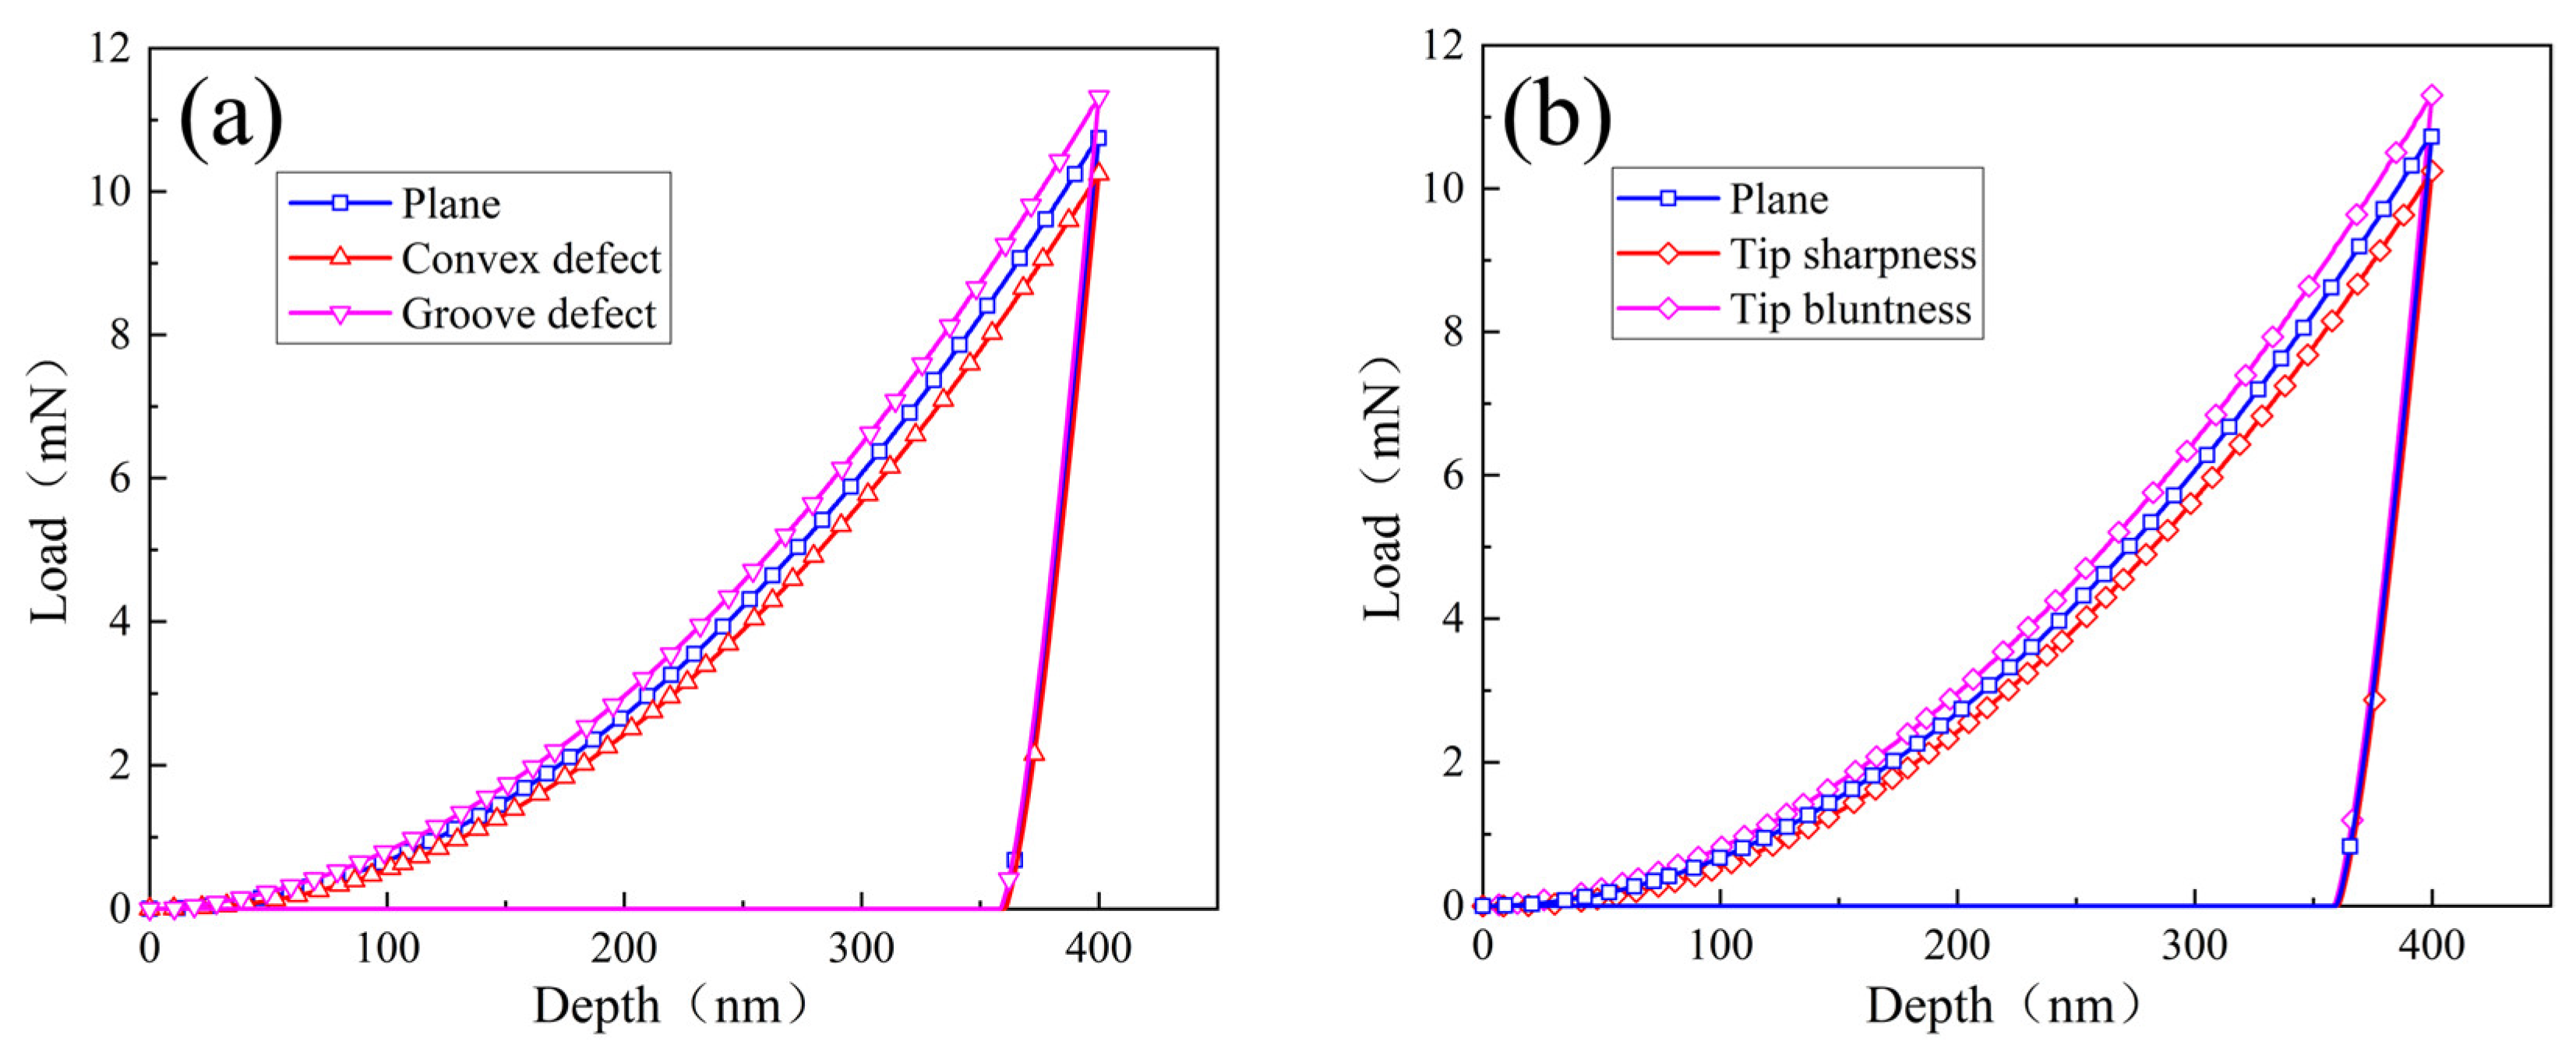
Figure 9.
Hardness–depth curves. The measured hardness of plane is the true hardness of sample, and the true hardness is 2.75 GPa: (a) surface defect; (b) indenter tip irregularity.
Figure 9.
Hardness–depth curves. The measured hardness of plane is the true hardness of sample, and the true hardness is 2.75 GPa: (a) surface defect; (b) indenter tip irregularity.

Figure 10.
Comparison of theoretical predicted model and numerical simulation: (a) surface defect; (b) indenter tip irregularity.
Figure 10.
Comparison of theoretical predicted model and numerical simulation: (a) surface defect; (b) indenter tip irregularity.
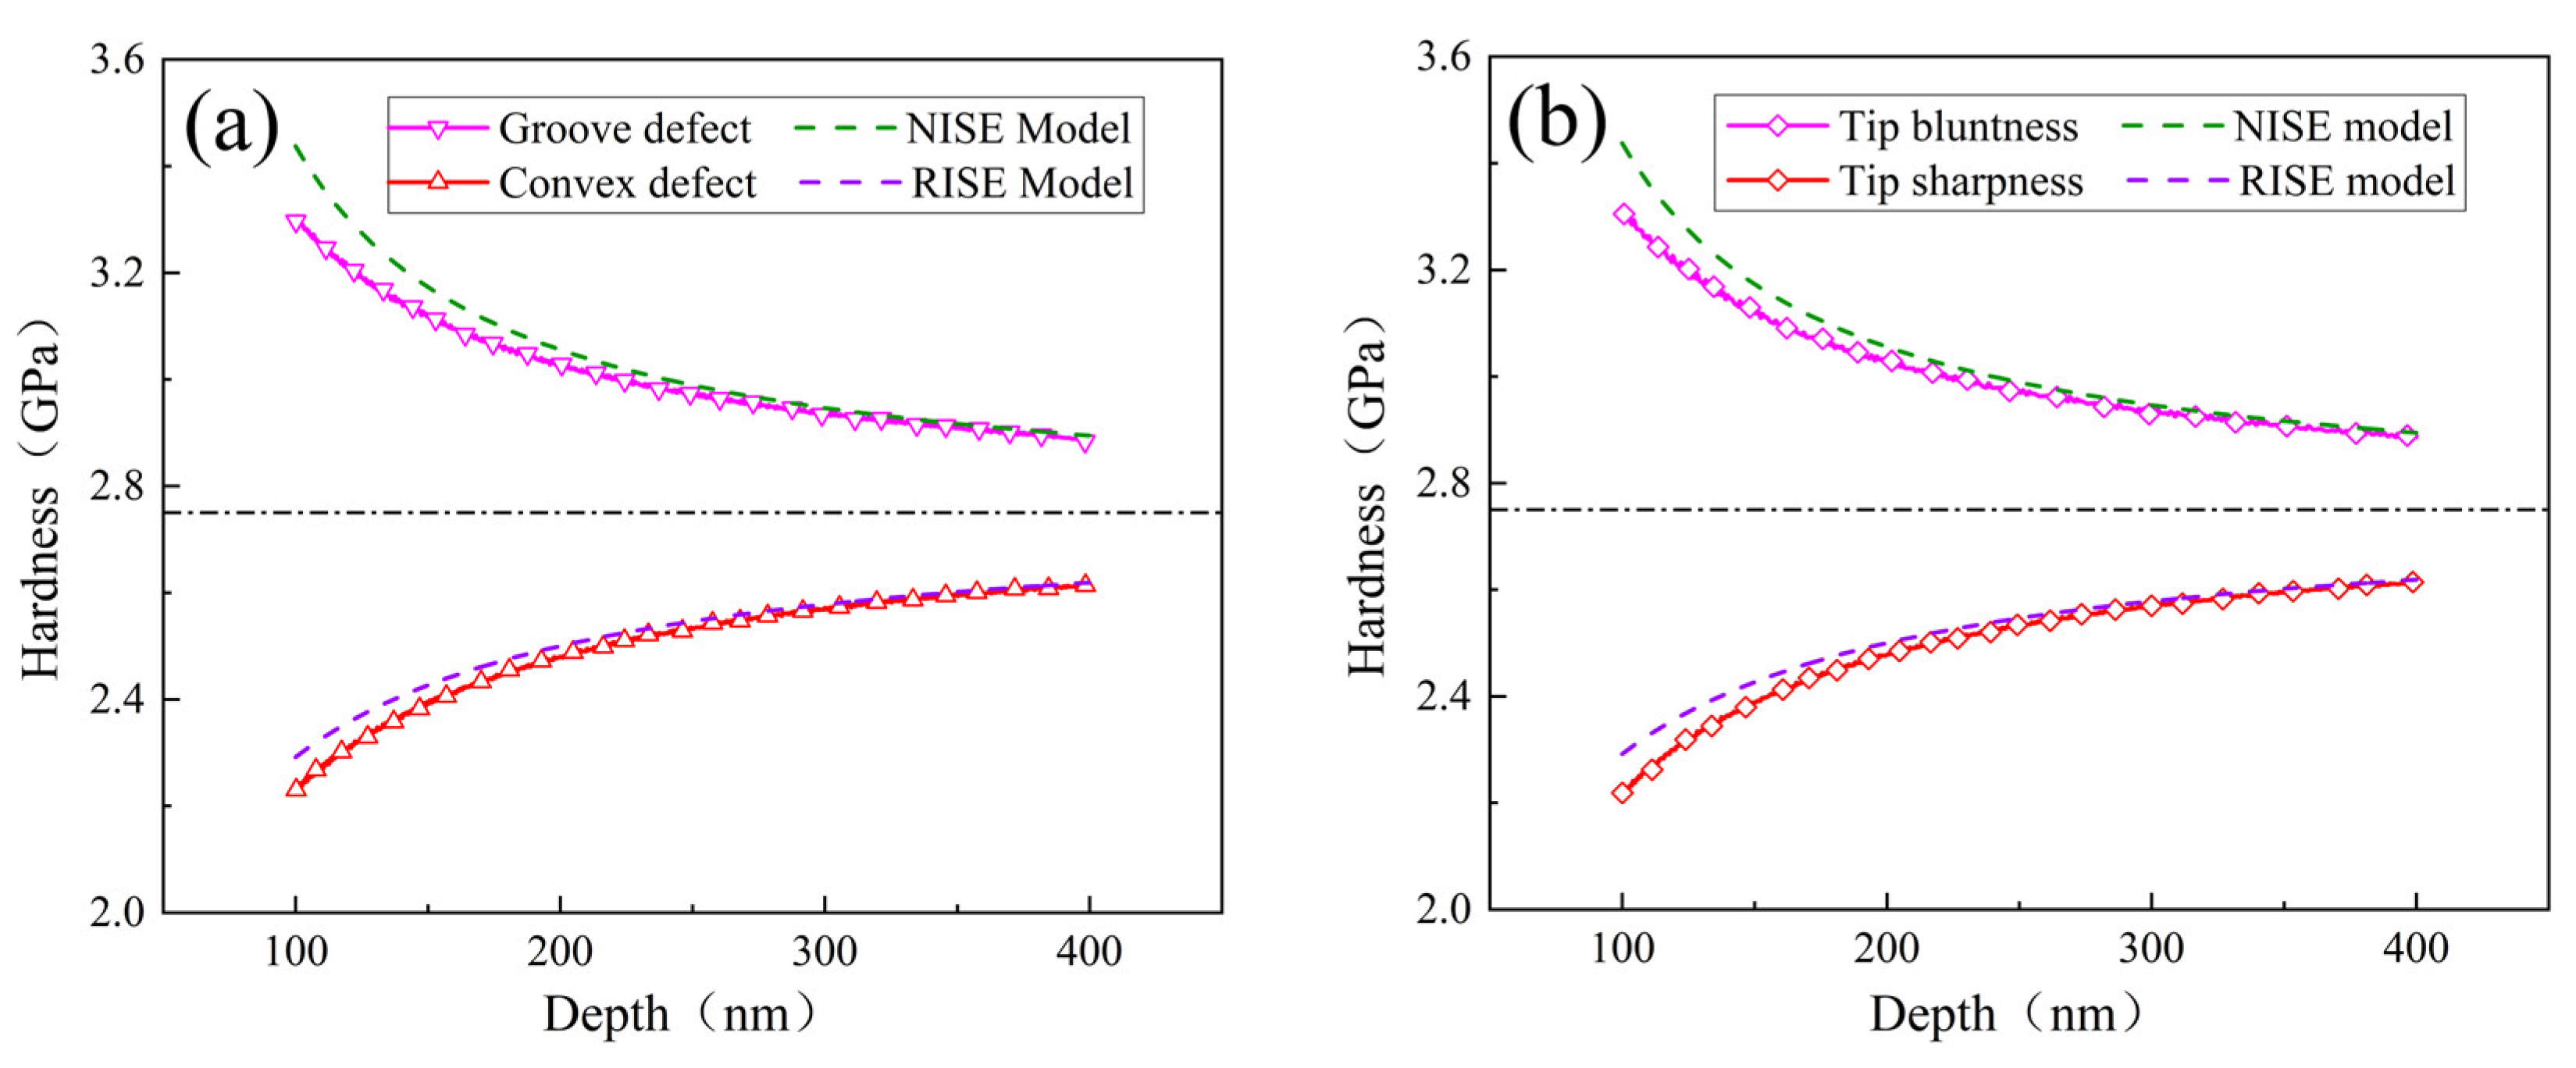
Figure 11.
Schematic of the comparison between surface defects and tip irregularity.
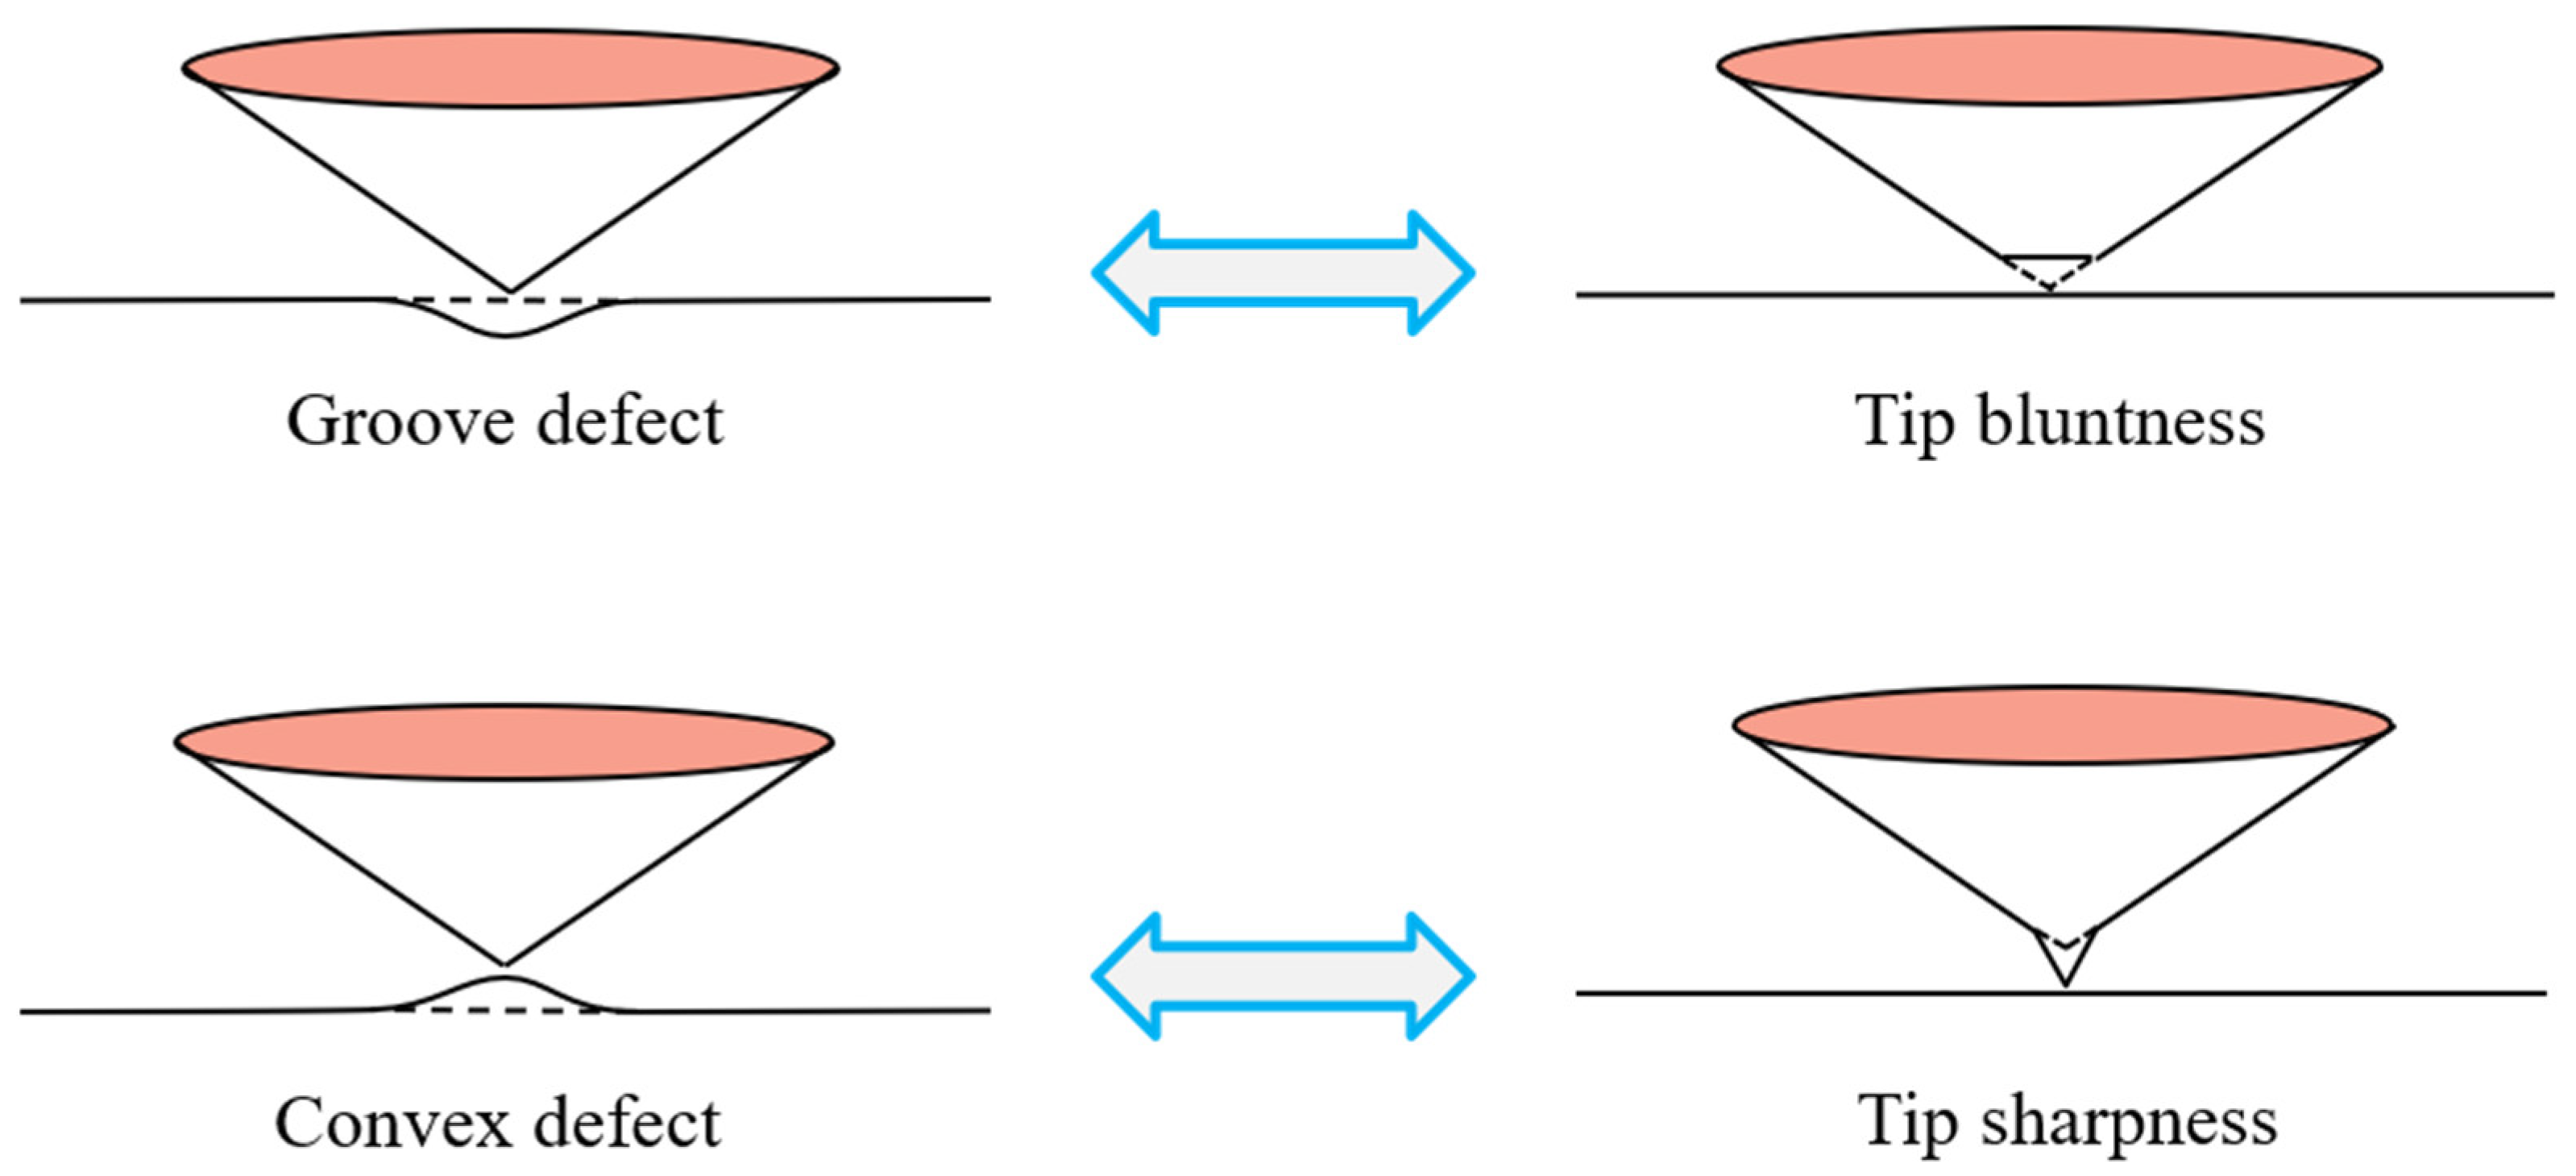
Figure 12.
Stress distribution of simulation process: (a) groove defect; (b) tip bluntness; (c) convex defect; (d) tip sharpness.
Figure 12.
Stress distribution of simulation process: (a) groove defect; (b) tip bluntness; (c) convex defect; (d) tip sharpness.

Figure 13.
Comparison of hardness–depth dependence: (a) groove defect and tip bluntness; (b) convex defect and tip sharpness.
Figure 13.
Comparison of hardness–depth dependence: (a) groove defect and tip bluntness; (b) convex defect and tip sharpness.
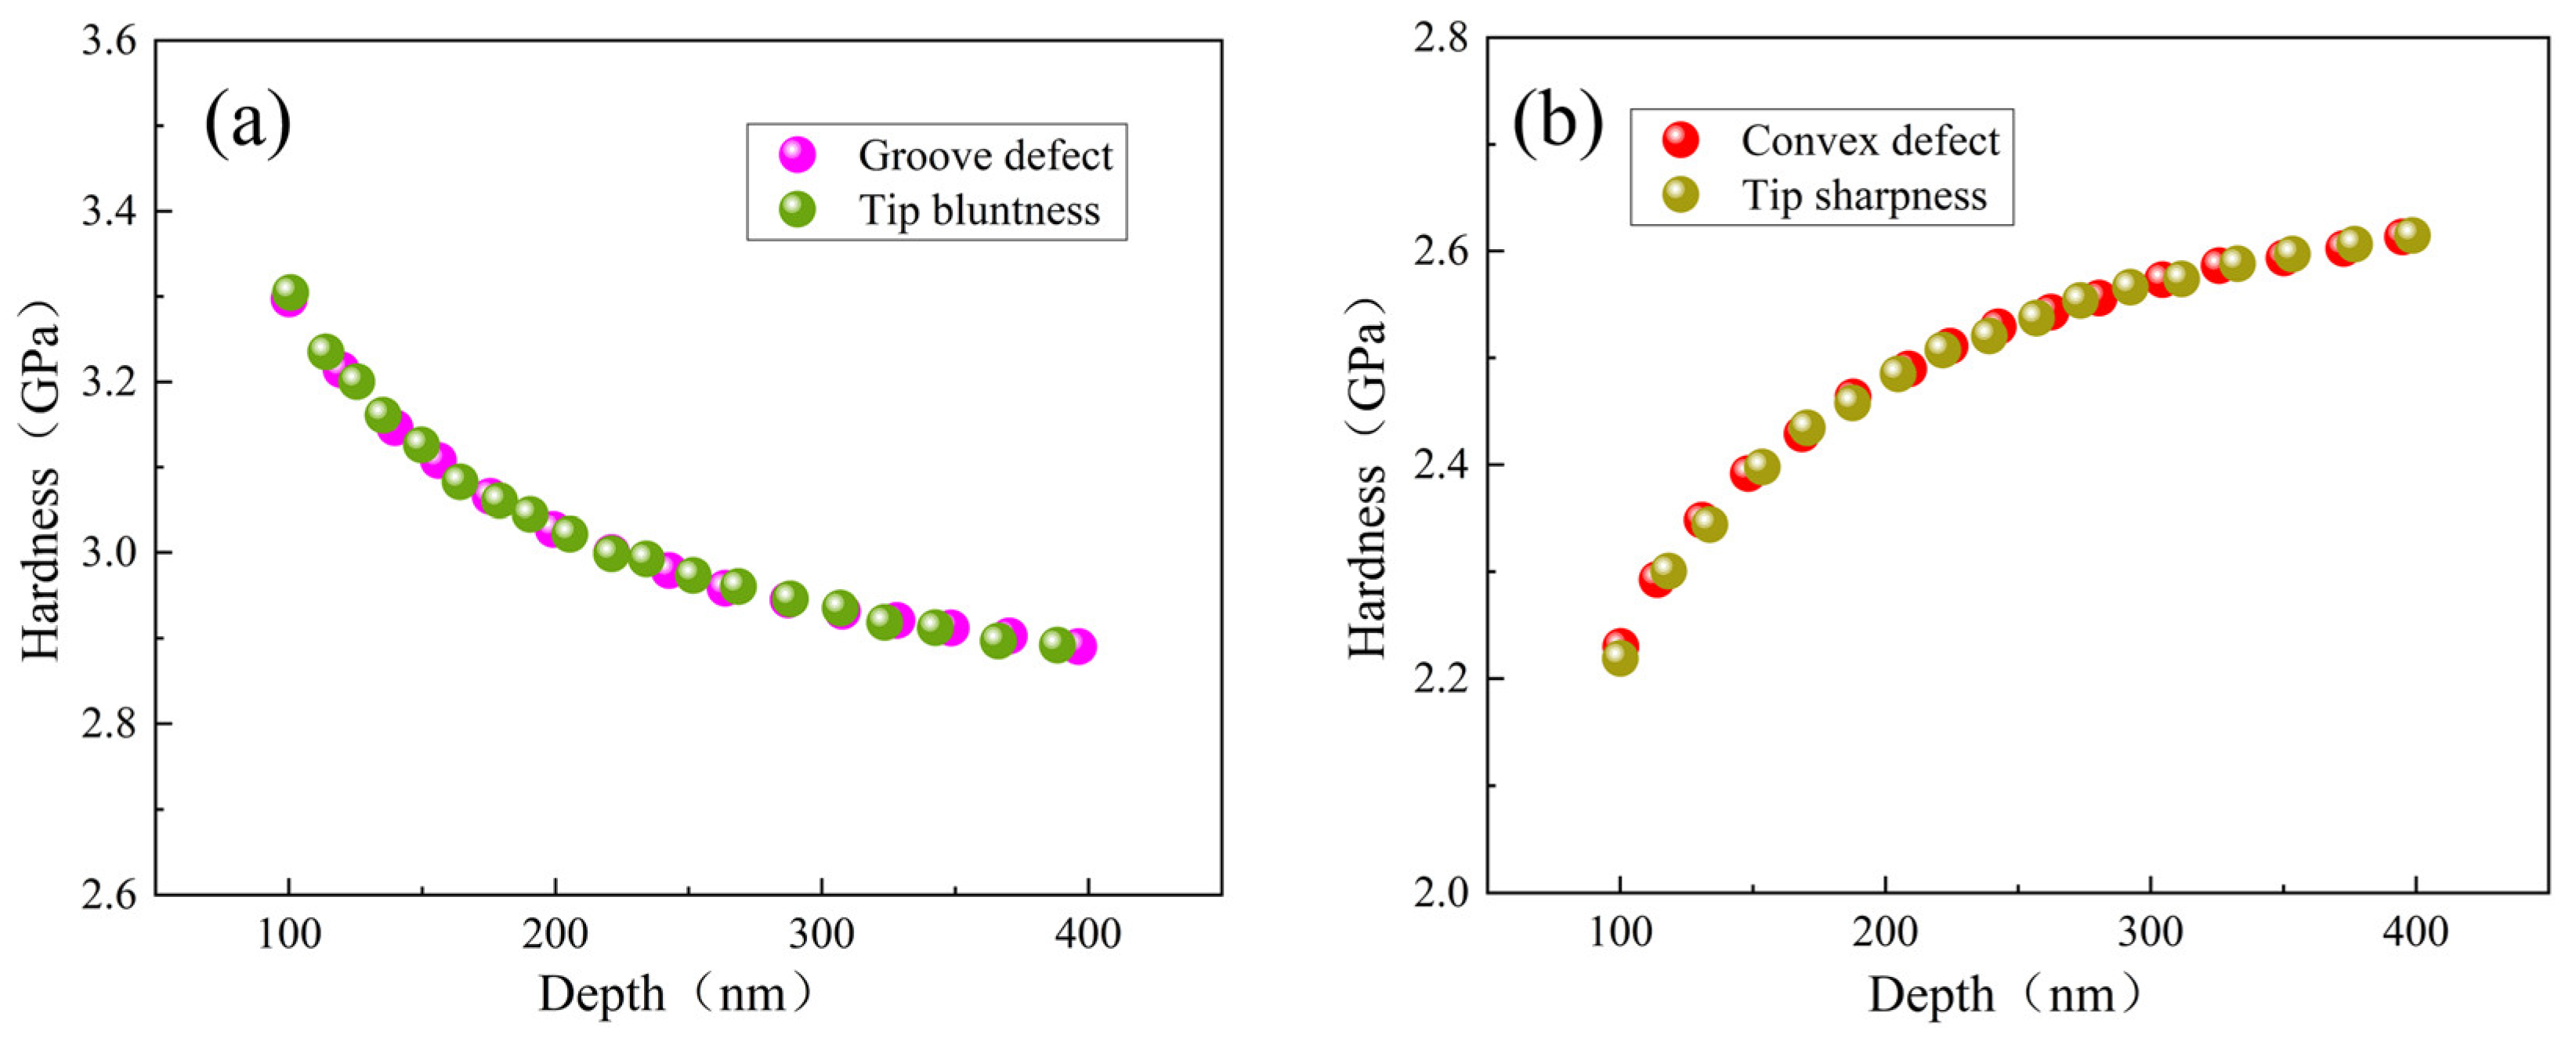
Figure 14.
Schematic of the comparison between tip impurity and tip sharpness.
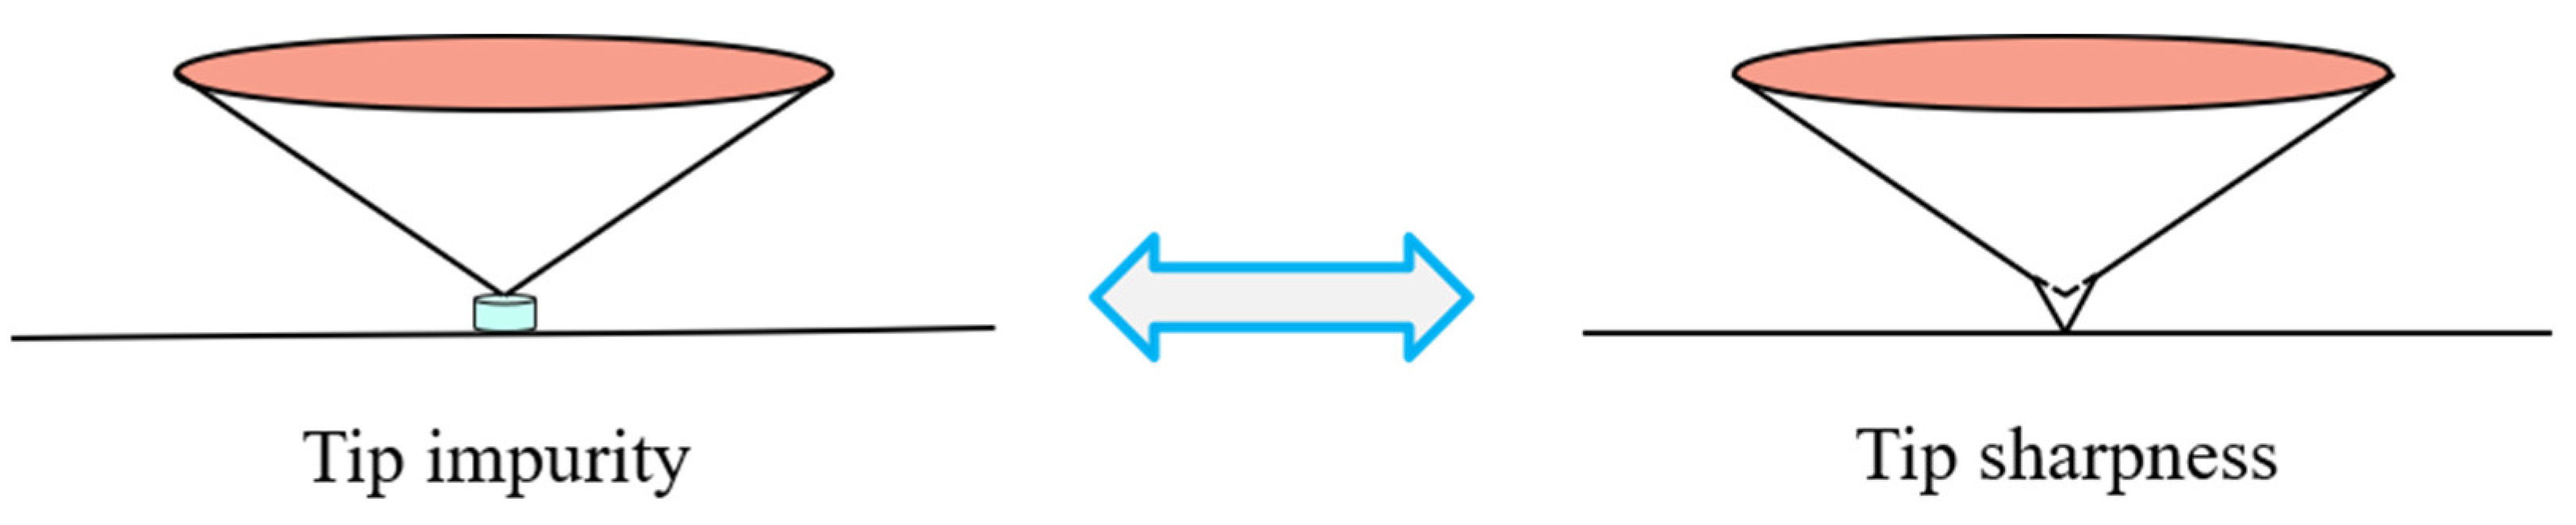
Figure 15.
Stress distribution of simulation process: (a) tip impurity; (b) tip sharpness.
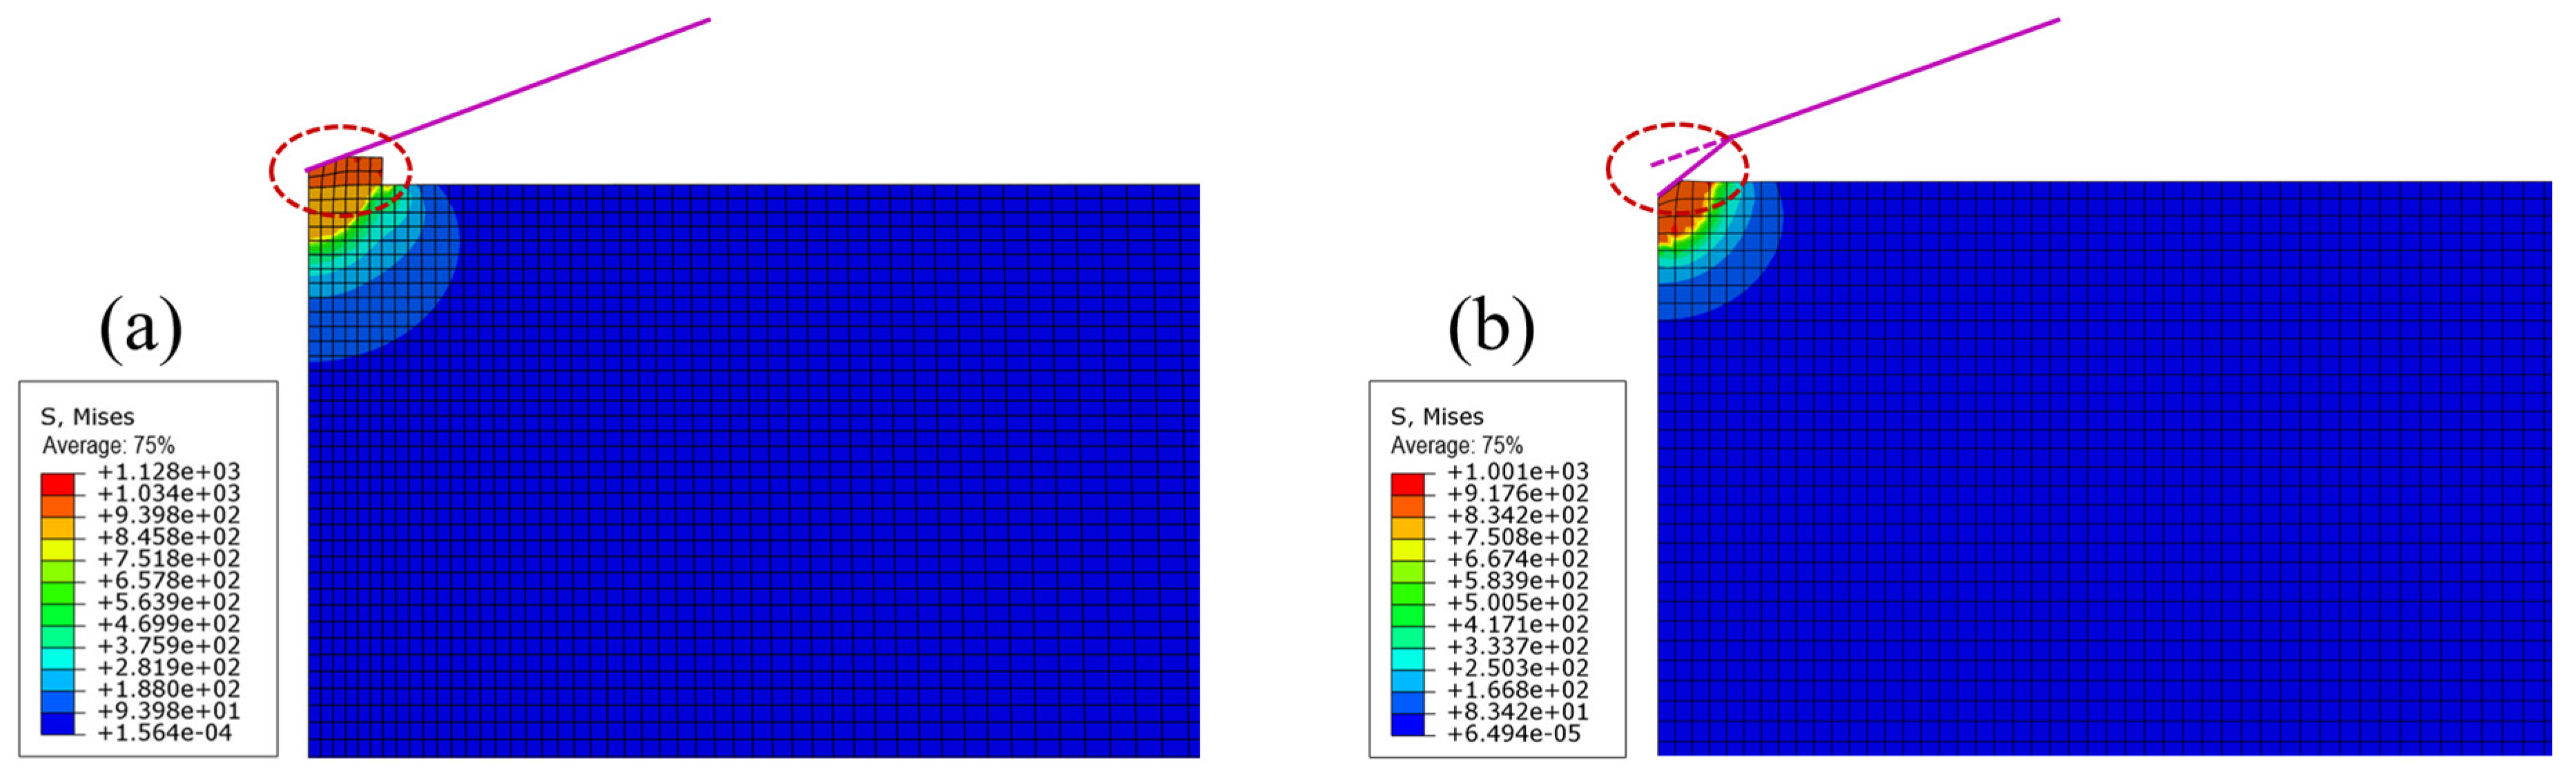
Figure 16.
Comparison of hardness–depth dependence of tip impurity and tip sharpness.
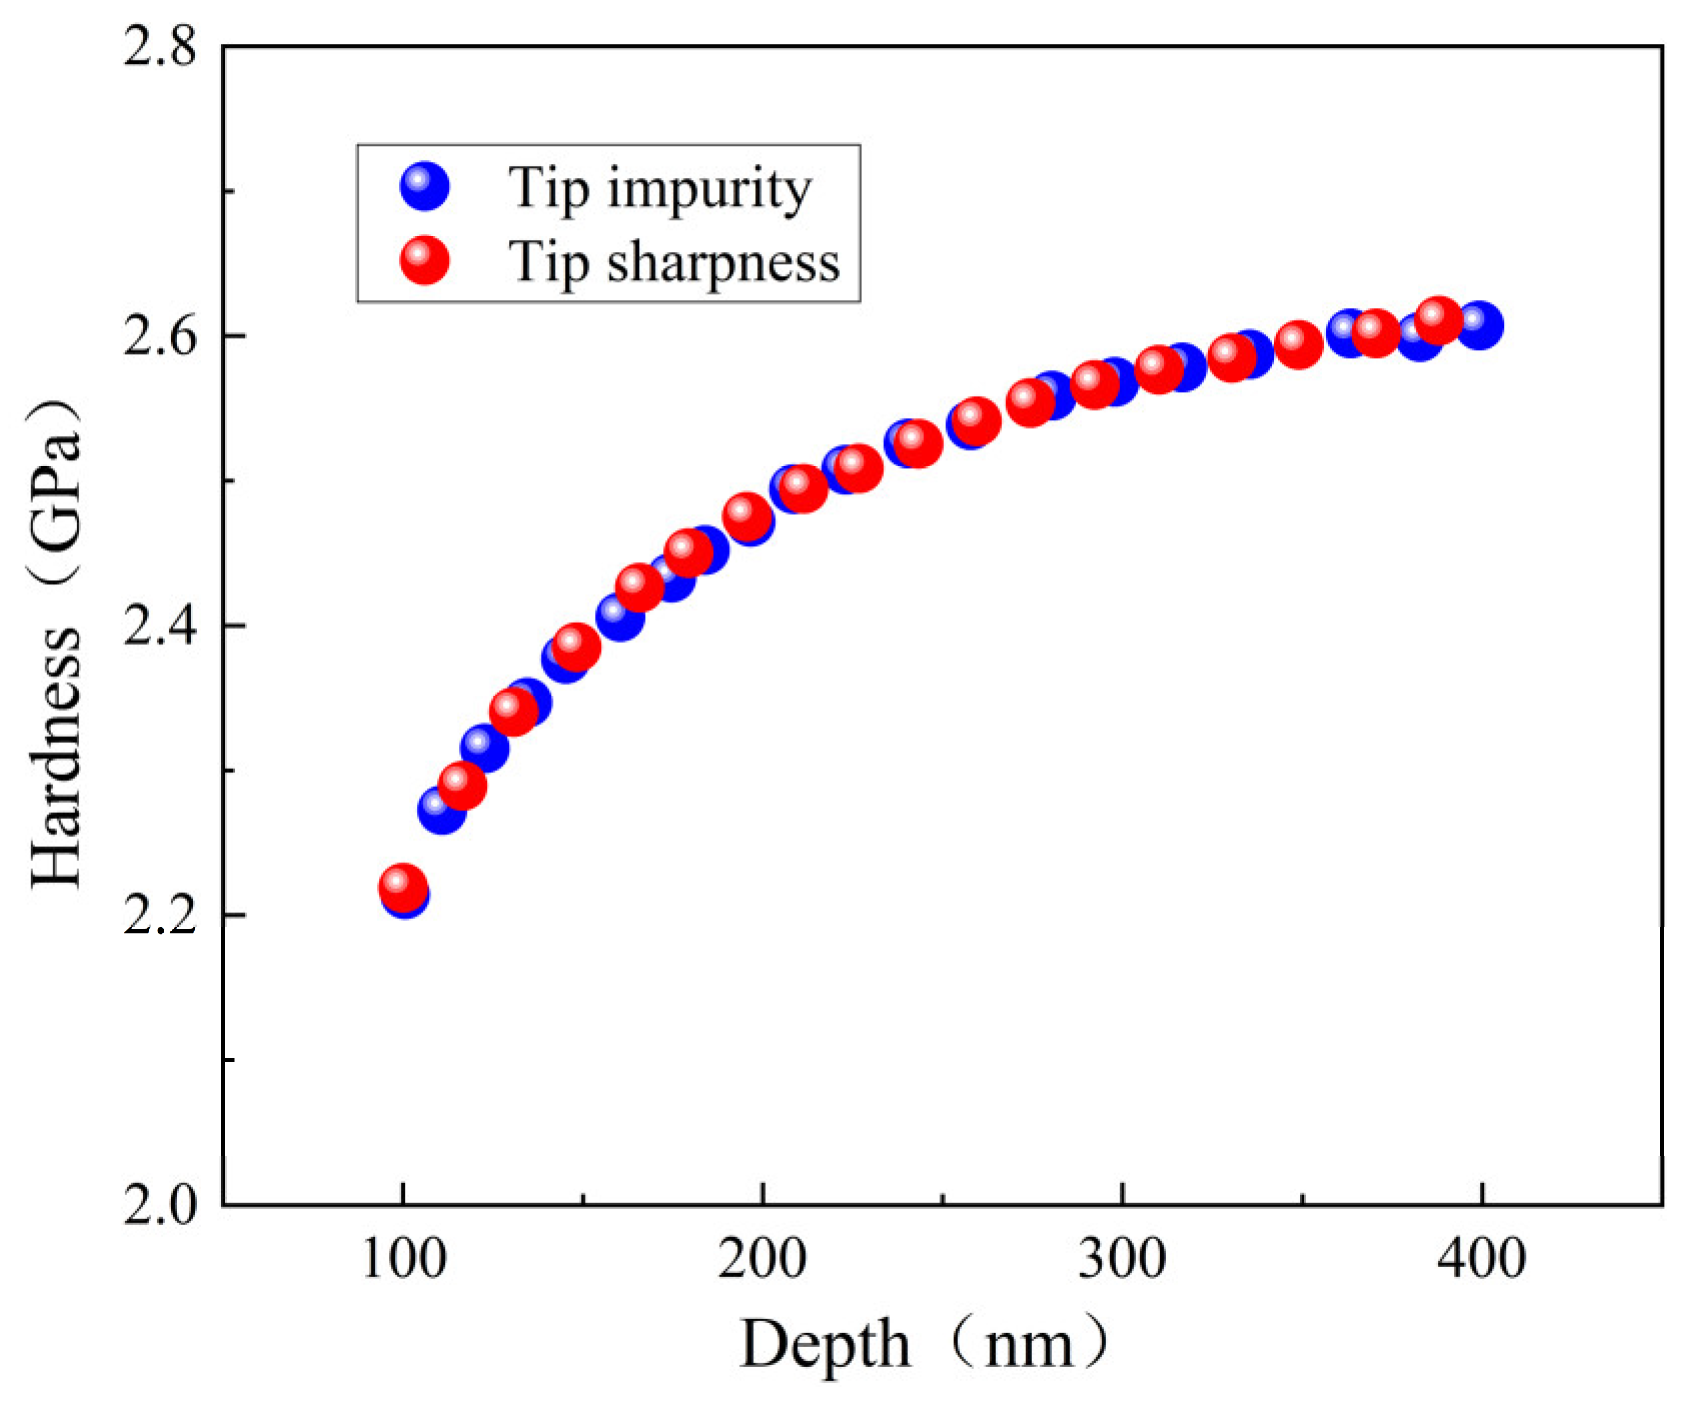
Figure 17.
Comparison of analytical model and experiment. Here, the ISE phenomenon resulting from strain gradient can be also explained by our model based on external factors when δ = 0.06 μm. Data from Refs. [3,19].

Figure 18.
Numerical correction of measured hardness. FE—finite element simulation, Cor—correction. The inaccurate hardness is corrected to true hardness through compensating defect height: (a) surface defect; (b) indenter tip irregularity.
Figure 18.
Numerical correction of measured hardness. FE—finite element simulation, Cor—correction. The inaccurate hardness is corrected to true hardness through compensating defect height: (a) surface defect; (b) indenter tip irregularity.

Table 1.
Constitutive parameters of simulated material.
| Material | Young’s Modulus | Poisson’s Ratio | Yield Strength |
|---|---|---|---|
| TA2 | 108 GPa | 0.34 | 0.88 GPa |
Publisher’s Note: MDPI stays neutral with regard to jurisdictional claims in published maps and institutional affiliations. |
© 2022 by the authors. Licensee MDPI, Basel, Switzerland. This article is an open access article distributed under the terms and conditions of the Creative Commons Attribution (CC BY) license (https://creativecommons.org/licenses/by/4.0/).
Share and Cite
MDPI and ACS Style
Li, X.; Zhang, W.; Dong, Z.; Wang, Z.; Li, D.; Zhang, J. Study on Size Effect in Indentation Tests. Coatings 2022, 12, 1962. https://doi.org/10.3390/coatings12121962
AMA Style
Li X, Zhang W, Dong Z, Wang Z, Li D, Zhang J. Study on Size Effect in Indentation Tests. Coatings. 2022; 12(12):1962. https://doi.org/10.3390/coatings12121962
Chicago/Turabian StyleLi, Xiaozhen, Weixu Zhang, Zhelin Dong, Zhiguo Wang, Dingjun Li, and Jianpu Zhang. 2022. "Study on Size Effect in Indentation Tests" Coatings 12, no. 12: 1962. https://doi.org/10.3390/coatings12121962
Note that from the first issue of 2016, this journal uses article numbers instead of page numbers. See further details here.