Article

Using Long-Term Historical Meteorological Data for Climate Change Analysis in the Carpathian Region

1
Department of Geography in Hungarian, Faculty of Geography, Babeş-Bolyai University, 40006 Cluj-Napoca, Romania
2
National Meteorological Administration, 013686 Bucharest, Romania
3
Department of Meteorology, Institute of Geography and Earth Sciences, Eötvös Loránd University, H-1117 Budapest, Hungary
*
Author to whom correspondence should be addressed.
Atmosphere 2022, 13(11), 1751; https://doi.org/10.3390/atmos13111751
Submission received: 27 July 2022 / Revised: 21 October 2022 / Accepted: 21 October 2022 / Published: 24 October 2022
(This article belongs to the Special Issue Climate Extremes in the Pannonian Basin (2nd Edition))

Abstract

:
In this study, we consider the historical climatological time series available in the meteorological yearbooks of the Royal Hungarian Central Institute of Meteorology and Earth Magnetism, first published in 1871. Data quality improvement of historical data includes the homogenization process with outlier checks and data gap filling by applying the MASH software. We investigated 13 stations from the Carpathian Region having the most complete monthly temperature and precipitation time series for the period of 1871–1918 and 8 stations with fog observations (1886–1916). First, statistical tests were conducted to compare the main statistics of the historical datasets (1871–1918) with current data (1971–2020). The sources of the current data are the National Meteorological Administration of Romania and the European Climate Assessment & Dataset. The results show significant changes between the two periods. In the whole region, the mean temperature in the last five decades (1971–2020) was 0.77 °C higher than in 1871–1918. Changes in the frequency of foggy situations were also detected. On an annual scale, in the last 31-year period (1990–2020), the number of foggy days increased by 16.2 compared with 1886–1916. Even if some local trends can be detected in the historical periods (e.g., Cluj-Napoca), significant changes are much more characteristic in the recent period.

1. Introduction

High-quality observational time series have a double role in climate research, supporting the analysis of the past climate and the validation and correction of climate information obtained from the climate models, or other proxy data (tree rings, pollens, etc.) [1,2,3]. Analyzing climate variability based on instrumental data is strongly dependent on the length and the spatial density of the available time series, the number of usable climate elements, and data quality. Most of the existing historical datasets have certain shortcomings regarding one or more of these basic requirements. Among the global datasets, the Integrated Surface Database (ISD) has the best spatial coverage in Europe [4]. The database includes over 35,000 stations worldwide, with some of them in function since 1901. The most popular dataset in Europe is the European Climate Assessment & Dataset [5], which covers daily observational datasets for the period from 1900 to the present; however, very few ECA&D stations include useful data before 1961 [6]. Datasets such as NCEP/NCAR [7] and ERA5 [8] are collections of synoptic data combined with model outputs. They are three-dimensional in space, offer a high level of “real-time quality”, provide a high spatial and temporal resolution, and contain the full range of meteorological elements, they cover the most recent 60 years, but their quality in terms of long-term homogeneity is questionable. Other regional gridded databases are the CARPATCLIM [9], containing data for the Carpathian Region for the period of 1961–2010, and ROCADA [10] for Romania, covering the interval 1961–2013.
We can conclude that the above-mentioned datasets are useful to obtain climate information from observations or reanalysis, but they are available only after the 1950s, whereas fewer measurements, but with comparable quality (e.g., measurements using similar instruments), exist for earlier periods as well. Very few databases, such as HISTALP for the Alpine Region [11], contain 18–19th century measurements, despite the high accuracy, quality, and thorough documentation of these measurements [12]. A similar supranational activity was the NACD project [13], which focused on Northern Europe.
In 1848, the Austrian Academy of Sciences officially approved the first meteorological observation network for the entire territory of the Habsburg Monarchy. The Central Institute for Meteorology and Geodynamics (Zentralanstalt für Meteorologie und Geodynamik, ZAMG) was founded in Vienna in 1851 [14]. After the Austro-Hungarian Monarchy was established in 1867, The Royal Hungarian Central Institute of Meteorology and Earth Magnetism (RHCIMEM) was founded in 1870. Starting in 1871, the institute published its yearbooks [15], which included the meteorological, geomagnetic, and plant phenology measurements carried out in the territory of the historical Kingdom of Hungary, which included most of the Carpathian Region. Despite the significant utility of this climate information, only very few studies processed these data [16,17,18].
To construct long-term data series beyond the present databases, usually available in a digital format, the issue of merging or comparing historic instrumental measurements with newer ones has to be addressed. This operation requires special prudency because of the differences in instrumentation, measuring methods, observation time, and calculations. Historical instrumental measurements inevitably contain inhomogeneities and outliers due to changes in locations, instruments, or methodology. For this reason, special attention should be paid to data quality control (QC) as well. Taking this into consideration, Izsák et al. [16] computed the longest ever homogenized, gridded daily dataset for Hungary, covering the period of 1870–2020. The authors used the MASH (Multiple Analysis of Series for Homogenization) [19,20] homogenization method to correct errors and fill data gaps, followed by the MISH (Meteorological Interpolation based on Surface Homogenized Data Basis; [21]) method to interpolate data to a regular grid.
Despite several shortcomings, records from paper-based meteorological yearbooks are unique sources of past information about atmospheric parameters, and they could become references for climate variability and climate change assessments. They can also be of great help in other environmental and social science research. To highlight the importance of long-term meteorological observations, the WMO has a mechanism to recognize centennial observing stations [22]. It promotes sustainable observational standards and best practices facilitating the generation of high-quality time series. In 2017, the WMO recognized a first set of the WMO centennial observing stations, and further calls are planned to be released every two years. In the Carpathian Region, eight stations are recognized (HU: Budapest, Debrecen, Pécs, Szeged, and Szombathely; HR: Zagreb; RO: Drobeta-Turnu Severin; and SK: Hurbanovo).
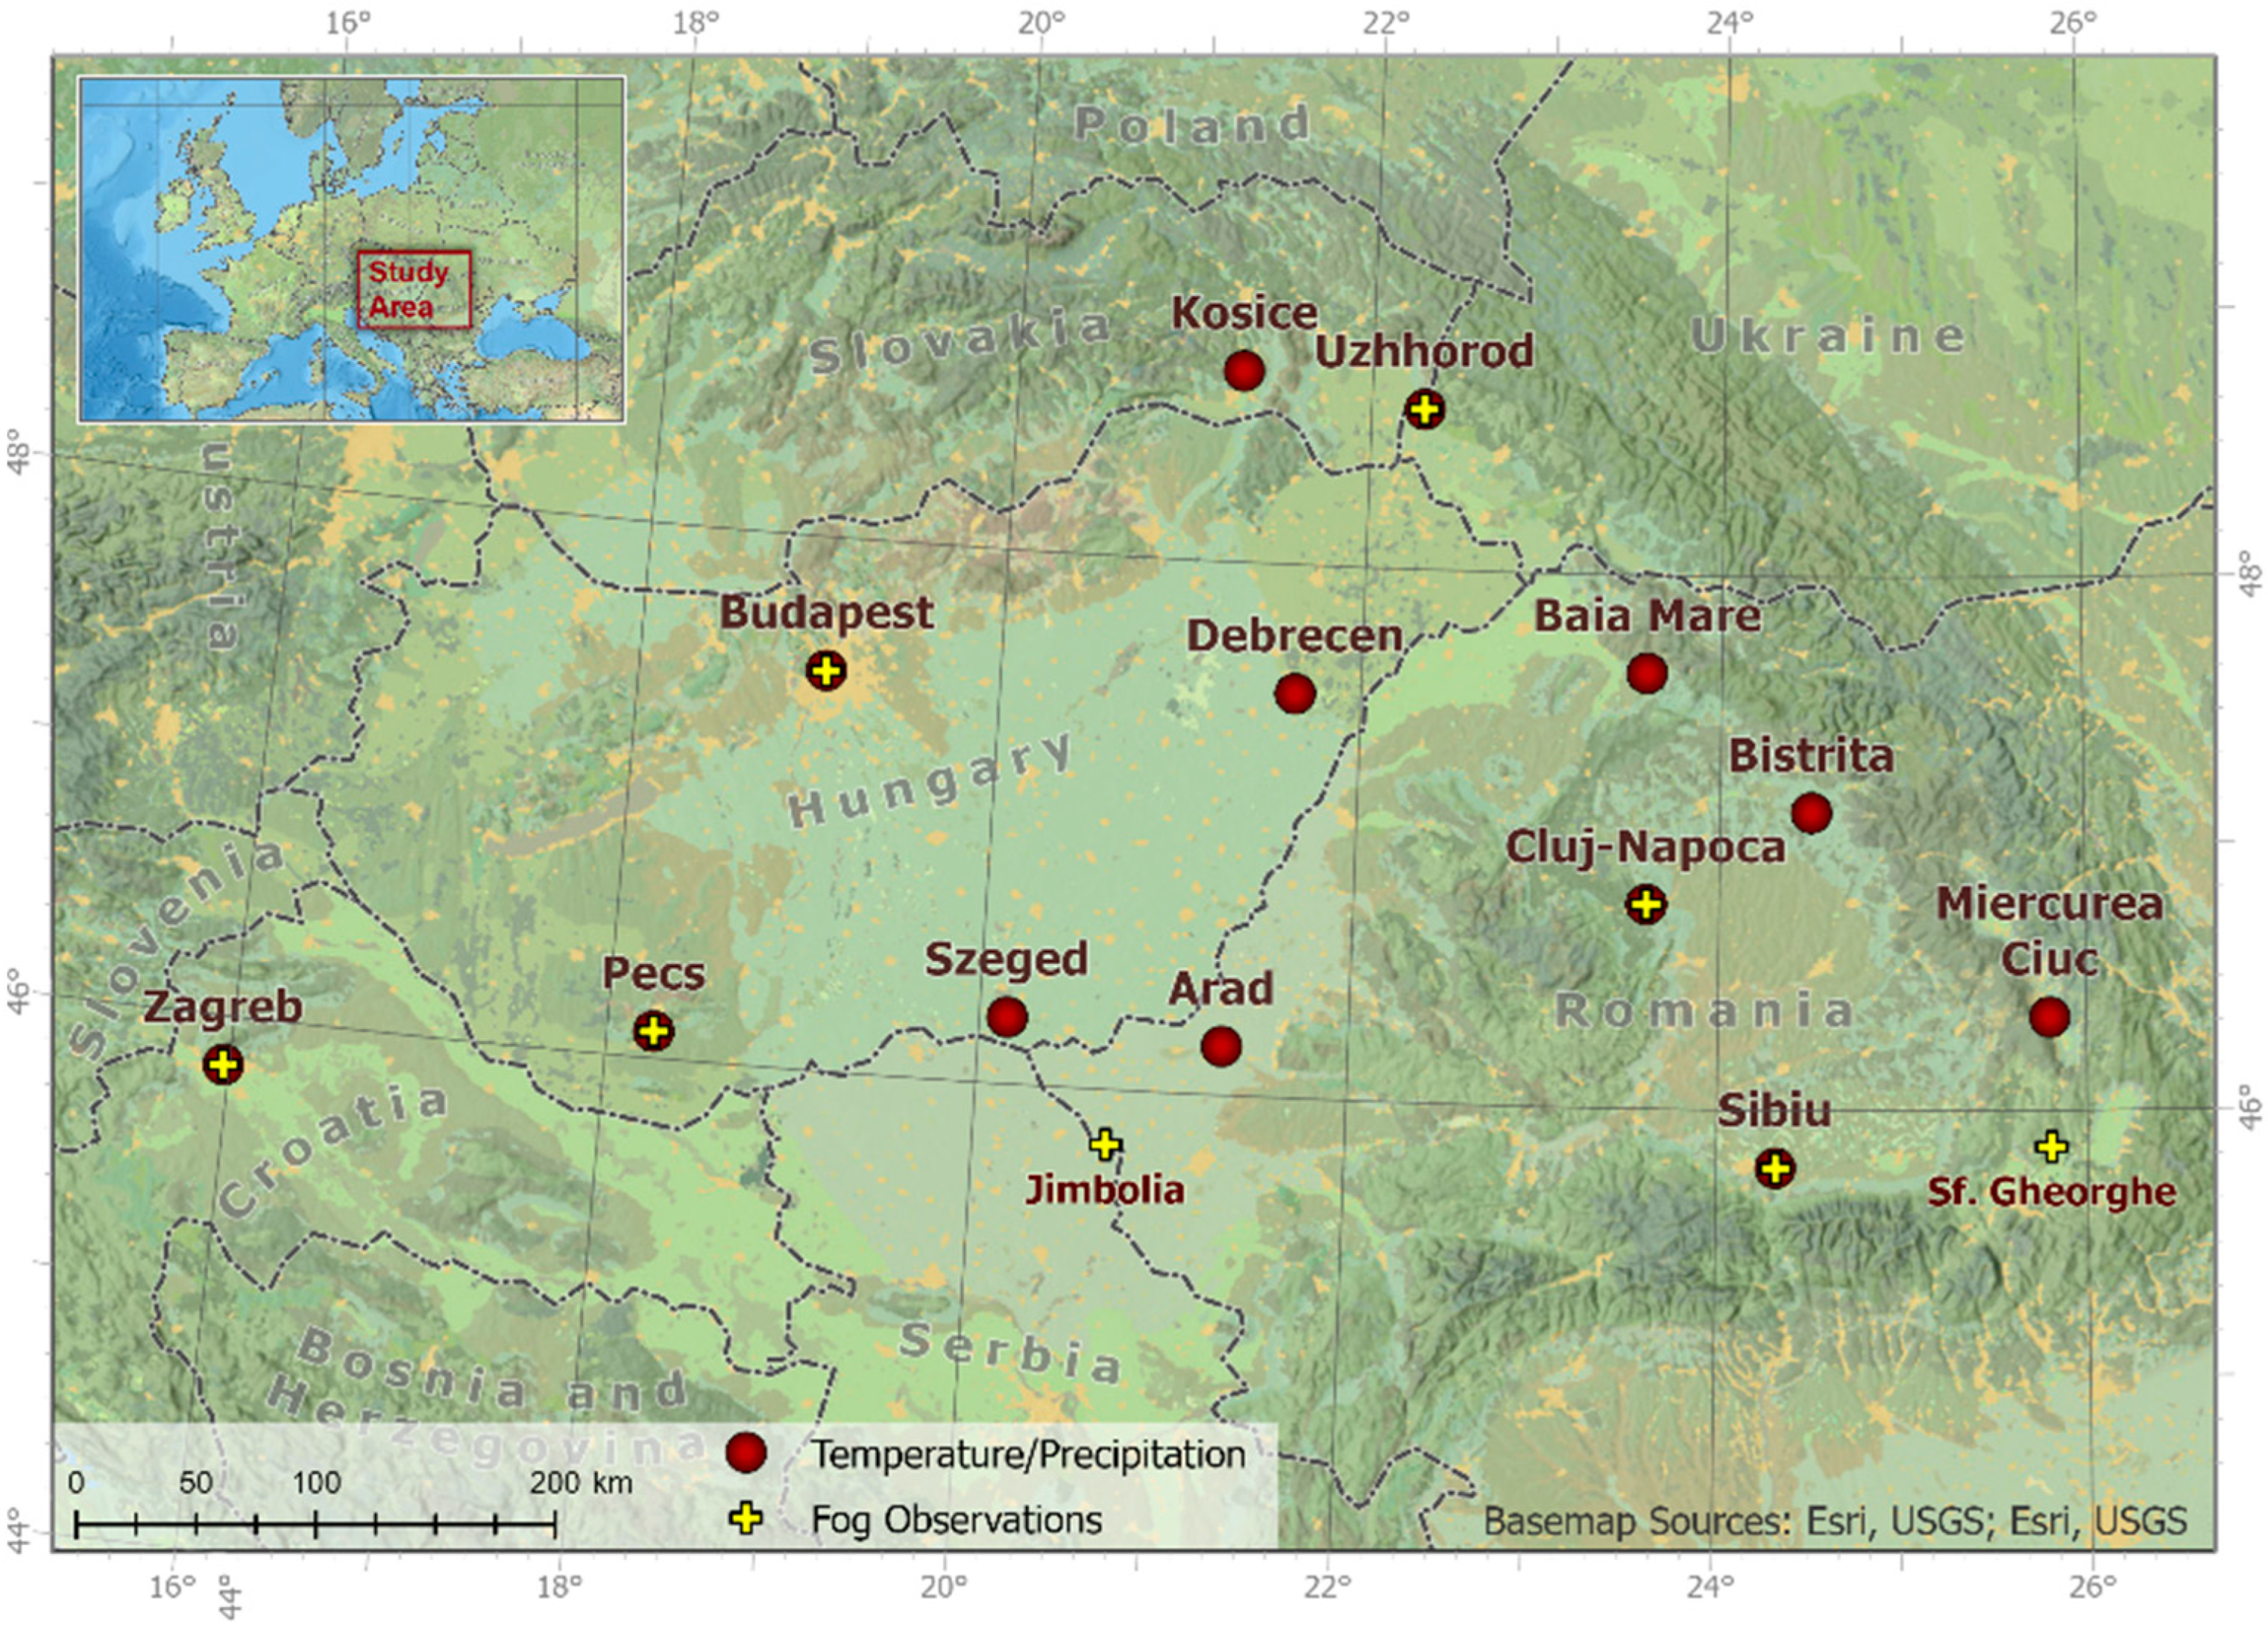
This study aims to capture the main features of climate variability and analyze climate changes in the Carpathian Region using a long-term meteorological dataset. To explore the characteristics of the climatic conditions, we investigated 13 stations from the Carpathian Region having the most complete monthly mean, minimum, and maximum temperature and precipitation time series for the period of 1871–1918. The selected stations are (with historical Hungarian and German station names as provided in the yearbooks): Arad (RO), Bistrița (Beszterce, Bistritz) (RO), Miercurea Ciuc (Csíkszereda, Szeklerburg) (RO), Cluj-Napoca (Kolozsvár, Klausenburg) (RO), Baia Mare (Nagybánya, Frauenbach) (RO), Sibiu (Nagyszeben, Hemannstadt) (RO), Budapest (Ofen-Pesth) (HU), Debrecen (Debrețin, Debrezin) (HU), Pécs (Fünfkirchen) (HU), Szeged (Seghedin, Segedin) (HU), Uzhhorod (Ungvár, Ungwar) (UA), Košice (Kassa, Kaschau) (SK), and Zagreb (Zágráb, Agram) (HR) (Figure 1). First, statistical tests were conducted to compare the main statistical parameters (mean, distributions) of the historical datasets (1871–1918) with the current data (1971–2020). Furthermore, trend analysis was performed to detect possible changes in climate over the past 150 years. In addition, daily fog observations for eight stations were analyzed (
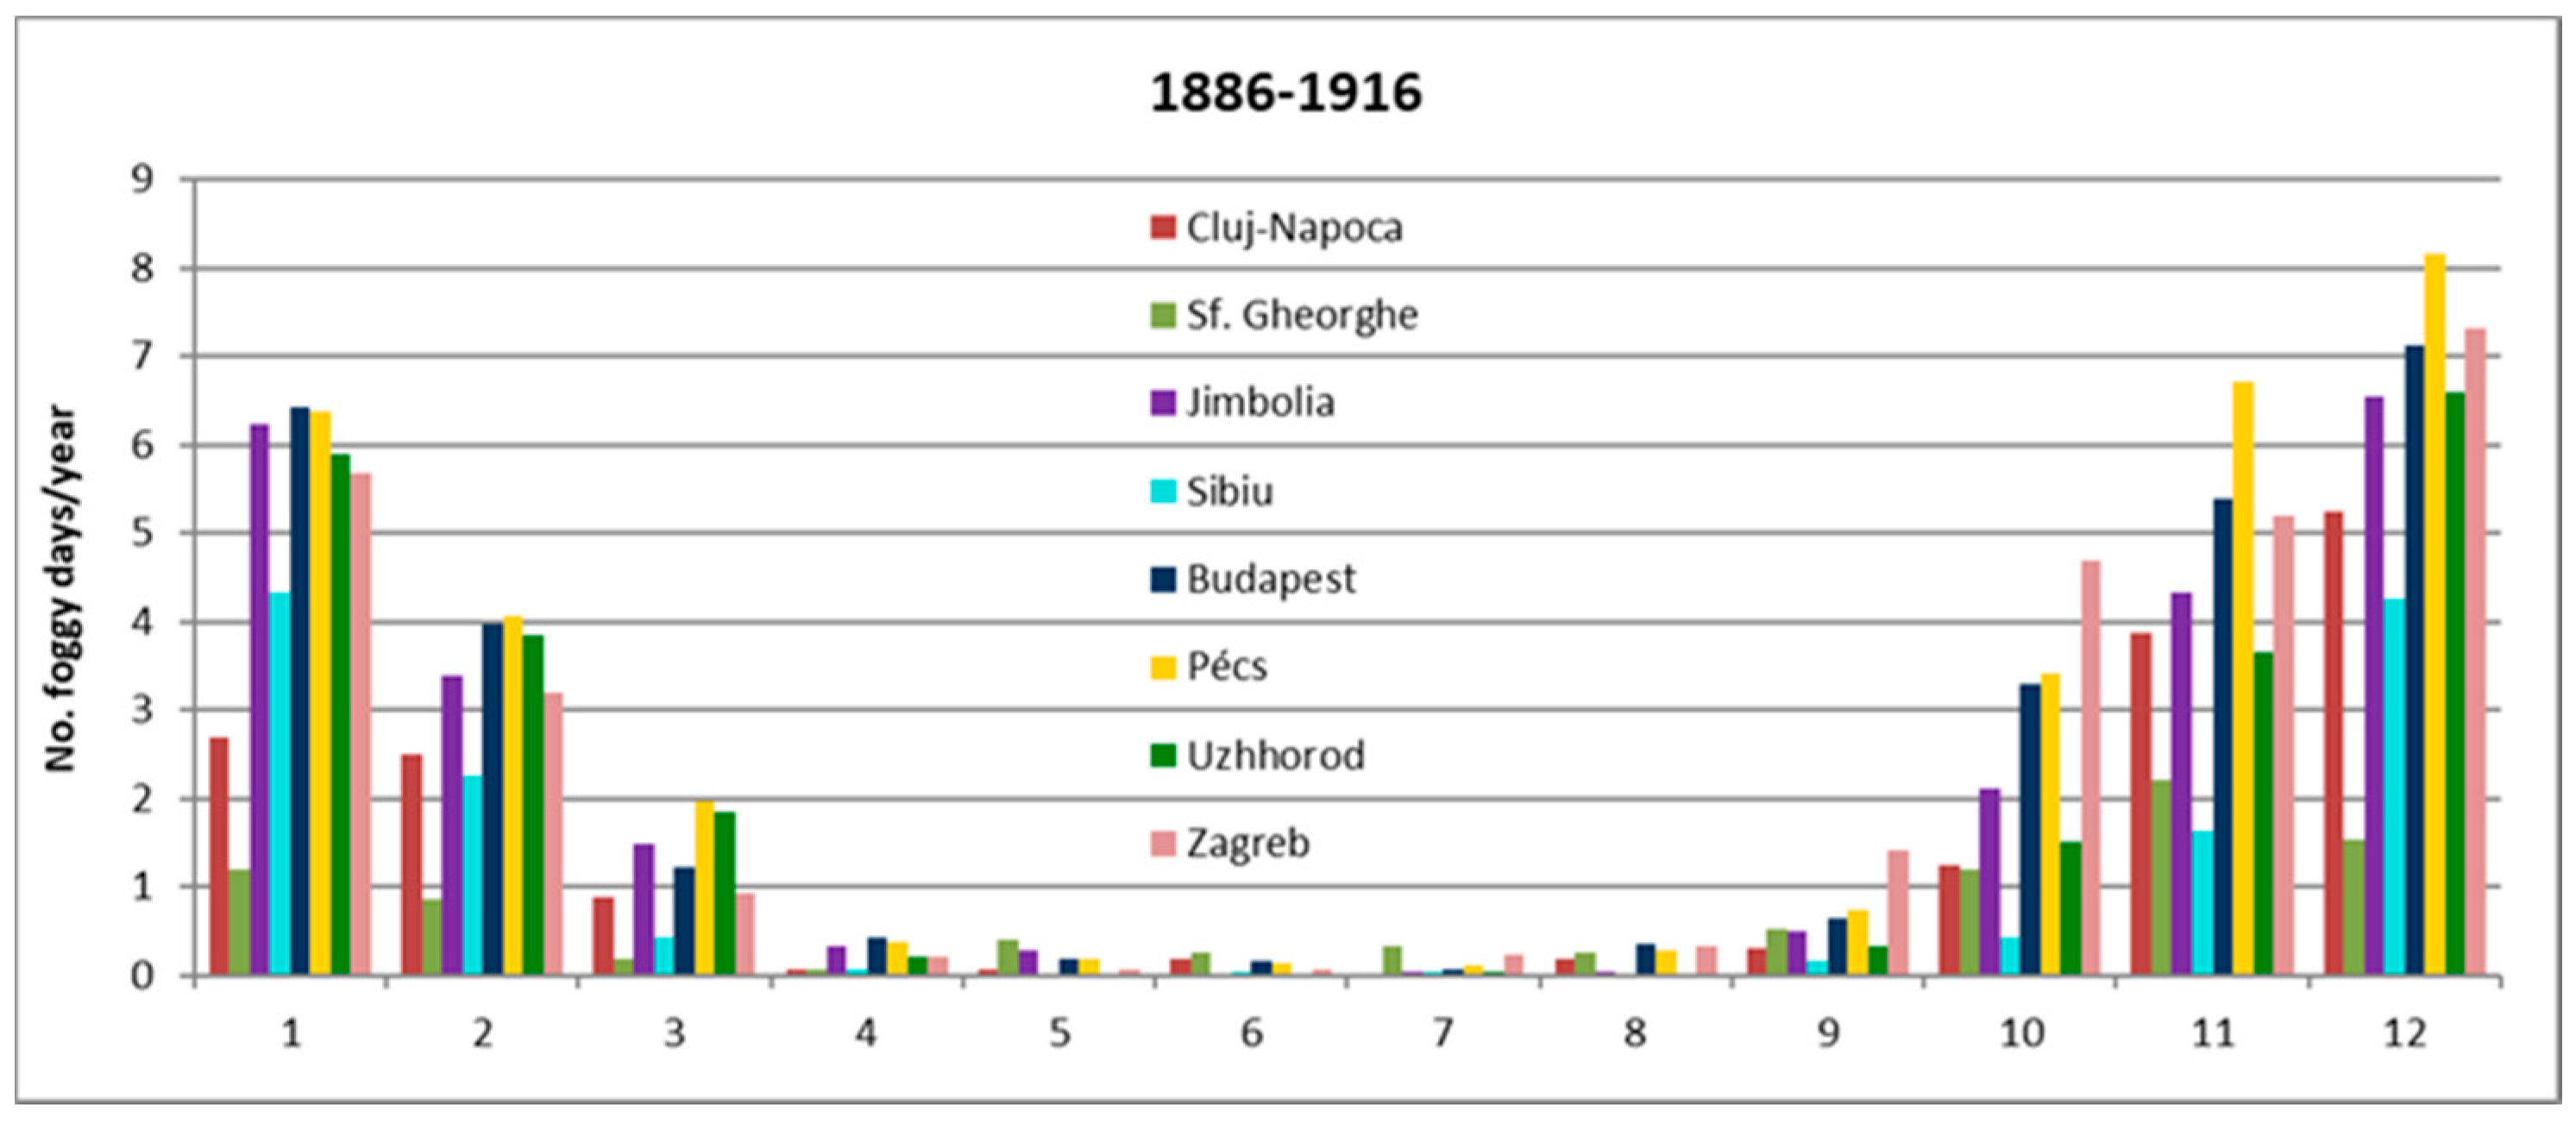
Figure 1). It should be mentioned that the fog data were available for different time periods in the cases of these stations, as follows: Budapest (HU) 1886–1919, Pécs (HU) 1890–1916, Cluj-Napoca (RO) 1901–1916, Jimbolia (Zsombolya, Hatzfeld) (RO) 1889–1906, Sfântu Gheorghe (Sepsiszentgyörgy, Sankt Georgen) (RO) 1901–1915, Sibiu (RO) 1886–1916, Uzhhorod (UA) 1890–1916, and Zagreb (HR) 1886–1914.
In Section 2 of the paper, the source of the historical data as well as the homogenization process used are presented. Section 3 contains the results regarding long-term changes in temperature, precipitation, and fog events for the stations considered in the Carpathian Region. In Section 4, we conclude our results and provide a discussion of our research state and an outlook.

2. Materials and Methods

2.1. Historical Records

In order to carry out our research, we utilized the historical instrumental climatological surface time series available in the yearbooks of RHCIMEM for the Carpathian Region [15] for the period of 1871–1918. As the institute continuously developed the observational network—the number of stations increased from 47 stations in 1871 to 204 stations in 1911 (+1222 rain gauge)—the contents of the yearbooks therefore also extended year by year. This development decelerated because of World War I, and measurements stopped in 1919. Data after 1919 are stored in yearbooks belonging to different institutes in the Carpathian Basin countries.
In the first stage, the structure and content of the meteorological yearbooks were analyzed (Figure S1 of Supplementary Material). Each meteorological yearbook for the period of 1871–1918 begins with a preface including very valuable metadata summarizing changes in the observation network and structure of the yearbook, instruments and calculations, and editors and other staff contributing to the yearbook. This is followed by the list of stations (name, country, county, geographical coordinates, altitude, observing hours, and name and the profession of the observer) and special notes for the stations. Monthly averages of meteorological observations are presented in the first chapter of the yearbooks (mean, maximum, and minimum air temperature (°C), atmospheric pressure (mmHg), water vapor pressure (mmHg), relative humidity (%), precipitation amount (mm), cloudiness, and windspeed (Beaufort no.) and wind direction (cardinal and intercardinal directions), supplemented with several specific observations such as soil temperature (°C), fog observations, and lightning detections. Starting from 1886, daily observations (one or three times of the days) of atmospheric pressure, air temperature, relative humidity, cloudiness, fog, wind direction and speed, and amount and type of precipitation are also presented for a number of selected stations (in total 24 stations, but different time periods from 1886 to 1918). Next, observations of geomagnetism (magnetic declination) are included, and the last chapter contains agrometeorological observations including the phenology (canopy development, blooming, and ripening) of different plants and crops.
The metadata section of the yearbooks presents a detailed description of instruments and calculations of meteorological parameters. For measurements, all the stations used 0.2 °C-scaled thermometers in shaded conditions. The instrument used for precipitation was also similar to the ones used for recent measurements (rain gauge), giving the precipitation amount in mm. The temperature was measured three times per day, usually at 7 a.m., 2 p.m., and 9 p.m. local time at that time (in few cases, the observation hours were changed e.g., 8 a.m. instead of 7 a.m.). The monthly average temperature is calculated as the arithmetic mean of these data. The monthly minimum and maximum temperature present the absolute minimum and absolute maximum values among these observations; no additional minimum and maximum temperature observations were performed. However, in addition to the daytime observations (7 a.m., 2 p.m., and 9 p.m.) the real (24 h) daily mean values are also derived. These values were calculated based on the method described by Károly Jelinek and summarized in the preface of the 1871 yearbook. First, several reference stations were denoted as having more frequent/24 h measurements (e.g., Prague, Wien, Milano, and Dej). In the case of these reference stations, from the diurnal cycle of the temperature, a C correction factor was determined as the difference between the mean of the three observations (at 7 a.m., 2 p.m., and 9 p.m.) and the 24 h mean (different for each month and time combination). At the same time, for these stations, a D correction factor was also determined representing the sum of differences between the observations of 7 a.m.–2 p.m. and 2 p.m.–9 p.m. In the case of the regional stations (having only three observations a day), a D’ correction factor could also be determined in the same way as the D correction factor in the case of the reference stations. The hourly data for regional stations were derived using Equations (1) and (2).
C’/C = D’/D
C’ = C/D × D’
where C’—hourly correction factor for regional stations having only three observations a day.
Based on the data of the nearest reference stations, the ratio of C/D was given for each regional station. In order to calculate the C’ correction factor, and thus to calculate the hourly data, only the D’ correction factor (the sum of differences between the observations of 7 a.m. and 2 p.m. and 2 p.m. and 9 p.m.) should be calculated and multiplied by C/D at each regional station. Original observations (daytime) based on three measurements and derived 24 h values were both analyzed in this study.
The definition of fog in the case of historical observations is the same as that of today, i.e., it means fog is detected if the maximum horizontal visibility is less than 1 km. Fog observations were performed three times per day, generally at 7 a.m., 2 p.m., and 9 p.m. If fog was detected at least once during the day, the day was considered foggy. In this way, the number of foggy days per month was calculated and compared with recent observations. However, the different frequency of observations must be kept in mind during interpretation of the results.
In this study, 13 stations with the best temporal coverage were chosen to represent the Carpathian Region: Arad, Bistrița, Miercurea Ciuc, Cluj-Napoca, Baia Mare, Sibiu (RO); Budapest, Debrecen, Pécs, Szeged (HU); Uzhhorod (UA), Kosice (SK), and Zagreb (HR). Monthly mean (daily/24 hourly and daytime/from 3 observations), minimum and maximum temperature, and precipitation data series of these stations were digitalized manually from the yearbooks and double checked. In some cases, it was necessary to combine adjacent time series with interruptions to have a complete series: Cluj-Napoca (Cluj-Napoca City, University, and Manastur), Miercurea Ciuc (Miercurea Ciuc and Șumuleu Ciuc), and Arad (Arad City, Ceala). From the above-mentioned stations, Budapest, Cluj-Napoca, Pécs, Sibiu, Uzhhorod, and Zagreb stations had fog observations as well. Taking into account stations with available recent fog observations in Romania, historic data from two more stations (Jimbolia and Sf. Gheorghe) were also introduced. These two stations did not have a relatively long temperature and precipitation series, but their fog data series were very useful.

2.2. Data Quality Control

Data quality control of the historical time series consisted of homogeneity testing and homogenization, outlier checks, removal of respective errors, and data gap filling. For homogenization, the MASH v3.03 (Multiple Analysis of Series for Homogenization) software was used, which was formulated and developed by Szentimrey [19,20].
MASH is a relative and iterative homogeneity test procedure based on hypothesis testing and uses a multiple-breakpoint approach in the sense that it detects and corrects multiple break structures. Venema et al. [23] showed that multiple-break methods generally perform better than hierarchic methods.
The MASH procedure was developed originally for homogenization of monthly series. In case of having monthly series for all the 12 months, the monthly, seasonal, and annual series can be homogenized together. In the newer versions, the daily inhomogeneities can also be derived from the monthly ones. For monthly series, the following procedure is elaborated: series comparison, breakpoint and outlier detection, correction of series, missing data complementing, automatic usage of meta data, and a verification procedure to evaluate the homogenization results.
For time series comparison, it applies multiple reference series without assuming homogeneity of the reference series. A candidate series is chosen from the set of available series, and the remaining ones are treated as potential reference series. Then, the candidate time series is compared with multiple surrounding stations in a step-by-step way, where the role of series (candidate or reference series) changes step by step. During one iterative step, several difference series are constructed from the candidate and various weighted reference series. The optimal weights are determined according to the kriging interpolation formula that minimizes the variance of the difference series. Provided that the candidate series is the only one with a break in common with all the difference series, these break points can be attributed to the candidate series. Each series is considered the candidate series, and difference series between this candidate and the weighted reference series are used to identify inhomogeneity location, confidence intervals, and magnitudes. The difference between the average in the reference series and the candidate series gives the inhomogeneity magnitude. These series are then compared and adjusted in an iterative process until no more inhomogeneities are found. Depending on the distribution of examined meteorological elements, additive (e.g., temperature) or multiplicative (e.g., precipitation) models can be applied. Meta data (probable dates of break points) can be used automatically but are optional. The outlier detection and missing value completion based on kriging interpolation are also part of the procedure. In general, the fewer the gaps, the easier to find breakpoints, determine inhomogeneities, fill the gaps, and perform quality control. In MASH, it is recommended to start with missing data of less than 33%. On the other hand, it is not recommended to have missing data from a large area at the same time period. After the automated process, raw datasets are manually compared with the homogenized ones, analyzing break points and checking gap filling.
The MASH algorithm has been applied to several regional datasets [9,10,16,24,25]. The method seems to be one of the most comprehensive procedures for homogenization [26,27]. A comprehensive assessment of the homogenization techniques for climate series was included in the scientific program of the COST Action HOME ES 0601 Advances in Homogenization Methods of Climate series: An integrated approach. Relying on the HOME blind test experiments, MASH is considered one out of the best three methods [23]. MASH is also recommended by the World Meteorological Organization, which considers it an excellent statistical homogenization package [28].
In general, homogenization greatly improved the quality of time series by reducing the regional variability and improving both the temporal and spatial coherence. Izsak et al. [29] show a great improvement of timeseries after the MASH homogenization process for 25 stations over Hungary. In the case of temperature, homogenized data series show a significant increase for each series, while in the case of a quarter of the raw data series no change can be detected. The average difference between the homogenized and raw trend is generally 0.3 C (1901–2018). The greatest differences can be seen in the cities, where homogenization with MASH gave the highest value of inhomogeneities. Thanks to the mathematical model, using the MASH software, it is possible to detect climate change in the homogenized dataset [20,23,26,30].
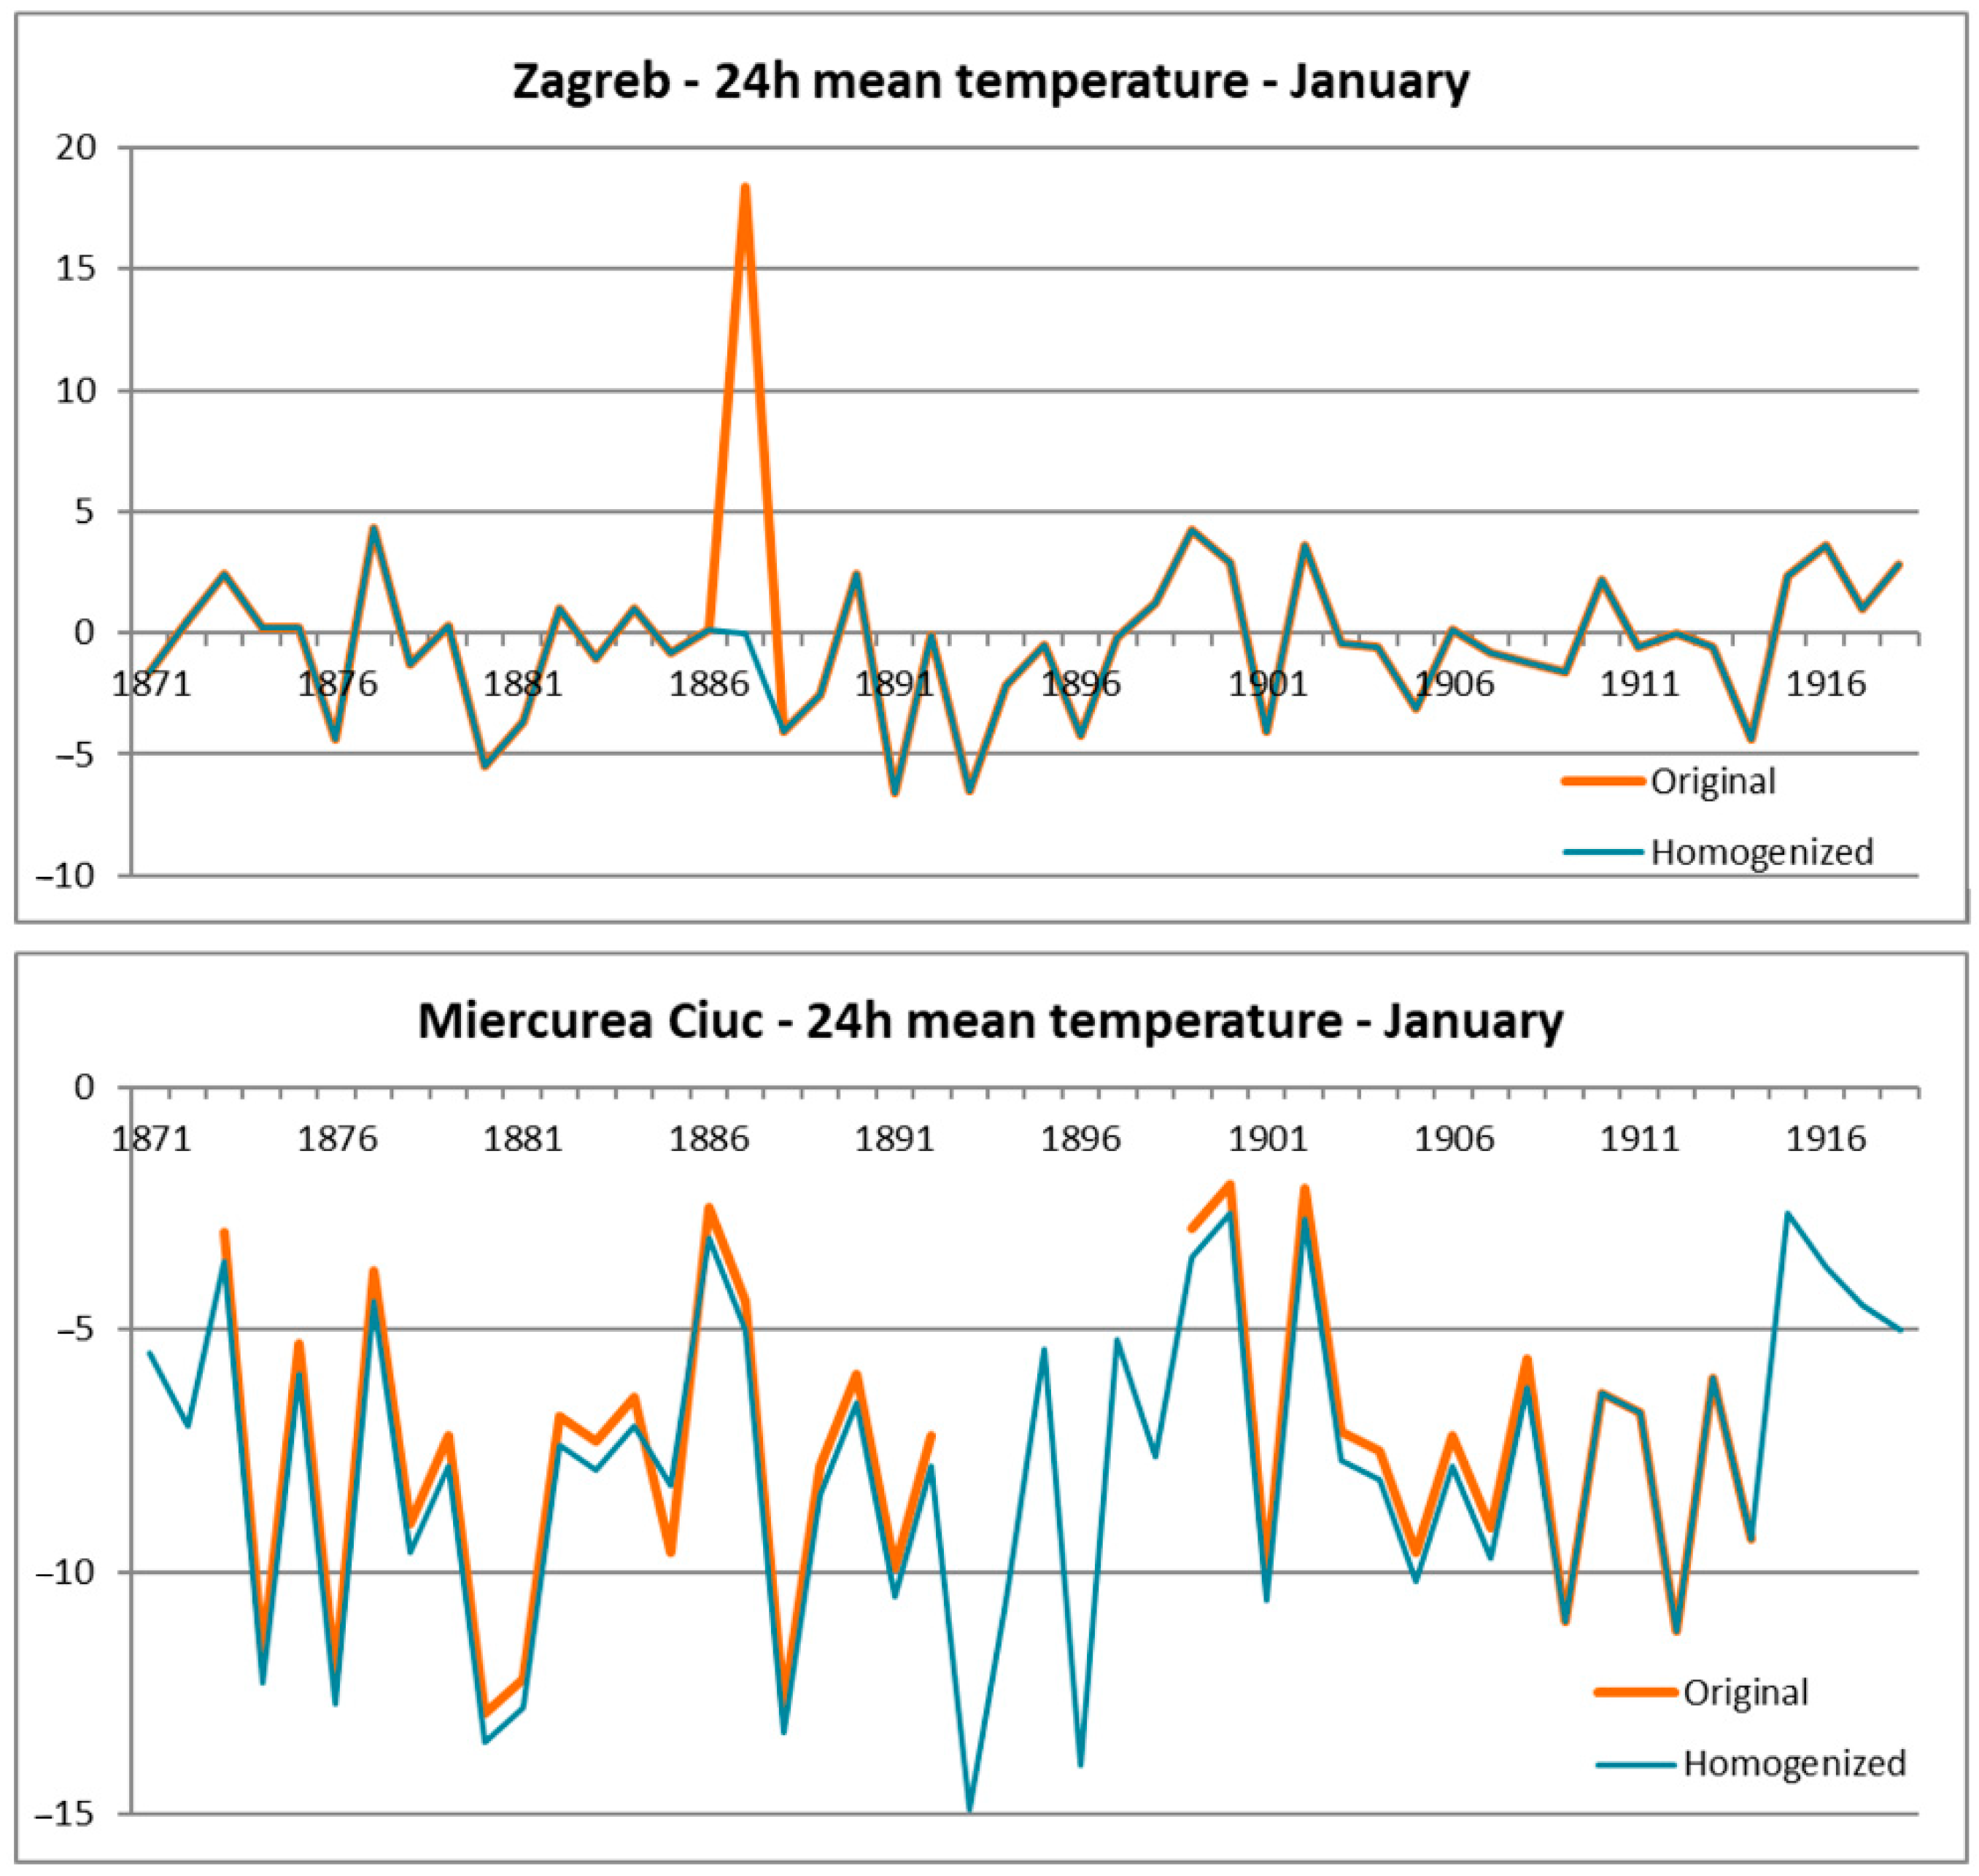
Figure 2 presents the monthly data series for January before and after homogenization for Zagreb (upper) and Miercurea Ciuc (bottom). Zagreb presents one of the most complete historical datasets (completeness 99.1%), while the dataset from Miercurea Ciuc has the most gaps (completeness 70.7%). In the case of Zagreb, we had an outlier in 1887 (a typo during the digitalization process) removed by the MASH homogenization process. In the case of the time series from Miercurea Ciuc, the MASH process filled the data gaps and detected two break points (1885 and 1908). The second break point could be connected to the relocation of the station from Șumuleu (Csíksomlyó) to Miercurea Ciuc (Csíkszereda) in 1910. The distance between the two stations was approximately 2.5 km. After this year. no systematic difference (about 0.6 °C) between raw and homogenized is present.
The most important verification statistics (homogeneity test statistics before and after the homogenization, relative modification of series, and representativity of stations network) are presented in Table S1. The spatial means show an improvement after the MASH homogenization process (e.g., excepting May, all the test statistics become less then the critical value). To analyze the spatial coherence, temperature and precipitation anomalies (reference period 1871–1901) of the historical series are also calculated before and after the homogenization process (Figure S2). In the case of temperature, no significant improvement is detected; however, in the case of precipitation, the spatial coherence obviously increased after homogenization in all seasons.

2.3. Recent Data

High-quality hourly temperature and seasonal precipitation datasets for the period 1970–2020 were provided by the Romanian National Meteorological Administration (ANM—Administrația Națională de Meteorologie) for the six stations in Romania (Arad, Bistrița, Miercurea Ciuc, Cluj-Napoca, Baia Mare, and Sibiu). Current fog datasets (number of foggy days per month) were also provided by the ANM for the period 1990–2020 for four Romanian stations (Cluj-Napoca, Jimbolia, Sfântu Gheorghe, and Sibiu). For the stations of Budapest, Debrecen, Pécs, Szeged, Uzhhorod, Kosice, and Zagreb, daily mean temperature and precipitation series were downloaded from the European Climate Assessment & Dataset (ECA&D) [5].

3. Results

3.1. Changes in Mean Temperature

To analyze long-term climate variability in the Carpathian Basin, statistical tests were conducted to compare the main statistics (mean, distributions) of the historical datasets (1871–1918) with current data (1971–2020). First, the two-tail two-sample student’s t-test was used to compare the means of the two periods. The null hypothesis is that the true difference between these group means is zero. The alternate hypothesis is that the true difference is different from zero. To apply the t-test assuming equal or not equal population variance, we also checked the variance of the datasets by applying the Fisher F-test. We used the 0.05 significance level in the case of both statistical tests.
As we mentioned in Section 2.1, during the historical period temperature measurements were performed three times per day (daytime); however, 24 h means were derived using empirical formulas. Table 1 presents the results of the student’s t-test carried out on daily (24 h) data in the case of all stations considered in this study and daytime temperature for stations located in Romania where good quality hourly data were available (the results of the Fisher F-tests are presented in Table S2 of the Supplementary Material). Comparing the historical and recent periods in terms of means, we can affirm a general increase in mean temperature in the Carpathian Region. The majority of the stations indicates significant positive changes all over the year, however, among the seasons, autumn represents the fewest significant cases. One single case was detected showing a significant temperature decrease, namely in Miercurea Ciuc during autumn. This station has a typical topoclimate of intermontane basin. In the whole region, the observed mean 24 h temperature in the last five decades (1971–2020) was 0.77 °C higher than in 1871–1918. The strongest warming is detected during wintertime (1.29 °C), followed by spring (0.81 °C) and summer (0.64 °C), whereas autumn shows the least amount of warming (0.34 °C). Daytime warming shows the highest value, 1.1 °C in the annual mean. As per individual stations, the two largest cities, Budapest and Zagreb, show the strongest warming (2.23 °C and 1.99 °C respectively), both in winter. Table S3 of Supplementary Material presents the values (°C) of multiannual 24 h temperature means for the two periods.
In order to analyze the changes in the case of the extreme values too, a nonparametric χ2 homogeneity test was performed to compare the probability distributions of historical (1871–1918) and current (1971–2020) datasets (Table 1). The results show a general shift of the distribution towards higher values (positive changes in mean) except for Miercurea Ciuc in autumn (see the plots of PDFs in Figure S3 of Supplementary Material). There are situations when changes in distribution do not indicate changes in means, which highlights the cases when the edge of the distribution changes significantly (e.g., Bistrita in summertime).
The less significant changes in 24 h mean temperature (mean and distribution) were detected for Arad and Miercurea Ciuc, however, in the case of daytime temperature, all stations present significant changes in winter, spring, and summer.
A trend analysis was also performed on each time series to compare the long-term changes in the climate of the historical and the recent period. The statistical method for the trend detection consists of the robust nonparametric Mann–Kendall test. First, the 1-lag autocorrelation is checked using the Durbin–Watson test. Since the study considers seasonal time series, no autocorrelation was detected, thus no modified Man–Kendall test is required. The magnitude of the trend was established using the Sen`s estimator. In each case, the test was performed at a 0.05 significance level. Table 2 (Figure S4) presents the significant trends for the historical and recent periods. In the period of 1871–1918, no significant changes were detected in daily and daytime temperature, except for Cluj-Napoca, Budapest, and Pécs in wintertime and Szeged in spring. In the case of these fastest-growing cities at that time, the general warming during the cold season could be considered an urban effect. On the contrary, the period 1970–2020 shows significant warming trends at all stations located in the Carpathian Region, especially during summer and autumn (the highest slopes were detected in summertime).

3.2. Changes in Maximum and Minimum Temperatures

For the historical period, the yearbooks of RHCIMEM contain statistics regarding the minimum and maximum temperature observed during a month. It should be mentioned that these values are selected from the hourly temperature observations, and no additional minimum and maximum temperature measurements were carried out. In order to compare these observations with recent data, we selected the absolute minimum and maximum values of temperature observation at 7 a.m., 2 p.m., and 9 p.m. during the given month. Since high-quality hourly data were available only for the Romanian stations, here, we present the results only for these stations representing the Transylvania Region.
Table 3 shows the significant changes in the mean and distribution in daytime minimum and maximum monthly temperatures. In the case of the majority of the stations, the winter season presents the most significant changes in both extremes. In terms of the magnitude of the changes, the winter season also exhibits the highest values, 1.88 °C in the case of minimum temperature and 1.68 °C in the case of maximum temperature, respectively. Among the stations, Cluj-Napoca presents the strongest warming in winter in minimum temperature (3.18 °C) and Bistrita in summer in maximum temperature (2.85 °C). In winter and summertime, some shifts in the distribution are also detected. In terms of trend, no significant trend was detected during the historical period (1871–1918), neither in minimum temperature nor in maximum temperature (Table 4, Figure S4). On the contrary, the period of 1971–2020 in all cases presents significant trends in summertime minimum temperature and significant trends in all seasons in the case of maximum temperature.

3.3. Changes in Precipitation

Since the yearbooks of RHCIMEM include information on precipitation, we analyzed the seasonal changes in the amount of precipitation (%) in the last 150 years. Table 5 shows the significant changes in the amount of precipitation between the historical (1871–1918) and recent (1971–2020) periods. At lower elevations, the decrease in precipitation exceeds even 20% during spring and autumn. In a few cases, a shift in the distributions is detected in these seasons. Bistrita during winter is the only station with a significant increase in precipitation. Table S3 of Supplementary Material presents the values (in mm) of the multiannual amount of precipitation for the two periods. In terms of trends, we found very few significant trends both in the historical and recent period. Most of these trends indicate an increase in precipitation during wintertime (Table 6, Figure S4).

3.4. Long-Term Fog Observations

Starting from 1886, the yearbooks of RHCIMEM include daily observations for several stations over the Carpathian Region [31]. In addition to basic meteorological variables, qualitative information about the weather situations occurring at the stations, weather conditions near to the surface such as haze, fog, dew, etc., and the sky overhead situation (cloudiness) is described using pictorial and abstract symbols. In this study, we analyzed the fog event situations for eight stations (see Figure 1). Since fog observations were similar in the historical period (fog was present if the maximum visibility dropped below 1 km), no further data correction is needed to compare these data with recent observations.
Figure 3 presents the monthly distribution of fog events in the case of eight stations over the Carpathian Basin. The highest number of fog events occur during the cold period of the year (October–March), with a peak in December having 5.8 events on average. During the year, the highest values in fog events were detected in the lower parts of the region (Pécs, Zagreb, Budapest, and Jimbolia).
Since high-quality fog observations were available for stations from Romania, in the study, we performed a comparison between the number of monthly fog events for the periods of 1886–1916 and 1990–2020 (Figure 4). In general, during the colder months (October–April), the highest numbers of foggy days were recorded in Jimbolia (1886–1916), Cluj-Napoca, and Sibiu (1990–2020); however, during the warm months (May–September), Sf. Gheorghe had higher numbers. Based on the two-sample student’s t-tests, significant changes at the 0.05 significance level were detected in the majority of cases (increasing number in each case). Except for February and March, all months showed significant changes in Cluj-Napoca. Except for November in Sfântu Gheorghe, and the period of December to March for Sibiu, all months showed a significant change in the number of foggy days per year for both stations, respectively. In the case of Jimbolia, only July showed significant change between the two periods. On an annual scale, in the last 31-year period (1990–2020), the number of foggy days increased by 16.2 compared with the 1886–1916 period. The strongest increase was detected in Sibiu (25.1 days), followed by Sfântu Gheorghe (19.1 days) and Cluj-Napoca (18.8 days). The smallest change was detected in Jimbolia (1.9 days).

4. Conclusions and Discussion

In order to achieve a better understanding of regional climate and deliver relevant climate data, this study aimed to create the longest climate dataset ever in the Carpathian Region. It combines climate records back to 1871 with current data till 2020 (spanning a period of 150 years).
The first part of the investigation consisted of systematizing and digitalizing the records available for the region from the meteorological yearbooks of RHCIMEM. Since the content of the yearbooks was not fully investigated, several unexpected questions popped up during the working process. Several general concepts were predefined in terms of station selection, as follows: the best possible extension back to the early instrumental period (longest data series); the best possible spatial coverage (including stations having gaps in the time series); and the best possible treatment of data quality (homogeneity breaks, outliers, and gaps). In this way, we selected 13 stations over the Carpathian Region to assess the characteristics of temperature and precipitation and 8 stations for analyzing changes in foggy events. Based on our work on historical instrumental datasets, we found that the quality and homogeneity of the data were major problems that required unique solutions and lots of work.
Next, a comprehensive comparison between the periods of 1871–1918 and 1971–2020 based on statistical tests and trend analysis was performed utilizing the temperature and precipitation time series. It was conducted to elaborate the main features of the region in terms of climate change. In the case of the observed 24 h temperature, the last five decades (1971–2020) were 0.77 °C warmer than the 1871–1918 period. The strongest warming was detected during wintertime (1.29 °C). However, this rate of warming was exceeded by daytime warming, showing a 1.1 °C change in the annual mean temperature between the historical and recent periods. Along with that, shifts in distributions towards high values were also detected in a majority of the cases. Looking at the significant warming trends, in the few cases of the fastest-growing cities in the historical period (Cluj-Napoca, Budapest, and Pécs), the general warming during the cold season could be considered an urban effect. On the contrary, the period of 1970–2020 shows significant warming trends in the case of all stations in the Carpathian Region. Furthermore, the period of 1971–2020 presents significant increasing trends in summertime minimum temperature and significant increasing trends for all seasons in the case of maximum temperature.
The seasonal changes in the amount of precipitation (%) in the last 150 years were also investigated. We detected significant differences in spring and autumn (less precipitation in the recent period). At three stations, the trends indicate an increase in precipitation during wintertime in the recent period. Based on long-term fog observations, higher frequency in foggy events is detected in the recent period for the Transylvania Region. On an annual scale, in the last three decades (1990–2020), the number of foggy days increased by 16.2 as compared with the 1886–1916 period.
In this study, we aimed at comparing the main climate features of historical (1871–1918) and present (1970–2020) periods and found significant differences between the two time periods. Even if some local trends were detected in the historical period (e.g., Cluj-Napoca), significant changes are much more characteristic in the recent period for all stations in the region, which indicates a large-scale climate change in the last few decades. It should be mentioned that the homogenization technique was applied to the historical data (1871–1918). Since no continuous data series starting from 1871 till the recent period are available for all the stations considered in the study, the historical period was compared with the sub-period of 1971–2020.
However, using the same MASH method, Izsak. et al. [16] homogenized daily mean temperature and precipitation time series of 11 Hungarian stations for the whole period 1871–2020. As a result, the longest continuous homogenized daily datasets became available for Hungary (available at https://www.met.hu/omsz/tevekenysegek/adattar/, accessed on 26 July 2022). There are two stations in common with our study (Budapest and Szeged). In order to justify our results, a comparison of the temperature trends calculated from Izsak et al.`s series and our series is presented in Table 7. The results are very similar: the RMSE between the trends obtained from the series obtained by the different MASH homogenization processes is 0.09; furthermore, in more than 90% of the cases, the differences are situated inside the confidence interval of the Sen’s slope.
Even if several historical datasets are available for the region [17,32,33], since they used different sources and timeframes, direct comparison with our results is not applicable.
The novelty of this study consists in processing the historical data from the yearbooks of RHCIMEM spanning the 48-year period of 1871–1918. We presented the initial steps of the database construction, as well as the first results of analyzing the temperature, precipitation, and fog measurements in the Carpathian Region. Digitization of the yearbooks with a uniform structure, quality assessments, and the creation and processing of historical climate data series are the tasks for the future.

Supplementary Materials

The following supporting information can be downloaded at: https://www.mdpi.com/article/10.3390/atmos13111751/s1, Figure S1: The structure of The Royal Hungarian Central Institute of Meteorology and Earth Magnetism (RHCIMEM) yearbooks; a.—inside cover page, b.—preface, c.—list of stations, d.—monthly meteorological observations, e.—daytime meteorological observations, f.—agrometeorological observations; Figure S2: The seasonal anomalies (reference period 1871–1901) of 24h temperature (upper) and precipitation (bottom) in the historical period (1871–1918) before (left) and after (right) the homogenization using MASH method; Figure S3: Comparison of distributions using χ2 homogeneity test of daily (24 h) and daytime mean and maximum and minimum temperature between historical (1871–1918) and current (1971–2020) periods in the Carpathian Region. Green—historical period and pink—current period; Figure S4: Spatial distribution of trends for historical (1871–1918) and current (1971–2020) periods in the Carpathian Region (see Table 2, Table 4 and Table 6); Table S1: The spatial means of the main verification statistics of MASH homogenization process; Table S2: Comparison of standard deviation using F-test of daily (24 h) and daytime mean temperature and maximum and minimum temperature and precipitation between historical (1871–1918) and current (1971–2020) periods in the Carpathian Region. sig. indicates significant difference at the 0.05 significance level; Table S3: The multiannual 24 h temperature means and multiannual means in amount of precipitation for the periods of 1871–1918 and 1971–2020 in the Carpathian Region.

Author Contributions

Conceptualization, T.W. and B.B.; methodology, B.B. and J.I.; software, J.I. and A.D.; validation, B.B., J.I., and T.W.; formal analysis, B.B., T.W., A.D., and S.C.; investigation, J.I. and B.B.; resources, J.I., T.W., A.D., and S.C.; data curation, J.I. and A.D.; writing—original draft preparation, B.B.; writing—review and editing, T.W., S.C., A.D., A.G., and Á.V.T.; visualization, J.I.; supervision, B.B.; project administration, B.B.; funding acquisition, J.I. All authors have read and agreed to the published version of the manuscript.

Funding

This research was partially funded by the Babes-Bolyai University, Cluj-Napoca, Romania through the Special Scholarships for Scientific Activity for Students Based on Research Projects and the Evaluation of Results obtained by the first author (Grant no. 36617/02.12.2021). The APC was also funded by Babes-Bolyai University.

Institutional Review Board Statement

Not applicable.

Informed Consent Statement

Not applicable.

Data Availability Statement

Not applicable.

Acknowledgments

The first author of the paper was supported by a Special Scholarships for Scientific Activity for Students Based on Research Projects and the Evaluation of Results (Bursa specială pentru activitatea stiinţifică studenţilor pe baza de proiecte de cercetare și valorificarea rezultatelor acestora), Grant no. 36617/02.12.2021, funded by Babes-Bolyai University, Cluj-Napoca, Romania. The authors acknowledge the meteorological data provided by National Meteorological Administration of Romania and the European Climate Assessment & Dataset.

Conflicts of Interest

The authors declare no conflict of interest.

References

  1. Náfrádi, K.; Sümegi, P.; Jakab, G.; Persaits, G.; Törőcsik, T. Reconstruction of the Vegetation and Environment during Different Climatic and Sociotechnical Conditions of the Last 3000 Years in Southwestern Hungary. Am. J. Plant Sci. 2014, 5, 1557–1577. [Google Scholar] [CrossRef] [Green Version]
  2. Ważny, T.; Lorentzen, B.; Köse, N.; Akkemik, Ü.; Boltryk, Y.; Güner, T.; Kyncl, J.; Kyncl, T.; Nechita, C.; Sagaydak, S.; et al. Bridging the gaps in tree-ring records: Creating a high-resolution dendrochronological network for Southeastern Europe. Radiocarbon 2014, 56, S39–S50. [Google Scholar] [CrossRef]
  3. Popa, I.; Bouriaud, O. Reconstruction of summer temperatures in Eastern Carpathian Mountains (Rodna Mts, Romania) back to AD 1460 from tree-rings. Int. J. Climtol. 2013, 34, 871–880. [Google Scholar] [CrossRef]
  4. Smith, A.; Lott, N.; Vose, R. The Integrated Surface Database: Recent Developments and Partnerships. Bull. Am. Meteorol. Soc. 2011, 92, 704–708. [Google Scholar] [CrossRef] [Green Version]
  5. Klein Tank, A.M.G.; Wijngaard, J.B.; Können, G.P.; Böhm, R.; Demarée, G.; Gocheva, A.; Mileta, M.; Pashiardis, S.; Hejkrlik, L.; Kern-Hansen, C.; et al. Daily dataset of 20th-century surface air temperature and precipitation series for the European Climate Assessment. Int. J. Climatol. 2002, 22, 1441–1453. [Google Scholar] [CrossRef]
  6. Klok, E.J.; Klein Tank, A.M.G. Updated and extended European dataset of daily climate observations. Int. J. Climatol. 2009, 29, 1182–1191. [Google Scholar] [CrossRef]
  7. Kalnay, E.; Kanamitsu, M.; Kistler, R.; Collins, W.; Deaven, D.; Gandin, L.; Iredell, M.; Saha, S.; White, G.; Woollen, J.; et al. The NCEP/NCAR 40-year reanalysis project. Bull. Am. Meteorol. Soc. 1996, 77, 437–471. [Google Scholar] [CrossRef]
  8. Hersbach, H.; Bell, B.; Berrisford, P.; Hirahara, S.; Horányi, A.; Muñoz-Sabater, J.; Nicolas, J.; Peubey, C.; Radu, R.; Schepers, D.; et al. The ERA5 global reanalysis. Q. J. R. Meteorol Soc. 2020, 146, 1999–2049. [Google Scholar] [CrossRef]
  9. Szalai, S.; Auer, I.; Hiebl, J.; Milkovich, J.; Radim, T.; Stepanek, P.; Zahradnicek, P.; Bihari, Z.; Lakatos, M.; Szentimrey, T.; et al. Climate of the Greater Carpathian Region. Final 740 Technical Report; European Commission, Joint Research Centre: Ispra, Italy, 2013; Available online: http://www.carpatclim-eu.org (accessed on 26 July 2022).
  10. Dumitrescu, A.; Birsan, M.V. ROCADA: A gridded daily climatic dataset over Romania (1961–2013) for nine for nine meteorological variables. Nat. Hazards 2015, 78, 1045–1063. [Google Scholar] [CrossRef]
  11. Auer, I.; Böhm, R.; Jurkovic, A.; Lipa, W.; Orlik, A.; Potzmann, R.; Schöner, W.; Ungersböck, M.; Matulla, C.; Briffa, K.; et al. HISTALP—Historical instrumental climatological surface time series of the Greater Alpine Region. Int. J. Climatol. 2007, 27, 17–46. [Google Scholar] [CrossRef]
  12. Auer, I.; Böhm, R.; Schöner, W. Austrian Long-Term Climate 1767–2000: Multiple Instrumental Climate Time Series from Central Europe; Central Institute for Meteorology and Geodynamics: Vienna, Austria, 2001. [Google Scholar]
  13. Frich, P.; Alexandersson, H.; Ashcroft, J.; Dahlström, B.; Demaree, G.R.; Drebs, A.; van Engelen, A.F.V.; Førland, E.J.; Hanssen-Bauer, I.; Heiro, R.; et al. North Atlantic Climatological Dataset (NACD Version 1) Final Report; Scientific Report 96-1; Danish Meteorological Institute: Copenhagen, Denmark, 1996. [Google Scholar]
  14. Hammerl, C. Viennese School of Climatology. Oxford Research Encyclopedias. Oxf. Res. Encycl. Clim. Sci. 2018. [Google Scholar] [CrossRef]
  15. Kaiserlich-Königliche Zentralanstalt für Meteorologie und Erdmagnetismus. Jahrbücher der K.K. Central-Anstalt für Meteorologie und Erdmagnetismus: Officielle Publication; Braumüller: Vienna, Austria, 1883. [Google Scholar]
  16. Izsák, B.; Szentimrey, T.; Lakatos, M.; Pongrácz, R.; Szentes, O. Creation of a representative climatological database for Hungary from 1870 to 2020. Időjárás. Q. J. Hung. Meteorol. Serv. 2022, 126, 1–26. [Google Scholar] [CrossRef]
  17. Cheval, S.; Haliuc, A.; Antonescu, B.; Tișcovschi, A.; Dobre, M.; Tătui, F.; Dumitrescu, A.; Manea, A.; Tudorache, G.; Irimescu, A.; et al. Enriching the historical meteorological information using Romanian language newspaper reports: A database from 1880 to 1900. Int. J. Climatol. 2021, 41, E548–E562. [Google Scholar] [CrossRef]
  18. Weidinger, T.; Nagy, L.; Bali, G.; Tordai, Á.V. Climate time series of the Carpathian Basin (1871–1918). In Proceedings of the Interdisciplinary Landscape Research in the 21st Century, VII Hungarian Landscape Ecology Conference, Szeged, Hungary, 25 May 2017. (In Hungarian). [Google Scholar]
  19. Szentimrey, T. Multiple Analysis of Series for Homogenization (MASH). In Proceedings of the 2nd Seminar for Homogenization of Surface Climatological Data, Budapest, Hungary; WCDMP-No.41; WMO: Geneva, Switzerland, 1999; pp. 27–46. [Google Scholar]
  20. Szentimrey, T. Development of MASH homogenization procedure for daily data. In Proceedings of the 5th Seminar for Homogenization and Quality Control in Climatological Databases, Budapest, Hungary; WCDMP-No. 71; World Meteorological Organization (WMO): Geneva, Switzerland, 2008; pp. 123–130. [Google Scholar]
  21. Szentimrey, T.; Bihari, Z. Mathematical background of the spatial interpolation methods and the software MISH (Meteorological Interpolation based on Surface Homogenized Data Basis). In Proceedings of the Conference on Spatial Interpolation in Climatology and Meteorology, Budapest, Hungary; COST Action 719; COST Office: Brussels, Belgium, 2007; pp. 17–27. [Google Scholar]
  22. WMO. Centennial Observing Stations. Available online: https://public.wmo.int/en/our-mandate/what-we-do/observations/centennial-obser-ving-stations (accessed on 26 July 2022).
  23. Venema, V.K.C.; Mestre, O.; Aguilar, E.; Auer, I.; Guijarro, J.A.; Domonkos, P.; Vertacnik, G.; Szentimrey, T.; Stepanek, P.; Zahradnicek, P.; et al. Benchmarking homogenization algorithms for monthly data. Clim. Past 2012, 8, 89–115. [Google Scholar] [CrossRef] [Green Version]
  24. Mamara, A.; Argiriou, A.A.; Anadranistakis, M. Homogenization of mean monthly temperature time series of Greece. Int. J. Climatol. 2013, 33, 2649–2666. [Google Scholar] [CrossRef]
  25. Li, Z.; Yan, Z. Application of Multiple Analysis of Series for Homogenization to Beijing daily temperature series (1960–2006). Adv. Atmos. Sci. 2010, 27, 777–787. [Google Scholar] [CrossRef]
  26. Killick, R.E.; Jolliffe, I.T.; Willett, K.M. Benchmarking the performance of homogenization algorithms on synthetic daily temperature data. Int. J. Climatol. 2022, 42, 3968–3986. [Google Scholar] [CrossRef]
  27. Costa, A.C.; Soares, A. Homogenization of Climate Data Review and New Perspectives Using Geostatistics. Math. Geosci. 2009, 41, 291–305. [Google Scholar] [CrossRef]
  28. WMO-No. 1245; Guidelines on Homogenization. World Meteorological Organization (WMO): Geneva, Switzerland, 2020.
  29. Izsák, B.; Szentimrey, T. To what extent does the detection of climate change in Hungary depend on the choice of statistical methods? Int. J. Geomath. 2020, 11, 17. [Google Scholar] [CrossRef]
  30. Peterson, T.C.; Easterling, D.R.; Karl, T.R.; Groisman, P.; Nicholls, N.; Plummer, N.; Torok, S.; Auer, I.; Boehm, R.; Gullett, D.; et al. Homogeneity adjustments of in situ atmospheric climate data: A review. Int. J. Climatol. 1998, 18, 1493–1517. [Google Scholar] [CrossRef]
  31. Gandhi, A.; Bartok, B.; Ilona, J.; Musyimi, P.; Weidinger, T. Historical fog climate dataset for Carpathian Basin from 1886 to 1919. Data Brief. 2022, 44, 108500. [Google Scholar] [CrossRef] [PubMed]
  32. Csernus-Molnár, I.; Kss, A.; Pócsik, E. 18th-Century Daily Measurements and Weather Observations in the Se-Carpathian Basin: A Preliminary Analysis of the Timişoara Series (1780–1803). J. Environ. Geogr. 2014, 7, 1–9. [Google Scholar] [CrossRef] [Green Version]
  33. Bartholy, J.; Pongrácz, R.; Molnár, Z. Classification and analysis of past climate formation based on historical documentary sources for the Carpathian basin. Int. J. Climatol. 2004, 24, 1759–1776. [Google Scholar] [CrossRef]
Figure 1. The study area. The historical meteorological stations in the Carpathian Region considered in the study. Stations shown by red color had continuous temperature and precipitation observations, while those marked in yellow had observations for fog.
Atmosphere 13 01751 g001
Figure 2. January monthly means of 24 h temperature before and after MASH homogenization for Zagreb (upper) and Miercurea Ciuc (bottom).
Atmosphere 13 01751 g002
Figure 3. The monthly distribution of fog events over the Carpathian Basin.
Atmosphere 13 01751 g003
Figure 4. The monthly distribution of fog events over the Transylvania Region in the periods of 1886–1916 and 1990–2020.
Atmosphere 13 01751 g004
Table 1. Changes in daily (24 h) and daytime (the average of observations at 7 a.m., 2 p.m., and 9 p.m.) mean temperature in °C (upper) and probability distribution of mean temperature (bottom) between historical (1871–1918) and current (1971–2020) periods in Carpathian Region. Bold values and sig. indicate significant changes at the 0.05 significance level.
Stations24-h Mean Temperature
Changes in MeansChanges in Distribution
WinterSpringSummerAutumnWinterSpringSummerAutumn
1Arad0.740.150.3−0.4
2Bistrița1.510.590.05−0.16sig. sig.
3Miercurea Ciuc0.760.02−0.32−0.77 sig.
4Cluj-Napoca1.560.510.280.2sig. sig.
5Baia Mare1.360.930.840.56sig.sig.sig.
6Sibiu1.130.340.480.28sig.
7Budapest2.231.61.411.22sig.sig.sig.sig.
8Debrecen1.611.270.790.93sig.sig.sig.sig.
9Pecs0.930.590.620.24 sig.sig.
10Szeged1.120.630.150.06 sig.
11Uzhhorod0.60.770.690.33 sig.sig.
12Kosice1.251.791.710.95sig.sig.sig.sig.
13Zagreb1.991.351.320.96sig.sig.sig.sig.
Spatial mean1.290.810.640.34
StationsDaytime Mean Temperature
Changes in MeansChanges in Distribution
WinterSpringSummerAutumnWinterSpringSummerAutumn
1Arad0.861.121.520.29 sig.sig.
2Bistrița1.751.380.930.45sig.sig.sig.
3Miercurea Ciuc0.951.170.910.21 sig.sig.
4Cluj-Napoca1.751.211.170.73sig.sig.sig.
5Baia Mare1.511.381.580.98sig.sig.sig.sig.
6Sibiu1.41.021.450.76sig.sig.sig.sig.
Spatial mean1.371.211.260.57
Table 2. Trend (°C/decade) of daily (24 h) and daytime mean temperature for historical (1871–1918) and current (1971–2020) periods in the Carpathian Region. Bold values indicate significant changes at the 0.05 significance level.
StationsSen’s Slope for 24-h Mean Temperature
1871–19181970–2020
WinterSpringSummerAutumnWinterSpringSummerAutumn
Arad0.250.15−0.18−0.010.270.310.620.43
Bistrița0.230.11−0.030.000.500.410.770.56
Miercurea Ciuc0.520.09−0.050.00 0.320.300.530.39
Cluj-Napoca0.460.19−0.08−0.01 0.330.390.670.48
Baia Mare0.220.24−0.070.06 0.220.290.660.46
Sibiu0.430.130.000.02 0.290.360.630.45
Budapest0.560.20−0.070.05 0.190.360.540.44
Debrecen0.310.16−0.10−0.05 0.250.370.610.50
Pecs0.520.23−0.160.04 0.270.380.560.42
Szeged0.330.27−0.14−0.01 0.210.360.570.50
Uzhhorod0.220.22−0.100.07 −0.330.140.470.33
Kosice0.270.19−0.200.03 0.250.460.730.59
Zagreb0.370.18−0.070.09 0.380.500.740.50
StationsSen’s Slope for Daytime Mean Temperature
1871–19181970–2020
WinterSpringSummerAutumnWinterSpringSummerAutumn
Arad0.080.10−0.150.03 0.270.360.690.44
Bistrița0.110.13−0.12−0.06 0.500.450.840.58
Miercurea Ciuc0.520.09−0.100.00 0.320.380.620.42
Cluj-Napoca0.600.07−0.100.00 0.350.460.730.50
Baia Mare0.190.20−0.060.00 0.250.310.710.50
Sibiu0.620.12−0.060.00 0.320.410.680.50
Table 3. Changes (in °C) in daytime minimum and maximum temperature between historical (1871–1918) and current (1971–2020) periods in the Transylvania Region. Bold values indicate significant changes at the 0.05 significance level. Blank cells indicate no significant changes at the 0.05 significance level.
StationsChanges in Means
Daytime Minimum TemperatureDaytime Maximum Temperature
WinterSpringSummerAutumnWinterSpringSummerAutumn
1Arad2.241.53−0.08−0.531.380.690.000.16
2Bistrița1.450.351.751.442.850.300.400.71
3Miercurea Ciuc−0.66−1.92−0.580.180.790.05−0.42−0.41
4Cluj-Napoca3.181.090.482.091.170.51−1.010.60
5Baia Mare2.540.290.281.192.170.430.511.47
6Sibiu2.521.380.761.751.73−0.070.180.53
Spatial mean1.880.450.441.021.680.32−0.060.51
StationsChanges in Distributions
Daytime Minimum TemperatureDaytime Maximum Temperature
WinterSpringSummerAutumnWinterSpringSummerAutumn
1Arad sig.
2Bistrița sig. sig. sig.
3Miercurea Ciuc
4Cluj-Napocasig. sig. sig.
5Baia Maresig. sig.
6Sibiu sig.
Table 4. Trend (°C/decade) of daytime minimum and maximum temperature for historical (1871–1918) and current (1971–2020) periods in the Transylvania Region. Bold values indicate significant changes at the 0.05 significance level.
StationsSen’s Slope for Daytime Minimum Temperature
1871–19181970–2020
WinterSpringSummerAutumnWinterSpringSummerAutumn
Arad−0.360.58−0.11−0.58 0.170.570.530.57
Bistrița−0.660.28−0.28−0.60 1.040.830.820.25
Miercurea Ciuc0.160.33−0.09−0.22 0.131.140.930.43
Cluj-Napoca0.430.780.31−0.38 0.300.630.630.65
Baia Mare0.130.51−0.23−0.61 −0.210.480.630.15
Sibiu0.100.240.00−0.67 −0.620.850.560.73
StationsSen’s Slope for Daytime Maximum Temperature
1871–19181970–2020
WinterSpringSummerAutumnWinterSpringSummerAutumn
Arad0.370.000.040.13 0.450.410.780.50
Bistrița0.460.15−0.080.17 0.930.531.000.56
Miercurea Ciuc0.240.120.000.05 0.730.500.690.60
Cluj-Napoca0.370.00−0.190.14 0.560.650.910.76
Baia Mare0.240.040.060.25 0.580.540.870.50
Sibiu0.42−0.10−0.150.08 0.820.540.670.57
Table 5. Changes in precipitation in % (left) and changes in the probability distribution of precipitation (right) between historical (1871–1918) and current (1971–2020) periods in the Carpathian Region. Bold values and sig. indicate significant changes at the 0.05 significance level.
Changes in Precipitation (%)Changes in the Distribution
StationsWinter SpringSummerAutumnWinter SpringSummerAutumn
1Arad−7.2−11.24.3−15.5
2Bistrița20.35.2−3.7−1.5
3Miercurea Ciuc6.812.08.15.2 sig.
4Cluj-Napoca9.0−5.3−4.3−3.5
5Baia Mare−5.9−13.4−16.6−12.4
6Sibiu0.4−6.4−10.2−0.9
7Budapest−7.7−27.0−5.8−20.9 sig.
8Debrecen−4.0−7.8−5.1−20.3
9Pecs−10.2−28.7−6.5−25.2 sig. sig.
10Szeged−8.4−17.07.1−15.5
11Uzhhorod10.7−2.1−5.7−21.2 sig.
12Kosice−8.7−3.30.7−18.3
13Zagreb−0.1−19.20.3−3.3 sig.
Spatial mean−0.4−9.6−2.9−11.8
Table 6. Trend of precipitation (mm/decade) for historical (1871–1918) and current (1971–2020) periods in the Carpathian Region. +/− signs indicate significant changes at the 0.05 significance level.
StationsSen’s Slope for Precipitation
1871–1918 1970–2020
WinterSpringSummerAutumn WinterSpringSummerAutumn
Arad1.55−4.76−2.16−5.83 8.83−1.63−0.485.87
Bistrița9.17−7.45−0.88−5.00 9.597.00−9.25−0.90
Miercurea Ciuc2.12−0.13−2.062.86 2.622.691.291.16
Cluj-Napoca−2.110.003.92−6.92 5.076.77−1.607.46
Baia Mare13.24−5.00−11.38−9.52 10.508.02−12.207.42
Sibiu0.00−4.41−3.715.63 3.453.36−1.90−2.63
Budapest0.003.13−10.00−5.71 −2.37−5.093.114.31
Debrecen5.251.74−14.62−5.00 2.47−3.43−4.253.65
Pecs3.08−2.59−11.18−19.632.718.508.968.53
Szeged1.325.75−1.25−2.00 6.744.670.418.11
Uzhhorod12.00−0.38−7.50−11.70 2.95−3.63−22.6516.00
Kosice7.505.004.298.42 6.10−5.371.542.54
Zagreb−0.59−6.67−6.002.14 4.82−2.00−3.3817.84
Table 7. Comparison of trends of 24 h temperature (°C/decade) for historical (1871–1918) and current (1971–2020) periods calculated in this study (Ilona et al.) and from Izsak et al.’s [16] homogenized time series.
Data SeriesPeriodStationWinterSpringSummerAutumn
Ilona et al’ series1871–1918Budapest0.560.20−0.070.05
Izsak et al’ series1871–1918Budapest0.410.17−0.30−0.04
Ilona et al’ series1971–2020Budapest0.190.360.540.44
Izsak et al’ series1971–2020Budapest0.140.290.550.41
Ilona et al’ series1871–1918Szeged0.330.27−0.14−0.01
Izsak et al’ series1871–1918Szeged0.370.15−0.230.00
Ilona et al’ series1971–2020Szeged0.210.360.570.50
Izsak et al’ series1971–2020Szeged0.160.320.550.41
Publisher’s Note: MDPI stays neutral with regard to jurisdictional claims in published maps and institutional affiliations.

