Abstract
Fourier-transform infrared (FTIR) spectroscopy has been extensively used in plastic pollution research, since it has the advantages of great simplicity, rapidity, and low cost, being widely employed in the fingerprint identification of molecular composition and structure. The present study evaluates attenuated total reflection (ATR)–FTIR spectroscopy as a sensitive and effective assay for the identification of deoxyribonucleic acid (DNA) isolated from experimental animals. Various composite materials based on recycled polyethylene terephthalate (PET) as the main component, along with high-density polyethylene (HDPE), polypropylene (PP), and aluminum nanopowder obtained using an injection-molding machine, were used as substrate contaminants. The contamination was performed using quantified nucleic acid solution added in droplets to the clean, decontaminated samples, which were then dried and kept in a protective environment until the analysis. ATR–FTIR (with an FTIR spectrometer equipped with an ATR accessory) spectroscopy was used to analyze the bare composite materials’ substrates and the DNA-contaminated samples. To the best of our knowledge, the evaluation of PET packaging contamination with DNA species by FTIR has not been reported previously. This study demonstrated that FTIR spectroscopy could provide a rapid, sensitive, and reliable approach for screening of biochemical contaminants on composite materials based on recycled PET.
1. Introduction
Today, plastics and related products are intensely used, being considered an indispensable part of our modern society [1]. Their outstanding popularity is based on a series of features, such as great mechanical and chemical resistance, reduced weight and, very importantly, low cost [2]. Since the development of the first synthetic polymer in 1950, their manufacture has continuously increased to date, with a worldwide plastic production of almost 367 million tons in 2020 [3]—a quantity that is expected to double in the coming years [4]. Although their usefulness is undeniable, plastic-based pollution represents one of the most important threats to the environment, mainly due to reduced management of plastic waste [1].
Plastics, such as polyethylene terephthalate (PET), high- and low-density polyethylene (HDPE, LDHE), polypropylene (PP), polyvinyl chloride (PVC), polystyrene (PS), and polycarbonate (PC), are considered the most common, durable, and relatively cheap synthetic materials used in industry, reported to continually produce general municipal solid waste in Europe [5].
Among this variety of plastics, PET occupies an essential role in the packaging industry, mainly because of its durability and thermal stability [6].
However, these features come with an extremely high cost, with its existence causing a major environmental issue, since around 100 million plastic bottles are produced and discarded worldwide every day [7]. Fortunately, PET packaging is 100% recyclable. Globally, of approximately 30 million tons of plastic waste collected in 2020, more than one-third (34.6%) was sent for recycling, and 23.4% ended up in landfills [3,8]. Less than half of the plastic packaging waste was recycled in Europe in 2019, as announced by the European Environment Agency. Lithuania has the highest recycling rate of plastic waste (about 70%), while Malta is at the other end of the scale, with only 11% [9].
Currently, there are different methods generally used to manage PET pollution—namely, mechanical, thermal, and chemical-based treatments—leading to recycling of the material. In short, PET is gathered, sorted, washed, transformed into smaller pieces, decontaminated, and processed into PET pellets. These pellets can be used either in fully recycled content (100%) or as a blend of the recycled plastic with the virgin one (50/50) [10,11]. While mechanical recycling involves melting, chemical recycling is based on depolymerization. Chemical recycling is now used in many industrial and commercial applications, including food contact applications [12].
Before any recycled PET (rPET) is placed on the market, it goes through an authorization practice overseen by the European Food Safety Authority (EFSA), which ensures that the recycling process meets the required standards [13]. The main criterion is the cleaning efficiency of the PET recycling process, measuring the technical capability of the process to remove potential contaminants from recollected PET [14]. Any existing contaminant must be at acceptably low levels, whether it originates from the material in contact with the plastic article, the original plastics, or the recycling process itself.
In recent years, multiple recycling technologies have been developed for the decontamination of rPET bottles, so that the rPET can be safely reused. While chemical recycling seems safe in terms of decontamination, mechanical recycling has some limitations, as only the surface contents are removed [12,15]. In 2010, Mancini, et al. showed that chemically washed PET is cleaner than PET washed only with pure water [16]. A study conducted in Bangladesh showed that washing PET with hot water (at 90 °C) effectively removed contaminants from the rPET [17]. Recently, two new innovative methods—namely, steam stripping and polyethylene glycol (PEG) extraction—have been studied to remove contaminants such as volatile organic compounds from post-consumer recycled HDPE. The obtained results showed that these methodologies reduced the contaminants in rHDPE by 70% [18].
Although recycling methods are constantly developing, and there are well-established EFSA regulations regarding the quality of rPET, additional tests should be carried out prior to application of rPET in food packaging or the pharmaceutical industry. These tests should generally include the identification of possible contaminants in post-consumer PET recyclates. According to the available data from the literature, different analytical methods have been applied to quantify surrogate contaminants—such as toluene, chlorobenzene, phenol, limonene, and benzophenone—in contaminated and recycled PET. Direct solid-phase microextraction in headspace mode coupled with gas chromatography–mass spectrometry (GC–MS) represents the most common technique to determine the concentration of all surrogates in the contaminated PET flakes, as presented by Felix, et al. [19]. However, this efficient approach requires multiple steps and total dissolution of PET samples; therefore, there is a need for a cost-effective and environmentally friendly method to evaluate the contamination of plastic samples. FTIR spectroscopy is considered a relatively cost-effective, simple, and precise analytical technique for the identification of chemical bonds in different molecules. An FTIR spectrometer generates the infrared spectrum of emission or absorption of a solid, liquid, or gas based on interaction of the chemical bond from the sample with the radiation of a light source [20].
In this context, the main aim of this paper is to evaluate the potential of FTIR spectroscopy for the identification of contaminants on a composite substrate, based on recycled PET as the main component, along with PP or HDPE (two other common plastics) and Al nanopowder. To the best of our knowledge, the evaluation of contamination of PET packaging with DNA species by FTIR has not been reported previously.
2. Materials and Methods
2.1. Materials
For the preparation of the composite materials, we used recycled PET (obtained from ALL GREEN SRL, Iasi, Romania), PP (pellets, melt mass-flow rate (MFR) at 230 °C/2.16 kg: 8.0 g/10 min, Tipelin H 318, MOL Petrochemicals Co. Ltd., Tiszaújvaáros, Hungary), HDPE (pellets, MFR at 190 °C/2.16 kg: 6.5 g/10 min, 71% crystallinity grade, Tipelin 1100J, MOL Petrochemicals Co. Ltd., Tiszaújvaáros, Hungary), and aluminum (Al) nanopowder, 800 nm (purity: 99.995%, specific surface area: 15–20 m2/g, Nanografi Ltd. STI, Ankara, Turkey). Additionally, the Wizard® SV Genomic DNA Purification System (Promega, Madison, WI, USA) was used for DNA isolation and purification from rat muscle and rat tumor cells, while ethidium bromide solution (10 mg/mL in water, Roth, Germany) was used to highlight the presence of DNA contamination on the substrate surfaces.
2.2. Recycled PET Composites’ Development and Characterization
2.2.1. Development
An injection-molding machine (Dr. Boy, Neustadt, Wied, Germany) was used to obtain recycled PET composite materials. The main component of all of the materials was PET (100 or 70%), mixed with or without with PP/HDPE (30%) and 5% Al nanopowder (wt% relative to the whole quantity of dried substance) as a reinforcing material. The processing temperature regimes used in the manufacturing process are shown in Table 1.

Table 1.
Processing temperature regimes.
2.2.2. Hydrostatic Density and Determination of the Effects of Immersion in Water
Hydrostatic density (HD) was measured using a Mettler Toledo™ analytical balance with density kit (Columbus, OH, USA). Each value represents the mean HD ± standard deviation of three independent measurements.
The effects of the materials’ immersion in water were studied according to ISO 175/2010, which provides the methods used to study the behavior of all solid plastic materials (obtained via different techniques in various shapes with a thickness greater than 0.1 mm) completely immersed in different liquid chemicals, as well as the methods used to determine the features observed [21]. The swelling capacity of polymers—one of the features mentioned in the standard—is determined by the amount of liquid that the material can absorb after complete immersion. For this study, water was chosen as the liquid medium, because it is the universal solvent for packaging materials. Around 85 mg of each material was immersed in deionized water and maintained at 22 °C and 41% humidity for a long period—the shortest time was 7 days (168 h), while the longest was 50 days (1200 h). The immersed samples were weighed and the swelling degree (Q (%)) was calculated using the following equation:
where x1 is the initial weight of the sample, and x2 is the weight of the swelled sample.
2.2.3. Morphology and Thermal Features
The morphology of the materials was studied using a scanning electron microscope (SEM) with a field-emission source and focused ion beam (Zeiss, White Plains, NY, USA). The analysis was performed at an accelerating voltage of 1 or 2 kV. Micrographs displaying the morphology and topography of the material surfaces were obtained with an Everhart–Thornley-type secondary electron detector with a Faraday cage.
Simultaneous thermal analysis with thermogravimetry (TG) and differential scanning calorimetry (DSC) (STA 449 F3 Jupiter, Netzsch, Germany) was used to study the thermal features of the materials. The measurements were performed in a nitrogen atmosphere, at a temperature between 25 °C and 300 °C, with a heating speed of 10 K/min and an aluminum crucible as a reference substance.
2.3. DNA Identification on Recycled PET Composites
DNA isolated and purified from rat muscle and rat tumor cells was added in droplets to clean, decontaminated samples and incubated at 37 °C (PHMP Thermoshaker, Grant Instruments, Cambridge Ltd., Royston, UK) for 2 h. The use of rat organs was approved by the Ethical Committee of Grigore T. Popa University of Medicine and Pharmacy of Iasi, Romania, and was carried out in accordance with the European guidelines on the protection of animals used for scientific purposes, and with authorization of the National Sanitary Veterinary and Food Safety Authority (no. 19/09.04.2020). The Wizard® SV Genomic DNA Purification System was used for DNA isolation, and a NanoDrop™ One/OneC Microvolume UV–Vis Spectrophotometer (Thermo Scientific™, Waltham, Massachusetts, USA) was used for DNA quantification.
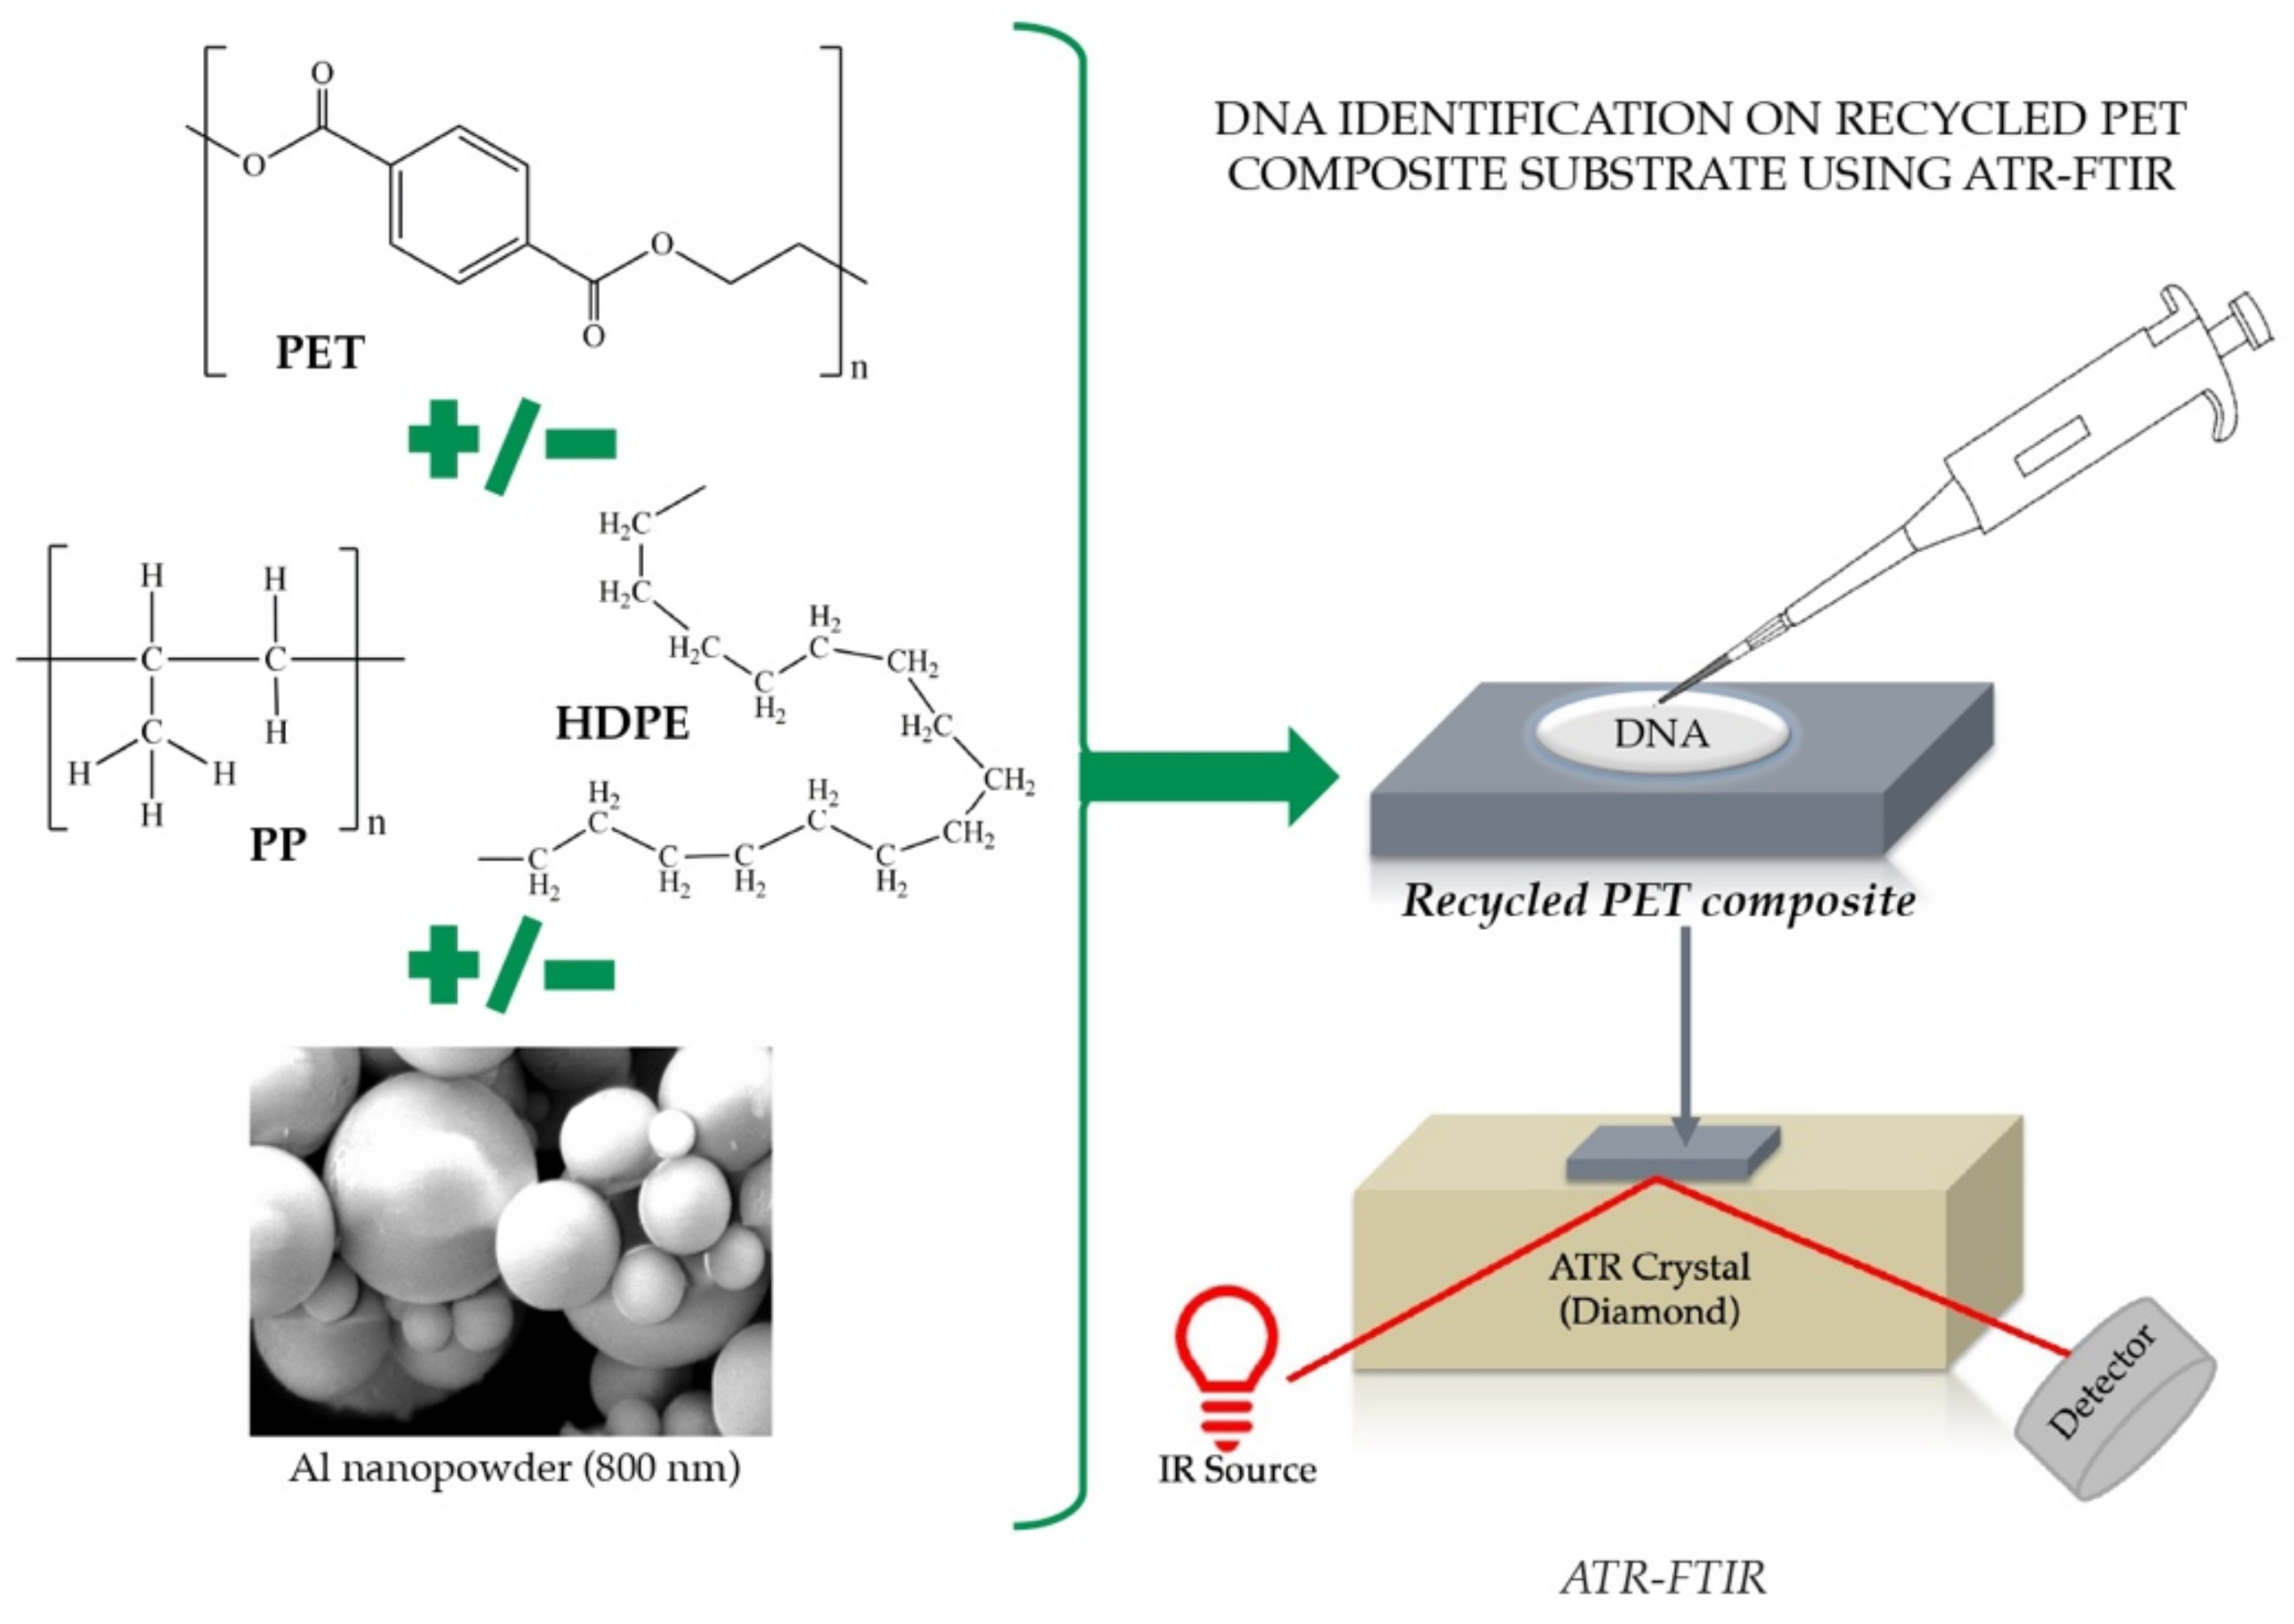
ATR–FTIR (Nicolet Summit Pro FTIR Spectrometer with Everest ATR accessory, Thermo Scientific™, Waltham, MA, USA) was used to analyze the isolated DNA solutions (by placing a thin film of 5 µL of eluted DNA on the diamond crystal), the bare materials, and those contaminated with DNA after 2 h of incubation; the workflow is shown in Figure 1. To the best of our knowledge, the evaluation of PET packaging contamination with DNA species by FTIR has not been reported previously. The ATR–FTIR spectra for all samples were collected in the range from 4000 to 400 cm−1, with a 4 cm−1 resolution and 16 scans.

Figure 1.
DNA identification on recycled PET composites—workflow.
Moreover, to highlight the results obtained by ATR–FTIR, 0.5 µg/mL ethidium bromide was added to each contaminated material, incubated for 30 min at 37 °C (using the same thermoshaker), and analyzed using an Olympus CX41 Phase Contrast Polarized Light Microscope and a UVP GelSolo Transilluminator (Analytik Jena AG, Germany).
3. Results and Discussions
3.1. Recycled PET Composites’ Development and Characterization
With a significant number of scientific, technical, and common industrial applications, polymers are part of our everyday routines [22]. According to Gomiero, et al. [23], PET, PP, and HDPE are 3 of the 15 most common polymers found in the environment. Their main applications are bottles and gear clothing for PET, rope and bottle caps for PP, and plastic bags, bottles, clothing, and cages for HDPE. In this study, six different materials—based on the above-mentioned polymers, along with Al nanopowder as a reinforcing material—were prepared using an injection-molding machine, their codification and composition being listed in Table 2, together with two basic properties: hydrostatic density (HD) and swelling degree (Q).
Table 2.
Composition, hydrostatic density, and swelling degree of recycled PET composites.
The polymers had different density values: 0.96–1.45 g/cm3 for PET, 0.02–0.83 g/cm3 for PP, and 0.94–0.98 g/cm3 for HDPE; these values are comparable with those obtained for recycled PET composites, as shown in Table 2. The highest HD of the polymer mixtures (M1_4, M6_4, M11_4) without Al nanopowder was obtained for PET alone [23].
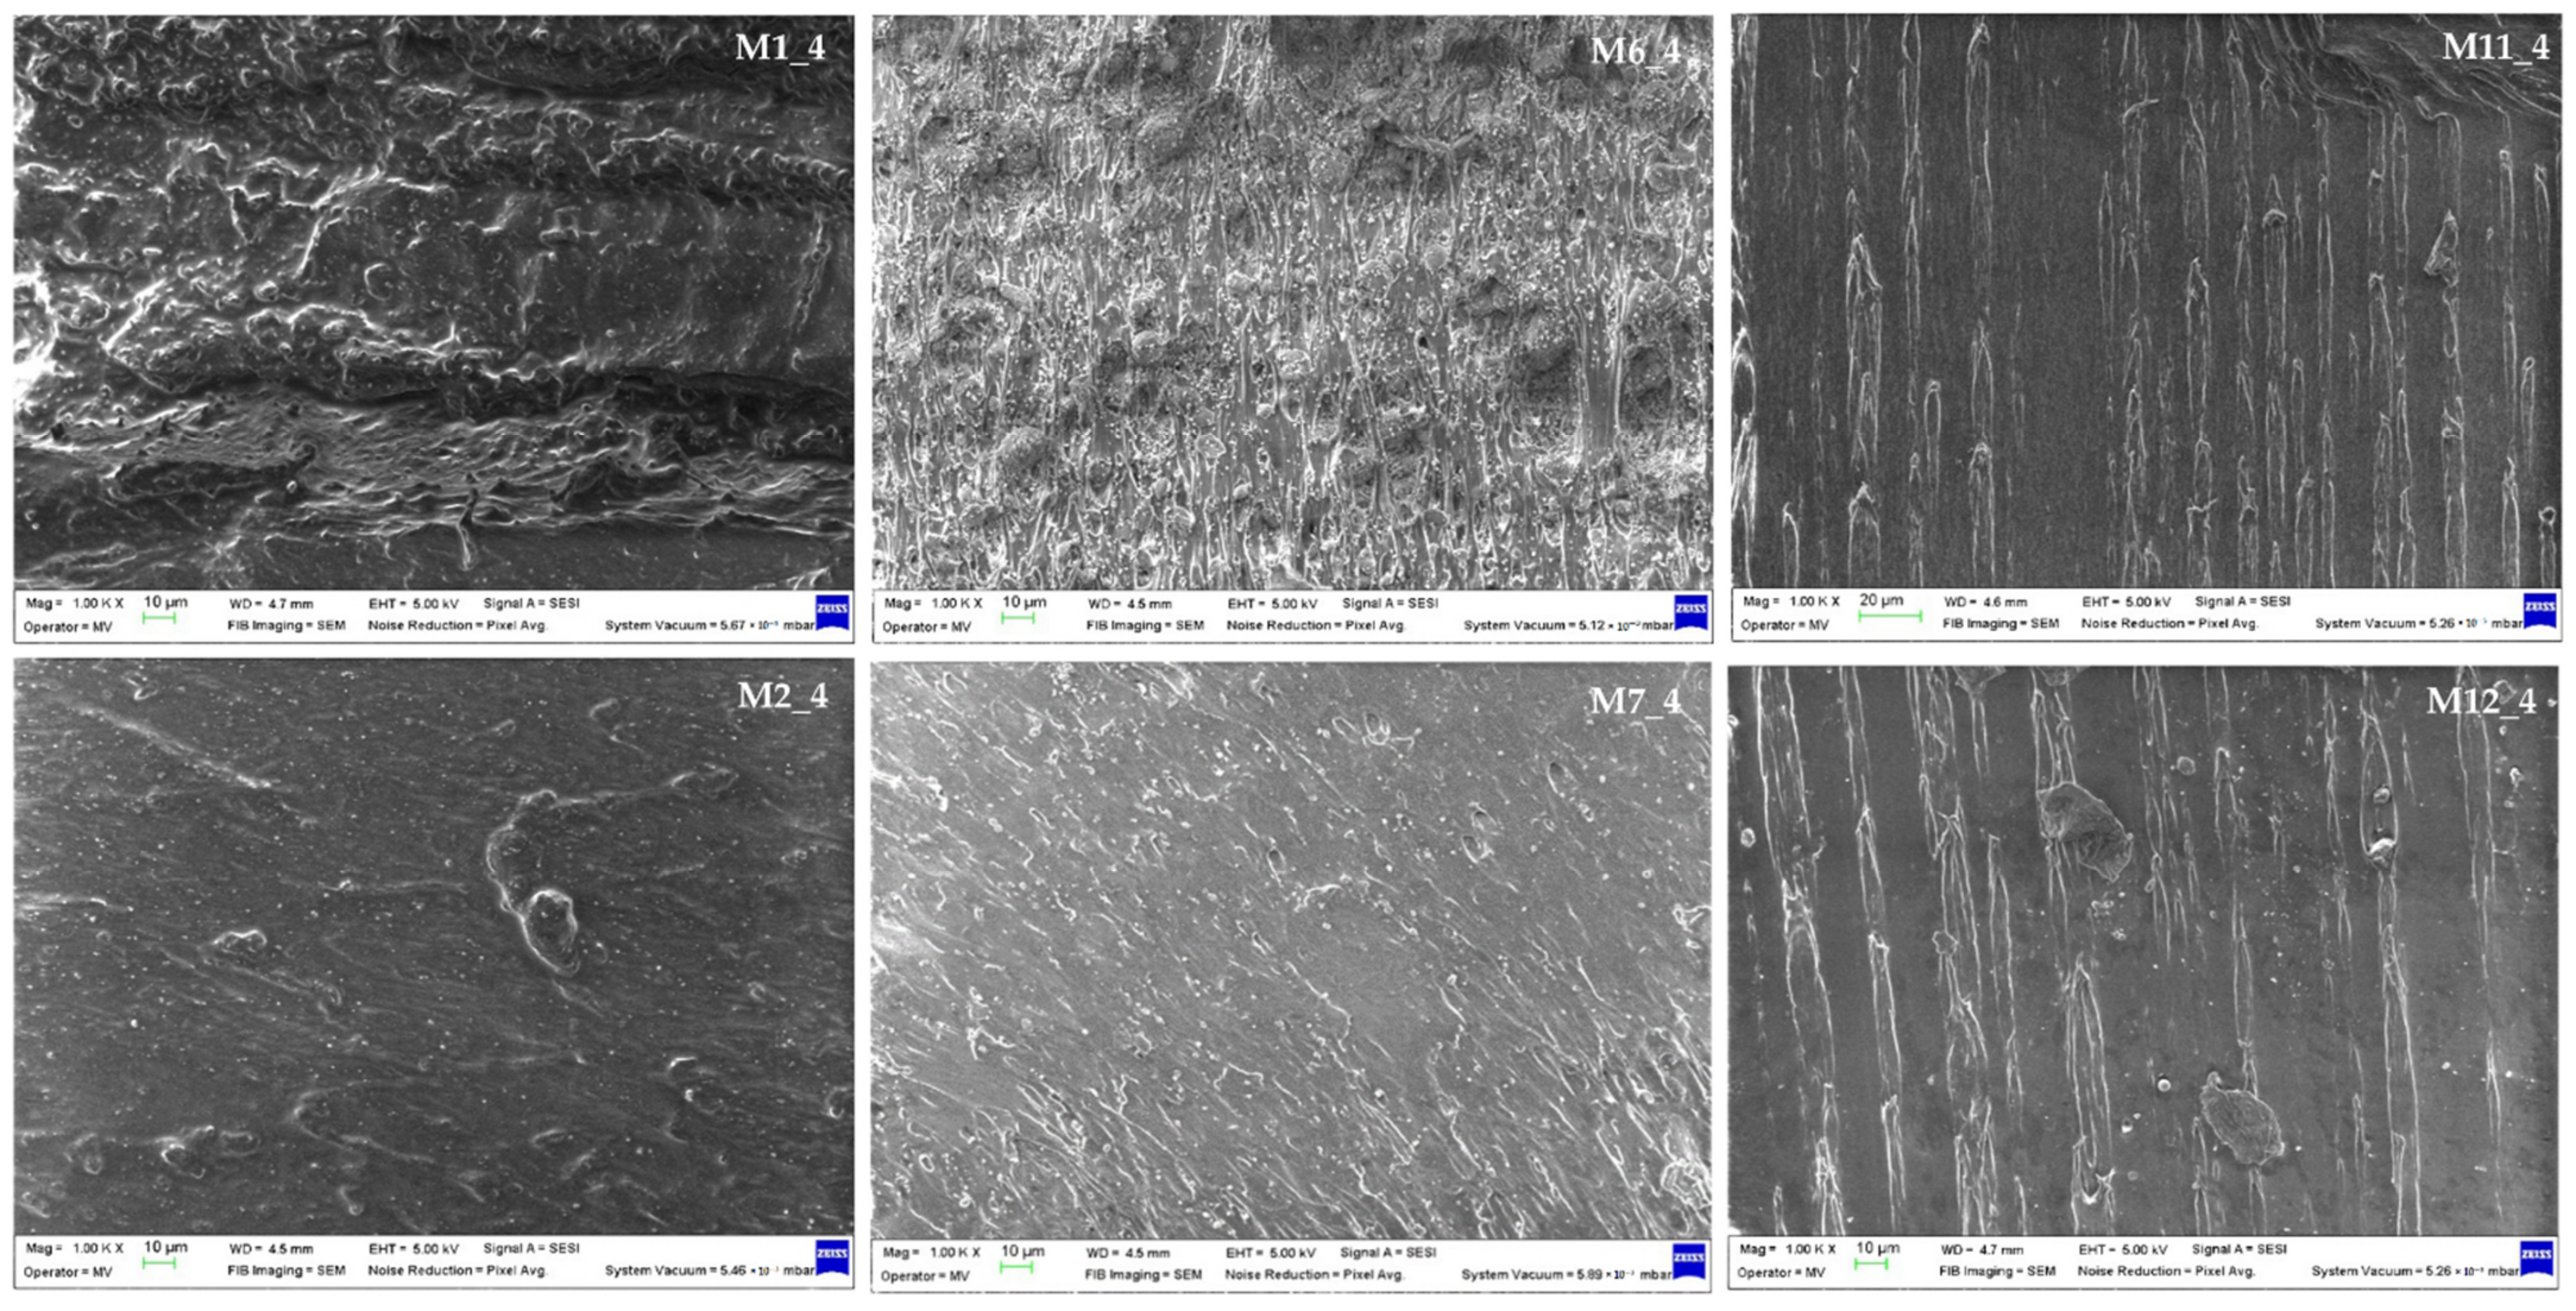
The structure of semicrystalline polymers has two phases: thin lamellar crystal layers, and disordered amorphous layers. The amorphous phase is composed of entanglements retained during the crystallization process [24]. Crystallinity is a key property of synthetic polymers, as it is strongly related to their mechanical properties, degradation, and behavior in liquid chemicals. PET, PP, and HDPE are all semicrystalline polymers, with PP and HDPE having 50% crystallinity, while the crystallinity of PET is between 0 and 50%, e.g., for PET beverage bottles it is higher than 30% [25]. The small values obtained for all of the materials, even at 50 days of complete immersion, can be explained by the hydrophobic character of the three polymers, attributed to their semicrystallinity, as also observed in other studies [26,27]. The values increased over time, as a consequence of the changes in the surface wettability of the polymeric materials immersed in an aqueous medium for an extended period [28]. As can be seen in Table 2, the highest values were obtained for the materials containing Al nanopowder, which created voids in the manufacturing process, facilitating the penetration of water molecules into the materials’ structure [28]. Q values can also be correlated with the morphology of the materials, as shown in Figure 2, where we can observe a compact structure without cracks, and Al nanoparticles distributed in the synthetic polymer matrix.

Figure 2.
Materials’ morphology.
In Table 3 are the values obtained from the transformation processes (glass transition, crystallization, and melting) that resulted from the analysis of the DSC variation curves (Figure 3), as a function of temperature.
Table 3.
Thermal behavior and characteristics.
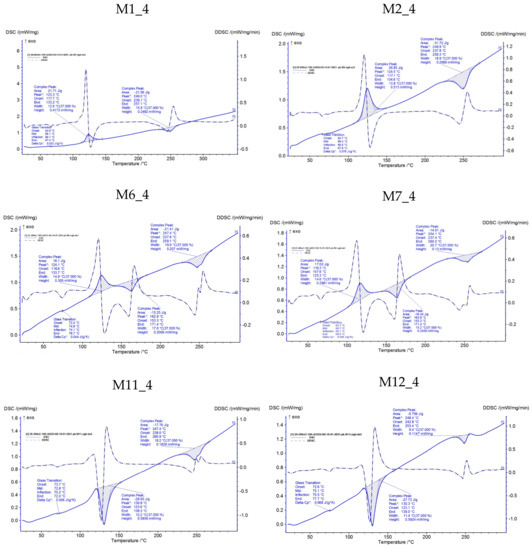
Figure 3.
Thermal behavior and characteristics.
Following the thermal analysis, it was found that all of the studied composite materials can be used at up to 300 °C without mass loss. All of the materials underwent a vitreous transition process (second-order phase transition) where the rubber state changed to a glassy, solid state, the initial transformation temperature being in the range of 64.7–74 °C. This process occurred due to the presence of amorphous areas in the analyzed samples. For the materials M11_4 and M12_4, we could only observe the existence of a glass transition thermal process and two melting processes. The crystallinity phase was missing, along with data correlated with the fact that the two polymer pairs are thermodynamically immiscible [29].
3.2. DNA Identification on Recycled PET Composites
As a noninvasive optical technique, FTIR has already been used for the identification of DNA structure and composition from eukaryotic and prokaryotic cells [30], microbial pathogens [31], cattle, sheep, fish, and swine [32]. In this paper, for the substrate contamination, the authors used isolated DNA from rat muscle and tumor tissues, with a concentration of 90.5 ng/mL and 313 ng/mL, respectively, as determined by UV–Vis.
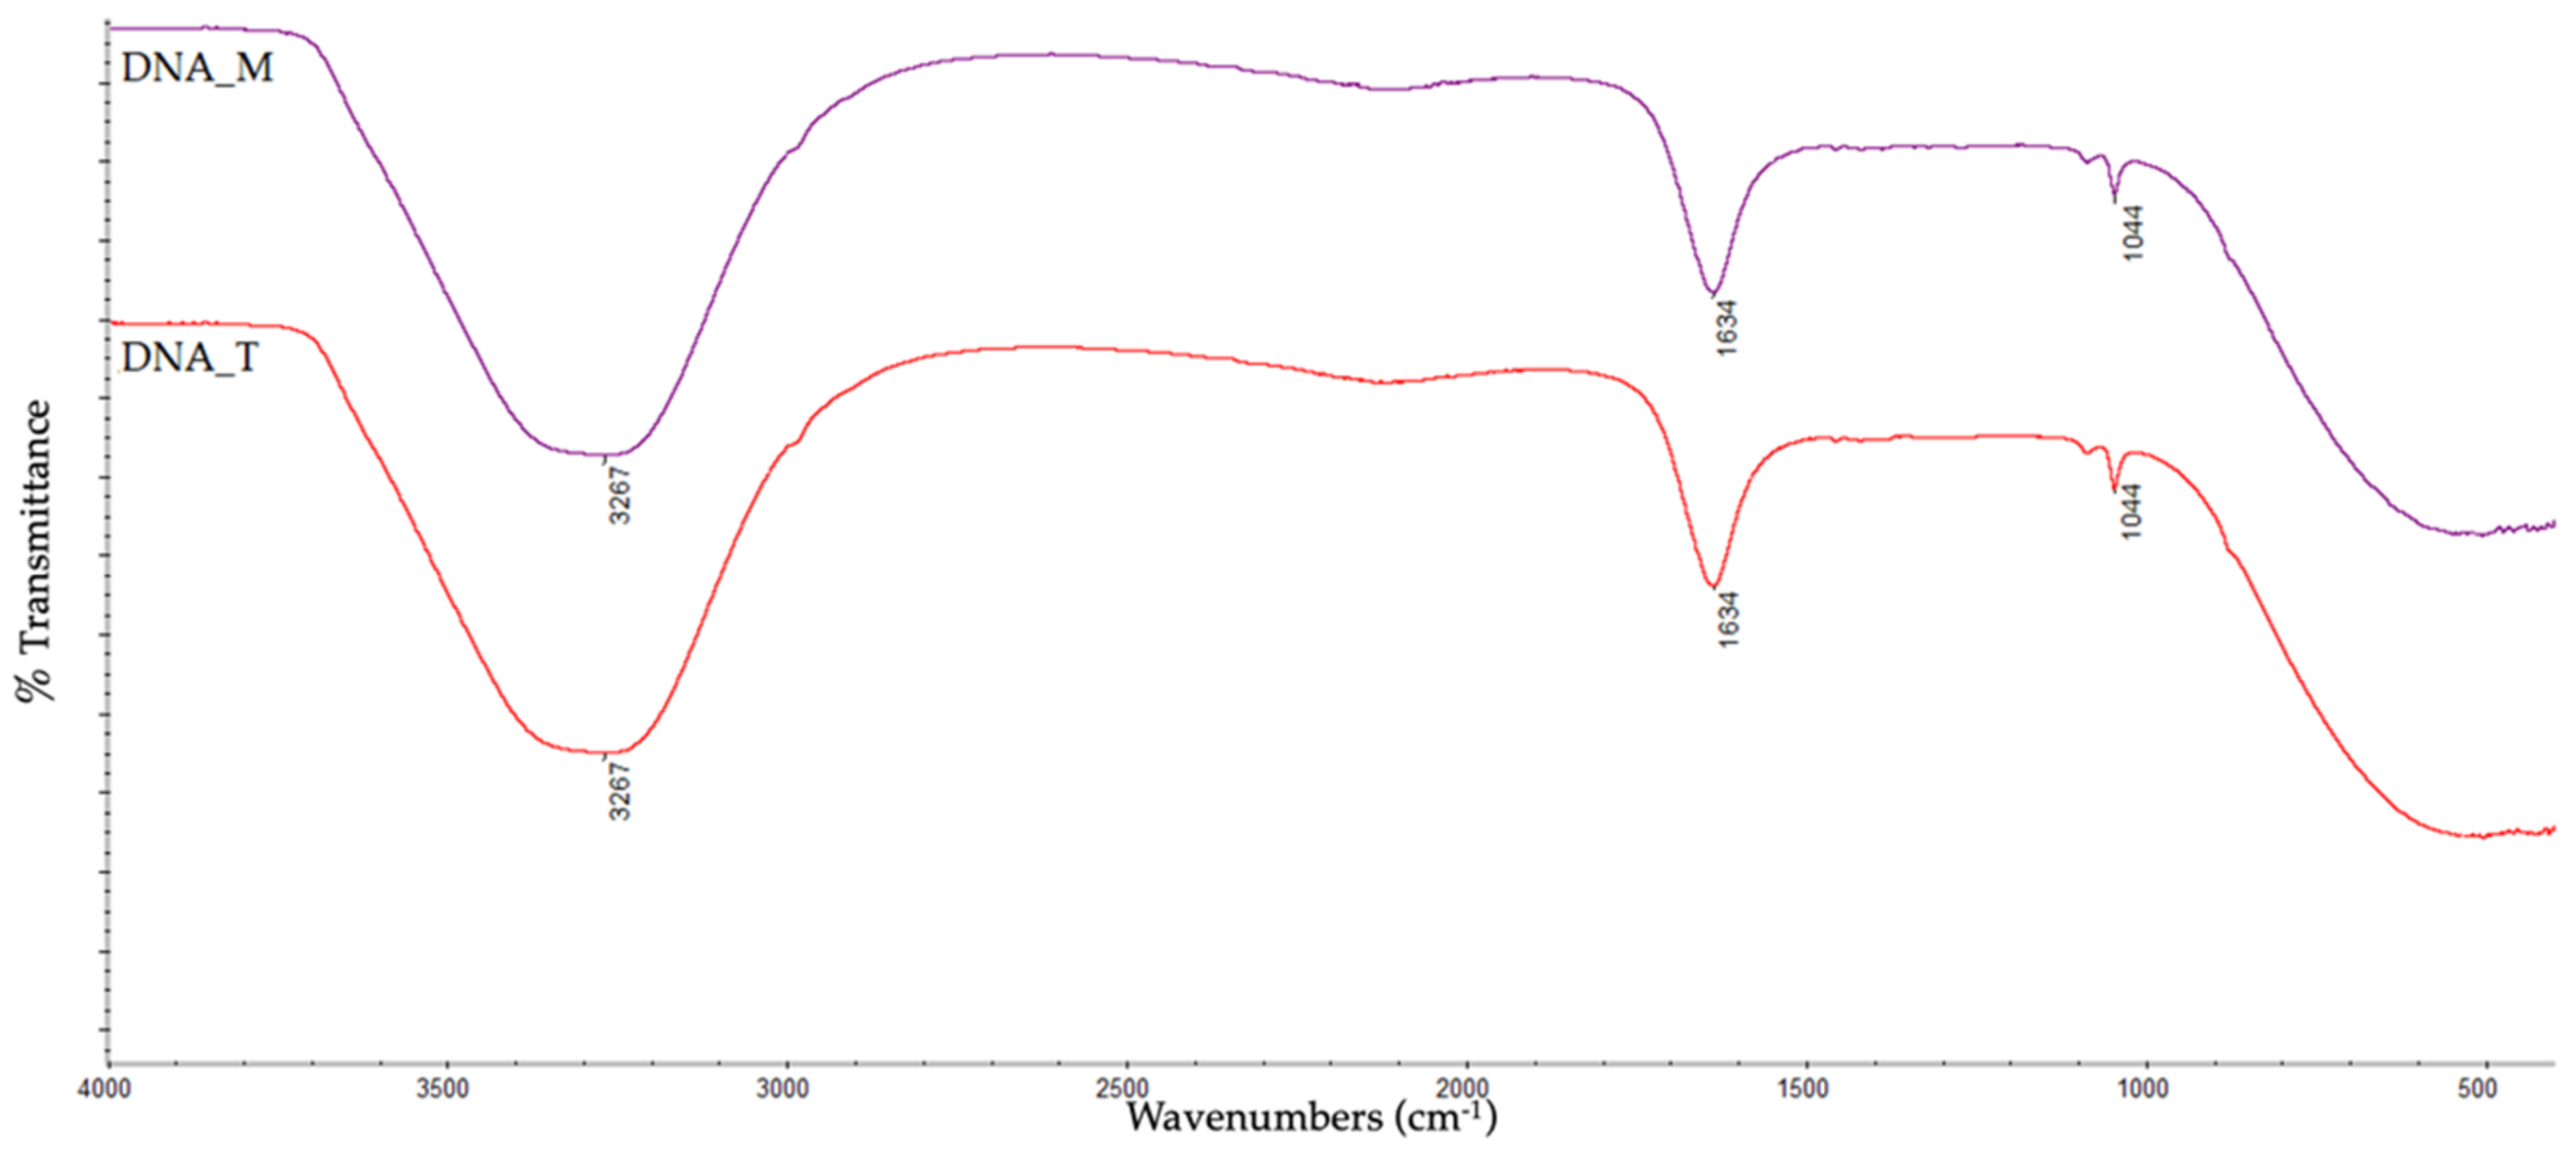
The rat DNA samples (DNA_M represents DNA isolated from muscle, while DNA_T represents DNA from tumor cells) exhibited an identical infrared spectral signature (Figure 4). As expected, the main vibrational bands specific to the molecular structure of DNA in solution were found in three different regions—namely, 3267 cm−1, attributed to the stretching vibrations of the OH and NH bonds of the amino acid; 1634 cm−1, assigned to C=C thymine, adenine vibrations, and N−H from guanine (the region of base vibrations) [33]; and 1044 cm−1, ascribed to the C−O deoxyribose stretching [30].
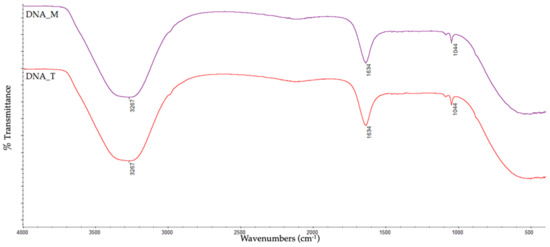
Figure 4.
ATR–IR spectra for isolated DNA from experimental animals.
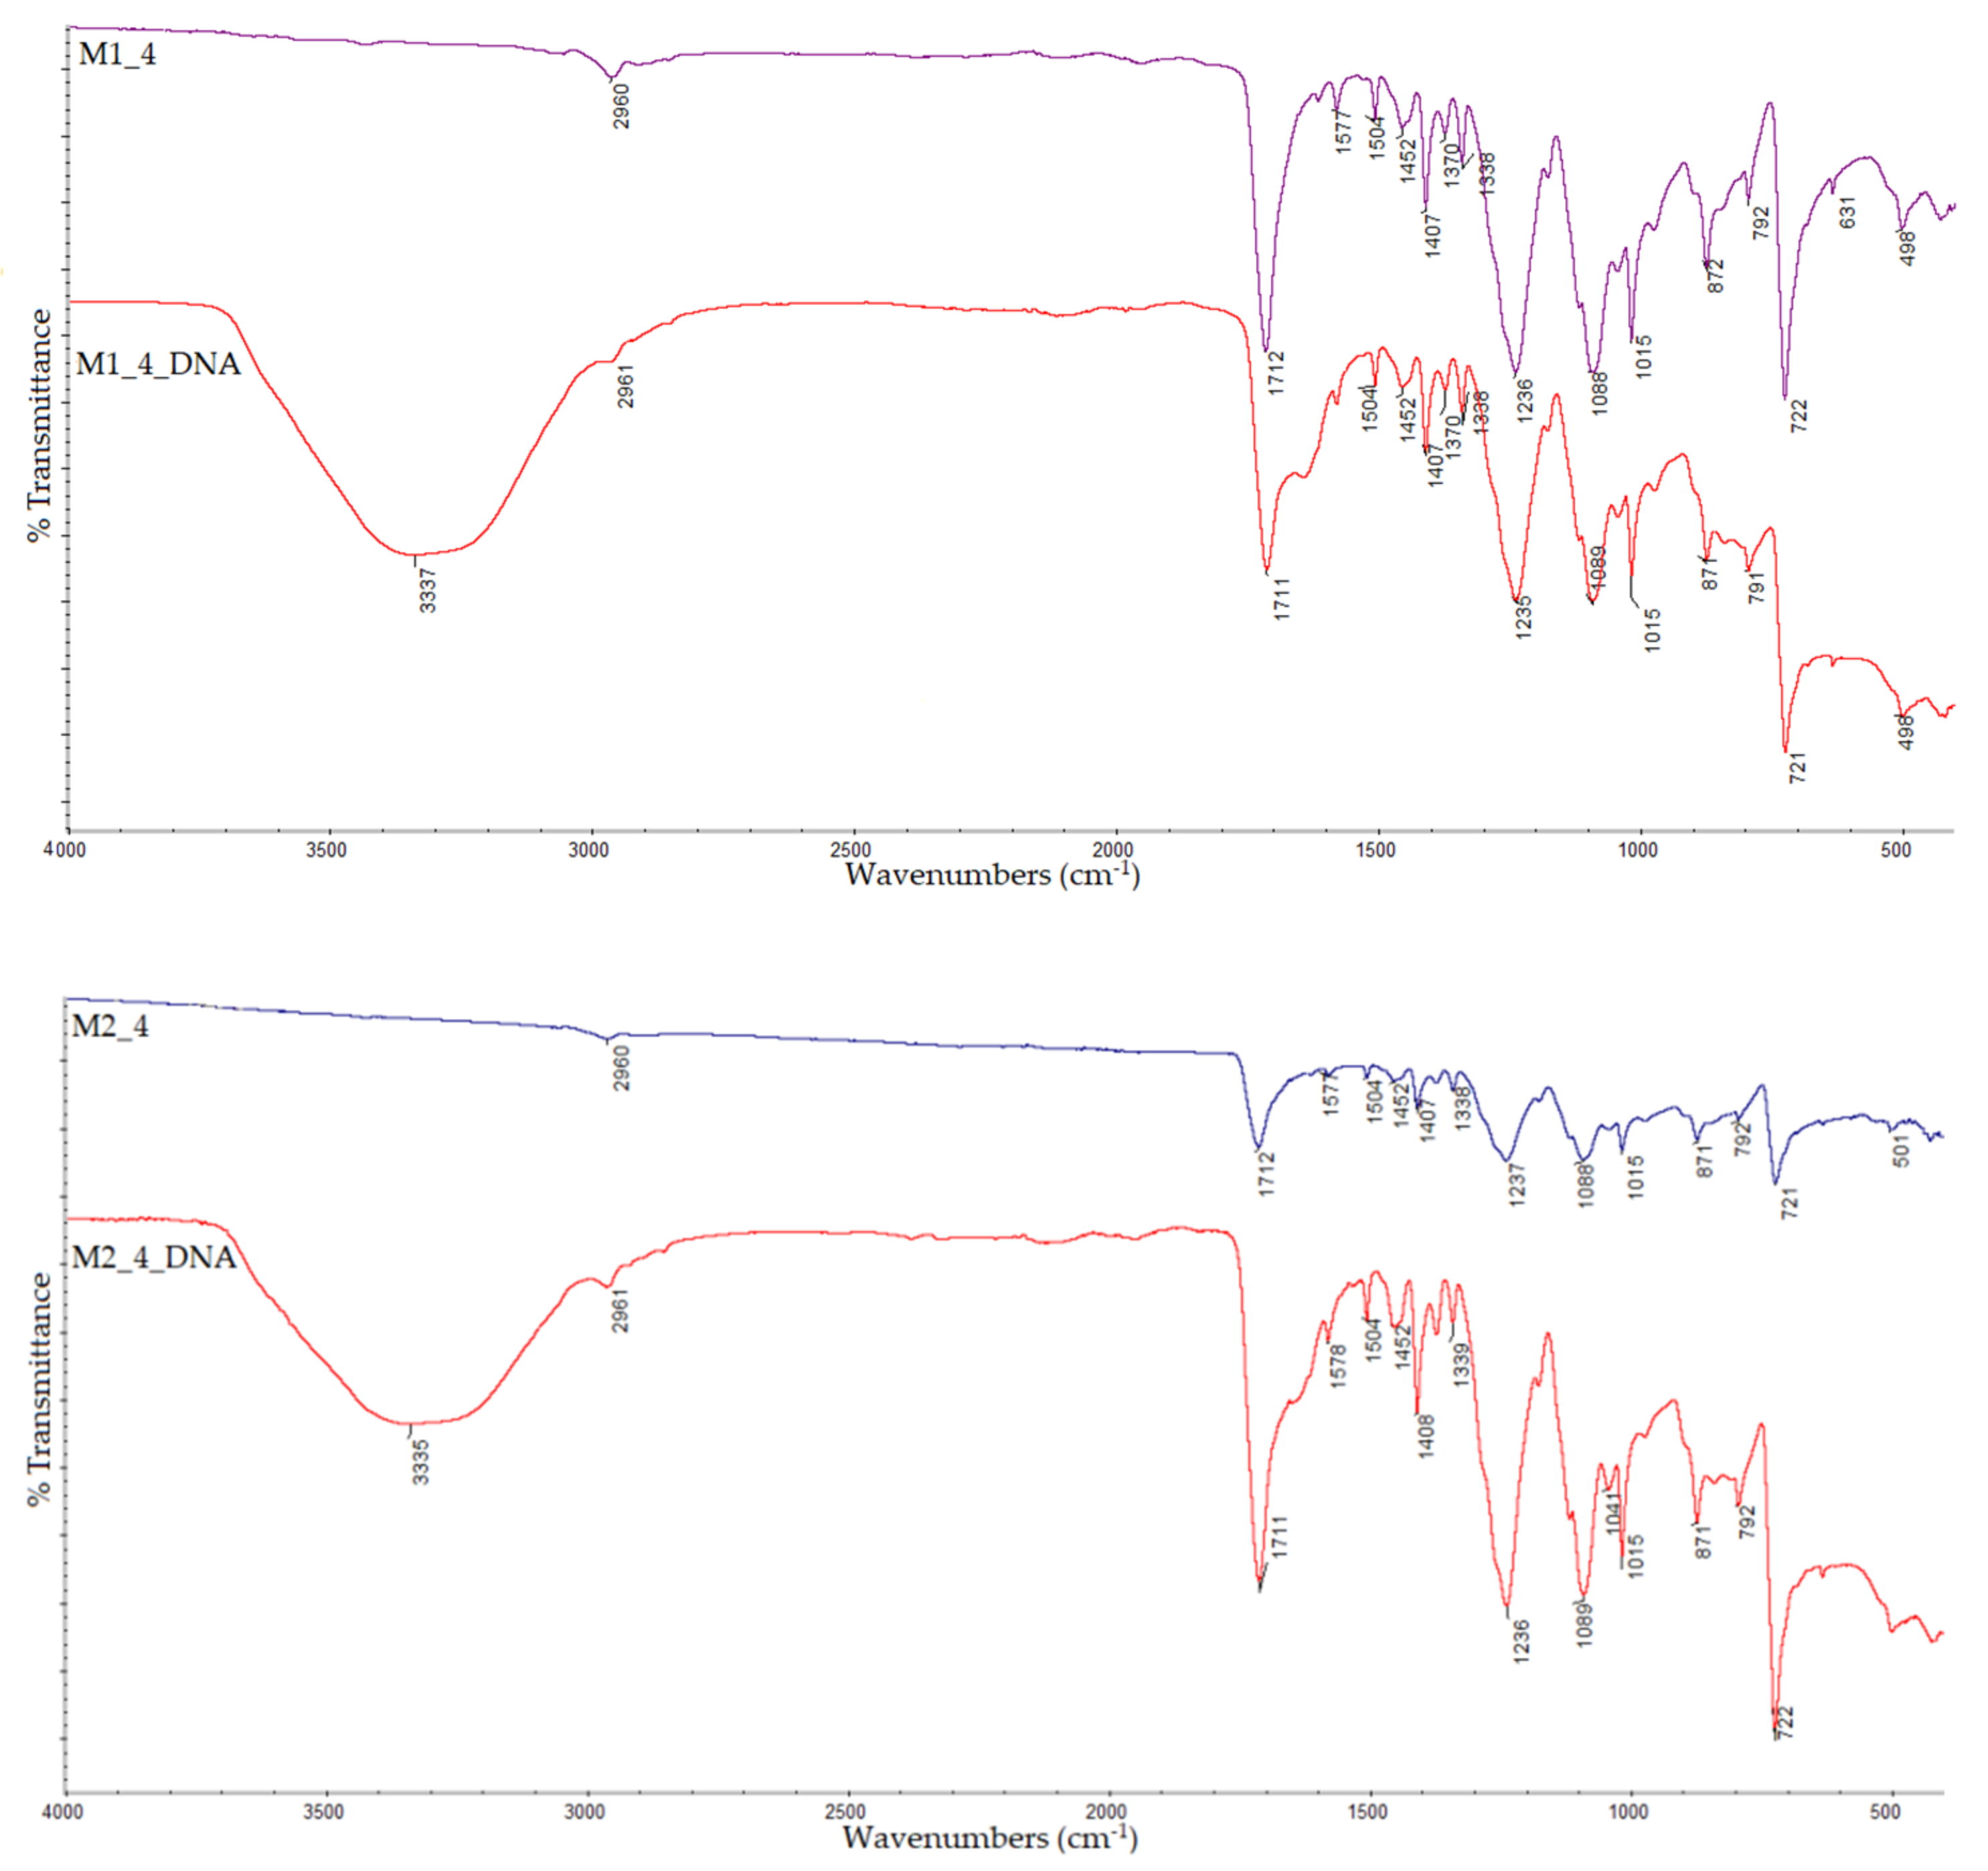
The ATR spectrum of bare PET substrate (sample M1_4) is shown in Figure 5, and the absorption bands are assigned according to the main available groups. Specifically, the 2960 cm−1 band was attributed to the aliphatic C–H symmetrical bond stretching, 1712 cm−1 to the ester carbonyl bond stretching, 1407 cm−1 for stretching of the C−O group deformation of the O-H group, 1236 cm−1 for the terephthalate group, 1088 cm−1 to the methylene group, 1015 cm−1 to the vibrations of the ester C−O bond, 872 cm−1 for the present aromatic rings, and 722 cm−1 to the polar ester groups’ interactions with benzene rings. These bands are in agreement with the FTIR spectra of PET obtained by Pereira, et al. [34], Edge, et al. [35], and Silverstein and Webster [36].
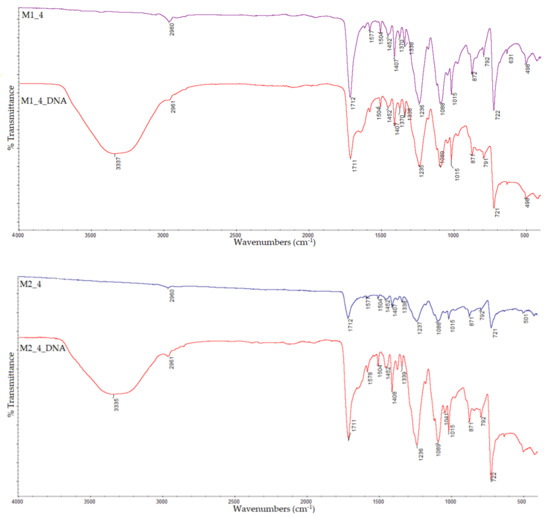
Figure 5.
ATR–IR spectra of the bare PET sample (M1_4), Al nanopowder PET sample (M2_4), and DNA−contaminated samples (M1_4_DNA and M2_4_DNA).
As observed in Table 2, all samples (M2_4, M6_4, M7_4, M11_4, and M12_4) contained PET in their composition; therefore, the specific absorption bands, as seen in Figure 5, Figure 6 and Figure 7, were present in all ATR spectra.
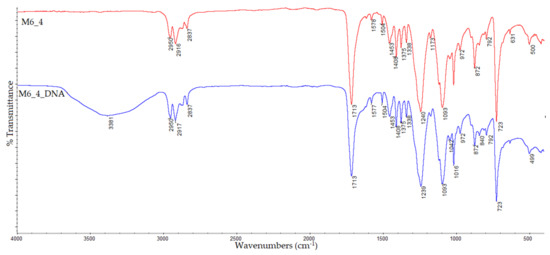
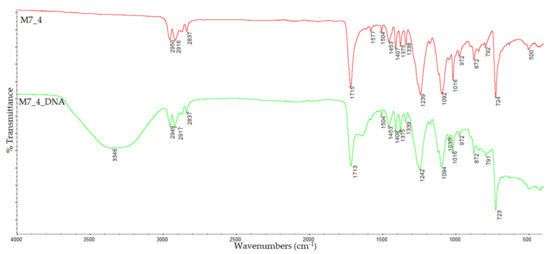
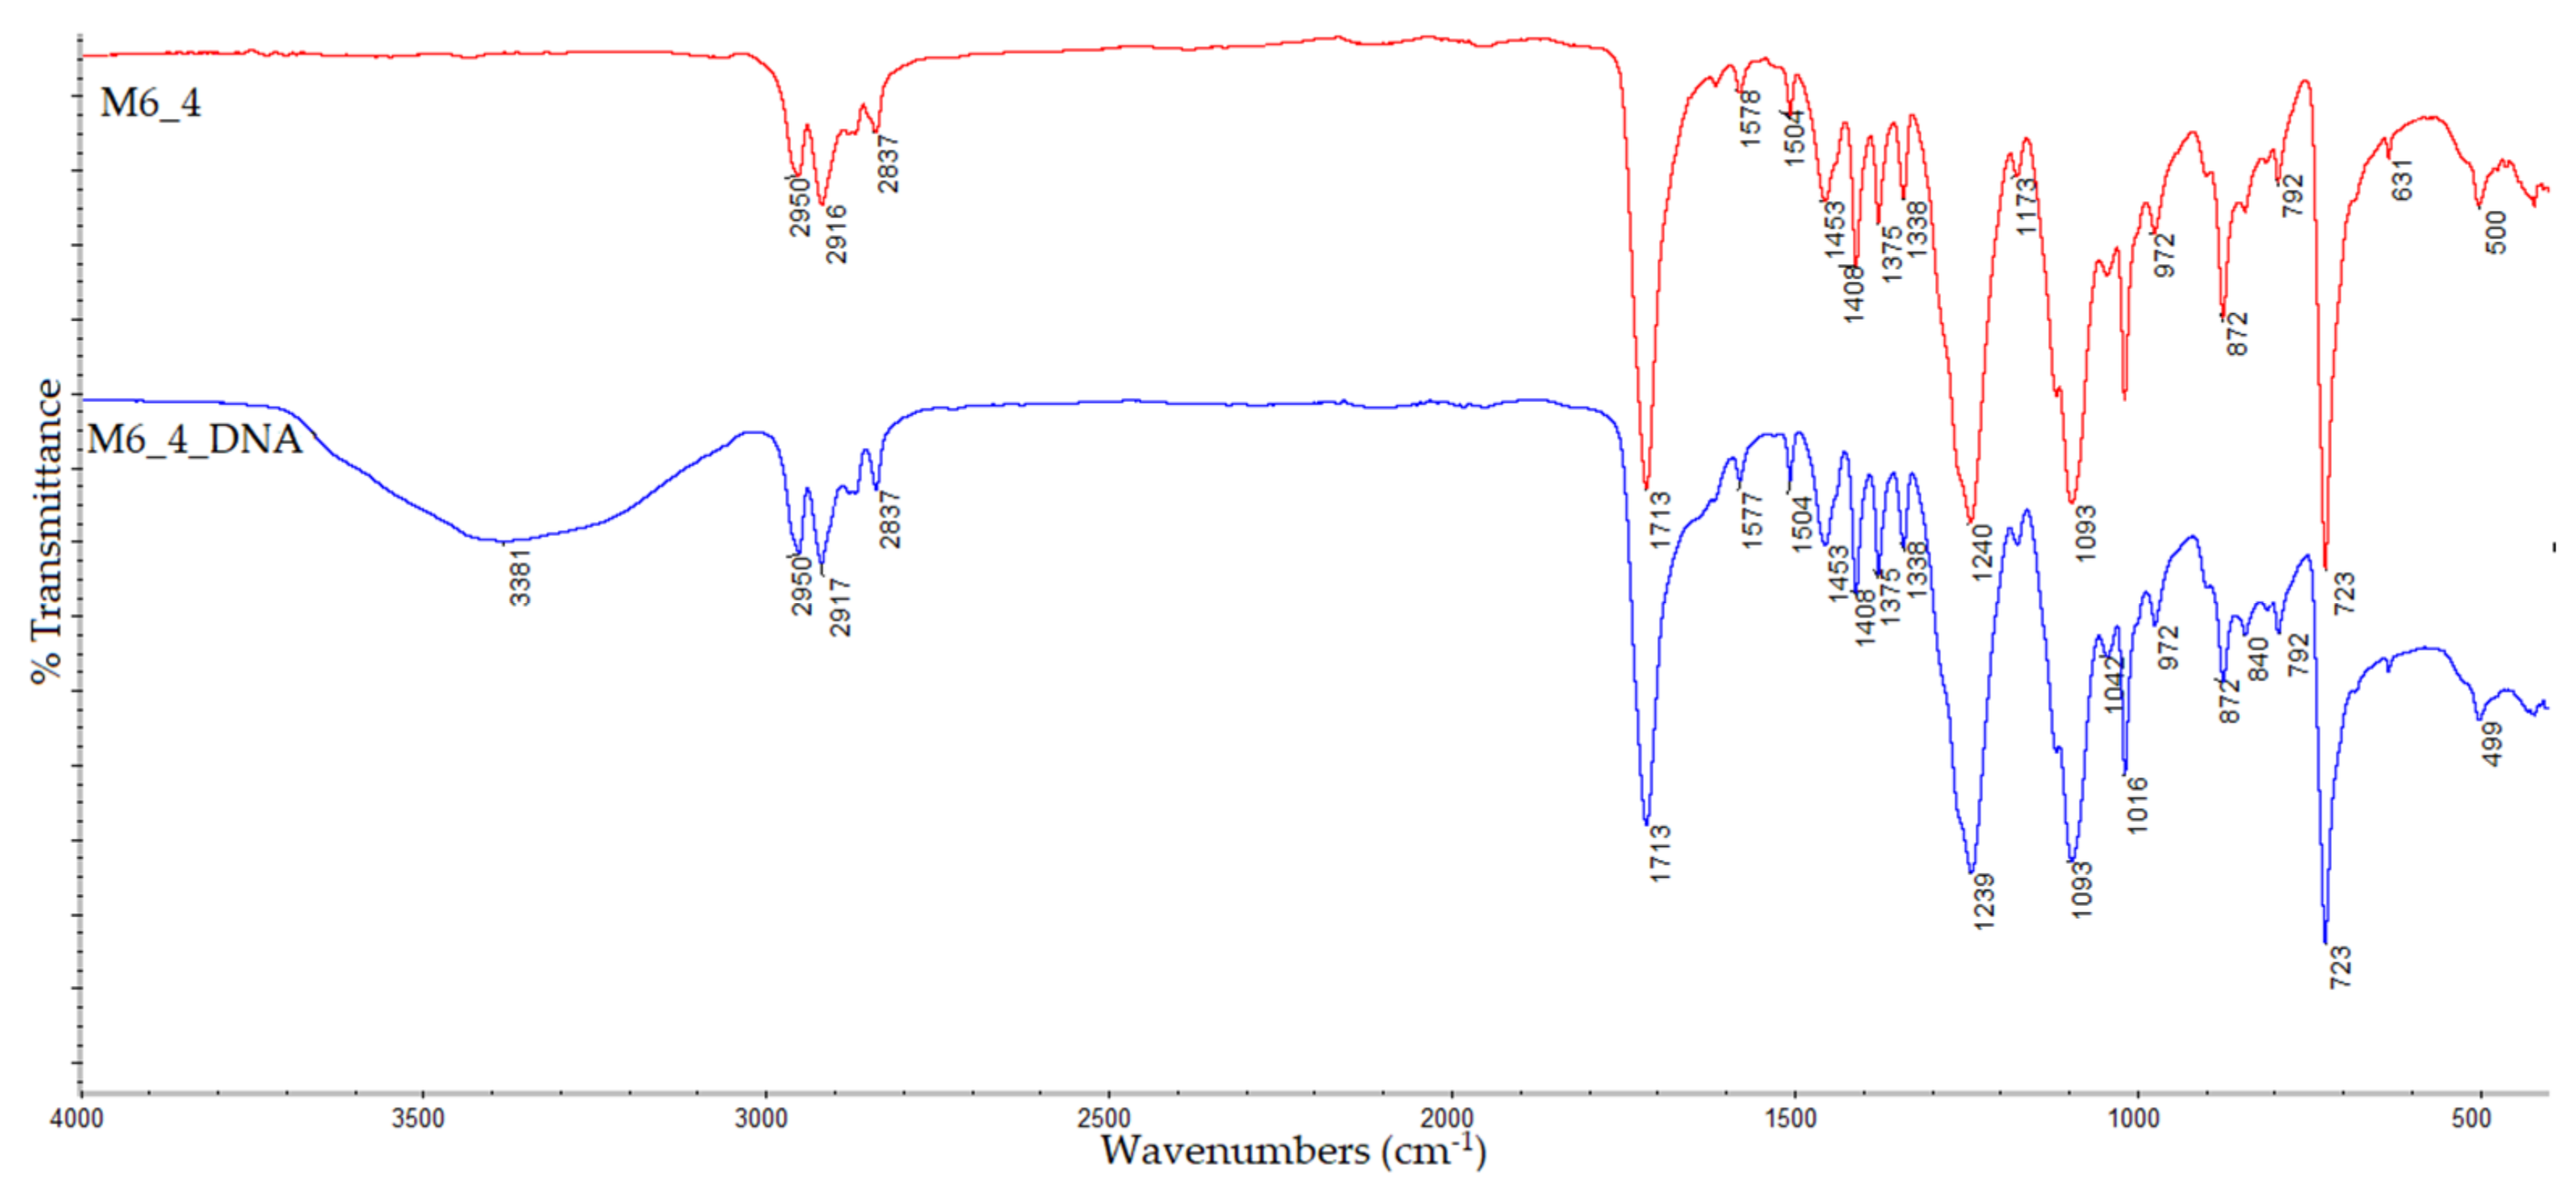
Figure 6.
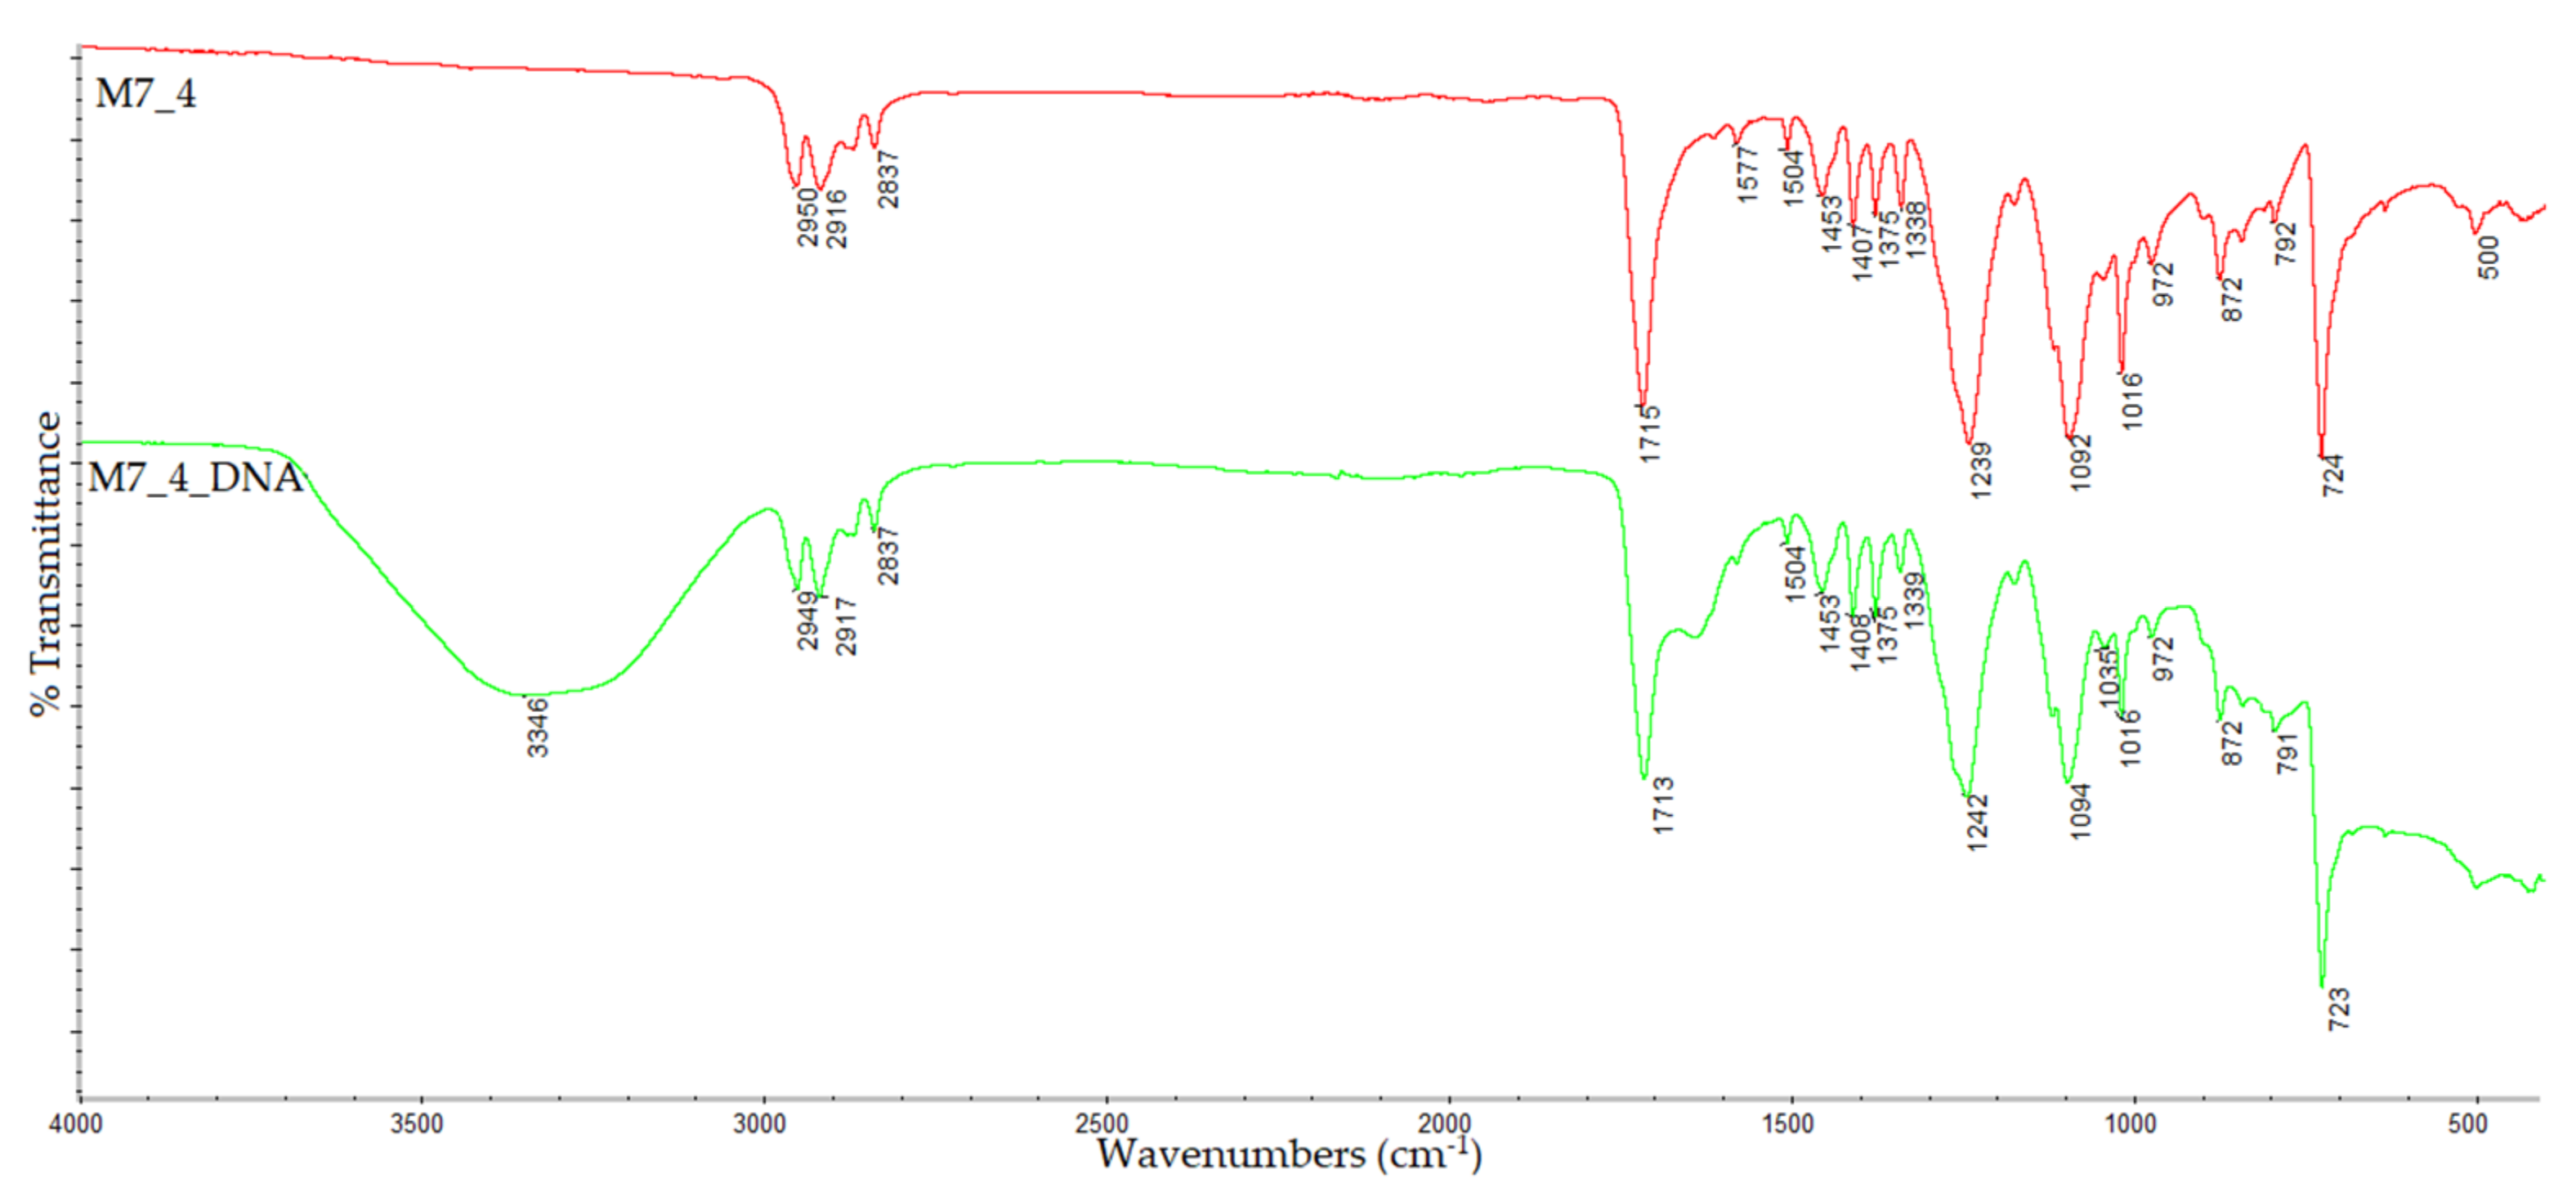
ATR–IR spectra of the bare PET and PP blended sample (M6_4), Al nanopowder PET and PP blended sample (M7_4), and DNA−contaminated samples (M6_4_DNA and M7_4_DNA).
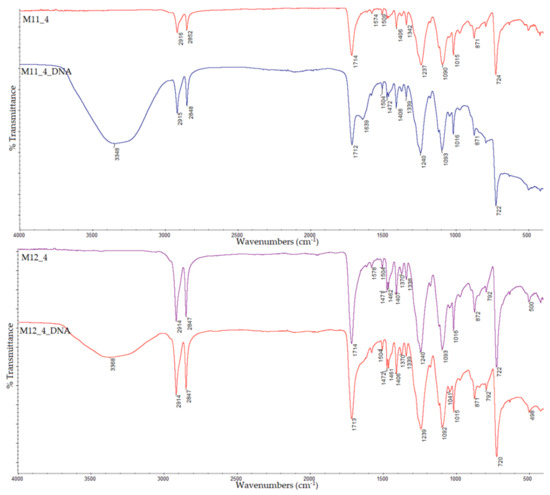
Figure 7.
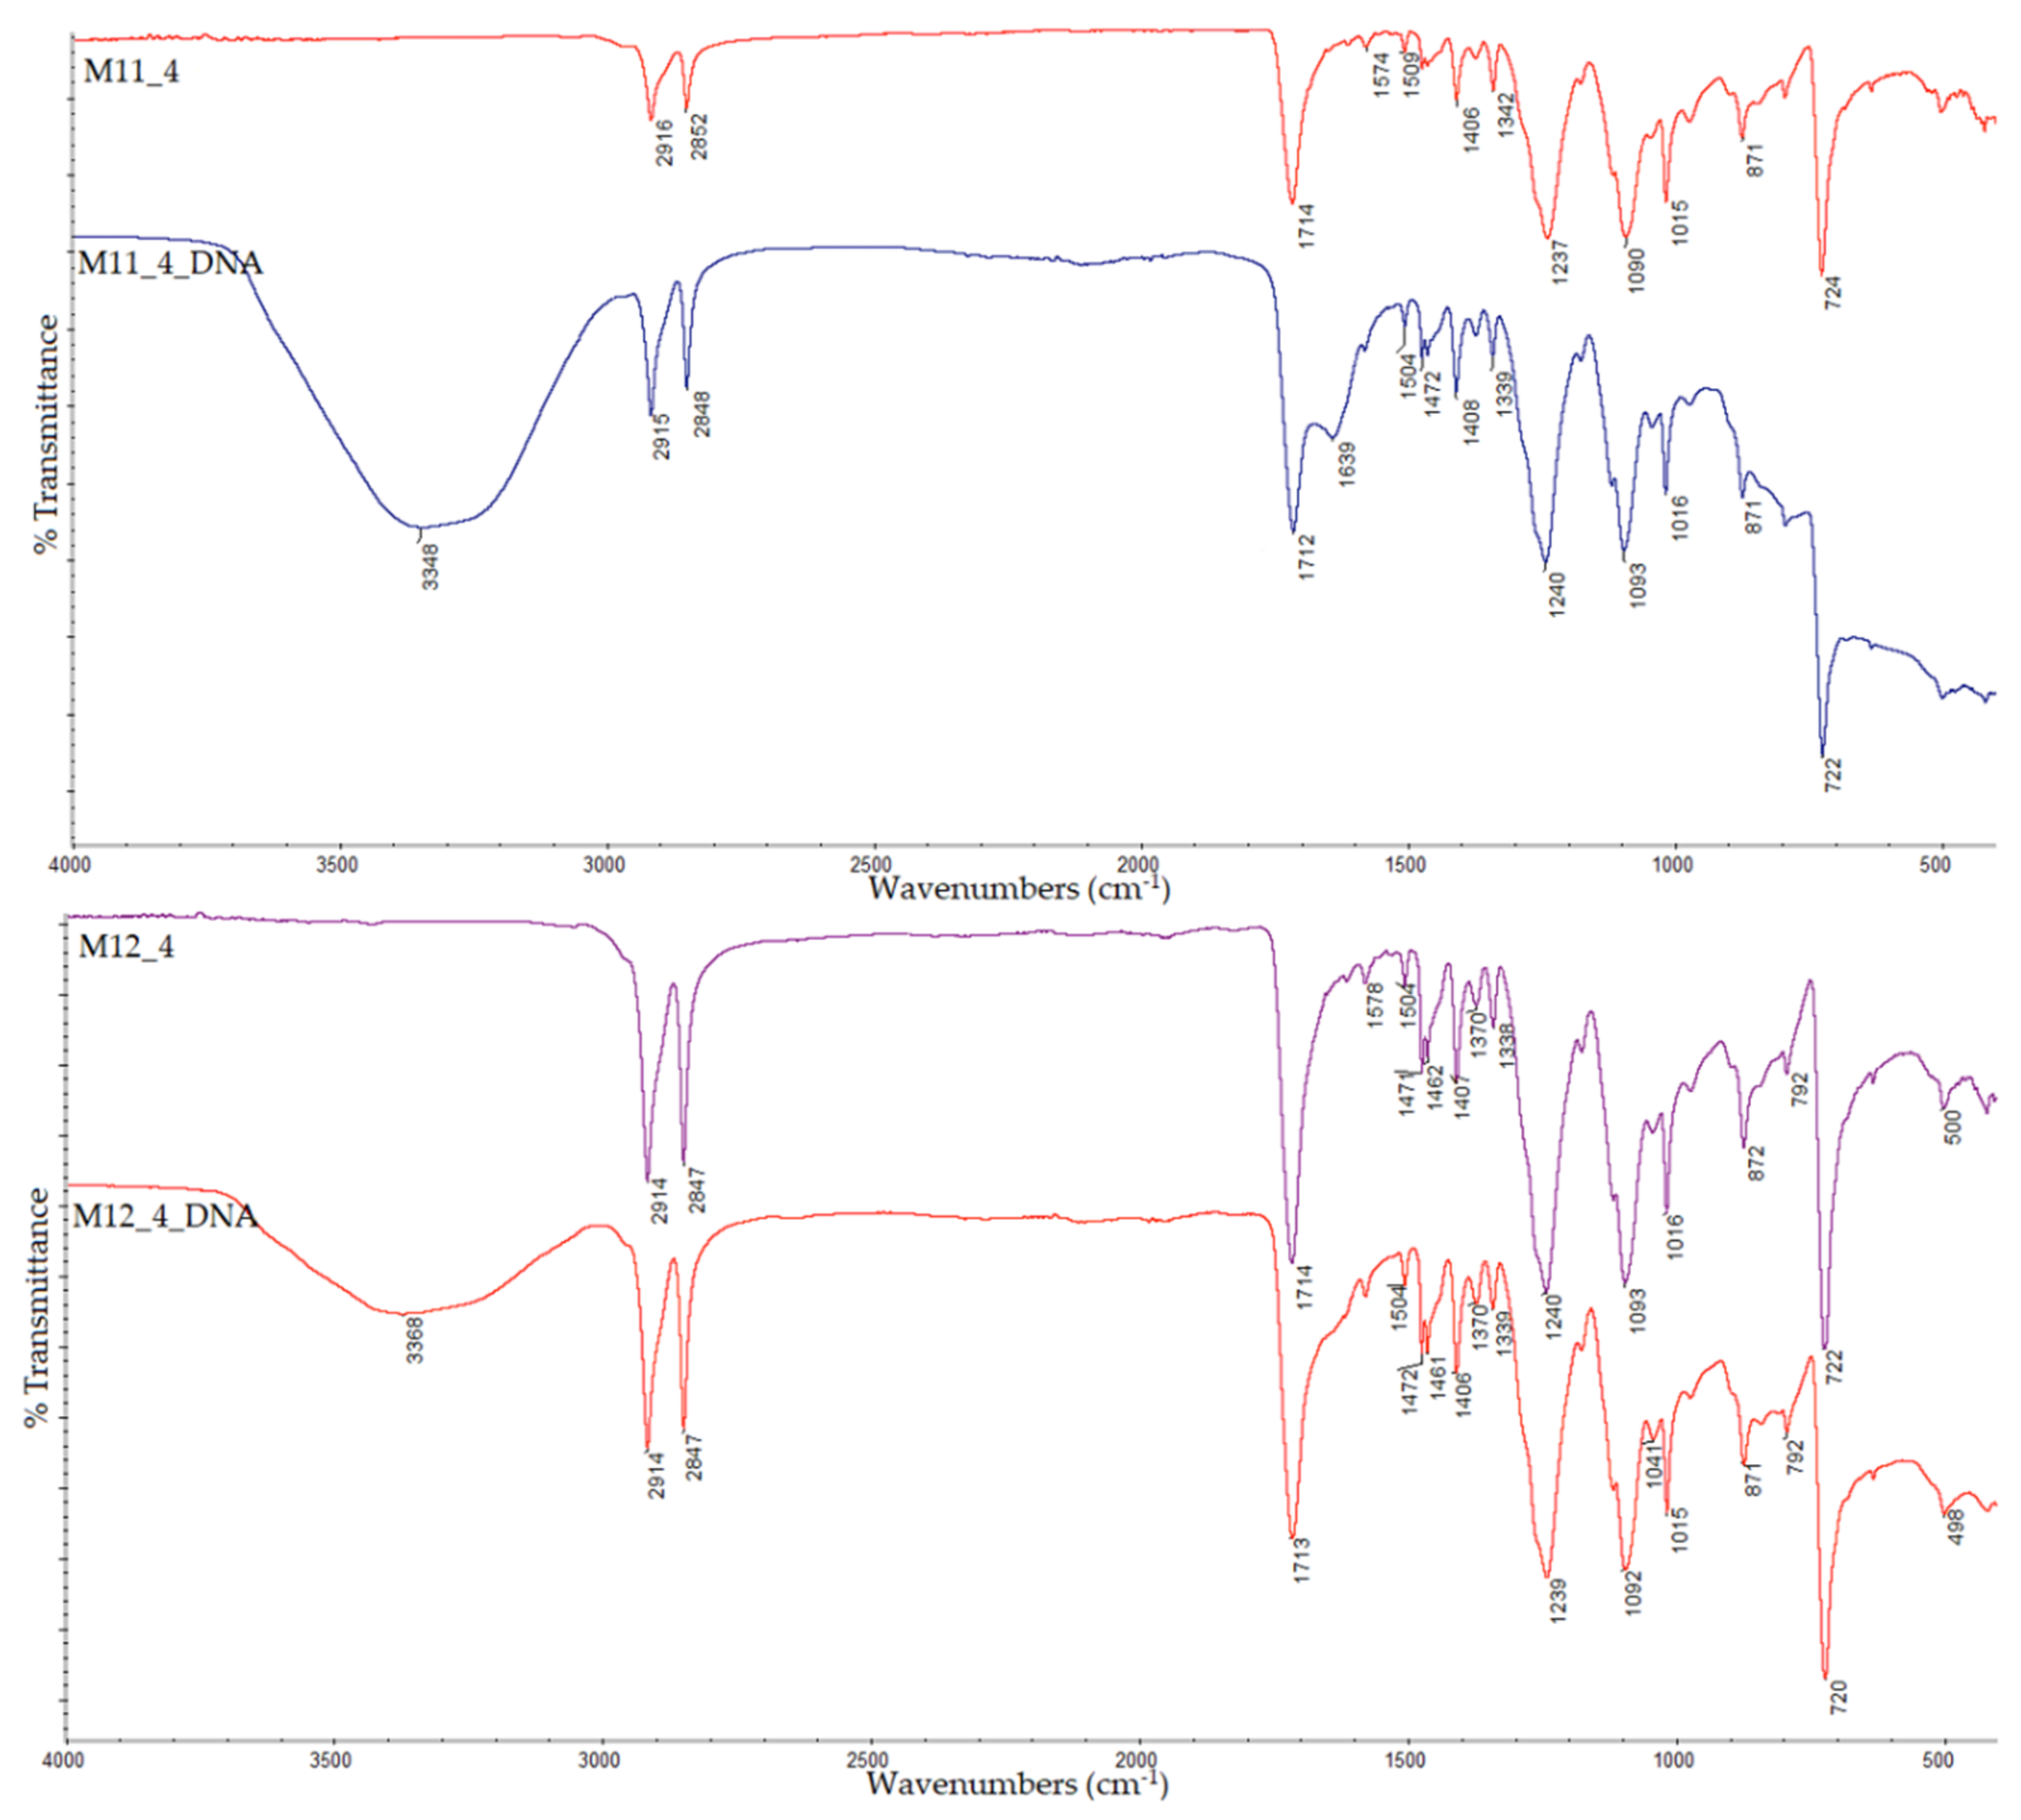
ATR–IR spectra of the bare PET and HDPE blended sample (M11_4), Al nanopowder PET and HDPE blended sample (M12_4), and DNA−contaminated samples (M11_4_DNA and M12_4_DNA).
The presence of 5% Al nanopowder in the recycled PET (sample M2_4), PET/PP (sample M7_4), and PET/HDPE (sample M12_4) compositions could be detected in the range of 500–1000 cm−1 [37], but in our case the weak peaks characteristic of the Al-O stretching and O-Al-O bond overlapped with the peaks of PET, PP, and HDPE, but with small shifts. For example, the peak situated at 499 cm−1 for the M6_4 sample was shifted at 490 cm−1 in the DNA-contaminated sample, while the peak at 418 cm−1 for bare M7_4 could be found at 426 cm−1 after DNA attachment, and at 418 cm−1 to 425 cm−1 in the case of M11_4_DNA.
The additional representative absorption signals for the PP chemical groups and their vibrational modes existing in the M6_4 and M7_4 samples from the ATR–FTIR spectra (Figure 6) are detailed as follows: 2916 cm−1 for the asymmetric stretching of −CH2, 2837 cm−1 for the symmetric stretching of the methyl group (−CH3), and sharper peaks at 1453 cm−1 and 1375 cm−1 attributed to −CH2− and −CH3 bending, respectively. These results are in good agreement with those obtained by Tariq, et al. [38], who used FTIR spectra to study the differences between pure PP, pure PET, and a PET–PP blend.
The increased flexibility and light weight of M11_4 and M12_4 was obtained with the incorporation of HDPE into the PET composite substrate; therefore, the absorption “fingerprint” [39] that characterizes HDPE can be visualized as shown in Figure 7. The ATR–FTIR spectra of the PET/HDPE and PET/HDPE/Al nanopowder composites (samples M11_4 and M12_4, respectively) also display the optical responses of the HDPE surface functional groups next to the PET absorption bands. The absorption bands located at 2916/2914 cm−1 and 2852/2847 cm−1 correspond to the CH2- stretching vibration, while the sharper peak around 724/722 cm−1 can be attributed to the CH2 rocking mode of the CH2 groups. Some of the HDPE signals are overlapped with the PET peaks, with significant intensities.
The modifications of the IR spectra of substrate composites after 2 h of DNA treatment are also shown in Figure 5, Figure 6 and Figure 7. The spectra show significant increases in the intensity of characteristic peaks of DNA due to the contamination process, as follows:
- -
- The appearance of the specific stretching vibrations for the OH and NH bonds of the amino acid at 3337 cm−1 in the M1_4_DNA sample, at 3335 cm−1 for M2_4_DNA, 3381 cm−1 for M6_4_DNA, 3346 cm−1 for M7_4_DNA, 3348 cm−1 for M11_4_DNA, and 3368 cm−1 for M12_4_DNA;
- -
- The overlapping of the 1634 cm−1 group assigned to the baFe vibrations with the deformation of the ester carbonyl bond of the PET compound for all samples: from 1713 to 1711 cm−1 in M1_4_DNA, 1712 to 1711 cm−1 in M2_4_DNA, 1714 to 1715 cm−1 in M7_4_DNA, and 1714 to 1712 cm−1 in the M11_4_DNA and M12_4_DNA samples;
- -
- The presence of a new peak at 1634/1639 cm−1 allocated to the same base region as observed in the case of the M1_4_DNA, M2_4_DNA, M7_4_DNA, M11_4_DNA, and M12_4_DNA samples, with a more intense signal, and weak in the case of the M6_4_DNA sample;
- -
- The C-O deoxyribose stretching observed at 1035 cm−1 in the spectrum of M7_4_DNA (absent in the bare M7_4 sample), at 1042 cm−1 in M1_4_DNA, at 1042 cm−1 in M11_4_DNA, and at 1040 cm−1 in the M12_4_DNA substrate, which is more intense and sharp when compared with the peaks in the same position for DNA-free samples.
All of the obtained results indicate changes in the chemical structure of the DNA-containing samples—modifications highlighted by the band shifts and entrance of new peaks in the studied PET/PP/HDPE/Al nanopowder composites when DNA is used as a contaminant. More studies are needed to quantify the spectra of the samples with DNA, and of the corresponding samples without DNA.
3.3. Ethidium Bromide Fluorescence Boost upon Binding to the DNA Contaminants
The presence of DNA contaminants on the substrate surface was investigated using ethidium bromide’s fluorescence enhancement upon binding to DNA as a “proof-of-concept method”. Ethidium bromide, a cationic dye that interacts strongly and specifically with DNA and RNA, is widely used in spectrofluorimetric studies because of the striking fluorescence enhancement it displays upon binding. It is well known that fluorescence enhancement accompanies not only the intercalation of the dye into the double-helix conformation of the nucleic acids, but also the electrostatic binding of the same dye [40].
As observed in Figure 8, the analyzed substrate materials, when excited with UV light, produce a slightly orange light, as evident for the composites based on PET, PP, and HDPE (M1_4, M6_4, and M11_4, respectively), suggesting that the presence of Al nanopowder obstructs the transparency of the materials and, therefore, their autofluorescence. After the treatment of the materials with the DNA and staining them with ethidium bromide solution, the dye molecules squeezed between the neighboring base pairs in a DNA double helix. Under UV light, the intercalated ethidium bromide in the DNA fluoresces, yielding a bright orange light, which is more prominent in the materials based on PET, PP, and HDPE (M1_4_DNA, M6_4_DNA, and M11_4_DNA, respectively), and slightly visible in the samples containing Al nanopowder (M2_4_DNA, M7_4_DNA, and M12_4_DNA). The reduction in the fluorescence for the materials based on Al nanopowder does not represent the absence of DNA contaminants on the substrate surface or the intercalated fluorescent ethidium bromide; rather, it denotes that since the fluorescence is measured from the bottom, the black surface inhibits the color. The intercalated fluorescent dye reagent for DNA staining in all substrate samples can be visualized from the picture of the samples on transparent slides (Figure 8B) with their fluorescent bottom.
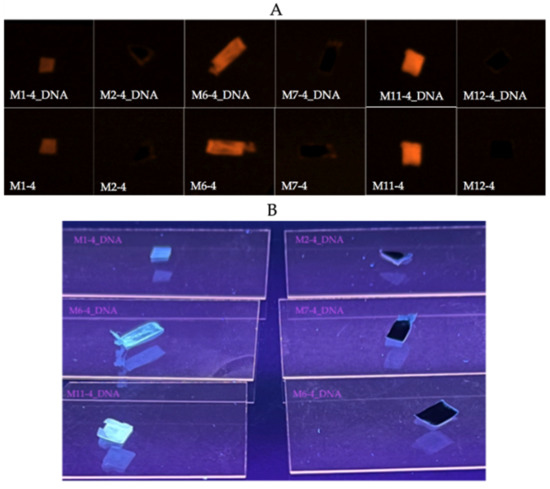
Figure 8.
Ethidium bromide fluorescence boost upon binding to DNA before and after the treatment process (UVP GelSolo Transilluminator): (A) UV images of bare vs. DNA contaminated materials; (B) DNA contaminated materials visualized with their fluorescent bottom.
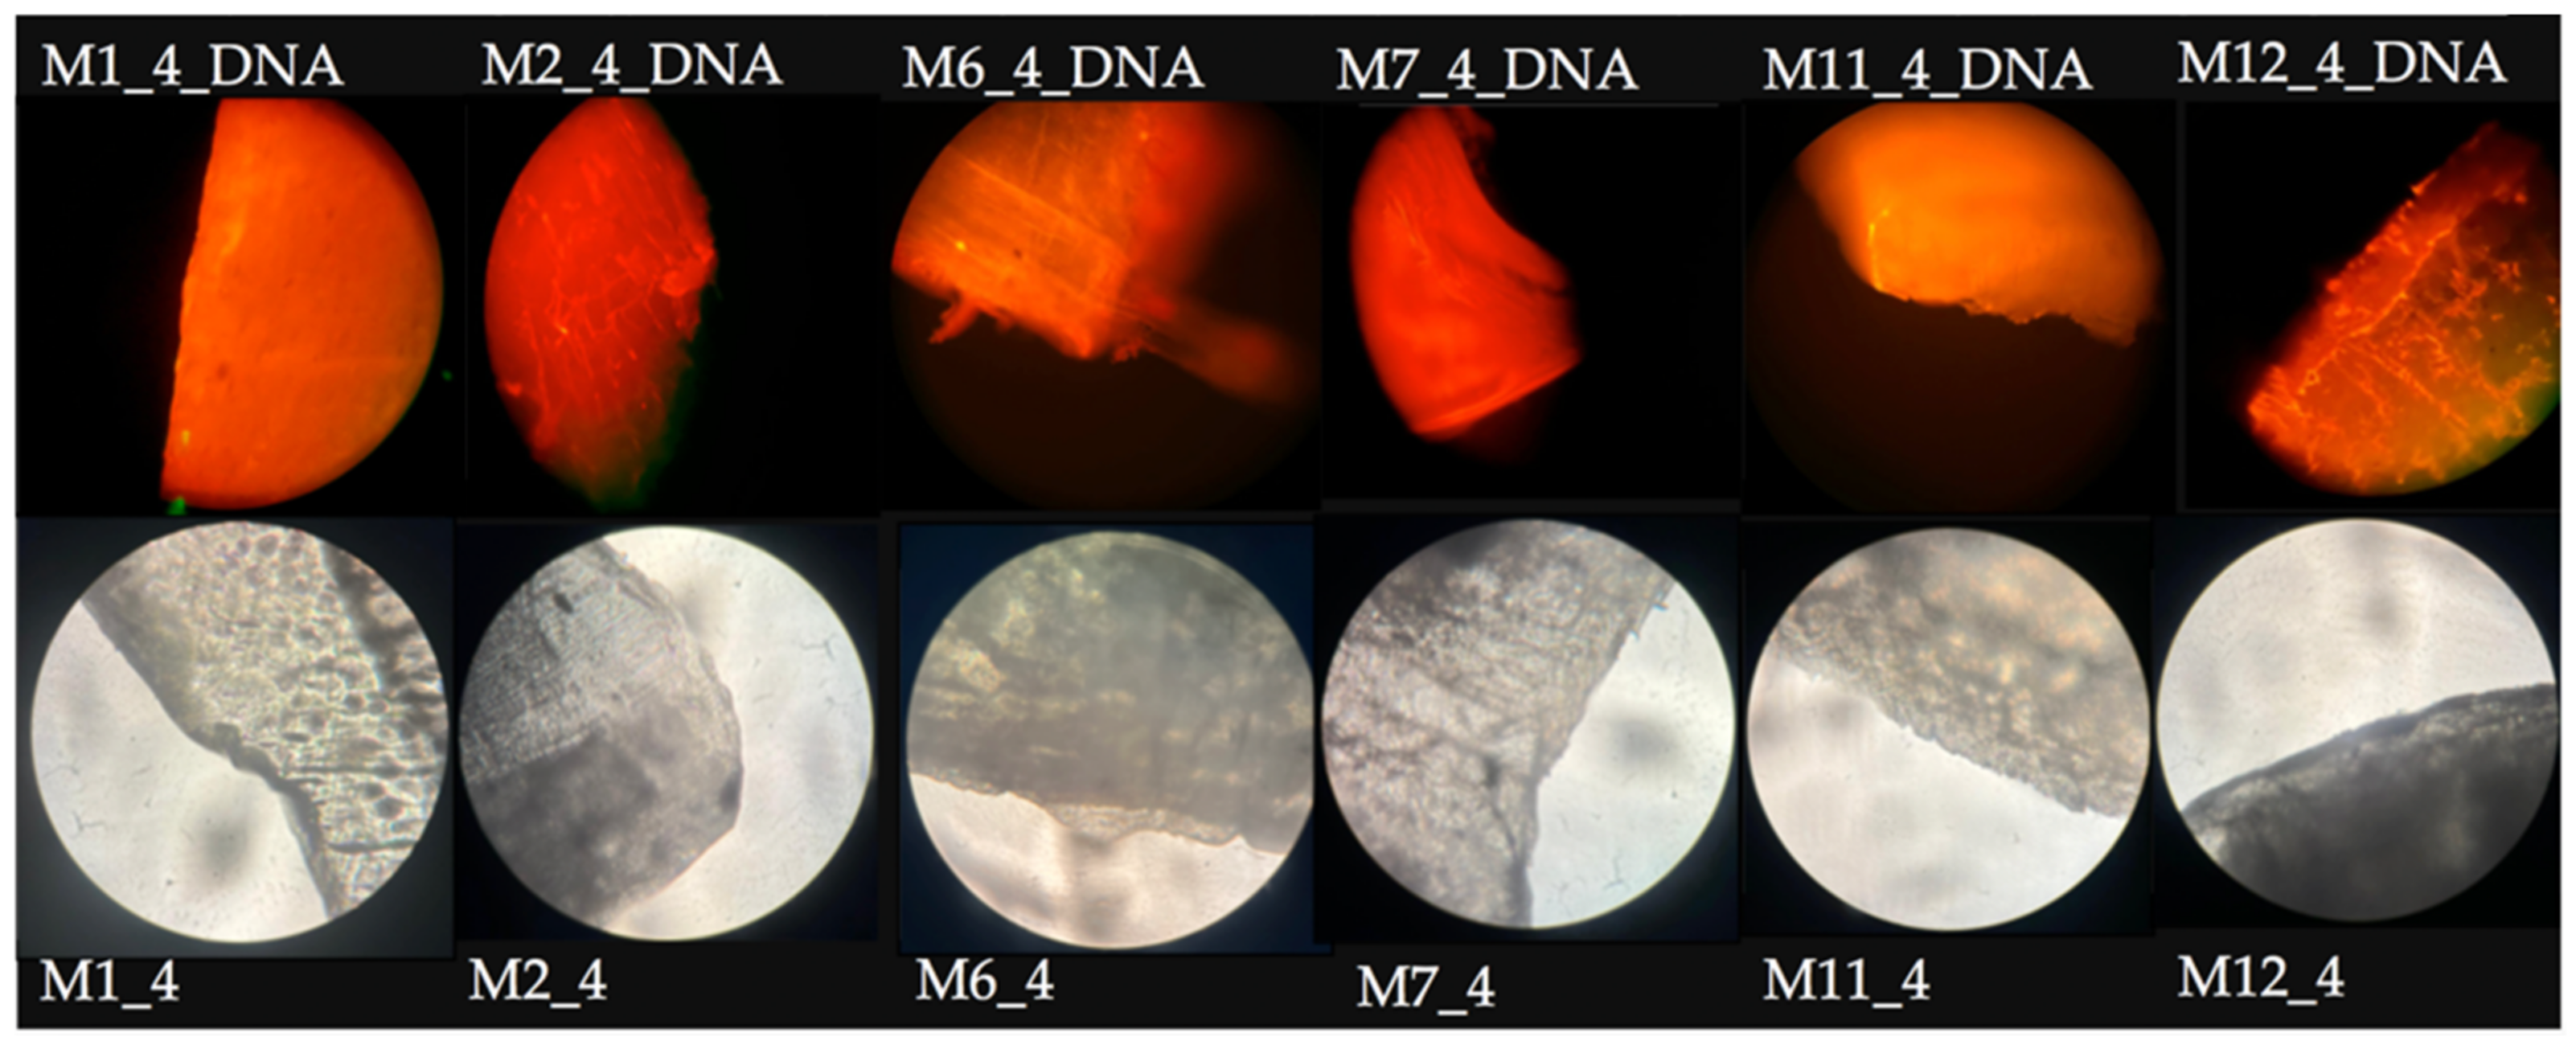
The same contaminated/stained substrate samples were also visualized individually on transparent slides using the fluorescence microscopy, and compared with the optical images of the same sections before the treatment. The results from Figure 9 show that the emitted fluorescence with an orange color is distinguishable on the supports’ surfaces due to the presence of the nucleic acid’s fluorescent tag.

Figure 9.
Fluorescence and optical photomicrographs of the composite supports before and after the contamination and ethidium bromide staining process.
The fluorescent intercalation complex of ethidium bromide with DNA on the recycled PET samples, presented as a proof-of-concept method for the first time in the literature, validates the results obtained from the ATR–FTIR spectra.
4. Conclusions
With the tremendous worldwide plastic production and, in consequence, an alarming level of plastic-based pollution, recycling is a key solution to this serious problem. Increased attention should be devoted to the analysis of possible contaminants from recycled plastics—especially for those used in food packaging or the pharmaceutical industry. Being a simple, precise, and low-cost analytical technique, ATR–FTIR spectroscopy was chosen to identify DNA, as a biological contaminant, on a recycled plastic composite substrate, based on three of the most recurring polymers found in the environment—PET (in recycled form), PP, and HDPE—with Al nanopowder as a reinforcing material.
Compared with the spectra of the bare materials, the spectra of the contaminated materials showed intense characteristic peaks of DNA. Furthermore, the presence of DNA on the substrate surface was highlighted by ethidium bromide’s fluorescence enhancement upon binding to DNA.
Our results prove that ATR–FTIR spectroscopy can provide a rapid, sensitive, and reliable approach for the screening of biochemical contaminants on composite materials based on recycled PET, reported for the first time in the literature.
5. Patents
Parts of the results reported in this manuscript have been submitted for a national patent currently under evaluation, application request no. A/00201/19 April 2022.
Author Contributions
Conceptualization, G.D. and C.T.M.; methodology, G.D.; software, C.T.M.; validation, G.D. and C.T.M.; formal analysis, G.D. and F.D.C.; investigation, G.D., F.D.C., D.P., M.A. and R.C.C.; resources, M.A., R.C.C. and C.T.M.; writing—original draft preparation, G.D., F.D.C. and D.P.; writing—review and editing, G.D. and F.D.C.; visualization, C.T.M.; supervision, G.D.; funding acquisition, R.C.C. and C.T.M. All authors have read and agreed to the published version of the manuscript.
Funding
This research was funded by the Ministry of Research, Innovation, and Digitization, Romania, CNCS/CCCDI-UEFISCDI, project number PN-III-P2-2.1-PED-2019-3970, within PNCDI III, and by Grigore T. Popa University of Medicine and Pharmacy of Iasi, grant number 27504/2018.
Institutional Review Board Statement
The animal experiments were approved by the Ethical Committee of Grigore T. Popa University of Medicine and Pharmacy of Iasi, Romania, and were conducted in accordance with the European guidelines on the protection of animals used for scientific purposes, and with the authorization of the National Sanitary Veterinary and Food Safety Authority (No. 19/9 April 2020).
Informed Consent Statement
Not applicable.
Data Availability Statement
Not applicable.
Acknowledgments
The authors are grateful to Vlad Constantin Ursachi, for helping them with the images.
Conflicts of Interest
The authors declare no conflict of interest.
References
- Koshti, R.; Mehta, L.; Samarth, N. Biological Recycling of Polyethylene Terephthalate: A Mini-Review. J. Polym. Environ. 2018, 26, 3520–3529. [Google Scholar] [CrossRef]
- Munoz, M.; Ortiz, D.; Nieto-Sandoval, J.; de Pedro, M.Z.; Casas, J.A. Adsorption of micropollutants onto realistic microplastics: Role of microplastic nature, size, age, and NOM fouling. Chemosphere 2021, 283, 131085. [Google Scholar] [CrossRef] [PubMed]
- Plastics Europe. Plastics—The Facts 2020 an Analysis of European Plastics Production, Demand and Waste Data. 2020. Available online: https://www.plasticseurope.org/en/resources/publications/4312-plastics-facts-2020 (accessed on 8 March 2022).
- MacArthur, D.E.; Waughray, D.; Stuchtey, R.M. The New Plastics Economy: Rethinking the Future of Plastics; World Economic Forum: Cologny, Switzerland, 2016. [Google Scholar]
- Gebre, S.H.; Sendeku, M.G.; Bahri, M. Recent Trends in the Pyrolysis of Non-Degradable Waste Plastics. ChemistryOpen 2021, 10, 1202–1226. [Google Scholar] [CrossRef]
- Maurya, A.; Bhattacharya, A.; Khare, S.K. Enzymatic Remediation of Polyethylene Terephthalate (PET)-Based Polymers for Effective Management of Plastic Wastes: An Overview. Front. Bioeng. Biotechnol. 2020, 8, 602325. [Google Scholar] [CrossRef] [PubMed]
- Geyer, R.; Jambeck, J.R.; Lavender Law, K. Production, use, and fate of all plastics ever made. Sci. Adv. 2017, 3, e1700782. [Google Scholar] [CrossRef] [Green Version]
- D’Ambrieres, W. Plastics recycling worldwide: Current overview and desirable changes. Field Actions Sci. Rep. 2019, 19, 12–21. [Google Scholar]
- Eurostat. EU Recycled 41% of Plastic Packaging Waste in 2019. Available online: https://ec.europa.eu/eurostat/web/products-eurostat-news/-/ddn-20211027-2 (accessed on 16 March 2022).
- Barthelemy, E.; Spyropoulos, D.; Milana, M.R.; Pfaff, K.; Gontard, N.; Lampi, E.; Castle, L. Safety evaluation of mechanical recycling processes used to produce polyethylene terephthalate (PET) intended for food contact applications. Food Addit. Contam. 2014, 31, 490–497. [Google Scholar] [CrossRef]
- Vollmer, I.; Jenks, M.J.F.; Roelands, C.P.; White, R.J.; van Harmelen, T.; de Wild, P.; van der Laan, G.R.; Meirer, F.; Keurentjes, J.T.F.; Weckhuysen, B.M. Beyond mechanical recycling: Giving new life to plastic waste. Angew. Chem. Int. Ed. 2020, 59, 15402–15423. [Google Scholar] [CrossRef] [Green Version]
- Raheem, A.B.; Noor, Z.Z.; Hassan, A.; Hamid, M.K.A.; Samsudin, S.A.; Sabeen, A.H. Current developments in chemical recycling of post-consumer polyethylene terephthalate wastes for new materials production: A review. J. Clean. Prod. 2019, 225, 1052–1064. [Google Scholar] [CrossRef]
- Silano, V.; Barat Baviera, J.M.; Bolognesi, C.; Chesson, A.; Cocconcelli, P.S.; Crebelli, R.; Gott, D.M.; Grob, K.; Mortensen, A.; Riviere, G.; et al. Safety assessment of the process RE-PET, based on EREMA Basic technology, used to recycle post-consumer PET into food contact materials. EFSA J. 2020, 18, 6049. [Google Scholar] [CrossRef]
- Franz, R.; Welle, F. Contamination Levels in Recollected PET Bottles from Non-Food Applications and their Impact on the Safety of Recycled PET for Food Contact. Molecules 2020, 25, 4998. [Google Scholar] [CrossRef] [PubMed]
- Welle, F. Decontamination efficiency of a new post-consumer polyethylene terephthalate (PET) recycling concept. Food Addit. Contam. 2008, 25, 123–131. [Google Scholar] [CrossRef] [Green Version]
- Mancini, S.D.; Schwartzman, J.A.S.; Rodriques Nogueira, A.; Kagohara, D.A.; Zanin, M. Additional steps in mechanical recycling of PET. J. Clean. Prod. 2010, 18, 92–100. [Google Scholar] [CrossRef]
- Hossain, S.; Mozumder, S.I. Post-consumer polyethylene terephthalate (PET) recycling in Bangladesh through optimization of hot washing parameters. ASRJETS 2018, 40, 62–76. [Google Scholar]
- Cabanes, A.; Fullana, A. New methods to remove volative organic compounds from post-comsumer plastic waste. Sci. Total Environ. 2021, 758, 144066. [Google Scholar] [CrossRef] [PubMed]
- Félix, J.S.; Alfaro, P.; Nerín, C. Pros and cons of analytical methods to quantify surrogate contaminants from the challenge test in recycled polyethylene terephthalate. Anal. Chim. Acta 2011, 687, 67–74. [Google Scholar] [CrossRef] [PubMed]
- Balan, V.; Mihai, C.-T.; Cojocaru, F.-D.; Uritu, C.-M.; Dodi, G.; Botezat, D.; Gardikiotis, I. Vibrational Spectroscopy Fingerprinting in Medicine: From Molecular to Clinical Practice. Materials 2019, 12, 2884. [Google Scholar] [CrossRef] [Green Version]
- ISO—International Organization for Standardization. Available online: https://www.iso.org/standard/55483.html (accessed on 11 March 2022).
- Mizera, A.; Manas, M.; Stoklasek, P. Effect of Temperature Ageing on Injection Molded High-Density Polyethylene Parts Modified by Accelerated Electrons. Materials 2022, 15, 742. [Google Scholar] [CrossRef]
- Gomiero, A.; Strafella, P.; Fabi, G. From Macroplastic to Microplastic Litter: Occurrence, Composition, Source Identification and Interaction with Aquatic Organisms. Experiences from the Adriatic Sea. In Plastics in the Environment; Gomiero, A., Ed.; IntechOpen: London, UK, 2019; pp. 1–20. [Google Scholar] [CrossRef]
- Schulz, M.; Schäfer, M.; Saalwächter, K.; Thurn-Albrecht, T. Competition between crystal growth and intracrystalline chain diffusion determines the lamellar thickness in semicrystalline polymers. Nat. Commun. 2022, 13, 119. [Google Scholar] [CrossRef]
- Glaser, J.A. Biological Degradation of Polymers in the Environment. In Plastics in the Environment; Gomiero, A., Ed.; IntechOpen: London, UK, 2019; pp. 73–94. [Google Scholar] [CrossRef] [Green Version]
- Rahman, K.S.; Islam, M.N.; Rahman, M.M.; Hannan, M.O.; Dungani, R.; Khalil, H.A. Flat-pressed wood plastic composites from sawdust and recycled polyethylene terephthalate (PET): Physical and mechanical properties. SpringerPlus 2013, 2, 629. [Google Scholar] [CrossRef] [Green Version]
- Li, Y.; Yang, J.; Yu, X.; Sun, X.; Chen, F.; Tang, Z.; Zhu, L.; Qin, G.; Chen, Q. Controlled Shape Deformation of Bilayer Film with Tough Adhesion between Nanocomposite Hydrogel and Polymer Substrate. J. Mater. Chem. B 2018, 6, 6629–6636. [Google Scholar] [CrossRef] [PubMed]
- Ziąbka, M.; Dziadek, M. Thermoplastic Polymers with Nanosilver Addition-Microstructural, Surface and Mechanical Evaluation during a 36-Month Deionized Water Incubation Period. Materials 2021, 14, 361. [Google Scholar] [CrossRef] [PubMed]
- Chen, R.S.; Ab Ghani, M.H.; Salleh, M.N.; Ahmad, S.; Gan, S. Influence of Blend Composition and Compatibilizer on Mechanical and Morphological Properties of Recycled HDPE/PET Blends. Mater. Sci. Appl. 2014, 5, 943–952. [Google Scholar] [CrossRef] [Green Version]
- Han, Y.; Han, L.; Yao, Y.; Li, Y.; Liu, X. Key factors in FTIR spectroscopic analysis of DNA: The sampling technique, pretreatment temperature and sample concentration. Anal. Methods 2018, 10, 2436–2443. [Google Scholar] [CrossRef]
- Pakbin, B.; Zolghadr, L.; Rafiei, S.; Brück, W.M.; Brück, T.B. FTIR differentiation based on genomic DNA for species identification of Shigella isolates from stool samples. Sci. Rep. 2022, 12, 2780. [Google Scholar] [CrossRef]
- Gomes Rios, T.; Larios, G.; Marangoni, B.; Oliveira, S.L.; Cena, C.; do Nascimento Ramos, C.A. FTIR spectroscopy with machine learning: A new approach to animal DNA polymorphism screening. Spectrochim. Acta A Mol. Biomol. Spectrosc. 2021, 261, 120036. [Google Scholar] [CrossRef] [PubMed]
- Banyay, M.; Sarkar, M.; Gräslund, A. A library of IR bands of nucleic acids in solution. Biophys. Chem. 2003, 104, 477–488. [Google Scholar] [CrossRef]
- Dos Santos Pereira, A.P.; Prado da Silva, M.H.; Pereira Lima Júnior, E.; Dos Santos Paula, A.; Tommasini, F.J. Processing and Characterization of PET Composites Reinforced With Geopolymer Concrete Waste. Mat. Res. 2017, 20. [Google Scholar] [CrossRef] [Green Version]
- Edge, M.; Wiles, R.; Allen, N.S.; McDonald, W.A.; Mottock, S.V. Characterization of the species responsible for yellowing in melt degraded aromatic polyesters-I: Yellowing of poly(ethylene terephthalate). Polym. Degrad. Stab. 1996, 53, 141–151. [Google Scholar] [CrossRef]
- Silverstein, R.M.; Webster, F.X. Spectrometric Identification of Organic Compounds; Wiley: New York, NY, USA, 1998. [Google Scholar]
- González-Gómez, M.A.; Belderbos, S.; Yañez-Vilar, S.; Piñeiro, Y.; Cleeren, F.; Bormans, G.; Deroose, C.M.; Gsell, W.; Himmelreich, U.; Rivas, J. Development of Superparamagnetic Nanoparticles Coated with Polyacrylic Acid and Aluminum Hydroxide as an Efficient Contrast Agent for Multimodal Imaging. Nanomaterials 2019, 9, 1626. [Google Scholar] [CrossRef] [Green Version]
- Tariq, A.; Afzal, A.; Rashid, I.A.; Fayzan, S.H.M. Study of thermal, morphological, barrier and viscoelastic properties of PP grafted with maleic anhydride (PP-g-MAH) and PET blends. J. Polym. Res. 2020, 27, 309. [Google Scholar] [CrossRef]
- Krehula, L.K.; Katančić, Z.; Ptiček Siročić, A.; Hrnjak-Murgić, Z. Weathering of High-Density Polyethylene-Wood Plastic Composites. J. Wood Chem. Technol. 2014, 34, 39–54. [Google Scholar] [CrossRef]
- Olmsted, J., III; Kearns, D.R. Mechanism of ethidium bromide fluorescence enhancement on binding to nucleic acids. Biochemistry 1977, 16, 3647–3654. [Google Scholar] [CrossRef] [PubMed]


Publisher’s Note: MDPI stays neutral with regard to jurisdictional claims in published maps and institutional affiliations. |
© 2022 by the authors. Licensee MDPI, Basel, Switzerland. This article is an open access article distributed under the terms and conditions of the Creative Commons Attribution (CC BY) license (https://creativecommons.org/licenses/by/4.0/).