Article

Genetic Dissection of Tobacco (Nicotiana tabacum L.) Plant Height Using Single-Locus and Multi-Locus Genome-Wide Association Studies

1
Guangdong Provincial Key Laboratory of Plant Adaptation and Molecular Design, International Crop Research Center for Stress Resistance, School of Life Sciences, Guangzhou University, Guangzhou 510006, China
2
Guangdong Research Institute of Tobacco Science, Shaoguan 512029, China
3
The UWA Institute of Agriculture, UWA School of Agriculture and Environment, The University of Western Australia, Perth, WA 6001, Australia
4
College of Agriculture, South China Agricultural University, Guangzhou 510642, China
*
Authors to whom correspondence should be addressed.
These authors contributed equally to this work.
Agronomy 2022, 12(5), 1047; https://doi.org/10.3390/agronomy12051047
Submission received: 17 December 2021 / Revised: 26 April 2022 / Accepted: 26 April 2022 / Published: 27 April 2022
(This article belongs to the Special Issue Marker Development in the Genomics Era)

Abstract

:
Tobacco (Nicotiana tabacum L.) plant height (PH) is a biologically important plant architecture trait linked to yield and controlled by polygenes. However, limited information is available on quantitative trait nucleotides (QTNs), alleles, and candidate genes. The plant height of 94 tobacco accessions and their 126,602 SNPs were measured to conduct a genome-wide association study (GWAS) using four multi-locus (ML) and two single-locus (SL) models to better understand its genetic basis. The ML and SL models detected 181 and 29 QTNs, respectively, across four environments/BLUP; LOD scores ranged from 3.01–13.45, and the phenotypic variance explained (PVE) ranged from 0.69–25.37%. Fifty-two novel, stable QTNs were detected across at least two methods and/or two environments/BLUP, with 0.64–24.76% PVE. Among these, 49 QTNs exhibited significant phenotypic differences between two alleles; the distribution of elite and alternative alleles for each accession ranged from 3–42 and 6–46, respectively, in the mapping population. Seven cross combinations in two directions were predicted using alleles of validated QTNs, including Qinggeng × KY14 for taller plants and RG112 × VA115 for shorter plants. We identified 27 candidate genes in the vicinity of 49 stable QTNs based on comparative genomics, gene ontology (GO), and KEGG enrichment analysis, including AP2, Nitab4.5_0000343g0250.1 (ROC1), Nitab4.5_0000197g0010.1 (VFB1), CDF3, AXR6, KUP8, and NPY2. This is the first study to use genotyping-by-sequencing (GBS) of SNPs to determine QTNs, potential candidate genes, and alleles associated with plant height. These findings could provide a new avenue for investigating the QTNs in tobacco by combining SL and ML association mapping and solid foundations for functional genomics, the genetic basis, and molecular breeding for PH in tobacco.

1. Introduction

Tobacco (Nicotiana tabacum L.) is an industrial crop grown on approximately 4.2 million hectares, distributed across more than 120 countries [1]; its dry leaves are used to produce cigarettes, chewing tobacco, cigars, and pipe tobacco [2,3]. The leaves and stems could make tobacco a reliable source of biofuel and bioethanol [4]. China is the leading tobacco producer, followed by India, Brazil, Zimbabwe, and the United States of America (USA) [5]. The height of tobacco plants is a biologically important plant architecture trait linked to yield and environmental stress tolerance [6,7]. Plant height has been positively associated with leaves and yield [8,9]; thus, increasing PH could increase tobacco yield. However, tobacco yield is far from the predicted yield [4] because its narrow genetic variation in N. tabacum [10] hinders the potential for breeding high-yielding tobacco varieties. Therefore, dissecting the genetic architecture and identifying elite alleles are essential for breeding superior cultivars with a suitable PH.
The height of tobacco plants is a quantitatively inherited trait controlled by many genes/quantitative trait loci (QTL) with major and minor effects. Traditional methods of selecting suitable cultivars with a suitable PH require assessing various environments over several years, which is labor-intensive, expensive, and time-consuming [11,12]. Due to recent developments in next-generation sequencing (NGS) technology, molecular markers are widely used in genetic research and breeding [13,14,15]. Thus, marker-assisted selection (MAS) is an alternative approach for increasing the efficacy of traditional selection by improving the allele frequency of critical PH QTL [13,16]. Studies have used simple sequence repeat (SSR) markers for genetic diversity analysis in tobacco [8,17,18]. Tong et al. [17] identified 13 QTLs for PH, explaining less than 20% of the phenotypic variance, with one QTL mapped on linkage group (LG) 17 explaining 20.30% of the phenotypic variance. Similarly, Cheng et al. [8] mapped two major QTLs (qPH-6 and qPH-12) on LG6 and LG12, respectively, explaining 7.10% and 22.4% of the phenotypic variance. Recently, seven QTLs for PH, qnPH6a, qnPH6b, qnPH6c, qnPH6d, qnPH8a, qnPH8b, and qnPH8c on LG6 and LG8 were identified using 45,081 SNPs of 274 tobacco individuals [19]. Up until now, only 22 QTLs have been published for PH in tobacco using a biparental population. Limited information is available on plant height QTL mapping in tobacco [8,17] compared to other crops [20], such as 238 QTLs in soybean (https://www.soybase.org/ (accessed on 5 August 2021)), 312 in wheat (http://wheatqtldb.net/#home (accessed on 6 August 2021)), and 209 in maize (https://maizegdb.org/data_center/locus (accessed on 6 August 2021)). Thus, the molecular mechanism regulating PH in tobacco is scarcely known.
In recent years, genome-wide association studies (GWAS) have exploited more recombinant events and allelic diversity than QTL mapping and traditional methods [21]. Previous studies have used a small number of markers for association mapping in tobacco [8,22]. For example, Zhang et al. [22] used 258 flue-cured tobacco varieties and 597 sequence-related amplified polymorphism (SRAP) markers to identify three SRAP associated with PH. Likewise, Cheng et al. [8] identified four SSR markers that explained 11.7–14.8% of the phenotypic variation associated with PH using 96 tobacco accessions and 46 SSR markers. Recently, NGS, GBS, and chip arrays have identified millions of SNPs [5,11,23], increasing our understanding of genetic variation in tobacco. Li et al. [11] mapped 38 QTNs for disease resistance using GBS-SNPs in tobacco. SNPs have been widely used in GWAS studies to identify QTNs for agronomic traits in maize [24], wheat [25,26], mungbean [27], barley [28,29,30,31], rice [32,33], soybean [34,35], brassica [36], and tomato [37] but not tobacco.
Moreover, many genes for PH have been dissected in crops, including Rht1 and Rht2 in wheat [38]; GmDW1 [39], GmTFL1b [40], and GA20ox [41] in soybean; OsABF1 [42], OsFIE2, OsEMF2b, OsCLF [43], OsMPH1 [44], and OsRPH1 [45] in rice; ZmGA3ox2 [46] and ZmACS7 [47] in maize; At1g74450 in Arabidopsis [48]; and BnaMAX1 [49] and BnaC04.BIL1 [50] in brassica. In addition, GWAS has been conducted to mine the candidate genes in multiple crops due to low genomic linkage disequilibrium (LD) associated with investigated traits [51]. Ikram et al. [52] and Hun et al. [53] mined 36 and 8 candidate genes for seed weight and plant height in soybean using multi-locus (ML) GWAS models, respectively. Likewise, Hou et al. [54] predicted 46 candidate genes in cotton using ML-GWAS, while Ma et al. [55] reported 40 candidate genes based on QTNs. However, the genetic foundations of PH have not been extensively studied in tobacco, with most studies focusing on a classical genetics analysis [56]. Therefore, identifying candidate genes, QTLs/QTNs, and elite alleles associated with PH will benefit the genetic improvement of tobacco through molecular breeding.
Our earlier studies identified 38 QTNs and 53 candidate genes for tobacco bacterial wilt [11] and five SNPs associated with drought tolerance in barley [28]. In the current study, we phenotyped the PH of 94 tobacco accessions in multiple environments at two locations. Our objectives were to identify (a) QTNs using single-locus (SL) and ML-GWAS models to compare with known QTLs/QTNs, (b) stable QTNs and their elite alleles, (c) allelic distribution in mapping population and predict cross combination using alleles, and (d) candidate genes based on stable QTNs according to LD decay distance. These results will provide an alternative strategy for improving the genetic architecture of PH in tobacco using MAS.

2. Materials and Methods

2.1. Plant Material and Phenotyping

Ninety-four tobacco accessions (90 flue-cured, two burley, and two sun-cured) were collected from different countries, including China, Japan, the United States, Australia, Canada, Somalia, and Zimbabwe. The seeds were collected from the Nanxiong Scientific Research Institute of Guangdong Tobacco Company, China; we used the same panel in an earlier study [11]. These accessions were evaluated for plant height at the Hukou experimental station of Nanxiong city in 2013 (E1-13H) and 2014 (E2-14H) and Xikou experimental station of Nanxiong city in 2014 (E3-14X) and 2015 (E4-15X). Twenty plants of each accession were grown in 0.5 × 1.2 m2 plots in a randomized complete block design with two replicates. The PH of five representative plants from each plot was measured when the first flower emerged on the main stem and averaged for each accession based on two replications.

2.2. Statistical Analysis and Heritability Estimation for Plant Height

The mean, range, minimum, maximum, coefficient of variation (CV), standard deviation (SD), skewness, and kurtosis were calculated for PH of 94 accessions in various environments using R4.0.3 (http://www.R-project.org/ (accessed on 10 September 2021)). The Agricolae package of R software was used to perform a two-way ANOVA (genotype and environment). Violin plots showed the distribution of phenotypic data for each environment and BLUP values. The BLUP value of PH for each accession was determined using the lme4 R package [57], with the following equation: Phenotype~(1|Genotype) + (1|Year). A mixed linear model (MLM) was used to measure residual and polygenic variances for the heritability estimation as described in [52]. The broad-sense heritability (h2B) for plant height was calculated as
h B 2 = σ g 2 σ g 2 + σ e 2
where σ g 2 is genetic variance, and σ e 2 is residual variance.

2.3. Genotyping and Genome-Wide Association Studies

Genotyping-by-sequencing (GBS) technology was adopted to obtain high-density SNPs, library preparation, variant calling, quality control filtration, and genotype 94 tobacco accessions (SRA accession number: PRJNA759331), as described in [11]. The Q matrix of population structure, number of sub-populations, and linkage disequilibrium were the same as in [11]. The association analysis involved 126,602 high-density SNPs with a minor allele frequency (MAF) >0.05, based on the reference genome of N. tabacum Nitab4.5 [58]. The ML-GWAS was performed to detect significant QTNs using the mrMLM v4.0.2 package (https://cran.r-project.org/web/packages/mrMLM/index.html (accessed on 15 September 2021)) [59], including mrMLM [60], pLARmEB [61], ISIS EM-BLASSO [62], and FASTmrMLM [59], and the kinship matrix K was automatically calculated. An LOD ≥ 3.00 (p = 0.0002) was set as the threshold for significant QTNs [63]. Two SL-GWAS methods, FarmCPU (Q + K) and MLM (Q + K) models, were used to detect significant QTNs using GAPIT [64] and TASSEL 5.2 [65], respectively. A threshold value of 0.05/N (N is number of markers) was adopted for significant QTNs associated with PH. QTNs detected across at least two ML/SL models and/or environments/BLUP were considered stable. QTN naming followed the nomenclature: starting with ‘q’, followed by the trait name (PH, plant height), chromosome number, and number of QTNs identified chromosome-wise.

2.4. Elite Allele Analysis for Plant Height

Stable QTNs detected across environments and multiple methods were considered for the analysis of elite alleles. The elite alleles of each locus were determined based on the rules in [11,52,53], such as the QTN effect value and 1 or –1 code for genotype. A QTN positive effect value selected a genotype with code ‘1’ as an elite allele; a negative effect value selected a genotype with code ‘–1’ as an elite allele; other alleles were selected as alternative alleles [60,63]. The significance of plant height differences between elite and alternative alleles was tested by a t-test to validate the stable QTNs. A boxplot depicted the mean plant height of accessions with elite and alternative alleles. For each accession, the elite allele percentage was determined as the number of elite alleles divided by stable QTNs. For each QTN, the elite allele percentage was determined as the number of tobacco accessions with elite alleles divided by 94 accessions. A correlation analysis was carried out between the number of elite/alternative alleles and plant height phenotype using R package ggplot2 (https://cran.r-project.org/web/packages/ggplot2/index.html (accessed on 25 September 2021)). After validating and distributing elite alleles in the mapping population, the five best cross combinations in two directions were predicted to develop recombinant inbred lines (RILs) for tobacco breeding programs through marker-assisted breeding methods.

2.5. Potential Candidate Gene Analysis

Candidate gene prediction was conducted based on the stable QTNs using the N. tabacum Nitab4.5 (https://solgenomics.net/organism/Nicotiana_tabacum/genome; (accessed on 9 October 2021)) reference genome [58], within 95 kb upstream and downstream of each QTN [11]. All identified genes were used to perform gene functional annotation and comparative genome analysis. The functional annotation was retrieved using the Solgenomics (https://solgenomics.net/organism/Nicotiana_tabacum (accessed on 9 October 2021)) database. The comparative genome analysis identified homologous genes related to PH between A. thaliana and N. tabacum using BLAST (http://blast.ncbi.nlm.nih.gov (accessed on 9 October 2021)) with default settings except for critical E value 1E-30. The homologous genes were categorized according to plant height based on the function of their homologous genes in Arabidopsis, such as hormones related, transcription factors, brassinosteroids, and structural components [66].

2.6. Gene Ontology and KEGG Analysis

A gene ontology (GO) analysis was performed using a web-based tool (http://www.geneontology.org/ (accessed on 24 October 2021)) to classify the functions of potential candidate genes into three classes: cellular component (CC), biological process (BP), and molecular function (MF). A KEGG pathway enrichment analysis was conducted using the online-based software KOBAS v3.0 (Beijing, China, http://kobas.cbi.pku.edu.cn/ (accessed on 24 October 2021)) to map the potential pathways associated with plant height [67]. Finally, an adjusted p-value of ≤0.05 was used as a cutoff threshold for GO terms and KEGG pathways.

3. Results

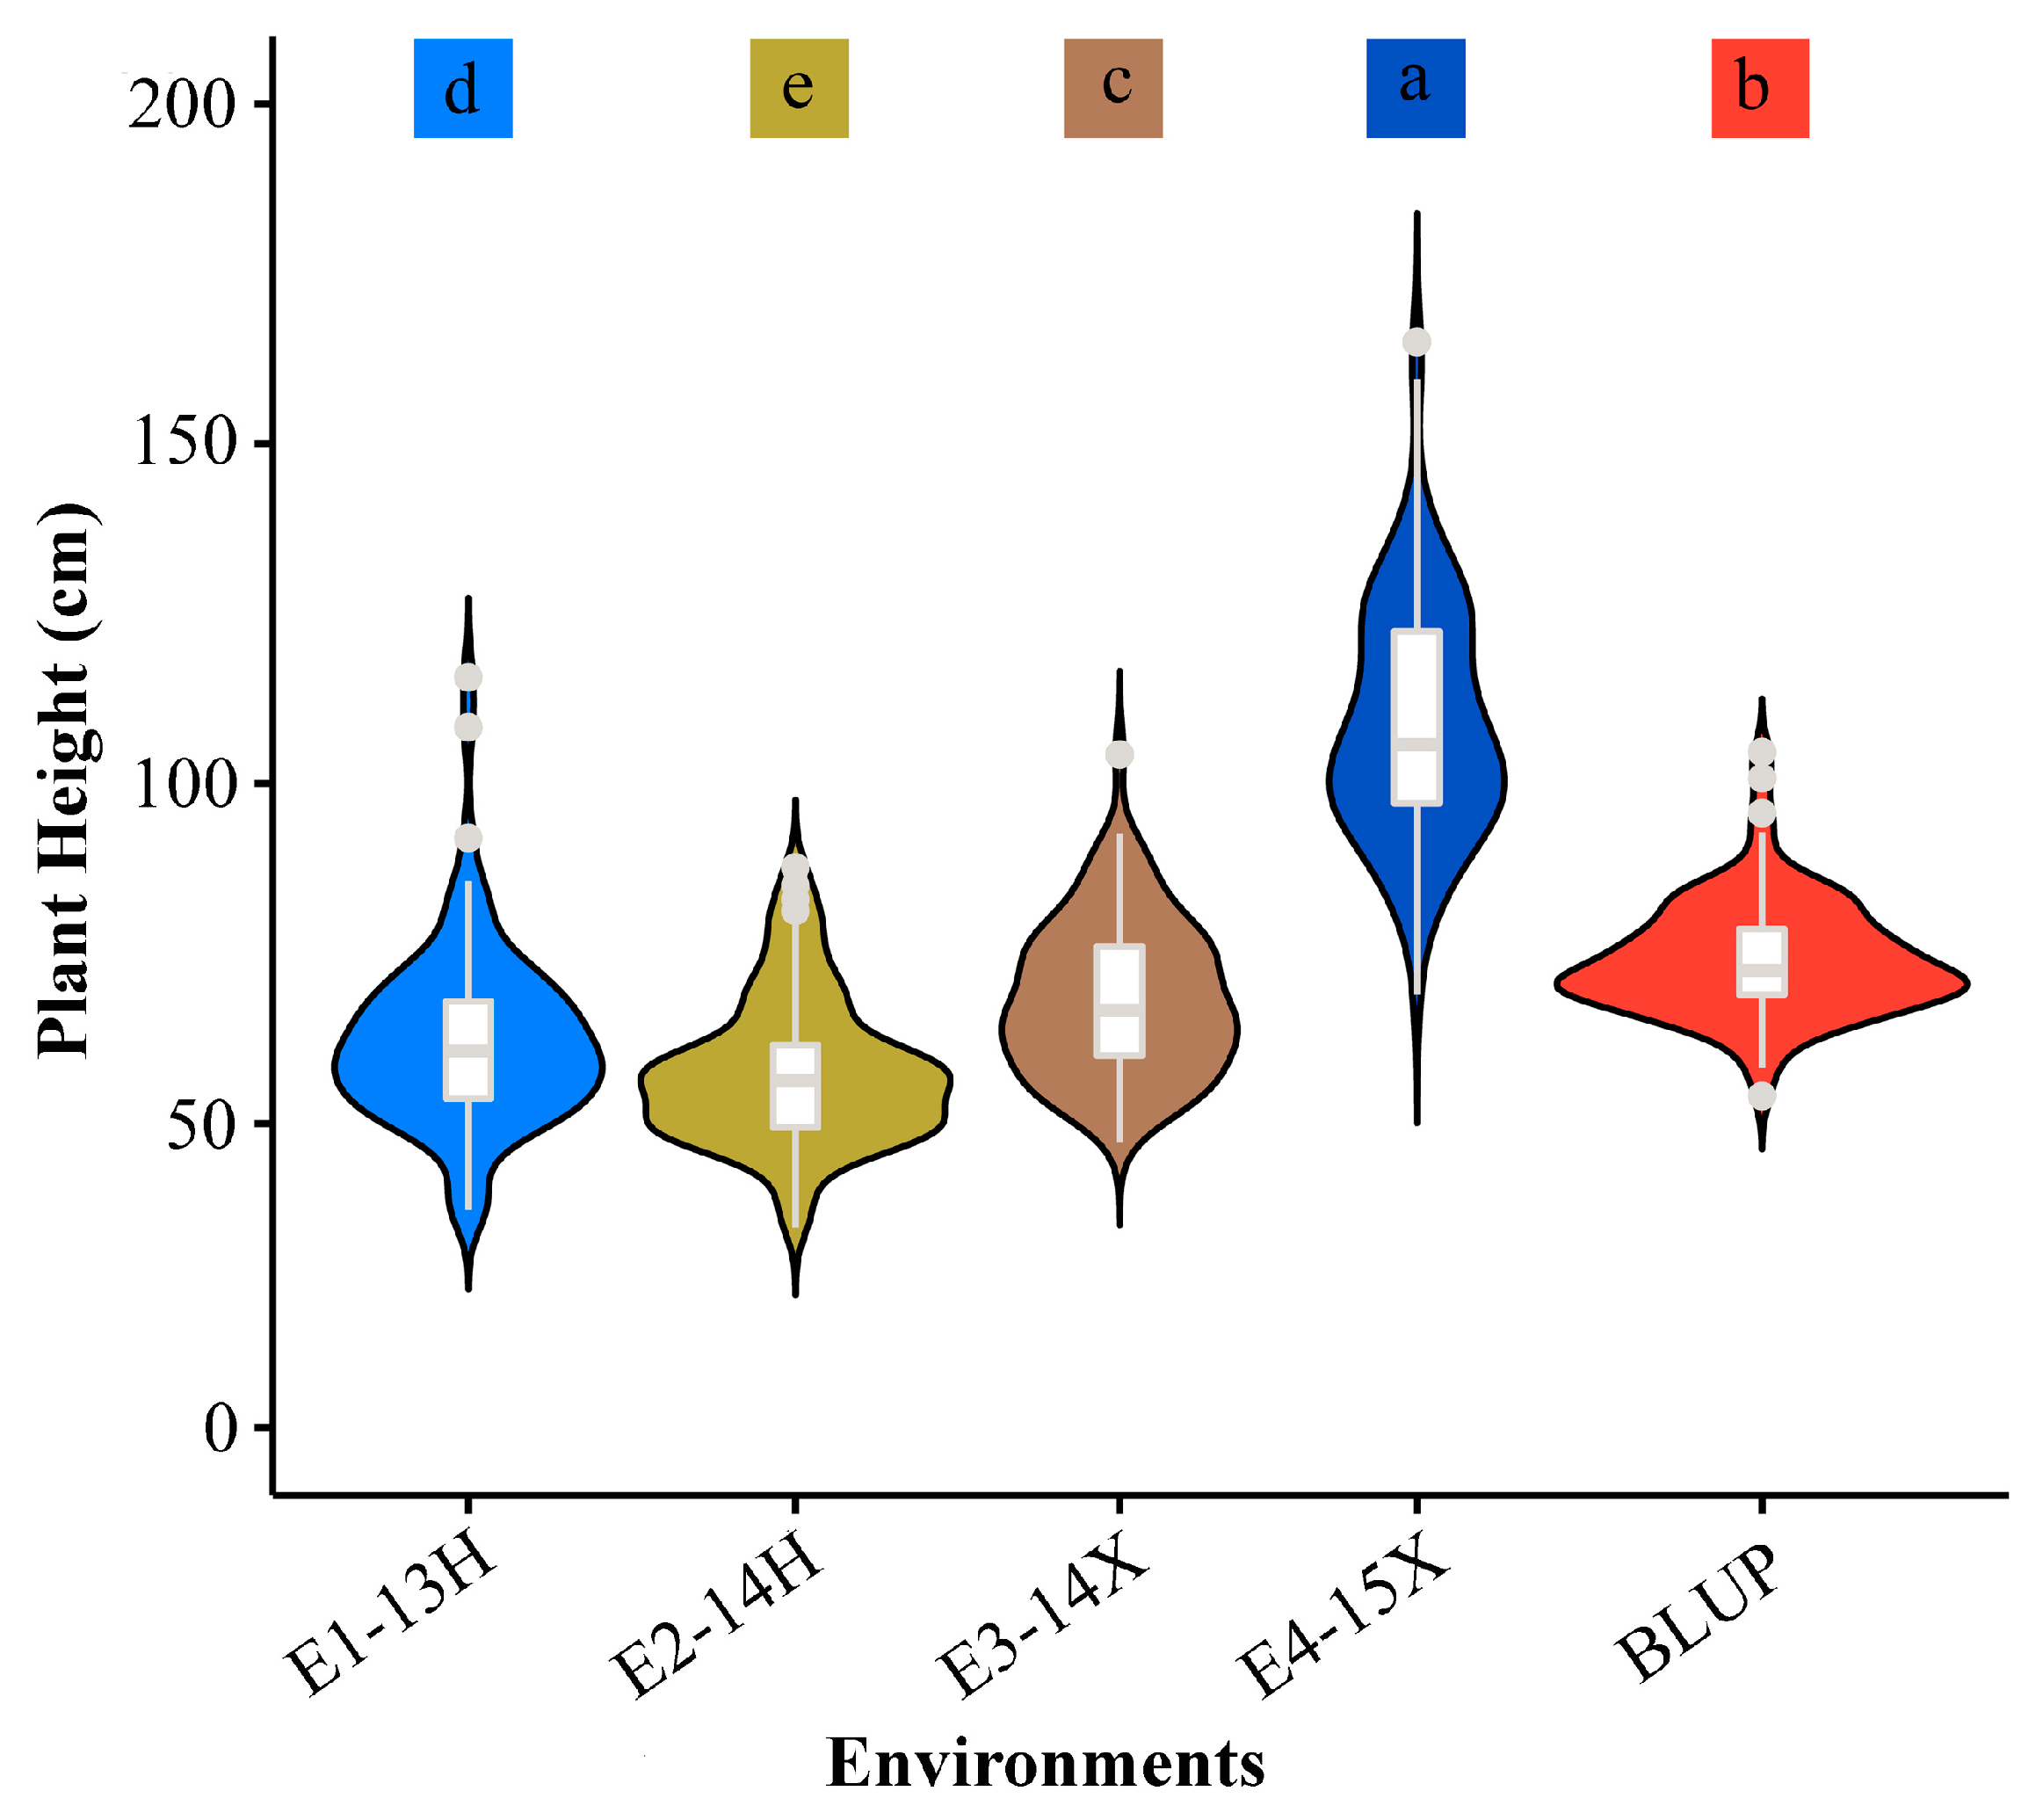
3.1. Phenotypic Evaluation for Plant Height

E1-13H, E2-14H, E3-14X, and E4-15X had mean ± SD values for PH of 62.20 ± 12.95 cm, 57.55 ± 10.73 cm, 68.25 ± 11.23 cm, and 108.80 ± 17.37 cm, respectively, ranging from 37.33–115.67 cm, 34.70–87.70 cm, 47.30–104.30 cm, and 69.00–165.00 cm (Table 1; Figure 1). The corresponding CV values were 23.39, 18.64, 16.46, and 15.96% (Table 1). The high CV values across different environments showed wide phenotypic variation among all accessions suitable for association analysis. The frequency distributions for PH across four environments are displayed in violin plots (Figure 1). The average kurtosis and skewness across environments were 1.18 and 0.77, respectively (Table 1). The distributions indicated a high level of variability and followed a normal distribution (Figure 1). Plant height was significantly affected by genotype, environment, and the genotype × environment interaction at p ≤ 0.01, indicating that environmental factors significantly influence PH variation (Table 1). The broad-sense heritability (h2B) ranged from 78.93 to 87.09%, suggesting that PH is influenced more by genetic factors than environmental factors (Table 1).

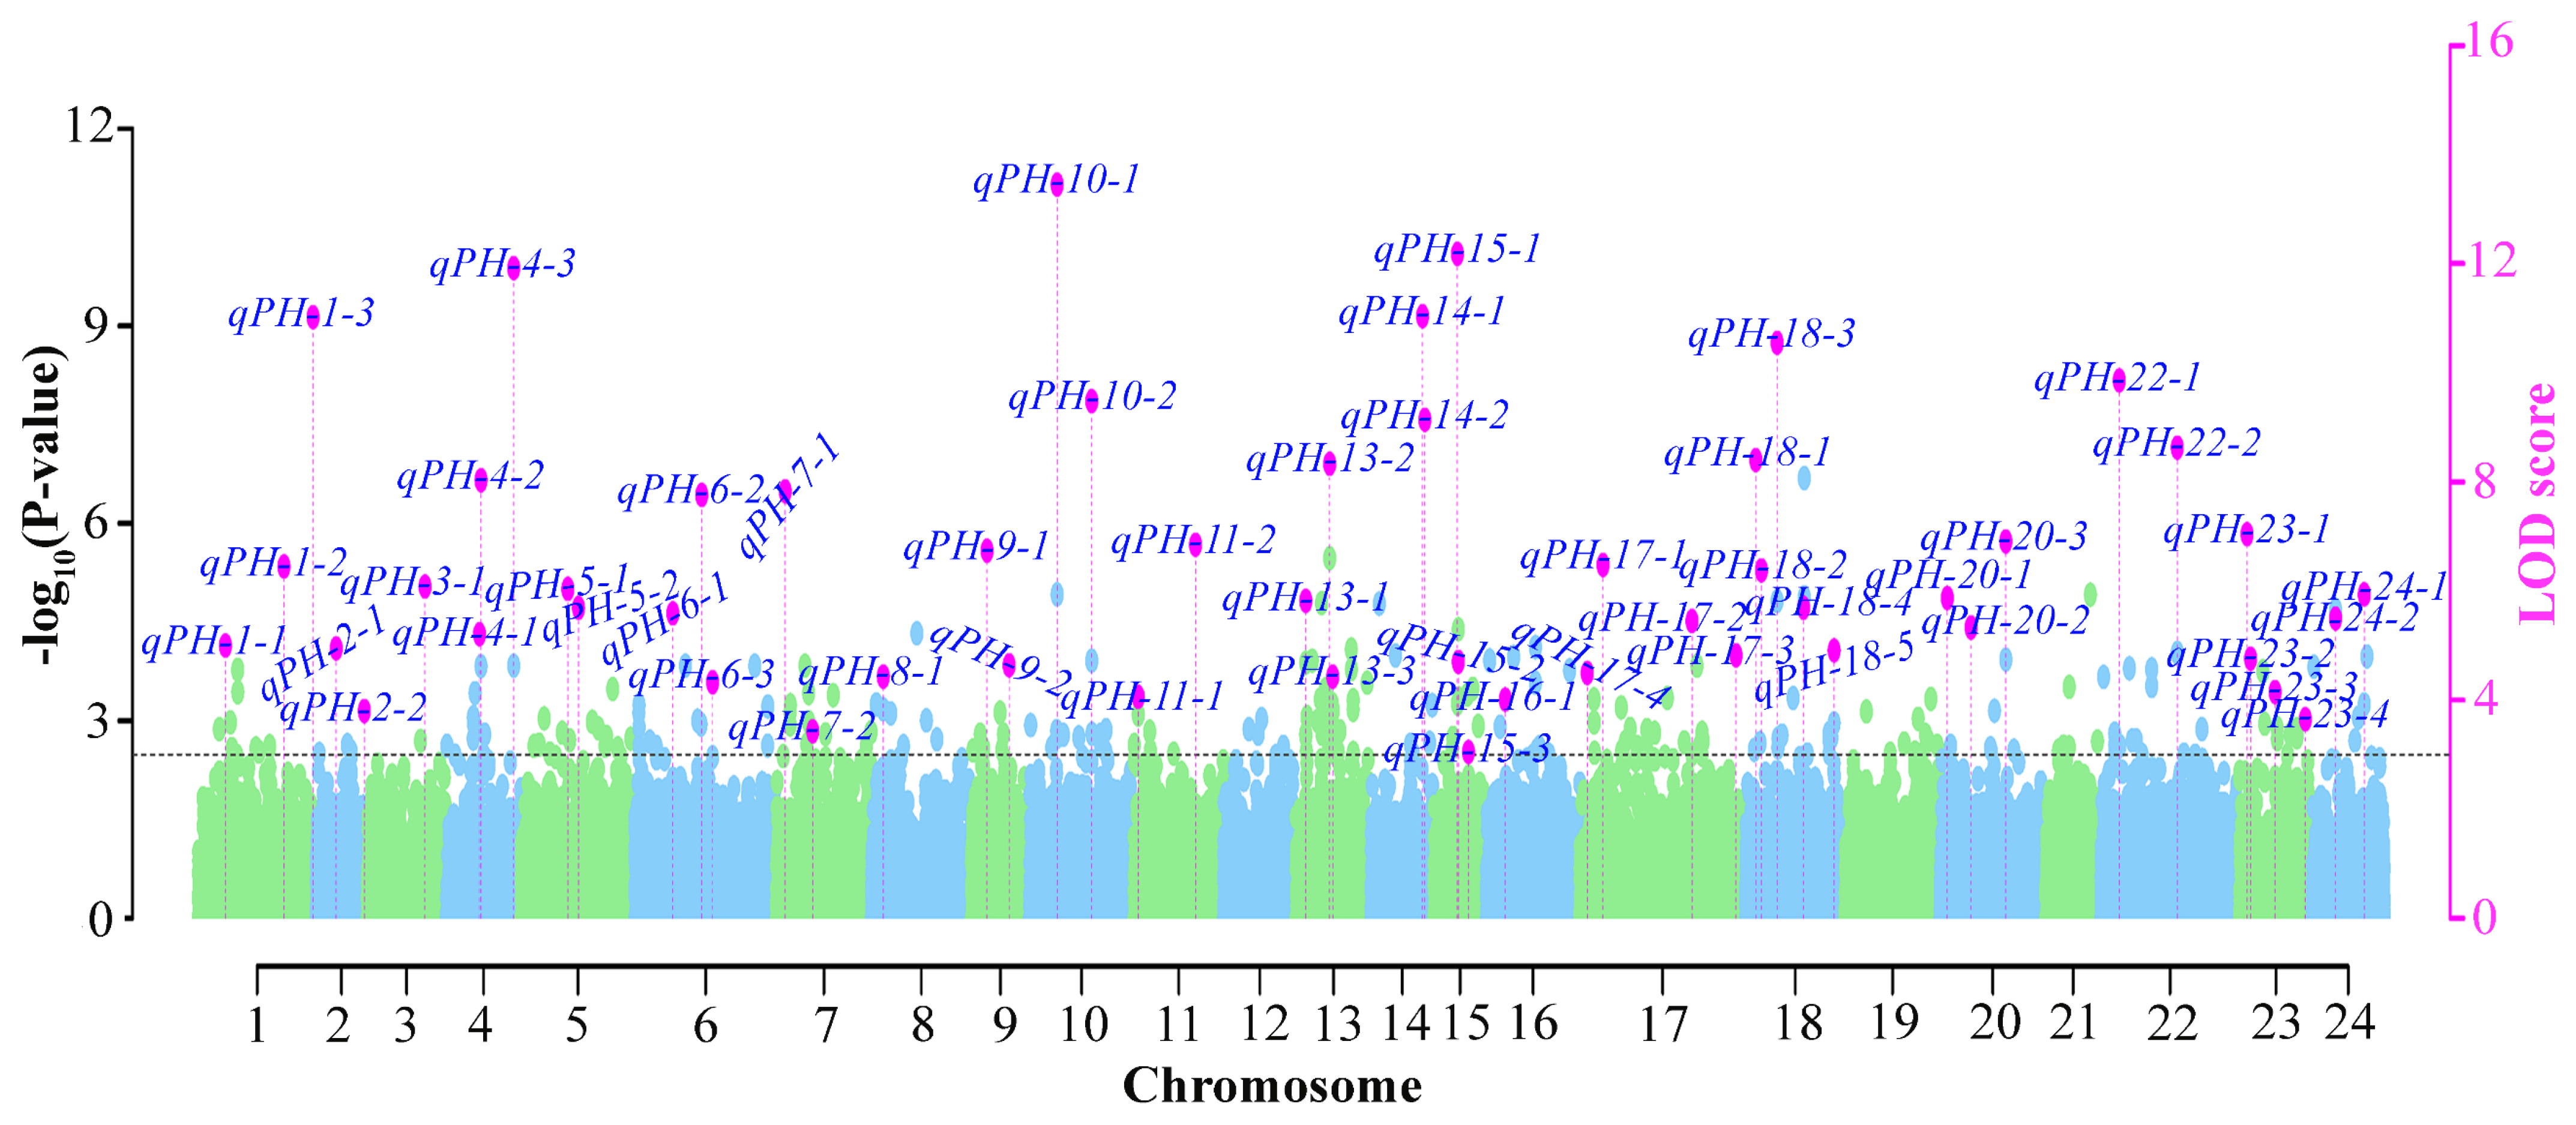
3.2. Genome-Wide Association Mapping for Plant Height

The four ML-GWAS models (K + Q) identified 181 significant QTNs across four environments/BLUP at LOD ≥ 3 (Table S1; Figure 2a and Figure 3). Among these, 39, 48, 43, 40, and 28 were detected in E1-13H, E2-14H, E3-14X, E4-15X, and BLUP, respectively; LOD scores ranged from 3.08–9.14, 3.03–13.45, 3.04–9.14, 3.03–11.08, and 3.01–11.64 (Table S1; Figure 2a). The phenotypic variance explained (PVE) for these QTNs ranged from 1.05–19.66%, 0.69–23.19%, 0.001–17.45%, 1.40–17.57%, and 1.06–25.37%, respectively (Table S1). Of these QTNs, mrMLM, FASTmrMLM, ISIS EM-BLASSO, and pLARmEB detected 9–20, 11–14, 10–16, and 5–22 QTNs across the four environments and BLUP, respectively (Table S1; Figure 2d). The PVE values ranged from 1.05–25.37%, 2.09–24.75%, 0.69–23.19%, and 0.64–17.57%, while LOD scores ranged from 3.03–12.77, 3.13–11.93, 3.01–12.17, and 3.03–17.57, respectively (Table S1).
Moreover, two SL-GWAS models (Q + K) identified 29 significant QTNs for PH at p = 0.05/m (3.95 × 10⁻⁷) (Table S2; Figure 2b and Figure 3). Of these, 4, 3, 2, 6, and 16 were identified in E1-13H, E2-14H, E3-14X, E4-15X, and BLUP, respectively, with PVE values ranging from 16.45–13.86%, 3.46–10.62%, 9.27–9.98%, 9.56–15.31%, and 3.43–10.94% (Table S2). The MLM (Q + K) and FarmCPU (Q + K) detected 1–12 and 2–6 of these QTNs, respectively (Table S2; Figure 2b,d). Finally, the ML- and SL-GWAS models identified 203 significant QTNs for PH across the four environments/BLUP (Tables S1 and S2; Figure 2 and Figure 3), which were unevenly distributed on 23 chromosomes, with >15 QTNs located on Nt01, Nt04, Nt06, Nt10, Nt13, Nt17, Nt18, and Nt22 (Tables S1 and S2; Figure 3). The identified QTNs were not constant or located in the genomic regions of previously known QTNs/QTLs underlying PH in tobacco.

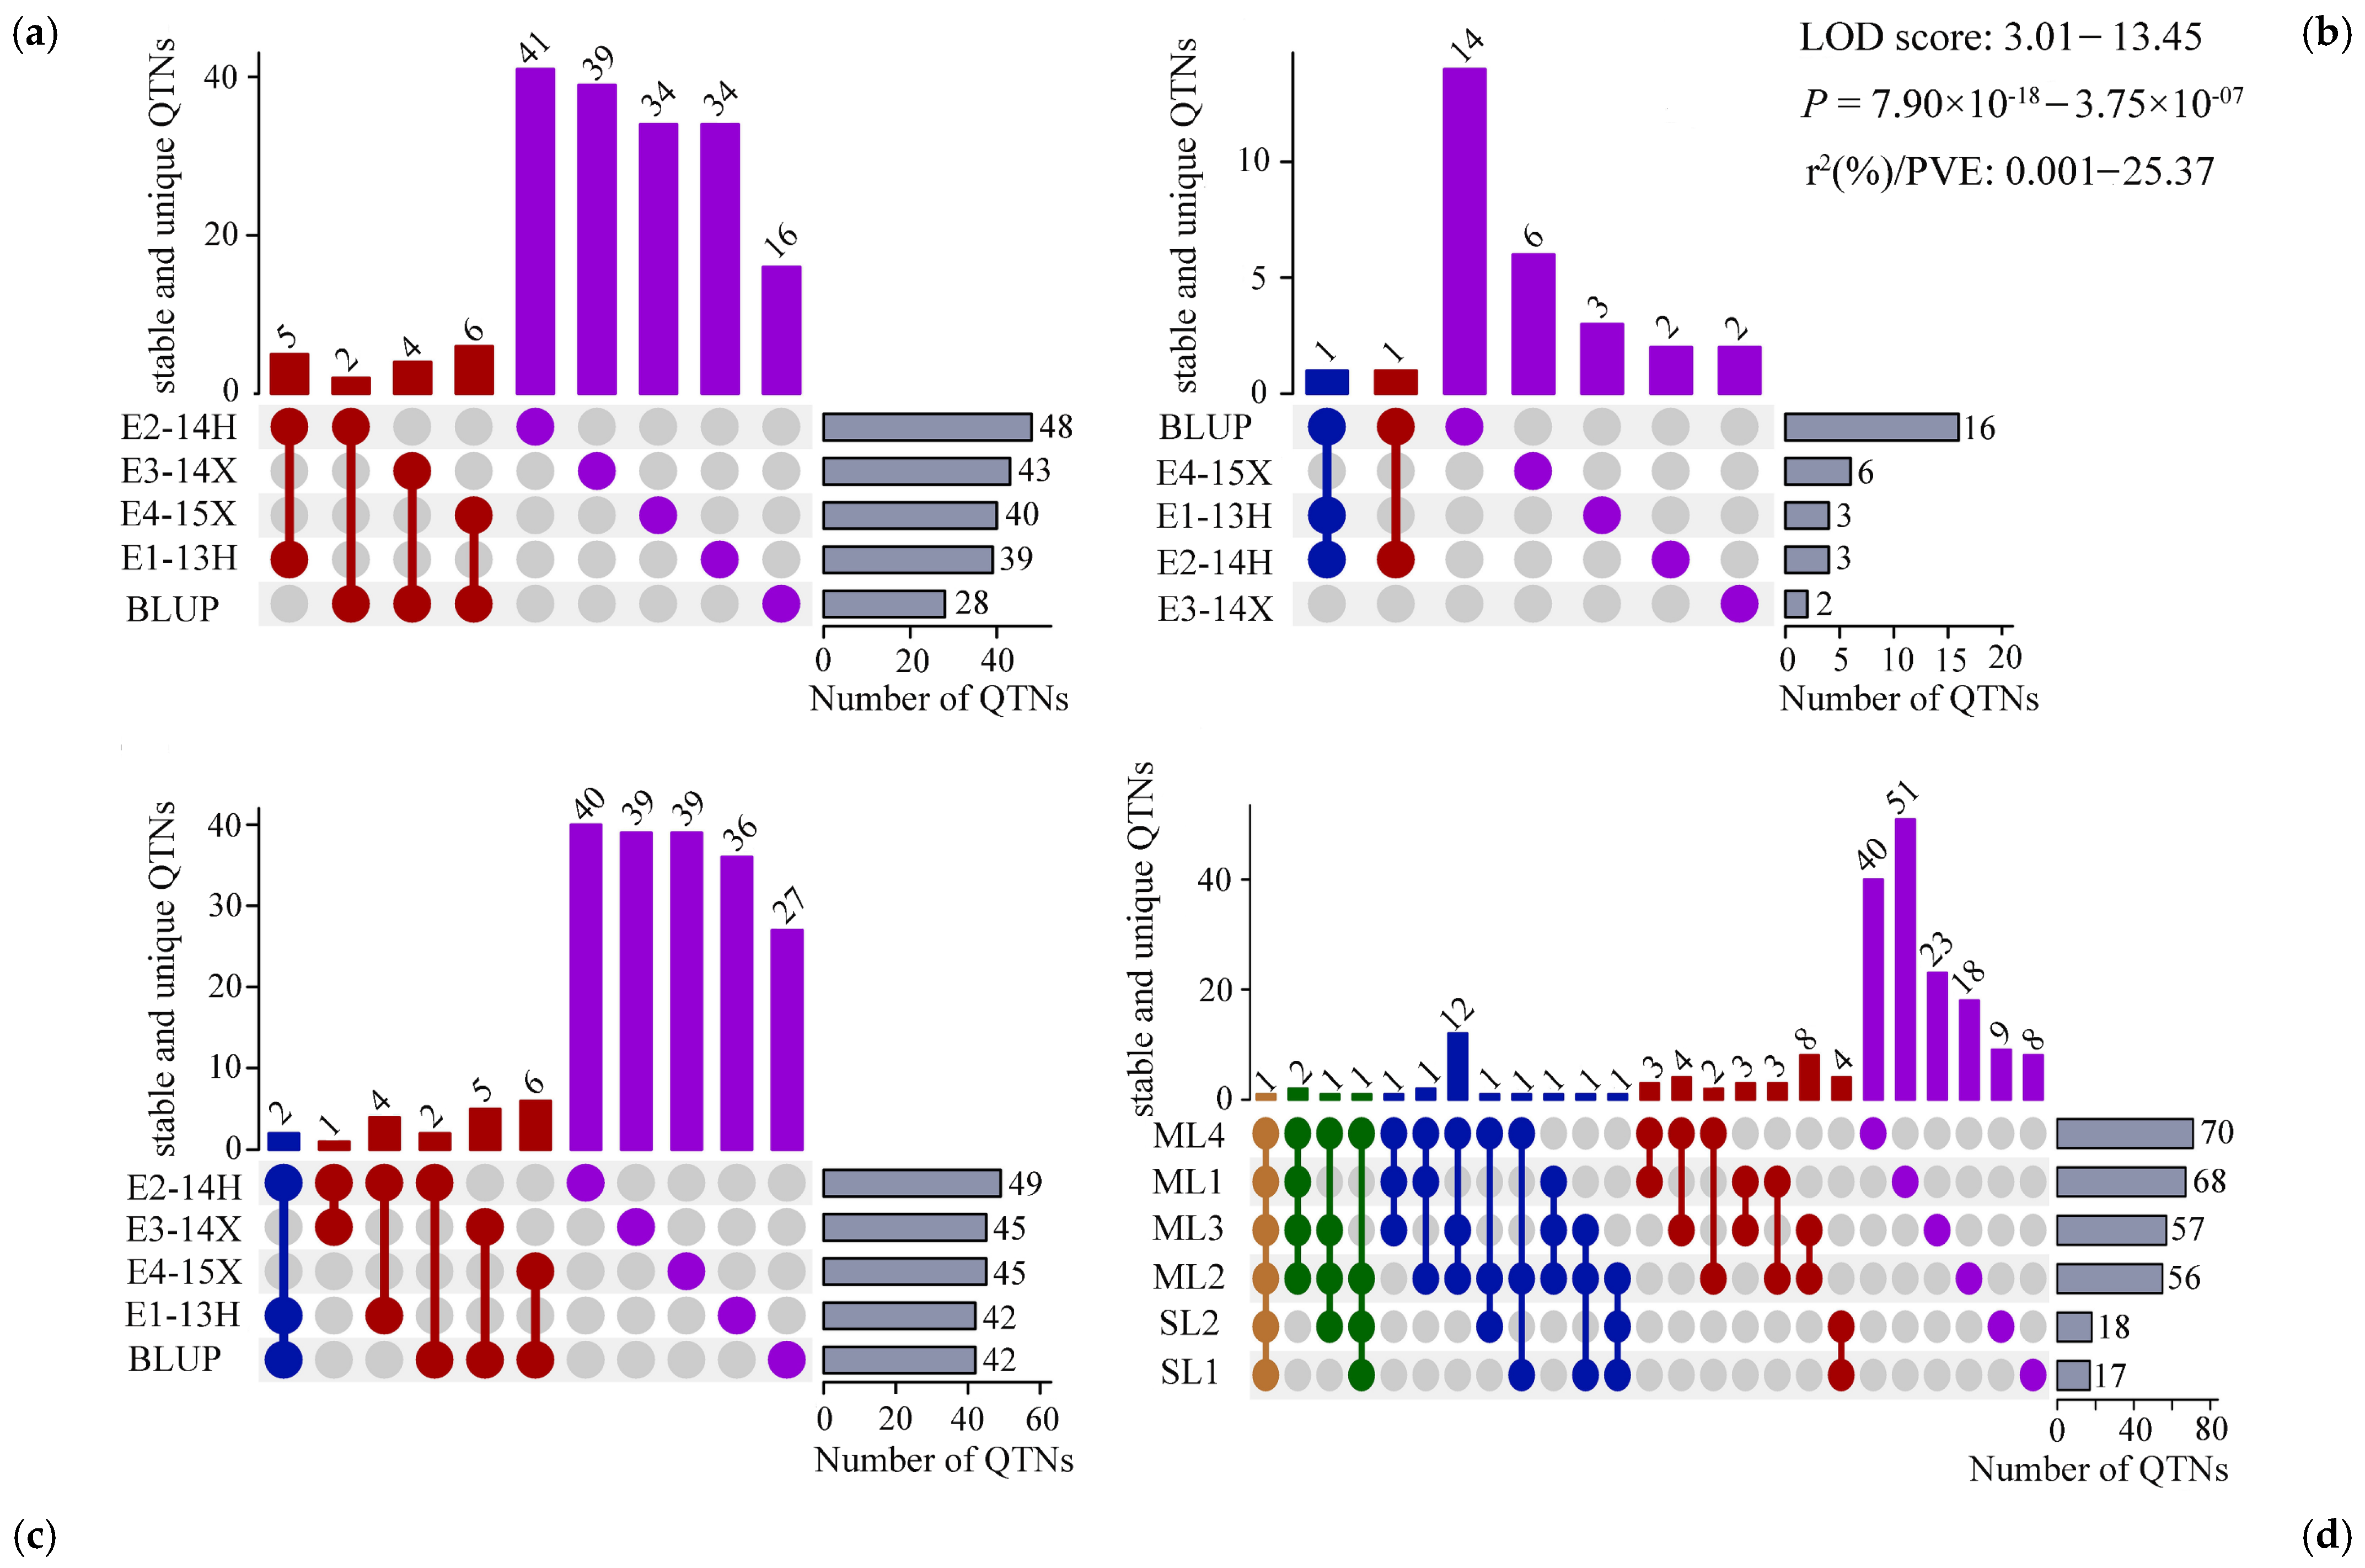
3.3. Identification of Stable Quantitative Trait Nucleotides

Fifty-two stable QTNs were identified in at least two environments/BLUP and/or SL/ML-GWAS models (Table S3; Figure 4 and Figure S1): 18 were repeatedly identified in environments (Table 2; Figure 2 and Figure 3), all 52 were repeatedly identified by methods (Table S3; Figure 4), and 19 were simultaneously detected in environments and methods (Table S3). The corresponding averaged LOD score and PVE values were 3.01–13.45 and 0.64–24.76%, respectively. Among the 18 environment-stable QTNs, qPH-18-3 and qPH-24-2 were detected in three environments, and the remaining 16 were identified in two environments by at least two methods (Table 2 and Table S3). Four QTNs, qPH-10-1, qPH-10-2, qPH-17-2, and qPH-22-2, were simultaneously detected in E1-13H and E2-14H (Table 2). Among the 52 method-stable QTNs, ML models detected 41, SL models detected five, and ML and SL models identified six (Table S3; Figure 2). For example, all six SL and ML models in E4-15X detected qPH-14-1, with PVE and LOD values ranging from 4.25–11.48 and 4.26–12.61%. Two stable QTNs, qPH-9-2 and qPH-20-3 were detected via all four ML-GWAS models in two and one environments, respectively, with a PVE ranging from 9.85–11.48% (Table S3). All SL-GWAS models identified qPH-15-3, qPH-24-2, qPH-2-2, qPH-15-2, and qPH-17-4, while two ML models and one SL model identified qPH-4-3, qPH-14-1, qPH-13-2, qPH-17-3, qPH-18-4, and qPH-18-3 in different environments (Table S3).

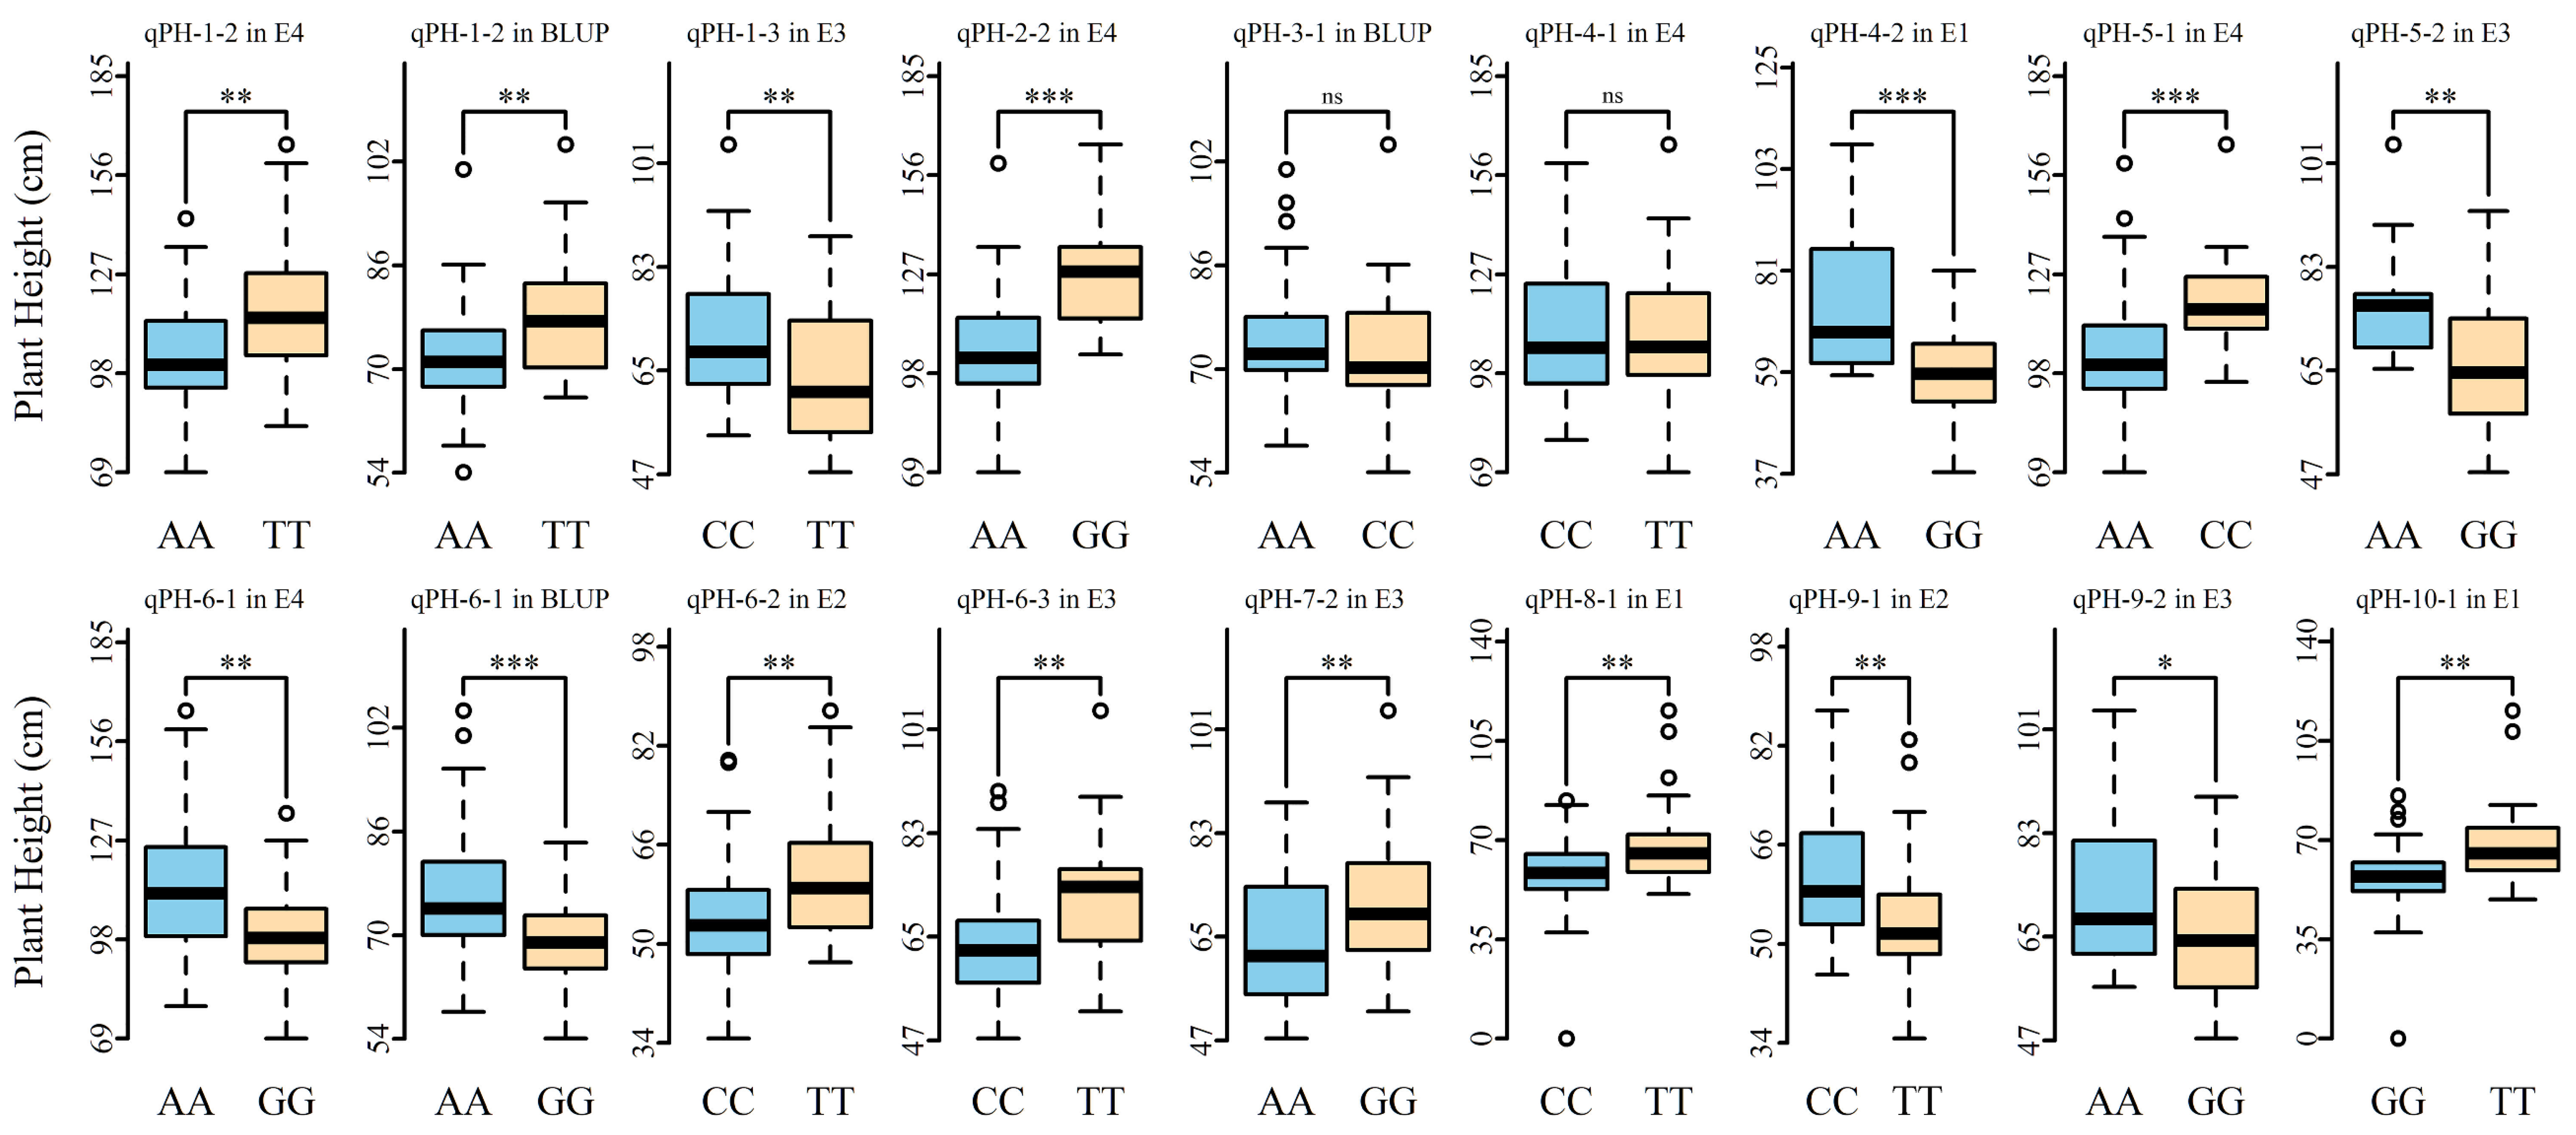
3.4. Allelic Effects of Stable QTNs for Plant Height in Multiple Environments

The application of identified QTNs associated with target traits is the prime objective in breeding programs; therefore, it is important to find elite alleles for MAS. The 52 stable QTNs were used to determine the elite alleles and their alternative alleles for PH based on their QTN effect values (Table S3). qPH-1-1, qPH-1-3, qPH-7-1, qPH-10-2, and qPH-16-1 exhibited the highest positive effects, with 2.62–3.71 cm, 5.12–5.71 cm, 6.06–7.27 cm, 5.48–6.20 cm, and 3.85–4.40 cm on PH in different environments, respectively; alleles with genotype code ‘1’ were considered elite alleles (Table S3). Seven QTNs, qPH-5-1, qPH-6-1, qPH-10-1, qPH-13-3, qPH-17-1, qPH-18-3, and qPH-23-1, had negative effects, with −10.41 to −5.7 cm, −9.12 to −2.92 cm, −10.41 to −4.6 cm, −4.42 to −3.98 cm, −5.97 to −4.74 cm, −6.35 to −4.72 cm, and −8.39 to −5.86 cm on PH, respectively; alleles with genotype code ‘−1’ were considered elite alleles (Table S3).
Furthermore, the phenotypic values of 94 accessions in four environments were used to confirm phenotypic differences between elite and alternative alleles at p ≤ 0.05 (Table S4; Figure 5, Figure S2 and Figure S4). As a result, 49 of 52 QTNs had significant phenotypic differences across two alleles, e.g., allele TT on locus qPH-1-2 had a significantly higher mean (77.64–116.28 cm) than the alternative allele AA (72.05–103.72 cm) (Figure 5). For qPH-11-2, 70 accessions had the CC elite allele contributing to taller plants (77.01 cm), whereas 20 accessions had the TT alternative allele contributing to shorter plants (65.22) (Table S4; Figure S2). Similarly, six QTNs, qPH-4-2, qPH-5-1, qPH-11-2, qPH-15-2, qPH-18-5, and qPH-23-1, had AA (76.2 cm), CC (118.73 cm), TT (77.01 cm), CC (115.53 cm), AA (65.25 cm), and CC (114.97 cm) elite alleles that significantly increased plant height compared to their alternative alleles GG (58.63 cm), AA (104.59 cm), CC (65.22 cm), TT (106.36 cm), GG (55.8 cm), and TT (102.36 cm), respectively.

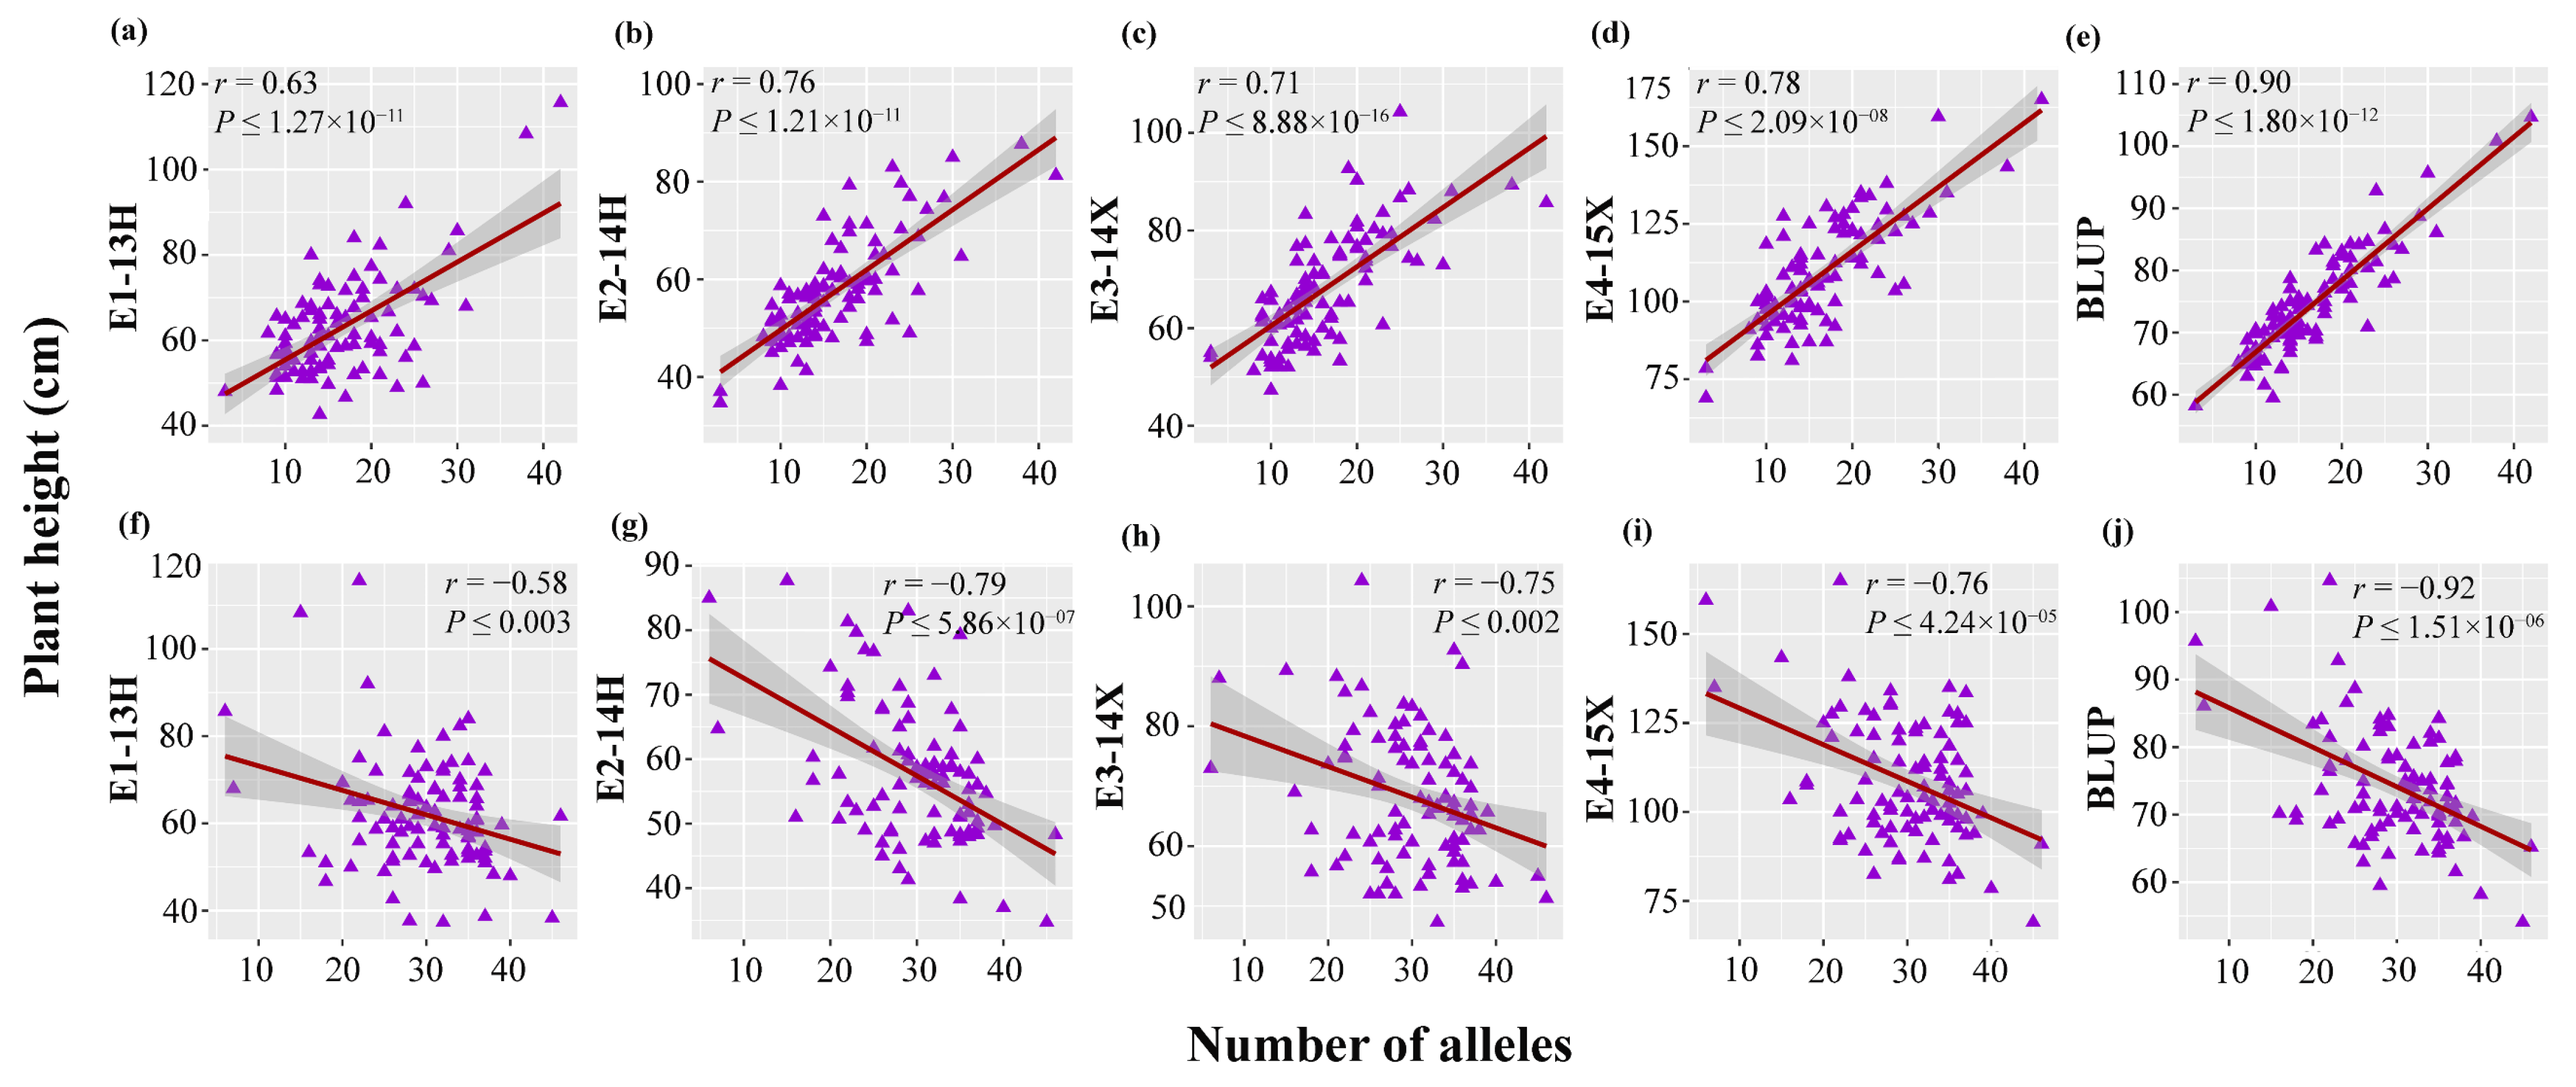
3.5. Distribution of Elite Alleles in Mapping Population and cross Combination in Two Directions

Using 49 validated QTNs, 5 (5.31%) to 73 (77.65%) accessions contained elite alleles of each QTN, while 11 (11.70%) to 89 (94.68%) accessions contained alternative alleles (considered elite alleles for shorter plants) of each QTN in the mapping population (Table S5). The 94 accessions had 3 (6.12%) to 42 (85.17) elite alleles for taller plants and 6 (11.51%) to 46 (88.46%) alternative alleles for shorter plants (Table S6). Moreover, Qinggeng, 81–26, KY14, H66B, and S1640 had 42, 38, 31, 30, and 27 elite alleles, respectively, while C319, K399, NC82, K394, and C206 had 46, 45, 40, 39, and 38 alternative alleles, respectively (Table S6). The correlation analysis revealed significant positive correlations between the number of elite alleles and plant height in E1-13H (r = 0.63), E2-14H (r = 0.76), E3-14X (r = 0.71), E4-15X (r = 0.78), and BLUP (r = 0.90) (Figure 6a,e) and significant negative correlations between the number of alternative alleles and plant height in E1-13H (r = −0.58), E2-14H (r = −0.79), E3-14X (r = −0.75), E4-15X (r = −0.76), and BLUP (r = −0.92) (Figure 6f,j). The strong correlations indicate that the pyramiding of elite alleles for target traits has potential for molecular tobacco breeding. Based on these findings, the seven best cross combinations were predicted for taller and shorter plants (Table 3). The Qinggeng (42 alleles and 111.91 cm height) × KY14 (31 alleles and 88.92 cm height) cross could produce 47 elite alleles for taller plants. Similarly, the K399 (45 alleles and 49.25 cm height) × C319 (46 alleles and 54.37 cm height) cross could produce 49 alleles for shorter plants (Table 3).

3.6. Identification of Candidate Genes Based on Stable QTNs

Based on the ±95 kb LD decay of each QTN, 291 genes were mined in the vicinity of 49 stable QTNs, of which 158 were homologous in A. thaliana. These genes were used to conduct a GO enrichment analysis, which identified 45, 41, and 54 genes (adjusted p-value ≤ 0.05) belonging to BP, MF, and CC terms (Figure S5a,c). The KEGG enrichment analysis identified 24 genes (adjusted p-value ≤ 0.05) involved in 39 KEGG pathways (Figure S5d). Finally, the literature search and comparative genomic, GO, and KEGG enrichment analyses revealed 27 candidate genes directly or indirectly associated with tobacco plant height (Table S7), of which 9 and 18 were located upstream and downstream of the QTNs. For instance, qPH-1-3 at Nt01_131577600 had Nitab4.5_0002209g0240 at 32.03 kb upstream; this gene codes gibberellin 2-oxidase 1 (GA2OX1) protein and participates in the biosynthesis of secondary metabolites (nta01110). Similarly, qPH-5-2 at Nt05_56540078 had Nitab4.5_0001598g0010 and Nitab4.5_0001598g0020 at 81.37 and 94.00 kb downstream and upstream, respectively, which encodes transcription factor IIB 2 (TFIIB2) and participates in basal transcription factors (nta03022) (Table S7). Moreover, ATL1, RLK, and SIF3 were related to the cellular protein modification process (GO:0006464), HKT1, LIG1, PIP1;4, and UPL5 were involved in the stress response (GO:0006950); CLASP and CDF3 were involved in the cell cycle (GO:0007049)/cell division (GO:0051301); and SCN1, PRK5, and AP2 were related to cell differentiation (GO:0030154)/cell morphogenesis (GO:0000902) (Table S7).

4. Discussion

Tobacco is an economically vital crop and is a model plant for genomic and genetic research [68]. This study focused on tobacco plant height for several reasons. Firstly, tobacco crop is grown for its leaves rather than its reproductive parts, and PH is strongly correlated with leaf number and geographical adaptation [69]. Therefore, manipulating PH would be valuable for developing tobacco cultivars with improved yield and wide geographical adaptation. Secondly, PH is an essential factor for vegetative development and is typically quantitatively inherited [8,17]. In this study, the phenotypic analysis indicated that environmental factors significantly influence variation in PH and confirmed its heritability [2,3,70].
Given its importance and ease of measuring, PH is an excellent trait for investigating QTNs in tobacco by combining ML and SL GWAS models. This study identified 181 QTNs using four ML models (Table S1; Figure 2 and Figure 3) and 29 using two SL models in four environments (Table S2; Figure 2 and Figure 3), indicating that ML models are robust and of a high resolution. Similar results have been reported in other crops for quantitative traits, including cotton, soybean, maize, rice, and tobacco. For example, Xu et al. [71] identified more than 30 QTNs using ML models and less than 19 using SL models in the genetic dissection of maize starch pasting properties. Similarly, Cui et al. [72] reported the highest number of QTNs using ML models in the genetic dissection of rice salt tolerance traits. Some studies have recommended combining ML and SL methods to improve the detection power and robustness of GWAS [11,52,71]. The present study identified 52 stable QTNs in more than two environments/BLUP and/or methods, with 19 co-detected in multiple environments and 52 co-detected by multiple methods (Table 2 and Table S3; Figure 3 and Figure 4). Zhang et al. [63] suggested that method-stable QTNs are essential and reliable, similar to environment-stable QTNs. Similar studies have been published in soybean [52,53], tobacco [11], wheat [26], cotton [73], and rice [72]. Notably, 22 QTLs/QTNs have been reported for tobacco plant height [8,17,19]; the 52 QTNs identified in this study did not overlap these 22 QTLs/QTNs, and they are thus considered novel QTNs, eliminating some constraints of genetic mapping and providing opportunities to identify useful markers for breeding [74].
We identified significant phenotypic differences between the elite and alternative alleles of 49 QTNs (Figure 5, Figure S3 and Figure S4), with 3–42 elite and 6–46 alternative alleles revealed in the mapping population (Tables S5 and S6), which can be used to breed taller or shorter plant varieties according to the desired traits. We predicted the best crosses using these alleles to develop RILs in two directions (Table 3). A single parent was involved in multiple crosses, similar to previous studies [52,53,75,76]. The pyramiding concept has been used in rice breeding to develop cultivars for larger grain [76]. Tian et al. [75] developed the high-yielding rice variety LYP9 by pyramiding elite alleles through molecular breeding. These new elites and alternative alleles will improve tobacco plant height/architecture through marker-assisted breeding.
This study identified 27 candidate genes associated with plant growth, cell division, cell cycle, hormone-related, and stress response (Table S7). For example, Nitab4.5_0000472g0020 was homologous to the AP2 genes in A. thaliana, which act as crucial regulators of many plant developmental processes [77]. The AP2 protein may function in flower development and organogenesis in the water lily [77] and is a promising gene for PH improvement. Likewise, Nitab4.5_0000343g0250 encodes RING-box 1 (ROC1); mutant roc1 in Arabidopsis reduces stem elongation and increases shoot branching [78]. Nitab4.5_0000322g0110 encodes the NAC domain transcriptional regulator (ATAF1); overexpression of ATAF1 in Arabidopsis increased plant sensitivity to ABA (Table S7) [79]. Moreover, Nitab4.5_0004414g0010 is homologous to AT1G08130.1 and encodes DNA ligase 1 (LIG1); a LIG1 mutant had a severely stunted and stressed growth phenotype [80]. Nitab4.5_0000052g0420 was homologous to AT1G70300 (KUP6) in A. thaliana; KUP6 maintained cytoplasmic K+ levels during Na+-inhibited K+ uptake [81,82]. Nitab4.5_0000069g0010 encodes protein phosphatase 2A-2 (PP2A-2), involved in chloroplast avoidance movements, resulting in shorter plants [83,84]. In transgenic Arabidopsis, ALT1 (Nitab4.5_0002832g0010) induced severe growth inhibition and some cell death [85,86]. Similarly, Nitab4.5_0000197g0010 (VFB1) regulates plant growth and lateral root formation [87], while Nitab4.5_0001288g0090 is involved in pollen receptor and pollen tube growth [88].
Cytoplasmic linker-associated proteins (CLASPs) are important in the regulation of microtubule (MT) dynamics that play an essential role in plant growth and development in cotton [89] and Arabidopsis [90]. We identified that Nitab4.5_0000813g0100 encoded a CLIP-associated protein (Table S7). One important gene, Nitab4.5_0001711g0050, is homologous to AT2G38530 (CDF3) cell growth defect factor-3, involved in lipid transfer between membranes and the integrity of the cuticle–cell wall interface [91]. Nitab4.5_0001598g0010 and Nitab4.5_0001598g0020 contain TFIIB domains [92], with essential roles in pollen tube development and endosperm development. A TFIIB1 mutant had retarded pollen tube growth, impaired pollen tube guidance and reception, and abnormal endosperm development [93]. Three auxin-related genes, Nitab4.5_0001615g0140, Nitab4.5_0000627g0040 (AXR6), and Nitab4.5_0000052g0430 (KUP8), are involved in plant growth and development, lateral root growth [94], and regulating photosynthesis [95]. Nitab4.5_0003019g0010 (NPY2) controls the polar localization of auxin efflux carriers within cells and the direction of auxin transport [96,97]. We anticipate that this study’s findings can be used to determine the precise functions of genes that regulate the growth of tobacco plants and enhance the planning of mapping studies for implementing MAS.

5. Conclusions

This study co-identified 52 stable QTNs in multiple environments and multiple methods; 49 showed phenotypic differences for plant height. The elite and alternative alleles of these QTNs were used to predict the seven best cross combinations in two directions. A comparative genomic analysis, GO enrichment analysis, and KEGG enrichment analysis identified 27 potential candidate genes. These results will be helpful for future studies and breeding programs.

Supplementary Materials

The following supporting information can be downloaded at: https://www.mdpi.com/article/10.3390/agronomy12051047/s1, Figure S1: Number of stable QTNs detected for plant height in four environments/BLUP; Figure S2: Plant height phenotypic differences between elite and alternative alleles of each QTNs in multiple environments; Figure S3: Phenotypic differences between elite and alternative alleles of each QTNs; Figure S4: Phenotypic differences between elite and alternative alleles of each QTN for plant height in different environments; Figure S5: Gene ontology and KEGG pathway enrichment analyses for candidate genes identified based on stable QTNs using the KOBAS database; Table S1: Number of QTNs identified in different environments using four multi-locus GWAS models; Table S2: Number of QTNs identified in different environments using two single-locus GWAS models; Table S3: Number of stable QTNs detected by multiple methods and/or in multiple environments/BLUP; Table S4: Alleles of stable QTNs indicating phenotypic differences in different environments; Table S5: Distribution of elite and alternative alleles in 94 tobacco accessions; Table S6: Distribution of alleles in stable QTNs among 94 accessions; Table S7: Candidate genes around stable QTNs for plant height in tobacco.

Author Contributions

P.G. and J.C. conceived and designed the experiments; R.L. (Ruiqiang Lai), Y.X., R.L. (Ronghua Li), W.Z., and M.I. performed the experiments and analyzed data; Y.X., M.I., R.L. (Ronghua Li), and W.Z. contributed reagents/materials/analysis tools; M.I., R.L. (Ruiqiang Lai), R.L. (Ronghua Li), Y.X., K.H.M.S., J.C., and P.G wrote the paper. All authors have read and agreed to the published version of the manuscript.

Funding

This work was funded by the Scientific and Technological Projects of Guangdong Tobacco Monopoly Bureau (201702) and Guangdong Tobacco Industrial Limited Company (2021440000340013, 2019440000340046).

Institutional Review Board Statement

Not applicable.

Informed Consent Statement

Not applicable.

Data Availability Statement

The sequence read data for the 94 sequenced tobacco accessions are available in the NCBI Sequence Read Archive (SRA) under the accession number PRJNA759331 (https://www.ncbi.nlm.nih.gov/sra/PRJNA759331 (Submitted on 28 August 2021)).

Acknowledgments

All the authors would like to thank the Nanxiong Research Institutes of Guangdong Tobacco Co., Ltd., for providing tobacco accessions.

Conflicts of Interest

The authors declare that there are no competing interest.

References

  1. Sierro, N.; Battey, J.N.D.; Ouadi, S.; Bakaher, N.; Bovet, L.; Willig, A.; Goepfert, S.; Peitsch, M.C.; Ivanov, N.V. The tobacco genome sequence and its comparison with those of tomato and potato. Nat. Commun. 2014, 5, 3833. [Google Scholar] [CrossRef] [PubMed]
  2. Nanda, C.; Sarala, K.; Nagesh, P.; Ramakrishnan, S. Heritability and genetic variability studies in the germplasm accessions of flue cured Virginia tobacco (Nicotiana tobaccum L.). Emergent Life Sci. Res. 2021, 07, 36–39. [Google Scholar] [CrossRef]
  3. Ahmed, S.; Mohammad, F. Heritability estimates and correlation analysis for production traits in fcv tobacco. Sarhad J. Agric. 2017, 33, 212–219. [Google Scholar] [CrossRef]
  4. Berbeć, A.K.; Matyka, M. Biomass characteristics and energy yields of tobacco (Nicotiana tabacum L.) cultivated in eastern Poland. Agriculture 2020, 10, 551. [Google Scholar] [CrossRef]
  5. Gong, D.; Huang, L.; Xu, X.; Wang, C.; Ren, M.; Wang, C.; Chen, M. Construction of a high-density SNP genetic map in flue-cured tobacco based on SLAF-seq. Mol. Breed. 2016, 36, 100. [Google Scholar] [CrossRef]
  6. Robinson, H.F.; Mann, T.; Comstock, R.E. An analysis of quantitative variability in Nicotiana tabacum. Heredity 1954, 8, 365–376. [Google Scholar] [CrossRef] [Green Version]
  7. Basit, A.; Farhan, M.; Mo, W.D.; Ding, H.X.; Ikram, M.; Farooq, T.; Ahmed, S.; Yang, Z.F.; Wang, Y.; Hashem, M.; et al. Enhancement of resistance by poultry manure and plant hormones (salicylic acid & citric acid) against tobacco mosaic virus. Saudi J. Biol. Sci. 2021, 28, 3526–3533. [Google Scholar]
  8. Cheng, L.; Yang, A.; Jiang, C.; Ren, M.; Zhang, Y.; Feng, Q.; Wang, S.; Gua, Y.; Luo, C. Quantitative trait loci mapping for plant height in tobacco using linkage and association mapping methods. Crop Sci. 2015, 55, 641–647. [Google Scholar] [CrossRef]
  9. Tong, Z.; Chen, X.; Fang, D.; Zeng, J.; Wu, X.; Xiao, B. SSR marker-based analyses on genetic diversity and relevant variations of agronomic traits and chemical composition of 231 flue-cured tobacco germplasm resources. Acta Tab. Sin. 2017, 23, 31–58. [Google Scholar]
  10. Tang, Z.; Chen, L.; Chen, Z.; Fu, Y.; Sun, X.; Wang, B.; Xia, T. Climatic factors determine the yield and quality of Honghe flue-cured tobacco. Sci. Rep. 2020, 10, 19868. [Google Scholar] [CrossRef]
  11. Lai, R.; Ikram, M.; Li, R.; Xia, Y.; Yuan, Q.; Zhao, W.; Zhang, Z.; Siddique, K.H.M.; Guo, P. Identification of novel quantitative trait nucleotides and candidate genes for bacterial wilt resistance in tobacco (Nicotiana tabacum L.) using genotyping-by-sequencing and multi-locus genome-wide association studies. Front. Plant Sci. 2021, 12, 744175. [Google Scholar] [CrossRef] [PubMed]
  12. Badu-Apraku, B.; Adewale, S.; Paterne, A.; Gedil, M.; Asiedu, R. Identification of QTLs controlling resistance/tolerance to striga hermonthica in an extra-early maturing yellow maize population. Agronomy 2020, 10, 1168. [Google Scholar] [CrossRef]
  13. Nishi, T.; Tajima, T.; Noguchi, S.; Ajisaka, H.; Negishi, H. Identification of DNA markers of tobacco linked to bacterial wilt resistance. Theor. Appl. Genet. 2003, 106, 765–770. [Google Scholar] [CrossRef] [PubMed]
  14. Kizil, S.; Basak, M.; Guden, B.; Tosun, H.S.; Uzun, B.; Yol, E. Genome-wide discovery of indel markers in sesame (Sesamum indicum L.) using ddradseq. Plants 2020, 9, 1262. [Google Scholar] [CrossRef] [PubMed]
  15. Ma, Y.; Chhapekar, S.S.; Rameneni, J.J.; Kim, S.; Gan, T.H.; Choi, S.R.; Lim, Y.P. Identification of qtls and candidate genes related to flower traits and bolting time in radish (Raphanus sativus L.). Agronomy 2021, 11, 1623. [Google Scholar] [CrossRef]
  16. Chao, W.S.; Horvath, D.P.; Stamm, M.J.; Anderson, J.V. Genome-wide association mapping of freezing tolerance loci in canola (Brassica napus L.). Agronomy 2021, 11, 233. [Google Scholar] [CrossRef]
  17. Tong, Z.-J.; Jiao, F.-C.; Wu, X.-F.; Wang, F.-Q.; Chen, X.-J.; Li, X.-Y.; Gao, Y.-L.; Zhang, Y.-H.; Xiao, B.-G.; Wu, W.-R. Mapping of quantitative trait loci underlying six agronomic traits in flue- cured tobacco (Nicotiana tabacum L.). Acta Agron. Sin. 2013, 38, 1407–1415. [Google Scholar] [CrossRef]
  18. Li, R.H.; Carfi, L.; Lv, Y.H.; Xia, Y.S.; Wu, C.; Yu, Y.W.; Qiu, M.W.; Zhao, W.C.; Guo, P.G. Association analysis of MFLP markers with bacterial wilt resistance in tobacco. Proc. Environ. Sci. Biol. Eng. 2014, 1, 303–310. [Google Scholar]
  19. Tong, Z.; Xiu, Z.; Ming, Y.; Fang, D.; Chen, X.; Hu, Y.; Zhou, J.; He, W.; Jiao, F.; Zhang, C.; et al. Quantitative trait locus mapping and genomic selection of tobacco (Nicotiana tabacum L.) based on high-density genetic map. Plant Biotechnol. Rep. 2021, 15, 845–854. [Google Scholar] [CrossRef]
  20. Guo, P.; Baum, M.; Varshney, R.K.; Graner, A.; Grando, S.; Ceccarelli, S. QTLs for chlorophyll and chlorophyll fluorescence parameters in barley under post-flowering drought. Euphytica 2008, 163, 203–214. [Google Scholar] [CrossRef]
  21. Buckler IV, E.S.; Thornsberry, J.M. Plant molecular diversity and applications to genomics. Curr. Opin. Plant Biol. 2002, 5, 107–111. [Google Scholar] [CrossRef]
  22. Zhang, J.-S.; Wang, R.-G.; Yang, C.-Y.; Wu, C.; Shi, Y.-W.; Wang, Z.-H.; Wang, Y.; Ren, X.-L. Genetic diversity of agronomic traits and association analysis with SRAP markers in flue-cured tobacco (Nicotiana tabacum L) varieties from China and Abroad. Acta Agron. Sin. 2013, 38, 1029–1041. [Google Scholar] [CrossRef]
  23. Wang, Y.; Lv, H.; Xiang, X.; Yang, A.; Feng, Q.; Dai, P.; Li, Y.; Jiang, X.; Liu, G.; Zhang, X. Construction of a SNP fingerprinting database and population genetic analysis of cigar tobacco germplasm resources in China. Front. Plant Sci. 2021, 12, 618133. [Google Scholar] [CrossRef] [PubMed]
  24. Cui, Z.; Luo, J.; Qi, C.; Ruan, Y.; Li, J.; Zhang, A.; Yang, X.; He, Y. Genome-wide association study (GWAS) reveals the genetic architecture of four husk traits in maize. BMC Genom. 2016, 17, 946. [Google Scholar] [CrossRef] [PubMed] [Green Version]
  25. Safdar, L.B.; Almas, F.; Sarfraz, S.; Ejaz, M.; Ali, Z.; Mahmood, Z.; Yang, L.; Tehseen, M.M.; Ikram, M.; Liu, S.; et al. Genome-wide association study identifies five new cadmium uptake loci in wheat. Plant Genome 2020, 13, e20030. [Google Scholar] [CrossRef]
  26. Elhadi, G.M.I.; Kamal, N.M.; Gorafi, Y.S.A.; Yamasaki, Y.; Ban, Y.; Kato, K.; Tahir, I.S.A.; Ishii, T.; Tanaka, H.; Tsujimoto, H. Novel loci for kernel hardness appeared as a response to heat and combined heat-drought conditions in wheat harboring Aegilops tauschii diversity. Agronomy 2021, 11, 1061. [Google Scholar] [CrossRef]
  27. Reddy, V.R.P.; Das, S.; Dikshit, H.K.; Mishra, G.P.; Aski, M.S.; Singh, A.; Tripathi, K.; Pandey, R.; Bansal, R.; Singh, M.P.; et al. Genetic dissection of phosphorous uptake and utilization efficiency traits using gwas in mungbean. Agronomy 2021, 11, 1401. [Google Scholar] [CrossRef]
  28. Xia, Y.; Li, R.; Bai, G.; Siddique, K.H.M.; Varshney, R.K.; Baum, M.; Yan, G.; Guo, P. Genetic variations of HvP5CS1 and their association with drought tolerance related traits in barley (Hordeum vulgare L.). Sci. Rep. 2017, 7, 7870. [Google Scholar] [CrossRef] [Green Version]
  29. Xia, Y.; Li, R.; Ning, Z.; Bai, G.; Siddique, K.H.M.; Yan, G.; Baum, M.; Varshney, R.K.; Guo, P. Single nucleotide polymorphisms in HSP17.8 and their association with agronomic traits in barley. PLoS ONE 2013, 8, e56816. [Google Scholar] [CrossRef] [Green Version]
  30. Xia, Y.; Ning, Z.; Bai, G.; Li, R.; Yan, G.; Siddique, K.H.M.; Baum, M.; Guo, P. Allelic variations of a light harvesting chlorophyll a/b-binding protein gene (Lhcb1) associated with agronomic traits in barley. PLoS ONE 2012, 7, e37573. [Google Scholar] [CrossRef] [Green Version]
  31. Faccini, N.; Delbono, S.; Oǧuz, A.Ç.; Cattivelli, L.; Vale, G.; Tondelli, A. Resistance of european spring 2-row barley cultivars to pyrenophora graminea and detection of associated loci. Agronomy 2021, 11, 374. [Google Scholar] [CrossRef]
  32. Jain, M.; Moharana, K.C.; Shankar, R.; Kumari, R.; Garg, R. Genomewide discovery of DNA polymorphisms in rice cultivars with contrasting drought and salinity stress response and their functional relevance. Plant Biotechnol. J. 2014, 12, 253–264. [Google Scholar] [CrossRef]
  33. Wang, K.; Zhuang, J.Y.; Huang, D.R.; Ying, J.Z.; Fan, Y.Y. Genome-wide polymorphisms between the parents of an elite hybrid rice and the development of a novel set of PCR-based InDel markers. Genet. Mol. Res. 2015, 14, 3209–3222. [Google Scholar] [CrossRef] [PubMed]
  34. Xiao, Z.; Kong, C.; Han, F.; Yang, L.; Zhuang, M.; Zhang, Y.; Wang, Y.; Ji, J.; Li, Z.; Fang, Z.; et al. Two user-friendly molecular markers developed for the identification of hybrid lethality genes in brassica oleracea. Agronomy 2021, 11, 982. [Google Scholar] [CrossRef]
  35. Lee, G.J.; Lee, S.; Carter, T.E.; Shannon, G.; Boerma, H.R. Identification of soybean yield QTL in irrigated and rain-fed environments. Agronomy 2021, 11, 2207. [Google Scholar] [CrossRef]
  36. Bus, A.; Hecht, J.; Huettel, B.; Reinhardt, R.; Stich, B. High-throughput polymorphism detection and genotyping in Brassica napus using next-generation RAD sequencing. BMC Genom. 2012, 13, 281. [Google Scholar] [CrossRef] [Green Version]
  37. Barchi, L.; Lanteri, S.; Portis, E.; Acquadro, A.; Valè, G.; Toppino, L.; Rotino, G.L. Identification of SNP and SSR markers in eggplant using RAD tag sequencing. BMC Genom. 2011, 12, 304. [Google Scholar] [CrossRef] [Green Version]
  38. Rebetzke, G.J.; Richards, R.A. Gibberellic acid-sensitive dwarfing genes reduce plant height to increase kernel number and grain yield of wheat. Aust. J. Agric. Res. 2000, 51, 235–245. [Google Scholar] [CrossRef]
  39. Li, Z.F.; Guo, Y.; Ou, L.; Hong, H.; Wang, J.; Liu, Z.X.; Guo, B.; Zhang, L.; Qiu, L. Identification of the dwarf gene GmDW1 in soybean (Glycine max L.) by combining mapping-by-sequencing and linkage analysis. Theor. Appl. Genet. 2018, 131, 1001–1016. [Google Scholar] [CrossRef] [Green Version]
  40. Liu, B.; Watanabe, S.; Uchiyama, T.; Kong, F.; Kanazawa, A.; Xia, Z.; Nagamatsu, A.; Arai, M.; Yamada, T.; Kitamura, K.; et al. The soybean stem growth habit gene Dt1 is an ortholog of arabidopsis Terminal Flower1. Plant Physiol. 2010, 153, 198–210. [Google Scholar] [CrossRef] [Green Version]
  41. Salas Fernandez, M.G.; Becraft, P.W.; Yin, Y.; Lübberstedt, T. From dwarves to giants? Plant height manipulation for biomass yield. Trends Plant Sci. 2009, 14, 454–461. [Google Scholar] [CrossRef] [PubMed]
  42. Tang, L.; Xu, H.; Wang, Y.; Wang, H.; Li, Z.; Liu, X.; Shu, Y.; Li, G.; Liu, W.; Ying, J.; et al. Osabf1 represses gibberellin biosynthesis to regulate plant height and seed germination in rice (Oryza sativa L.). Int. J. Mol. Sci. 2021, 22, 12220. [Google Scholar] [CrossRef] [PubMed]
  43. Zhong, J.; Peng, Z.; Peng, Q.; Cai, Q.; Peng, W.; Chen, M.; Yao, J. Regulation of plant height in rice by the Polycomb group genes OsEMF2b, OsFIE2 and OsCLF. Plant Sci. 2018, 267, 157–167. [Google Scholar] [CrossRef] [PubMed]
  44. Zhang, Y.; Yu, C.; Lin, J.; Liu, J.; Liu, B.; Wang, J.; Huang, A.; Li, H.; Zhao, T. OsMPH1 regulates plant height and improves grain yield in rice. PLoS ONE 2017, 12, e0180825. [Google Scholar] [CrossRef] [Green Version]
  45. Ma, Z.; Wu, T.; Huang, K.; Jin, Y.M.; Li, Z.; Chen, M.; Yun, S.; Zhang, H.; Yang, X.; Chen, H.; et al. A Novel AP2/ERF transcription factor, OsRPH1, negatively regulates plant height in rice. Front. Plant Sci. 2020, 11, 709. [Google Scholar] [CrossRef]
  46. Teng, F.; Zhai, L.; Liu, R.; Bai, W.; Wang, L.; Huo, D.; Tao, Y.; Zheng, Y.; Zhang, Z. ZmGA3ox2, a candidate gene for a major QTL, qPH3.1, for plant height in maize. Plant J. 2013, 73, 405–416. [Google Scholar] [CrossRef]
  47. Li, H.; Wang, L.; Liu, M.; Dong, Z.; Li, Q.; Fei, S.; Xiang, H.; Liu, B.; Jin, W. Maize plant architecture is regulated by the ethylene biosynthetic gene ZmACS7. Plant Physiol. 2020, 183, 1184–1199. [Google Scholar] [CrossRef]
  48. Visscher, A.M.; Belfield, E.J.; Vlad, D.; Irani, N.; Moore, I.; Harberd, N.P. Overexpressing the multiple-stress responsive gene At1g74450 reduces plant height and male fertility in Arabidopsis Thaliana. PLoS ONE 2015, 10, e0140368. [Google Scholar]
  49. Zheng, M.; Zhang, L.; Tang, M.; Liu, J.; Liu, H.; Yang, H.; Fan, S.; Terzaghi, W.; Wang, H.; Hua, W. Knockout of two BnaMAX1 homologs by CRISPR/Cas9-targeted mutagenesis improves plant architecture and increases yield in rapeseed (Brassica napus L.). Plant Biotechnol. J. 2020, 18, 644–654. [Google Scholar] [CrossRef] [Green Version]
  50. Yang, M.; He, J.; Wan, S.; Li, W.; Chen, W.; Wang, Y.; Jiang, X.; Cheng, P.; Chu, P.; Shen, W.; et al. Fine mapping of the BnaC04.BIL1 gene controlling plant height in Brassica napus L. BMC Plant Biol. 2021, 21, 359. [Google Scholar] [CrossRef]
  51. Benavente, E.; Giménez, E. Modern approaches for the genetic improvement of rice, wheat and maize for abiotic constraints-related traits: A comparative overview. Agronomy 2021, 11, 376. [Google Scholar] [CrossRef]
  52. Ikram, M.; Han, X.; Zuo, J.F.; Song, J.; Han, C.Y.; Zhang, Y.W.; Zhang, Y.M. Identification of QTNs and their candidate genes for 100-seed weight in soybean (Glycine max L.) using multi-locus genome-wide association studies. Genes 2020, 11, 714. [Google Scholar] [CrossRef] [PubMed]
  53. Han, X.; Xu, Z.R.; Zhou, L.; Han, C.Y.; Zhang, Y.M. Identification of QTNs and their candidate genes for flowering time and plant height in soybean using multi-locus genome-wide association studies. Mol. Breed. 2021, 41, 39. [Google Scholar] [CrossRef]
  54. Hou, S.; Zhu, G.; Li, Y.; Li, W.; Fu, J.; Niu, E.; Li, L.; Zhang, D.; Guo, W. Genome-wide association studies reveal genetic variation and candidate genes of drought stress related traits in cotton (Gossypium hirsutum L.). Front. Plant Sci. 2018, 9, 1276. [Google Scholar] [CrossRef]
  55. Ma, L.; Liu, M.; Yan, Y.; Qing, C.; Zhang, X.; Zhang, Y.; Long, Y.; Wang, L.; Pan, L.; Zou, C.; et al. Genetic dissection of maize embryonic callus regenerative capacity using multi-locus genome-wide association studies. Front. Plant Sci. 2018, 9, 561. [Google Scholar] [CrossRef] [Green Version]
  56. Butorac, J.; Beljo, J.; Gunjača, J. Study of inheritance of some agronomic and morphological traits in burley tobacco by graphic analysis of diallel cross. Plant, Soil Environ. 2004, 50, 162–167. [Google Scholar] [CrossRef] [Green Version]
  57. Bates, D.; Mächler, M.; Bolker, B.M.; Walker, S.C. Fitting linear mixed-effects models using lme4. J. Stat. Softw. 2015, 67, 1–48. [Google Scholar] [CrossRef]
  58. Edwards, K.D.; Fernandez-Pozo, N.; Drake-Stowe, K.; Humphry, M.; Evans, A.D.; Bombarely, A.; Allen, F.; Hurst, R.; White, B.; Kernodle, S.P.; et al. A reference genome for Nicotiana tabacum enables map-based cloning of homeologous loci implicated in nitrogen utilization efficiency. BMC Genom. 2017, 18, 448. [Google Scholar] [CrossRef]
  59. Zhang, Y.W.; Tamba, C.L.; Wen, Y.J.; Li, P.; Ren, W.L.; Ni, Y.L.; Gao, J.; Zhang, Y.M. mrMLM v4.0: An R platform for multi-locus genome-wide association studies. Genom. Proteom. Bioinform. 2020, 18, 481–487. [Google Scholar] [CrossRef]
  60. Wang, S.B.; Feng, J.Y.; Ren, W.L.; Huang, B.; Zhou, L.; Wen, Y.J.; Zhang, J.; Dunwell, J.M.; Xu, S.; Zhang, Y.M. Improving power and accuracy of genome-wide association studies via a multi-locus mixed linear model methodology. Sci. Rep. 2016, 6, 19444. [Google Scholar] [CrossRef] [Green Version]
  61. Zhang, J.; Feng, J.Y.; Ni, Y.L.; Wen, Y.J.; Niu, Y.; Tamba, C.L.; Yue, C.; Song, Q.; Zhang, Y.M. PLARmEB: Integration of least angle regression with empirical Bayes for multilocus genome-wide association studies. Heredity 2017, 118, 517–524. [Google Scholar] [CrossRef] [PubMed] [Green Version]
  62. Tamba, C.L.; Ni, Y.L.; Zhang, Y.M. Iterative sure independence screening EM-Bayesian LASSO algorithm for multi-locus genome-wide association studies. PLoS Comput. Biol. 2017, 13, e1005357. [Google Scholar] [CrossRef] [PubMed]
  63. Zhang, Y.M.; Jia, Z.; Dunwell, J.M. Editorial: The applications of new multi-locus gwas methodologies in the genetic dissection of complex traits. Front. Plant Sci. 2019, 10, 100. [Google Scholar] [CrossRef] [PubMed] [Green Version]
  64. Lipka, A.E.; Tian, F.; Wang, Q.; Peiffer, J.; Li, M.; Bradbury, P.J.; Gore, M.A.; Buckler, E.S.; Zhang, Z. GAPIT: Genome association and prediction integrated tool. Bioinformatics 2012, 28, 2397–2399. [Google Scholar] [CrossRef] [Green Version]
  65. Bradbury, P.J.; Zhang, Z.; Kroon, D.E.; Casstevens, T.M.; Ramdoss, Y.; Buckler, E.S. TASSEL: Software for association mapping of complex traits in diverse samples. Bioinformatics 2007, 23, 2633–2635. [Google Scholar] [CrossRef] [PubMed]
  66. Sun, C.; Li, J. Biosynthesis, catabolism, and signal transduction of brassinosteroids. Plant Physiol. J. 2017, 53, 291–307. [Google Scholar]
  67. Xie, C.; Mao, X.; Huang, J.; Ding, Y.; Wu, J.; Dong, S.; Kong, L.; Gao, G.; Li, C.Y.; Wei, L. KOBAS 2.0: A web server for annotation and identification of enriched pathways and diseases. Nucleic Acids Res. 2011, 39, 316–322. [Google Scholar] [CrossRef] [PubMed] [Green Version]
  68. Vinocur, B.; Altman, A. Recent advances in engineering plant tolerance to abiotic stress: Achievements and limitations. Curr. Opin. Biotechnol. 2005, 16, 123–132. [Google Scholar] [CrossRef]
  69. Lewis, R.S.; Milla, S.R.; Kernodle, S.P. Analysis of an introgressed Nicotiana tomentosa genomic region affecting leaf number and correlated traits in Nicotiana tabacum. Theor. Appl. Genet. 2007, 114, 841–854. [Google Scholar] [CrossRef]
  70. Vontimitta, V.; Lewis, R.S. Mapping of quantitative trait loci affecting resistance to Phytophthora nicotianae in tobacco (Nicotiana tabacum L.) line Beinhart-1000. Mol. Breed. 2012, 29, 89–98. [Google Scholar] [CrossRef]
  71. Xu, Y.; Yang, T.; Zhou, Y.; Yin, S.; Li, P.; Liu, J.; Xu, S.; Yang, Z.; Xu, C. Genome-wide association mapping of starch pasting properties in maize using single-locus and multi-locus models. Front. Plant Sci. 2018, 9, 1311. [Google Scholar] [CrossRef] [PubMed]
  72. Cui, Y.; Zhang, F.; Zhou, Y. The application of multi-locus GWAS for the detection of salt-tolerance loci in rice. Front. Plant Sci. 2018, 9, 1464. [Google Scholar] [CrossRef] [PubMed] [Green Version]
  73. Li, C.; Fu, Y.; Sun, R.; Wang, Y.; Wang, Q. Single-locus and multi-locus genome-wide association studies in the genetic dissection of fiber quality traits in upland cotton (gossypium hirsutum L.). Front. Plant Sci. 2018, 9, 1083. [Google Scholar] [CrossRef] [PubMed]
  74. Lu, Y.; Zhang, S.; Shah, T.; Xie, C.; Hao, Z.; Li, X.; Farkhari, M.; Ribaut, J.M.; Cao, M.; Rong, T.; et al. Joint linkage-linkage disequilibrium mapping is a powerful approach to detecting quantitative trait loci underlying drought tolerance in maize. Proc. Natl. Acad. Sci. USA 2010, 107, 19585–19590. [Google Scholar] [CrossRef] [Green Version]
  75. Tian, Z.; Qian, Q.; Liu, Q.; Yan, M.; Liu, X.; Yan, C.; Liu, G.; Gao, Z.; Tang, S.; Zeng, D.; et al. Allelic diversities in rice starch biosynthesis lead to a diverse array of rice eating and cooking qualities. Proc. Natl. Acad. Sci. USA 2009, 106, 21760–21765. [Google Scholar] [CrossRef] [Green Version]
  76. Wang, J.; Wan, X.; Crossa, J.; Crouch, J.; Weng, J.; Zhai, H.; Wan, J. QTL mapping of grain length in rice (Oryza sativa L.) using chromosome segment substitution lines. Genet. Res. 2006, 88, 93–104. [Google Scholar] [CrossRef]
  77. Luo, H.; Chen, S.; Jiang, J.; Teng, N.; Chen, Y.; Chen, F. The AP2-like gene NsAP2 from water lily is involved in floral organogenesis and plant height. J. Plant Physiol. 2012, 169, 992–998. [Google Scholar] [CrossRef]
  78. Ma, X.; Song, L.; Yang, Y.; Liu, D. A gain-of-function mutation in the ROC1 gene alters plant architecture in Arabidopsis. New Phytol. 2013, 197, 751–762. [Google Scholar] [CrossRef]
  79. Liu, Y.; Sun, J.; Wu, Y. Arabidopsis ATAF1 enhances the tolerance to salt stress and ABA in transgenic rice. J. Plant Res. 2016, 129, 955–962. [Google Scholar] [CrossRef]
  80. Waterworth, W.M.; Kozak, J.; Provost, C.M.; Bray, C.M.; Angelis, K.J.; West, C.E. DNA ligase 1 deficient plants display severe growth defects and delayed repair of both DNA single and double strand breaks. BMC Plant Biol. 2009, 9, 79. [Google Scholar] [CrossRef] [Green Version]
  81. Abercrombie, J.M.; Halfhill, M.D.; Ranjan, P.; Rao, M.R.; Saxton, A.M.; Yuan, J.S.; Stewart, C.N. Transcriptional responses of Arabidopsis thaliana plants to As (V) stress. BMC Plant Biol. 2008, 8, 87. [Google Scholar] [CrossRef] [PubMed] [Green Version]
  82. Osakabe, Y.; Yamaguchi-Shinozaki, K.; Shinozaki, K.; Tran, L.S.P. ABA control of plant macroelement membrane transport systems in response to water deficit and high salinity. New Phytol. 2014, 202, 35–49. [Google Scholar] [CrossRef] [PubMed]
  83. Pujol, G.; Ferrer, A.; Ariño, J. Protein phosphatase 2A and protein phosphatase X genes in Arabidopsis thaliana. In Protein Phosphatase Protocols; Humana Press: Totowa, NJ, USA, 1998; Volume 93, pp. 201–212. [Google Scholar]
  84. Wen, F.; Wang, J.; Xing, D. A protein phosphatase 2A catalytic subunit modulates blue light-induced chloroplast avoidance movements through regulating actin cytoskeleton in arabidopsis. Plant Cell Physiol. 2012, 53, 1366–1379. [Google Scholar] [CrossRef]
  85. Visioli, G.; Maestri, E.; Polverini, E.; Pavesi, A.; Marmiroli, N. L1 a Non-LTR retrotrasposon fragment in the genome of Arabidopsis thaliana with homology to plants and animals. Am. J. Plant Sci. 2013, 04, 806–816. [Google Scholar] [CrossRef] [Green Version]
  86. Serrano, I.; Gu, Y.; Qi, D.; Dubiella, U.; Innes, R.W. The arabidopsis EDR1 protein kinase negatively regulates the ATL1 e3 ubiquitin ligase to suppress cell death. Plant Cell 2014, 26, 4532–4546. [Google Scholar] [CrossRef] [PubMed] [Green Version]
  87. Schwager, K.M.; Calderon-Villalobos, L.I.A.; Dohmann, E.M.N.; Willige, B.C.; Knierer, S.; Nill, C.; Schwechheimer, C. Characterization of the VIER F-BOX PROTEINE genes from arabidopsis reveals their importance for plant growth and development. Plant Cell 2007, 19, 1163–1178. [Google Scholar] [CrossRef] [Green Version]
  88. Chen, D.; Wu, J.; Zhao, M.; Ma, X.; Zhang, W.; Xia, G.; Wang, M. A novel wheat cysteine-rich receptor-like kinase gene CRK41 is involved in the regulation of seed germination under osmotic stress in Arabidopsis thaliana. J. Plant Biol. 2017, 60, 571–581. [Google Scholar] [CrossRef]
  89. Zhu, S.H.; Xue, F.; Li, Y.J.; Liu, F.; Zhang, X.Y.; Zhao, L.J.; Sun, Y.Q.; Zhu, Q.H.; Sun, J. Identification and functional characterization of a microtubule-associated protein, GhCLASP2, from upland cotton (Gossypium hirsutum L.). Front. Plant Sci. 2018, 9, 882. [Google Scholar] [CrossRef]
  90. Eng, R.C.; Schneider, R.; Matz, T.W.; Carter, R.; Ehrhardt, D.W.; Jönsson, H.; Nikoloski, Z.; Sampathkumar, A. KATANIN and CLASP function at different spatial scales to mediate microtubule response to mechanical stress in Arabidopsis cotyledons. Curr. Biol. 2021, 31, 3262–3274.e6. [Google Scholar] [CrossRef]
  91. Fan, W.; Lu, J.; Pan, C.; Tan, M.; Lin, Q.; Liu, W.; Li, D.; Wang, L.; Hu, L.; Wang, L.; et al. Sequencing of Chinese castor lines reveals genetic signatures of selection and yield-associated loci. Nat. Commun. 2019, 10, 3418. [Google Scholar] [CrossRef]
  92. Knutson, B.A. Emergence and expansion of TFIIB-like factors in the plant kingdom. Gene 2013, 526, 30–38. [Google Scholar] [CrossRef] [PubMed] [Green Version]
  93. Niu, Q.K.; Liang, Y.; Zhou, J.J.; Dou, X.Y.; Gao, S.C.; Chen, L.Q.; Zhang, X.Q.; Ye, D. Pollen-expressed transcription factor 2 encodes a novel plant-specific TFIIB-related protein that is required for pollen germination and embryogenesis in arabidopsis. Mol. Plant 2013, 6, 1091–1108. [Google Scholar] [CrossRef] [PubMed] [Green Version]
  94. Osakabe, Y.; Arinaga, N.; Umezawa, T.; Katsura, S.; Nagamachi, K.; Tanaka, H.; Ohiraki, H.; Yamada, K.; Seo, S.U.; Abo, M.; et al. Osmotic stress responses and plant growth controlled by potassium transporters in Arabidopsis. Plant Cell 2013, 25, 609–624. [Google Scholar] [CrossRef] [PubMed] [Green Version]
  95. Hobbie, L.; McGovern, M.; Hurwitz, L.R.; Pierro, A.; Liu, N.Y.; Bandyopadhyay, A.; Estelle, M. The axr6 mutants of Arabidopsis thaliana define a gene involved in auxin response and early development. Development 2000, 127, 23–32. [Google Scholar] [CrossRef]
  96. Furutani, M.; Sakamoto, N.; Yoshida, S.; Kajiwara, T.; Robert, H.S.; Friml, J.; Tasaka, M. Polar-localized NPH3-like proteins regulate polarity and endocytosis of PIN-FORMED auxin efflux carriers. Development 2011, 138, 2069–2078. [Google Scholar] [CrossRef] [Green Version]
  97. Mehmood, S.; Ahmed, W.; Ikram, M.; Imtiaz, M.; Mahmood, S.; Tu, S.; Chen, D. Chitosan modified biochar increases soybean (Glycine max L.) resistance to salt-stress by augmenting root morphology, antioxidant defense mechanisms and the expression of stress-responsive genes. Plants 2020, 9, 1173. [Google Scholar] [CrossRef]
Figure 1. Phenotypic variation in the plant height of tobacco in different environments. The gray color in the box indicates the median; the white boxplot in violin shows the range from the lower quartile to upper quartile; the black line indicates the frequency distribution and dispersion of the phenotypic data. Different letters indicate significant differences between environments and BLUP values using the LSD test at p < 0.05.
Agronomy 12 01047 g001
Figure 2. Total number of significant QTNs and common QTNs for plant height identified in four environments and GWAS models. Unique and common QTNs were identified in four environments and BLUP by (a) ML-GWAS models, (b) SL-GWAS models, and (c) combined ML/SL models. (d) All six methods detected unique and common QTNs. The connected circles below the histogram represent common QTNs; brown, dark blue, dark green, and dark orange represent two, three, four, and five common QTNs, respectively, while purple denotes unique QTNs. Horizontal bars show the total number of QTN set sizes for different environments and methods. E1-13H: Hukou (2013), E2-14-H: Hukou (2014), E3-14X: Xikou (2014), and E4-15X: Xikou (2015).
Agronomy 12 01047 g002
Figure 3. Genetic map based on identified QTNs in tobacco detected in different environments by multi-locus and single-locus methods. The green font represents the total number of QTNs. Blue, purple, and brown indicate stable QTNs detected by ML models only, SL models only, and ML- and SL-models across at least two environments and/or methods, respectively.
Agronomy 12 01047 g003
Figure 4. Manhattan plot of association mapping of plant height in tobacco. The figure shows significant and stable QTNs identified in four environments and their BLUP values. The pink dots indicate significant QTNs in ML models, while green and blue dots represent −log10 p-values in the first step. The dashed line marks the LOD threshold.
Agronomy 12 01047 g004
Figure 5. Plant height differences between elite and alternative alleles of each QTN of tobacco in different environments. E1-13H: Hukou (2013), E2-14-H: Hukou (2014), E3-14X: Xikou (2014), and E4-15X: Xikou (2015). *, **, and *** represent 0.05, 0.01, and 0.001 significance levels, respectively. ns: non-significant.
Agronomy 12 01047 g005
Figure 6. Scatter plot with fitted regression lines representing the correlation between elite/alternative alleles and plant height in tobacco. A positive correlation was calculated between the number of elite alleles and plant height in (a) E1-13H, (b) E2-14H, (c) E3-14X, (d) E4-15X, and (e) BLUP values. A negative correlation was calculated between the number of alternative alleles and plant height in (f) E1-13H, (g) E2-14H, (h) E3-14X, (i) E4-15X, and (j) BLUP values. E1-13H: Hukou (2013), E2-14-H: Hukou (2014), E3-14X: Xikou (2014), and E4-15X: Xikou (2015).
Agronomy 12 01047 g006
Table 1. Descriptive statistics for plant height in 94 tobacco accessions in four environments.
EnvironmentMeanMinMaxSDCV (%)KurtosisSkewnessFGFEFG×Eh2B (%)
E1-13H62.2037.33115.6712.9523.393.701.25506.64 **158.39 **24.81 **80.31
E2-14H57.5534.7087.7010.7318.640.440.7387.09
E3-14X68.2547.30104.3011.2316.460.010.5383.37
E4-15X108.8069.00165.0017.3715.960.580.5878.93
E1-13H: Hukou (2013); E2-14-H: Hukou (2014); E3-14X: Xikou (2014); E4-15X: Xikou (2015); Min: minimum value; Max: maximum value; SD: standard deviation; CV: coefficient of variation; FG, FE, and FG×E: F values in ANOVA for genotype, environment, and genotype × environment, respectively; **: significance at the 0.01 probability level; h2B: broad-sense heritability.
Table 2. Number of stable QTNs detected in multiple environments for plant height in tobacco.
QTN namePosition (bp)LOD score‘−log10(p)’r2 (%) aEnvironments bMethod c
qPH-1-1Nt01_399835593.01–5.003.71–5.794.69–6.84E3-14X, BLUPM2, M3, M4
qPH-1-2Nt01_1025746853.31–6.454.03–7.294.9–12.84E4-15X, BLUPM2, M3
qPH-6-1Nt06_344178174.43–5.595.2–6.414.43–9.85E4-15X, BLUPM1, M2, M4
qPH-10-1Nt10_264910054.13–13.454.89–14.457.12–25.67E1-13H, E2-14HM1, M2, M3
qPH-10-2Nt10_627686874.12–9.484.88–10.419.5–21.48E1-13H, E2-14HM2, M3, M4
qPH-11-1Nt11_54196873.52–4.064.24–4.813.03–7.58E3-14X, BLUPM1, M2
qPH-13-2Nt13_621980573.27–8.333.98–9.236.43–11.84E2-14H, BLUPM2, M3, SL2
qPH-14-1Nt14_880693973.53–11.644.26–12.614.25–11.48E4-15X, BLUPM1, M2, M3, M4, SL1, SL2
qPH-17-2Nt17_1404872123.38–5.454.1–6.270.64–2.09E1-13H, E2-14HM2, M4
qPH-17-3Nt17_2004071784.62–5.025.4–5.826.31–7.08E2-14H, BLUPM2, M4, SL1
qPH-18-1Nt18_100343313.38–8.44.1–9.316.63–15.68E4-15X, BLUPM1, M3, M4
qPH-18-3Nt18_370427854.3–10.555.06–11.53.95–13.32E1-13H, E2-14H, BLUPM2, M4, SL2
qPH-18-4Nt18_619730964.06–6.094.81–6.933.65–6.43E3-14X, BLUPM2, M4, SL1, SL2
qPH-20-1Nt20_38682763.13–5.873.83–6.71.57–6.54E4-15X, BLUPM2, M3
qPH-22-1Nt22_197644043.67–9.864.4–10.87.29–24.78E3-14X, BLUPM2, M3, M4
qPH-22-2Nt22_1028073603.15–8.633.86–9.541.39–7.8E1-13H, E2-14HM3, M4
qPH-23-3Nt23_569668913.09–4.553.79–5.334.16–6.4E4-15X, BLUPM2, M3, M4
qPH-23-4Nt23_1161927913.18–3.953.89–4.692.63–7.86E2-14H, BLUPM2, M3, M4
qPH-24-2Nt24_34952292 2.48E-088.513637E1-13H, E2-14H, BLUPSL1, SL2
a r2%: phenotypic variance explained by each QTN; b Environments: E1-13H: Hukou (2013), E2-14-H: Hukou (2014), E3-14X: Xikou (2014), and E4-15X: Xikou (2015); c Methods: M1: mrMLM, M2: FASTmrMLM, M3: ISIS EM-BLASSO, M4: pLARmEB, SL1: MLM, and SL2: FarmCPU.
Table 3. Best parental cross combinations in two directions for plant height in tobacco from elite alleles.
DirectionP1P2P1-Phenotype (cm)P2-Phenotype (cm)P1-Elite
Alleles
P2-Elite
Alleles
Offspring Alleles
Taller plantsQinggengKY14111.9188.92423147
Japan 4Qinggeng78.86111.91254246
ROX2881-2689.55107.16253846
H66BKY14100.7988.92303145
81-26KY14107.1688.92383145
Hicks 187Qinggeng79.7111.91264244
Japan 481-2678.86107.16253844
Shorter plantsK399C31949.2554.37454649
NC82C31960.2854.37404648
G33RG11272.2963.67373744
K394VA11669.0365.92393746
K399RG11249.2563.67453749
Nanxuan No. 1K39469.0363.33373945
RG112VA11563.6763.67373742
Publisher’s Note: MDPI stays neutral with regard to jurisdictional claims in published maps and institutional affiliations.

