Article

Variation of Soil Nitrogen, Organic Carbon, and Waxy Wheat Yield Using Liquid Organic and Mineral Fertilizers

by
Danute Petraityte
1,
Jurgita Ceseviciene
1,*,
Ausra Arlauskiene
2,
Alvyra Slepetiene
1,
Aida Skersiene
1 and
Viktorija Gecaite
2
1
Institute of Agriculture, Lithuanian Research Centre for Agriculture and Forestry, LT-58344 Akademija, Lithuania
2
Joniskelis Experimental Station, Lithuanian Research Centre for Agriculture and Forestry, LT-39301 Joniskelis, Lithuania
*
Author to whom correspondence should be addressed.
Agriculture 2022, 12(12), 2016; https://doi.org/10.3390/agriculture12122016
Submission received: 19 October 2022 / Revised: 16 November 2022 / Accepted: 22 November 2022 / Published: 26 November 2022
(This article belongs to the Special Issue Mechanism of Soil Nitrogen Transformation and Greenhouse Gas Emission)

Abstract

:
Biogas slurry is widely used to fertilize crops. However, their impact on soil parameters and waxy winter wheat (Triticum aestivum L.) nutrition is poorly understood. The aim of this research was to determine the influence of liquid anaerobic digestate and pig slurry applied to waxy winter wheat on the dynamics of soil organic carbon (SOC) and total nitrogen (Ntot) in different forms on grain yield, and to compare them with the use of ammonium nitrate. The nitrogen rates (kg N·ha−1) used for fertilization were N0, N60, N120, and N120+50. The study showed that the variation of nitrate nitrogen (N-NO3) and water-extractable organic carbon (WEOC) in the soil during the growing season depended on N fertilizer rates, meteorological conditions of the year, and, to a lesser extent, on fertilizer forms. Meteorological conditions were responsible for the demand and supply of nutrients from the soil by the waxy winter wheat variety. This determined the wheat yield and the variation in the soil parameters studied. Over the 2 years, the soil C:N ratio decreased, especially at the medium and high N fertilizer rates. The lowest changes were observed in the unfertilized and fertilized plots at a rate of 60 kg N·ha−1.

1. Introduction

Carbon (C) sequestration and an increase in soil organic matter (SOM) have a direct positive effect on soil quality and crop yields. Organic carbon leads to improved soil structure and particle aggregation, ensures moisture retention, is associated with improved supply and uptake of plant nutrients, promotes micro-organism activity in the rhizosphere [1,2,3,4], and regulates greenhouse gas emissions, thereby contributing to climate change mitigation [5]. It is known that the increase in soil carbon (the main component of organic matter) is due to the cultivation of perennial grasses [6,7,8], balanced application of organic and mineral fertilizers [2], intercropping cultivation [9], and conservation tillage [10,11]. Soil organic carbon (SOC) accumulation can only be achieved over a long period of time through appropriate agronomic practices [8,12]. C stocks in SOM are often described as a collection of compounds with different biochemical composition and degradation rates [13]. Fortuna et al. [13] argued that more attention should be paid to the labile SOM fraction, which provides more information on short-term SOC changes. Agronomic practices directly influence the active and passive SOC pools. The active SOC fraction consists of readily degradable compounds (simple sugars, organic acids, and microbial metabolites), which are important energy sources for microorganisms [13,14]. Passive SOC pools consist of structural plant residues and physically stabilized carbon (turnover over the year) and affect the nutrient buffering capacity of soil [13,15,16]. Bhowmik et al. [16] declared that the use of good agronomic practices (tillage simplification and the use of organic fertilizers) reduces the redistribution of SOC to active SOC pools and increases it to stable SOC pools. This regulates the release, concentration, and supply of mineral nitrogen (N) to growing plants, reducing carbon dioxide emissions, while increasing the passive SOC pool and/or its turnover, as well as a reservoir of nutrients available to soil biota.
Organic carbon is closely related to nitrogen, which determines the balance between mineralization and humification of plant residues and fertilizer [1,6]. Intensive mineral N fertilization can lead to intensive plant growth, but it also leads to soil nutrient depletion and changes in soil chemical and physical properties, which can reduce humus content. In order to balance the soil organic matter content, ways are being sought to provide nitrogen to plants and to compensate for the loss of soil organic matter.
In 2020, in Lithuanian agriculture farming, 2271.4 thousand tons of slurry and 3103.9 thousand tons of manure were composed, some of which (1411.7 and 2488.3 thousand tons, respectively) were used for fertilization [17]. According to 2020 data, the most common manure management systems for pig manure treatment were liquid and anaerobic digester manure management systems accounting for 55.5% and 34.2%; around 8.6% of manure is managed in solid systems, along with 1.7% in deep bedding systems [18]. Currently, 14 biogas power plants produce biogas from agricultural waste in Lithuania, 10 of which also recycle animal slurry into anaerobic digestate. The use of liquid organic fertilizers is a sustainable strategy for nutrient recycling, increasing SOC stocks, and mitigating climate change [19]. Organic fertilizers can directly and indirectly increase soil C accumulation by increasing net primary productivity and root mass, and by contributing to the bulk of the isolated or stable C in soil [12,13]. Organic fertilizers provide a variety of C compounds, ranging in chemical composition from labile to unstable, which can be used by soil micro-organisms in the mineralization process to increase their growth rate and biomass. It can be argued that organic fertilizers have strong, short and long-term effects on the soil microbiome and are essential for maintaining soil health by increasing microbial activity, microbial interactions, and nutrient cycling [20,21,22].
Biogas slurry is widely used as a fertilizer for crops due to its nitrogen content. However, it remains unclear how the use of biogas slurry affects the SOC status in the long term. In addition, heavy-textured soils generally provide chemical and physical conditions that lead to lower mineralization rates. As a consequence, soils with higher amounts of clay particles (22.7%) tend to be richer in humus and nutrients compared to soils with a lighter texture [11].
There is substantial information about winter wheat fertilization, N rate distribution, and its effect on grain yield in different cultivars and environments. The addition of N fertilizer is an effective way to increase wheat yield, but only up to a certain limit [23,24,25,26,27,28]. According Staugaitis at al.’s [23] recent data on the optimization of N fertilization at the Calcaric Luvisol, the highest winter wheat (non-waxy) grain yield (7.66 t·ha−1) was obtained by fertilizing at a rate of N180; however, the difference in grain yield was as little as 0.52 t·ha−1 compared to the N120 rate, and the optimal rate of N fertilizer considering the potential pollution of nitrates to the environment was N120.
Waxy wheat (Triticum aestivum L.) grain with a modified amylose-to-amylopectin starch ratio is promising due to its specific quality and wide application in many areas [24,29]. However, waxy wheat production is mainly limited due to its low grain yield compared with nonwaxy wheat [24,30,31], at 20.37–24.05% [31]. This difference can be due to lower waxy wheat N use efficiency [24]. However, the main cause of low kernel weight and grain yield in waxy wheat can be weakened starch synthesis in the later stage of grain filling [30]. A small number of registered waxy wheat cultivars demonstrate that waxy wheat is a new type of wheat that is largely less adapted to the environments of Europe. Therefore, the cultivation techniques for high-yielding waxy wheat have seldom been studied, and data about soil changes during waxy wheat cultivation cannot be found at all.
The aim of our study was to determine the effect of anaerobic digestate and pig slurry applied to waxy winter wheat on the dynamics of different SOC and N forms, as well as grain yield, in comparison to the use of ammonium nitrate.

2. Materials and Methods

2.1. Experimental Site and Soil

The study was carried out at the Joniskelis Experimental Station of the Lithuanian Research Center for Agriculture and Forestry (LAMMC), situated in the northern part of Central Lithuania’s lowland region (56°21′ N, 24°10′ E) during the period 2019–2021. The parental rock of the experimental site is limnoglacial clay on morenic loam, according to the current classification—Endocalcari Endohypogleyic Cambisol (Clayic, Drainic). The soil texture is clay loam (at a depth of 0–25 cm) on silty clay (at a depth of 26–76 cm) with deeper lying sandy loam (at a depth of 77–135 cm). The topsoil layer (0–25 cm) contained 27.0%, 50.2%, and 22.7% clay, silt and sand, respectively. The topsoil (0–30 cm) pH was close to neutral (pHKCl 6.5), and its composition was moderate in phosphorus (P2O5 113 mg·kg−1), high in potassium (K2O 529 mg·kg−1), and moderate in humus (2.29%) and total nitrogen (Ntot 1.13 g·kg−1). The experimental plots were laid out in a complete one-factor randomized block design with three replicates. The individual plot size was 75 m2 (15 × 5 m).

2.2. Experimental Design and Details

The field experiment was conducted in 2019/2020 and repeated in the same plot order in 2020/2021. A waxy winter wheat cultivar ‘Eldija’ was sown at a rate of 4.5 million seeds·ha−1. The crops were grown according to the conventional farming standards. The preceding crop was cereal. Every year, in the autumn, during pre-sowing, complex mineral fertilizers (N32P32K32 100 kg·ha−1) were applied in all experimental field. The fertilizer rate was chosen according to the status of soil available phosphorus and potassium. Ten fertilization treatments using different fertilizers and nitrogen rates were studied in the experiment:
  • Control (N0);
  • N60 mineral fertilizer–ammonium nitrate (AN60);
  • N60 pig slurry (PS60);
  • N60 liquid anaerobic digestate (LD60);
  • N120 mineral fertilizer–ammonium nitrate (AN120);
  • N120 pig slurry (PS120);
  • N120 liquid anaerobic digestate (LD120);
  • N120 ammonium nitrate and N50 ammonium nitrate (AN120 + 50);
  • N120 pig slurry and N50 ammonium nitrate (PS120 + 50);
  • N120 liquid anaerobic digestate and N50 ammonium nitrate (LD120 + 50).
Mineral fertilizer–ammonium nitrate (AN) and liquid organic fertilizers (pig slurry (PS) and anaerobic digestate (LD)) were used as separate fertilizers after the resumption of winter wheat spring vegetation (BBCH 25 growth stage). Winter wheat was fertilized on 24 March 2020 and 31 March 2021. Rates of fertilizers were calculated according to N concentration. LD was obtained under the controlled biological decomposition of pig slurry and residues of agriculture crops. Both liquid fertilizers are based on ammonium. Detailed nutrient composition of the bio-fertilizers is provided in the Table 1. As a nitrification inhibitor was used DMPP (3,4-dimethylpyrazole phosphate) base product Vizura, BASF, Germany), it was mixed with both liquid bio-fertilizers at a rate of 2 L·ha−1. AN was used not only for main mineral fertilization but also for additional fertilization (50 kg N·ha−1) during the plant steam elongation stage (BBCH 34) on 14 May 2020 and on 21 May 2021, respectively. Common forms of nitrogen composition in AN fertilizer are ammonium and nitrate (1:1).

2.3. Sampling, Preparation, and Analyses

The chemical composition of liquid organic fertilizers (PS and LD) was researched in 2020 and 2021. Pig slurry was obtained from a pig farm (55°42′54.8” N 23°46′33.4″ E, Kauleliskiai, Radviliskis District, Lithuania). Liquid digestate was obtained after controlled biological decomposition in a biogas plant (56°03′54.6” N 23°59′13.9″ E, Veselkiskiai, Pakruojis District, Lithuania) where the main feedstock was pig slurry and industrial crop residues: molasses, mill waste, starch feedstock, pulp, and sugar beet pulp. The fertilizers (~2 L) were sampled from the storage lagoons every spring before the main fertilization to determine their basic characteristics (Table 1). Liquid organic fertilizers were analyzed immediately after the homogenization.
Soil samples for agrochemical characterization were taken from the 0–30 cm soil layer, while those for ammonium (N-NH4) and nitrate (N-NO3) nitrogen were taken from the 0–60 cm soil layer and collected three times during the experimental period: in spring before winter wheat growth resumed (AV); during vegetation (~1.5 months after fertilization, BBCH 34–35) (IG), and after harvest (AH). Five cores were randomly collected from each plot, crushed, and stored in a deep freezer (−18 °C) until N-NH4 and N-NO3 analyses, with the exception of the first collection, which was performed prior to experiment installation (AV 2020), where six representative samples were collected from different field locations.
Soil samples were air-dried, crushed, and sieved through a 2 mm sieve, manually removing visible roots and plant residues, and then used for pH and total nitrogen (Ntot) analyses. For the soil organic carbon (SOC), mobile humic fractions, and water-extractable organic carbon (WEOC), an aliquot of the samples was passed through a 0.25 mm sieve.
Spectrophotometric quantitative measurements of N-NH4 and N-NO3 in liquid fertilizers were conducted using Hach–Lange cuvette tests (LCK 302 and LCK 339) and spectrophotometer DR 3900 (Hach Lange, Germany) [32]. The concentrations of soil N-NO3 were determined using the potentiometric method in a 1% extract of KAl(SO4)2·12H2O (1:2.5, w/v) [33], and those of soil N-NH4 were determined using spectrophotometric measurements at a wavelength of 655 nm in a 1 M KCl extract (1:2.5, w/v) [34].
The pH was measured using the potentiometric method (C5020, Consort, Belgium). Liquid organic fertilizers were analyzed as fresh samples; soil pH (ISO 10390:2005) was determined in 1 M KCl (1:2.5, w/v). Dry matter (DM) content was measured by drying to a constant weight at 105 °C in a forced-air oven. The content of total nitrogen (Ntot) of all samples was determined after the wet digestion process with sulfuric acid (H2SO4) according to the Kjeldahl method using a spectrophotometric measuring procedure at 655 nm wavelength (UV/Vis Cary 50, Varian Inc., Palo Alto, CA, USA), resulting in the formation of a blue compound upon reaction with salicylate and hypochlorite ions. [35]. The organic carbon content (Corg in fertilizers or SOC in soil) was determined after wet combustion using a spectrophotometric measurement at 590 nm (UV/Vis Cary 50, Varian Inc., Palo Alto, CA, USA) with glucose as a standard [36].
Mobile humic substances (MHSs) were extracted with 0.1 M NaOH [37,38]. The suspension of soil (or digestate) and solution (v/w, 1:10) was periodically shaken at ambient temperature for 24 h. Next, 10 mL of a saturated Na2SO4 solution was added, and the extract was separated by centrifugation at 3800 rpm (Universal 32, Hettich, Germany) for 10 min. The MHSs solution was evaporated to dry mass and quantified spectrophotometrically as for SOC determination. For the determination of mobile humic acids (MHAs) in the digestate and soil samples (soil data used for correlations calculations), an aliquot of the extract was acidified to pH 1.3–1.5 with 1 M H2SO4 and heated at 68–70 °C to precipitate the MHAs. The precipitated MHAs were filtered and rinsed with 0.01 M H2SO4 solution to completely remove the mobile fulvic acids (MFAs). The MHAs were subsequently dissolved in 0.1 M NaOH solution, evaporated, and quantified spectrophotometrically. MFAs were calculated as the difference between MHSs and MHAs concentrations.
Water-extractable organic carbon (WEOC) was measured in deionized water extract (1:5, w/v) using the IR detection method after UV-catalyzed persulphate oxidation with an ion chromatograph (SKALAR, Netherlands). The analysis procedure was performed according to the methodology recommended by SKALAR, using C8H5KO4 as a standard [39].
All concentrations of elements and compounds of soil were expressed on a DM basis. All chemical analyses of soil and liquid bio-fertilizers were conducted at the Chemical Research Laboratory of the Institute of Agriculture, LAMMC.
Winter wheat grain yield was harvested when the majority of crops reached the hard dough stage (BBCH 87). Each experimental plot was harvested using a small-plot combine harvester. After grain threshing, the yields were reported at 14% moisture. Before winter wheat harvesting, we calculated the productive density (spike·m−2) in 0.25 m2 fixed plots, in four places per plot. For each plot, 25 plants were collected to determine the number of grains per spike (units) and the number of grains per unit area (grains·m−2). Grain samples (1 kg) were taken from each plot for the determination of 1000-grain weight.

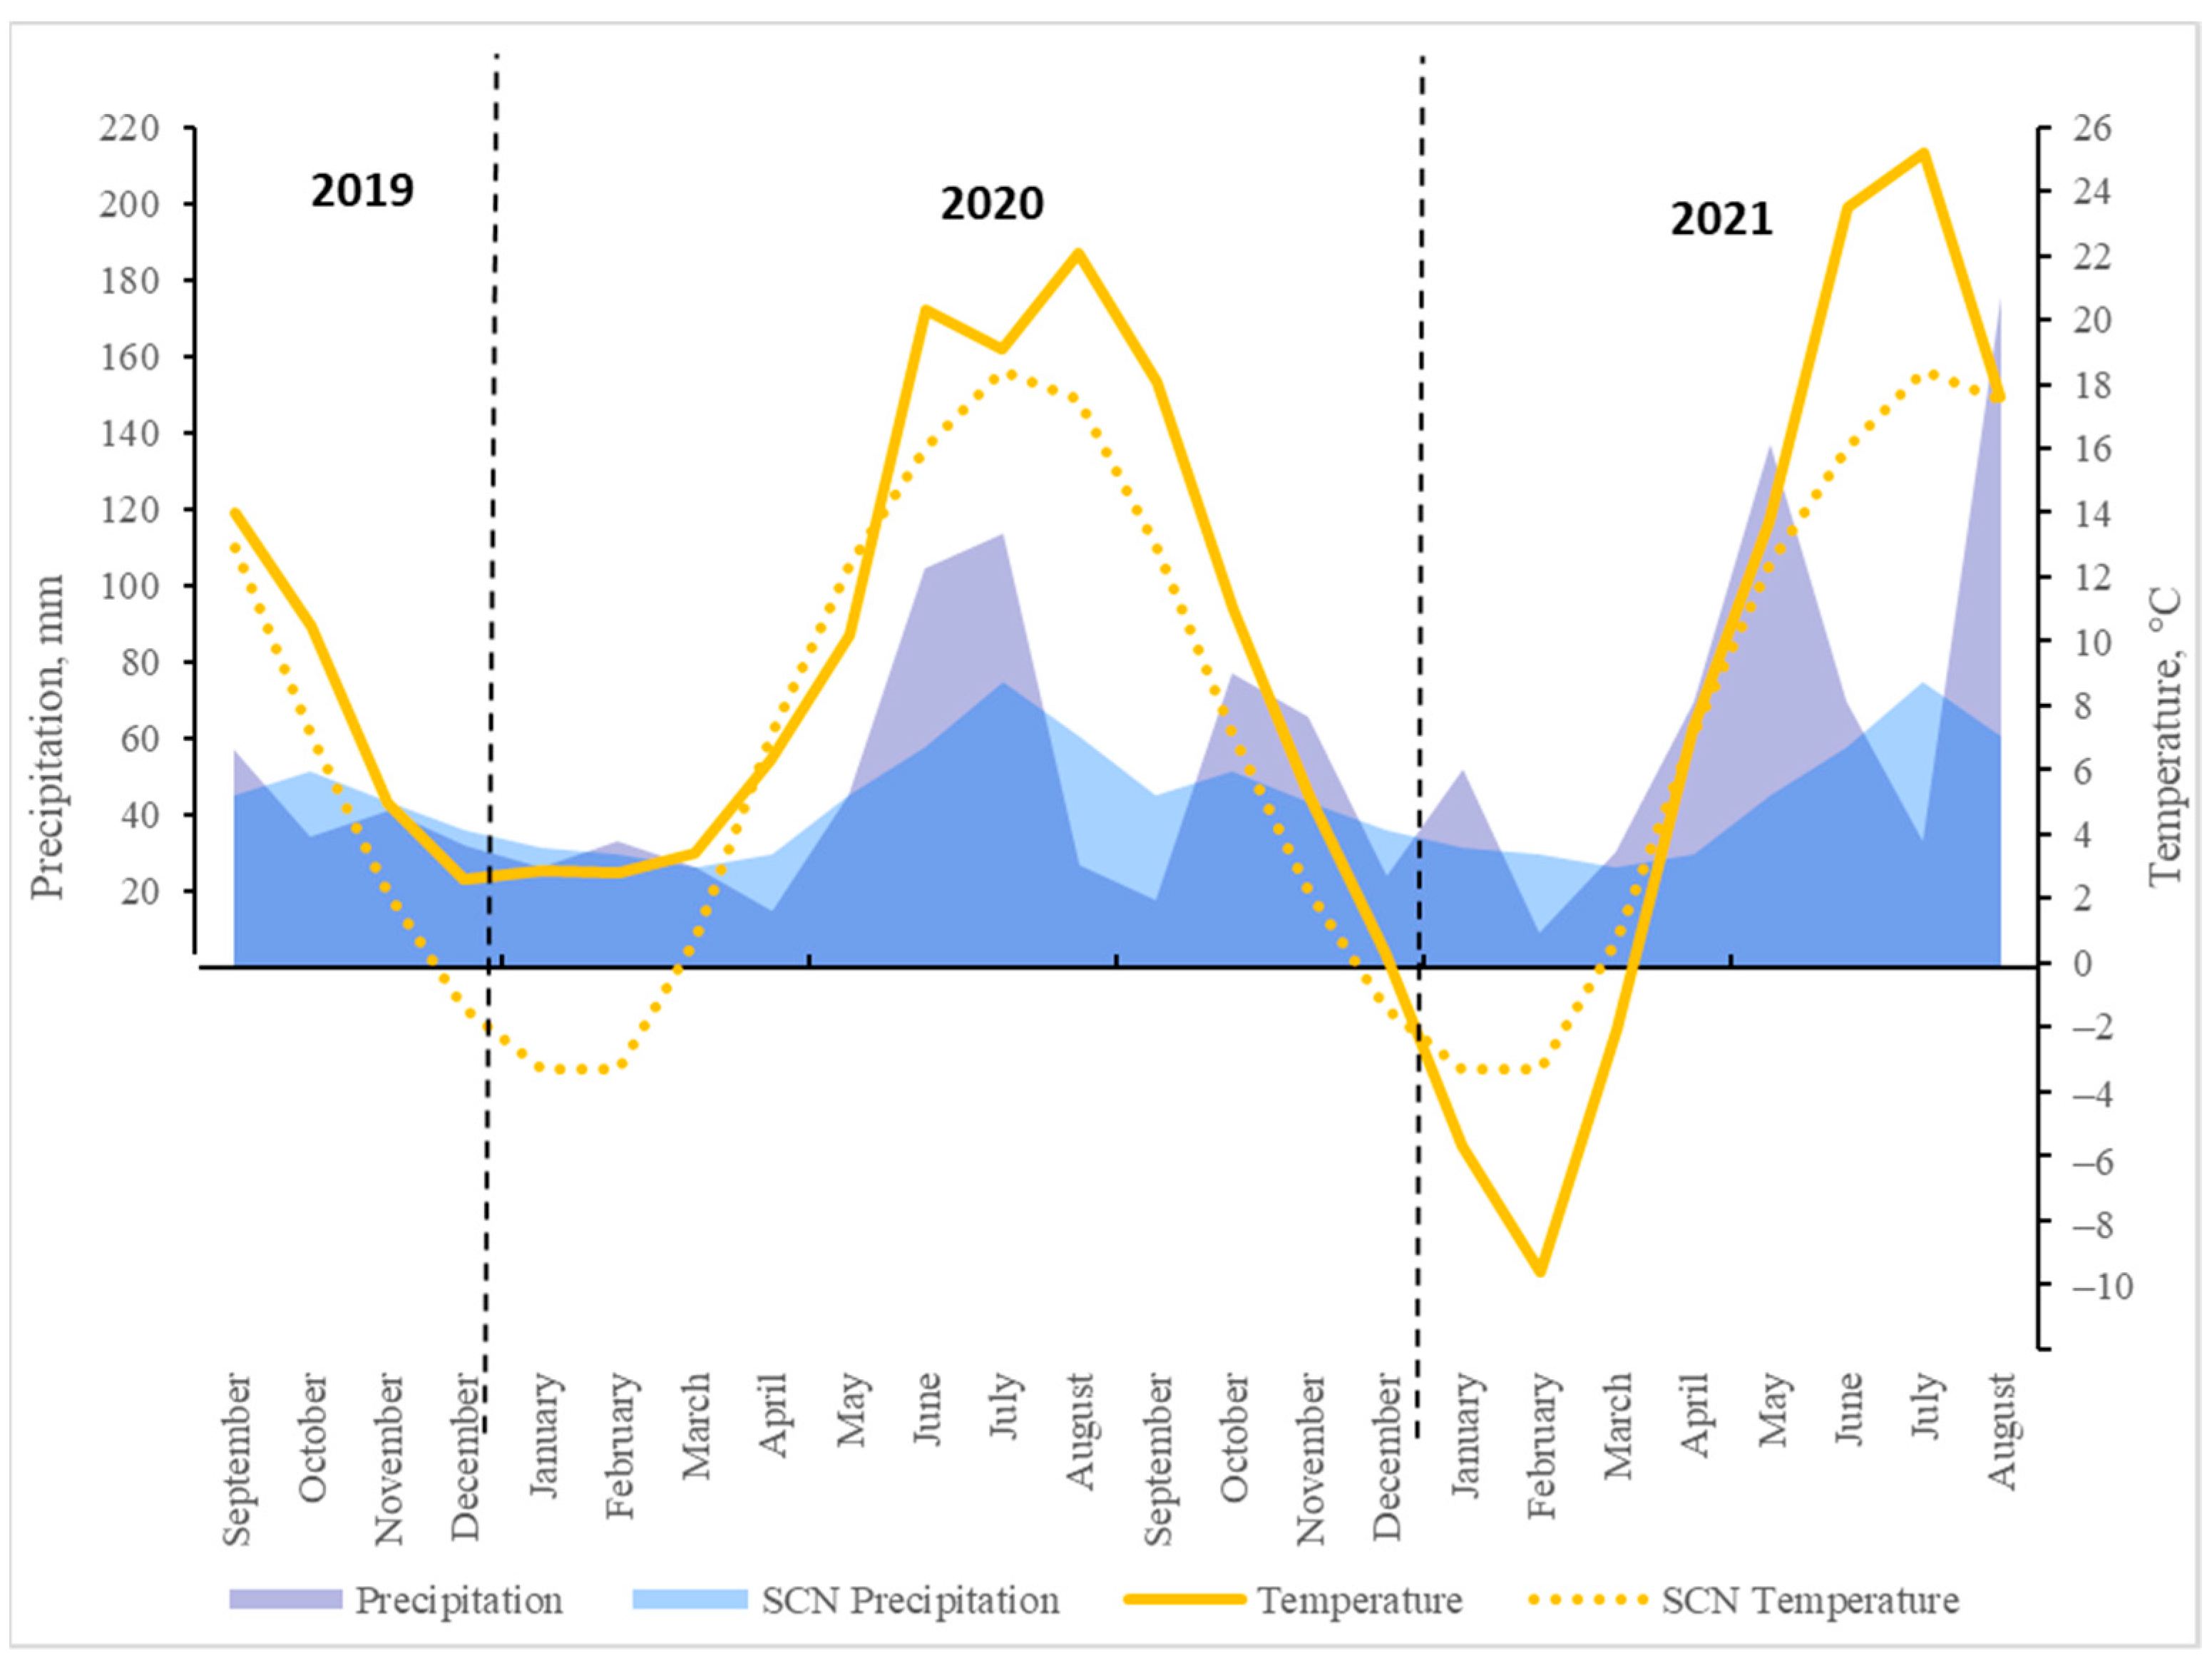
2.4. Meteorological Conditions

The weather data were obtained from the meteorological station, located 0.5 km away from the experimental site (Figure 1). In September 2019, excess moisture made sowing of winter wheat difficult, with 12.2 mm more rainfall than the standard climate norm (SCN). However, a warmer October (compared to SCN) resulted in good germination and development of winter wheat. The winter season was warm, with precipitation below the SCN.
In spring 2020, precipitation was close to SCN, except for a dry April. Compared to SCN, May was cooler (2.2 °C), and June and July were warmer. However, June and July were characterized by excess rainfall of 46.5 and 38.8 mm, respectively, compared to the SCN. The 2020 growing season was characterized by an uneven distribution of rainfall, with insufficient rainfall in the first half of the growing season and excess rainfall in the second one. October and November were warmer and wetter compared to SCN.
The precipitations in January 2021 did not compensate for the lack of precipitations in February; therefore, we can say that the winter of 2021 was quite dry. However, spring was wet and cool. The growing season was characterized by high rainfall in May (92.2 mm more than SCN) and unusually hot weather in June and July (7.5 and 6.8 °C warmer than SCN). August saw a large amount of rainfall: more than double compared to SCN.

2.5. Statistical Analysis

Collected soil data were subjected to a three-way analysis of variance (ANOVA), whereas winter wheat productivity data were subjected to a one-way analysis of variance. Before analysis, the datasets were checked for normality (Shapiro–Wilk test) and homogeneity of variance (Levene test). Three-way ANOVA was performed considering the following factors: fertilizer (AN, PS, and LD), N rate (60, 120, and 120 + 50), and soil collection time (2020: IG and AH; 2021: AV, IG, and AH). Significant differences between factors and interactions were determined using the F-test at p < 0.05 and p < 0.01 probability levels. Significantly differences in data were calculated using Tukey’s studentized range test at p < 0.05, where means with the same letter were not significantly different. Standard error (SE) of the mean was used to represent error values and error bars.
Individual correlations between soil indicators were analyzed using Pearson correlations at the p < 0.05 and p < 0.01 confidence levels.
Principal component analysis (PCA) was applied to reduce the complexity of datasets to a small number of independent principal components and for assessment of the association between groups of variables to determine fertilizer-induced changes in soil (and grain yield) quality through time. The procedure was performed for separate years, investigating the dataset distributions of fertilizer (AN, PS, and LD), N rate (0, 60, 120, and 120 + 50) and soil collection time (2020: IG and AH; 2021: AV, IG, and AH).
Statistical analyses were performed using Statistica software, version 7.1 (StatSoft Inc., Tulsa, OK, USA) and Addinsoft XLSTAT 2022 (Long Island, NY, USA).

3. Results

3.1. Analysis of Variance

Various soil carbon and nitrogen traits were analyzed using statistical analysis of variance (ANOVA) in a three-way dataset, where the factors were fertilizer (AN, PS, and LD), N rate (60, 120, and 120 + 50 kg N·ha−1), and soil collection time (2020: IG and AH; 2021: AV, IG, and AH). Table 2 shows that the soil collection time was a primary source of variation for all soil characteristics. Used data were also influenced by the interaction of factors. The interactions of fertilizer × N rate, fertilizer × time, and N rate × time had a significant effect on the variation of Ntot, WEOC, and MHSs content. The interactions of fertilizer × time and N rate × time had a significant effect on N-NO3, while the interactions of fertilizer × rate and fertilizer × time had a significant effect on SOC variation. The amount of N-NH4 depended only on the interaction of fertilizer × time. The interaction of all three factors had a significant effect on C:N ratio.

3.2. Plant Available and Total Soil Nitrogen

3.2.1. Mineral Nitrogen

Soil mineral N (sum of N-NO3 and N-NH4) is the most common measure of the amount of the element available to plants during a period. In the first year of winter wheat cultivation, N-NO3 content increased consistently. The highest N-NO3 content was found after harvesting (Table 3). During that period, the medium (120 kg N·ha−1) and maximum (120 + 50 kg N·ha−1) fertilizer rates resulted in an increase in N-NO3 after harvesting. The difference compared to the unfertilized plot was 18.9–20.3%. When winter wheat was grown again on the same area, the highest N-NO3 content during the period of intensive growth was found while applying the highest N fertilizer rate (120 + 50 kg N·ha−1). After harvesting, all plots showed a decrease in N-NO3 content, except for the additional fertilization (120 + 50 kg N·ha−1). The additional fertilization increased the N-NO3 content by 79.6% compared to the unfertilized plot. The dry period during the intensive growth of winter wheat (late April to mid-May 2020) reduced N uptake, which was not compensated for by additional fertilizer application. This often led to an increase in N-NO3 after harvesting.
A comparison of the fertilizer forms showed that LD was the main contributor to N-NO3 content in the soil during the winter wheat growing season, and both liquid organic fertilizers (PS and LD) had similar effects after harvesting. The difference in N-NO3 content compared to the unfertilized plot was 10.4–15.5% (2020 data). During the intensive growth of reseeded winter wheat, a higher N-NO3 content was observed after AN fertilization. After harvesting, AN and LD fertilizers tended to increase N-NO3 content. It can be assumed that the additional application of mineral N fertilizers stimulated the mineralization of the organic fertilizer component (PS, 10.14 g·kg−1; LD, 7.45 g·kg−1). Other researchers have shown that nitrogen fertilization can lead to an increase in mineral N after harvesting the crop [40].
Most N in liquid organic fertilizers was in the N-NH4 form (Table 1). After application, a large proportion of this N was converted to N-NO3. The data presented in Table 4 show that, during the period of intensive growth of winter wheat, N-NH4 increased with the application of liquid fertilizers, with a difference of 12.7–14.6% compared to AN. However, after wheat harvesting, only an increasing trend in soil N-NH4 was observed, irrespective of the fertilizer form. Similar trends were also observed during the growing season of the reseeded winter wheat.

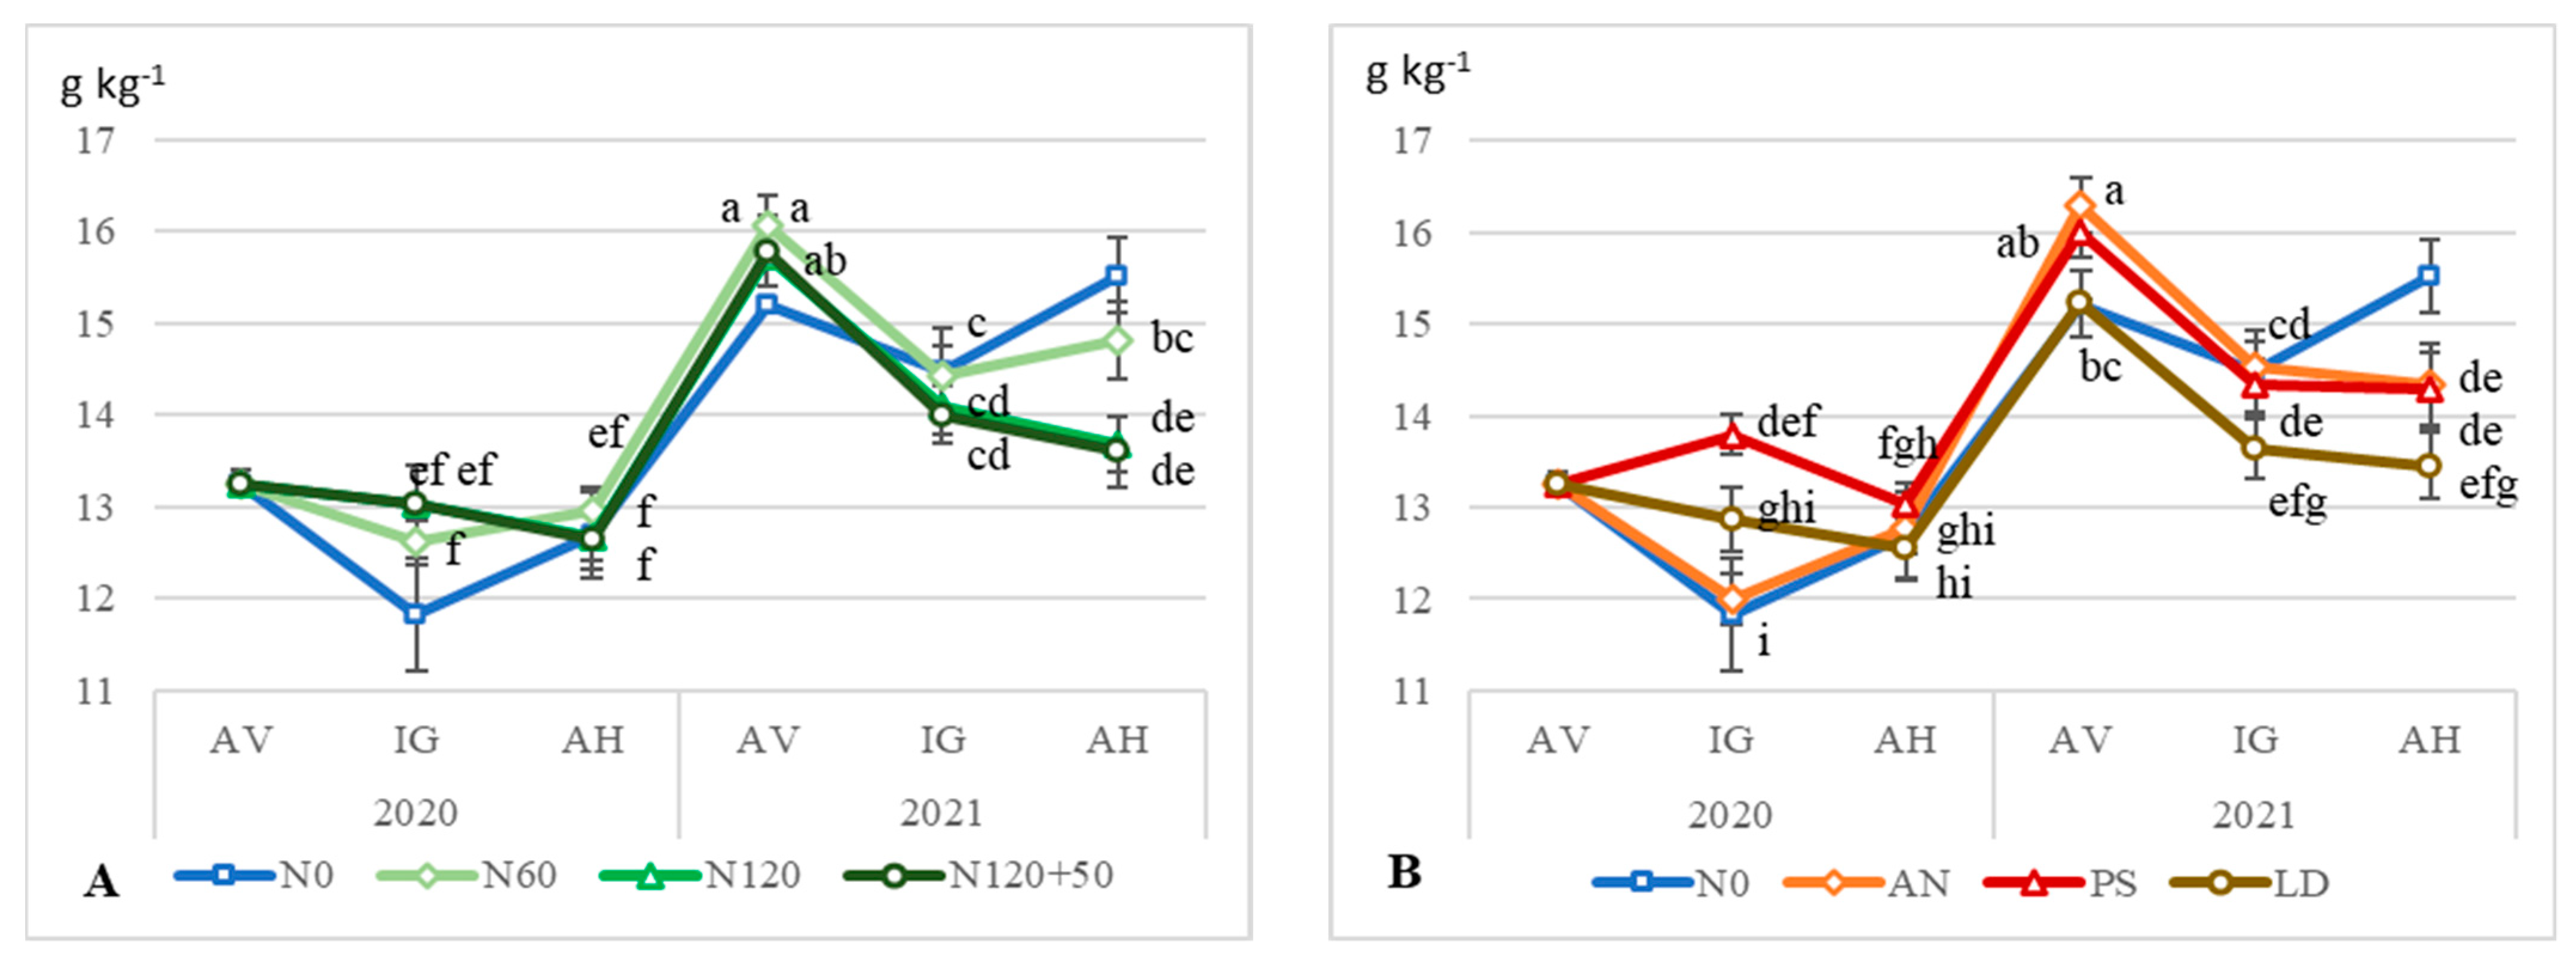
3.2.2. Total Nitrogen

The pronounced increase in Ntot during the period of intensive winter wheat growth (2020 IG) may have been due to the prolonged dry spell at the beginning of the growing season, which disrupted N uptake by the plants (especially from organic fertilizers) (Table 5). After harvesting (2020), Ntot levels decreased and did not differ significantly between treatments. At the beginning of the growing season of reseeded winter wheat, a relatively high N content was formed in the soil, especially with medium and high rates of N fertilizer. During the wheat growing season, this indicator decreased. However, after wheat harvesting (2021), the data were similar to the beginning of the growing season. Significant changes in Ntot during the growing season may have been due to N fertilizer absorbed and not absorbed by the plant, losses of gaseous and soluble forms of N, and exchange of N and its forms between different soil layers [41,42,43].
At the end of the experiment, slightly higher increases in Ntot were observed for AN (7.9%) and PS (8.7%) compared to the unfertilized plot. On average, partially higher Ntot content was found in AN (120 kg N·ha−1) and in PS (120 + 50 kg N·ha−1). LD had the least positive effect on Ntot accumulation.

3.3. Soil Organic Carbon and Its Forms

3.3.1. Water-Extractable Organic Carbon

At the start of the experiment, WEOC accounted for a small proportion (1.8%) of the total SOC. Water-extractable carbon consists of both low-molecular-weight compounds (organic and amino acids) [44] and high-molecular-weight compounds (humic substances and enzymes) [45]. It is considered to be the most mobile and reactive source of SOC, influencing physical, chemical, and biological processes in the soil. When assessing the influence of N rates on this indicator, it was found that, during the winter wheat growing season (IG, 2020), increasing N fertilizer rates resulted in an increase in WEOC content (except for N60) (Figure 2A). After harvesting, WEOC was slightly higher at a medium N fertilizer rate (120 kg·ha−1). After the wheat vegetation resumed in 2021, the highest levels of WEOC remained in the soil of the plots fertilized with the medium and maximum N fertilizer rates. During the growing season of winter wheat (IG, 2021), the WEOC content decreased with all N fertilizer rate applications. The most significant reductions in WEOC were observed at medium and high N fertilizer rates (120 and 120 + 50 kg·ha−1).
The interaction between fertilizer form and time showed that, in the first year of winter wheat growth, the WEOC indicator increased regardless of fertilizer form (Figure 2B). Slightly higher values were observed with PS fertilizer during the growing season and with AN fertilizer after harvesting. The lowest variations in this indicator over the 2 years were observed with AN fertilization. The most prominent decrease in WEOC was observed in the soil under repeated cultivation of winter wheat and application of PS and LD fertilizers.
The interaction between fertilizer forms and N rates showed that N rates did not have any significant effect on WEOC variation when fertilized with AN (Figure 2C). The most effective increase in WEOC was observed with PS at 120 kg N·ha−1 and with LD at 120 + 50 kg N·ha−1.

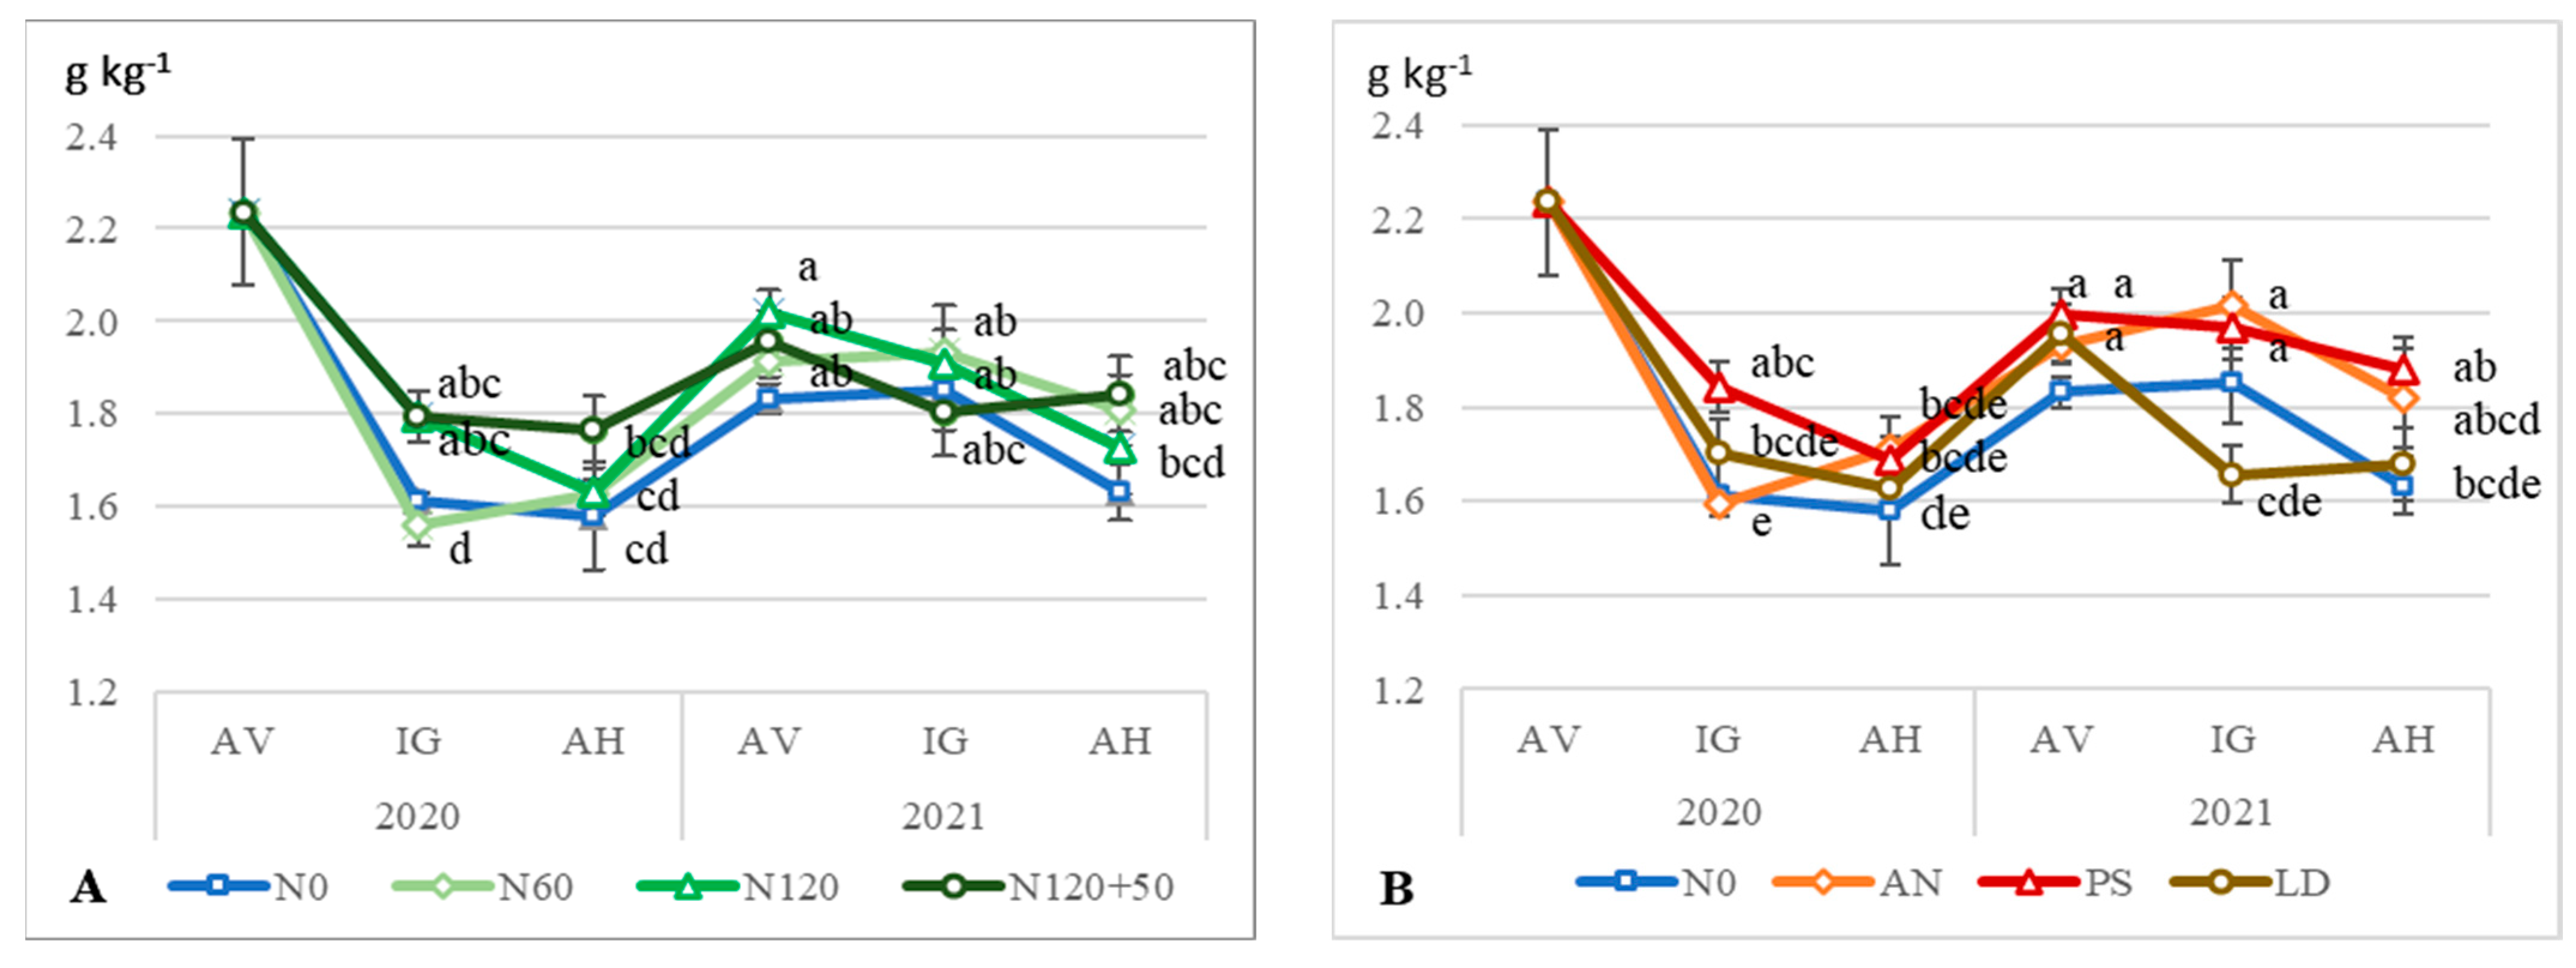
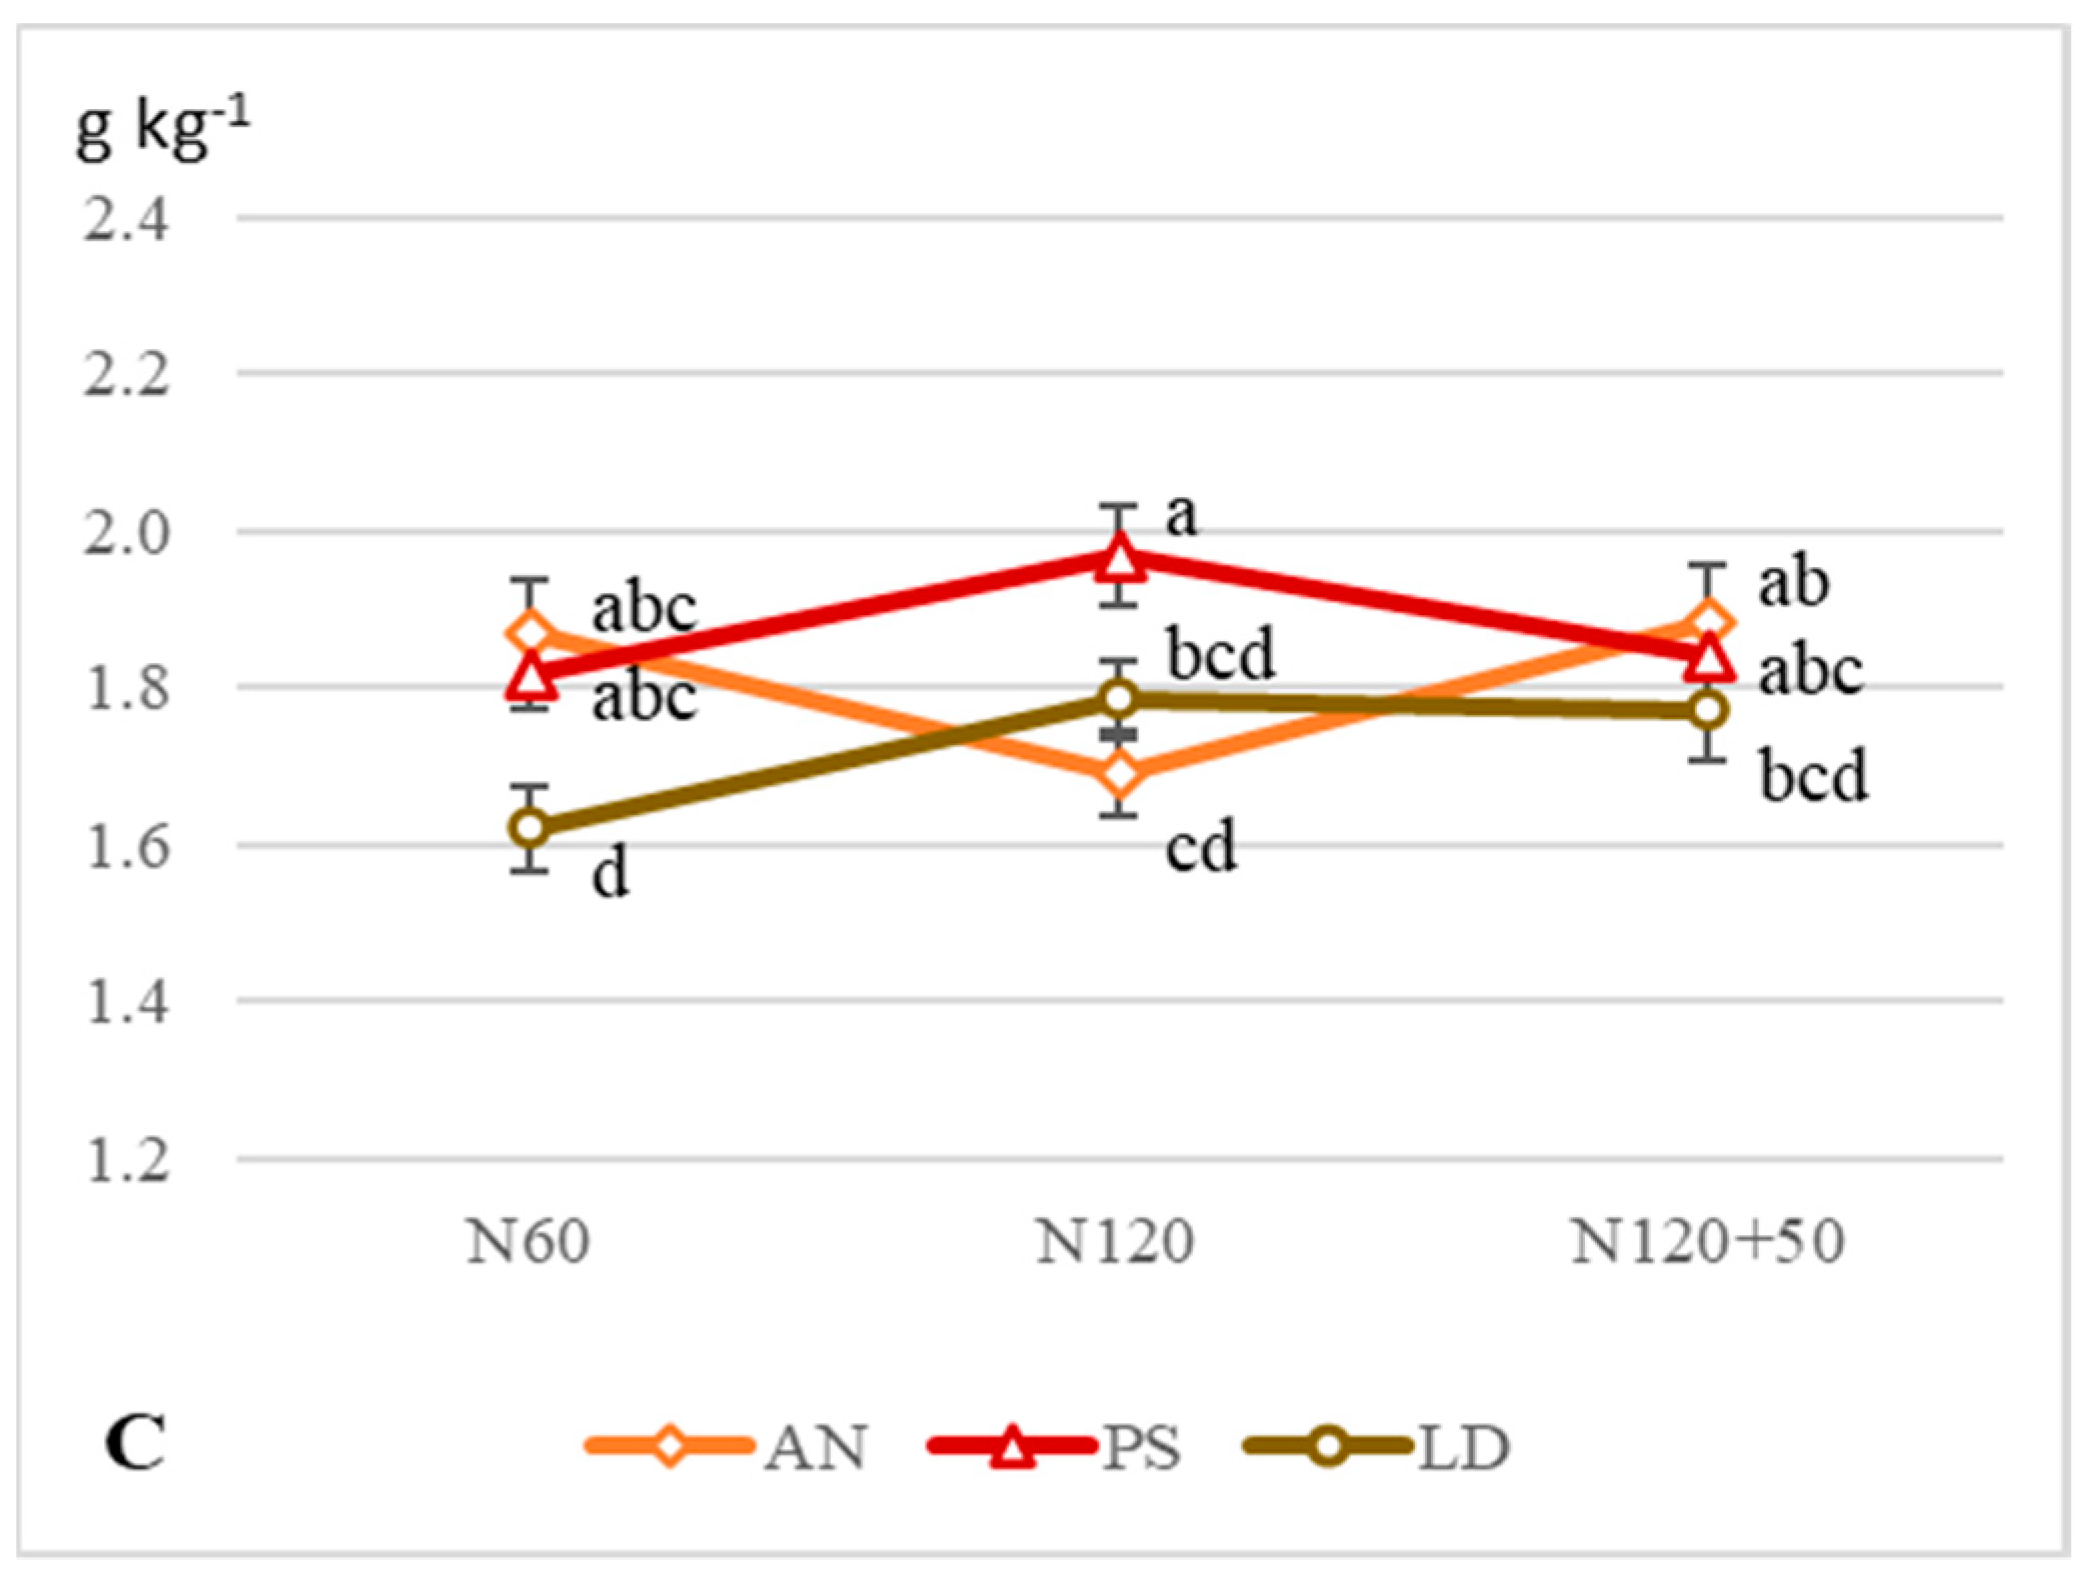
3.3.2. Mobile Humic Substances

Other researchers have reported that short-term changes in SOC are well reflected by mobile humic substances (MHSs) [46,47]. These substances consist of mobile humic (MHAs) and mobile fulvic (MFAs) acids [48]. MHAs are rapidly formed with little physical or chemical protection and are, therefore, a good energy source for microorganisms [49,50]. Mobile MFAs are considered agronomically less valuable [16].
In our studies, MHSs accounted for 16.9% of SOC at the start of the experiment. Compared to WEOC, the changes in MHSs were only partially analogous. During the intensive growth period of wheat in the first year of fertilizer application, MHSs content decreased by 24.6% compared to the beginning of the growing season and showed little change thereafter (Figure 3A). Medium and high rates of nitrogen fertilizer resulted in higher values of this indicator (IG period). Additional fertilization (120 + 50 kg N·ha−1) led to no decrease in MHSs after harvesting. With repeated fertilizer applications, a positive linear correlation was found between MHSs and WEOC during the AV (r = 0.65; p ≤ 0.05) and IG (r = 0.79; p ≤ 0.01) periods. After crop harvesting, MHSs values slightly increased following additional fertilizer application compared to the unfertilized plot.
Looking at the fertilizer forms, it was found that liquid organic fertilizers increased the MHSs content of the soil during the intensive wheat growth period in 2020, compared to AN (Figure 3B). However, after crop harvesting, a slightly higher MHSs content was observed with AN fertilization. Reseeded winter wheat demonstrated that the decrease in MHSs was more pronounced with LD fertilizer application. At the resumption of the growth season of wheat during the second year of the study, MHSs content was directly correlated with soil (0–60 cm) N-NO3 (r = 0.65 and r = 0.62, p ≤ 0.05), whereas, at the stage of vigorous growth, it was directly correlated with N-NH4 content (r = 0.50, p ≤ 0.05).
On average, the lowest MHSs values were observed with LD at 60 kg N·ha−1 and AN at 120 kg N·ha−1 (Figure 3C). Liquid organic fertilizers relatively increased the MHSs content at medium (PS, LD) and higher (LD) fertilizer rates. On average, LD values were the lowest. Such distribution of data resulted in the highest MHSs reduction with LD fertilizer over the 2 years.

3.3.3. Soil Organic Carbon

Changes in SOC can be used as an indicator of changes in the ability of soils to maintain yields and other functions [51]. A comparison of N rates showed that SOC levels tended to decrease during the winter wheat intensive growing season (IG), especially in the unfertilized soil in 2020, compared to the data at the beginning of the growing season (Figure 4A). After wheat harvesting, there were no significant differences between N fertilizer rates. At the beginning of the wheat growing season during the second year (2021), SOC content increased by 19.8–24.7% compared to the data in 2020 (AH). The lowest SOC was found in the unfertilized plots. As in the first year of wheat production, SOC decreased during intensive wheat growing (IG). After harvesting reseeded wheat, the greatest decrease in SOC was observed with medium and high rates of N fertilizer.
The fertilizer comparison showed that the highest SOC content during winter wheat growing (IG) was obtained with liquid organic fertilizer (Figure 4B). After wheat harvesting, PS was the fertilizer with the highest SOC content. During the second year of wheat cultivation, the application of LD resulted in the lowest SOC in all study periods. At the end of the experiment (2021 AH), it was found that, in most cases, the SOC content increased in the unfertilized plots or in the plots fertilized with the lowest rate of N fertilizer (60 kg N·ha−1) (Figure 4A,B).
During the first and second year of intensive growth of wheat, a linear positive relationship was found between SOC and MHSs (r = 0.82 and r = 0.85, respectively; p ≤ 0.01). The relationship between SOC and WEOC was only found with repeated fertilizer applications (r = 0.80; p ≤ 0.01). There was no relationship between SOC and soil mineral N. The results suggest that short-term changes in SOC were small, and the accuracy was low. Changes in agronomic practices require decades to achieve positive changes in SOC accumulation [12].

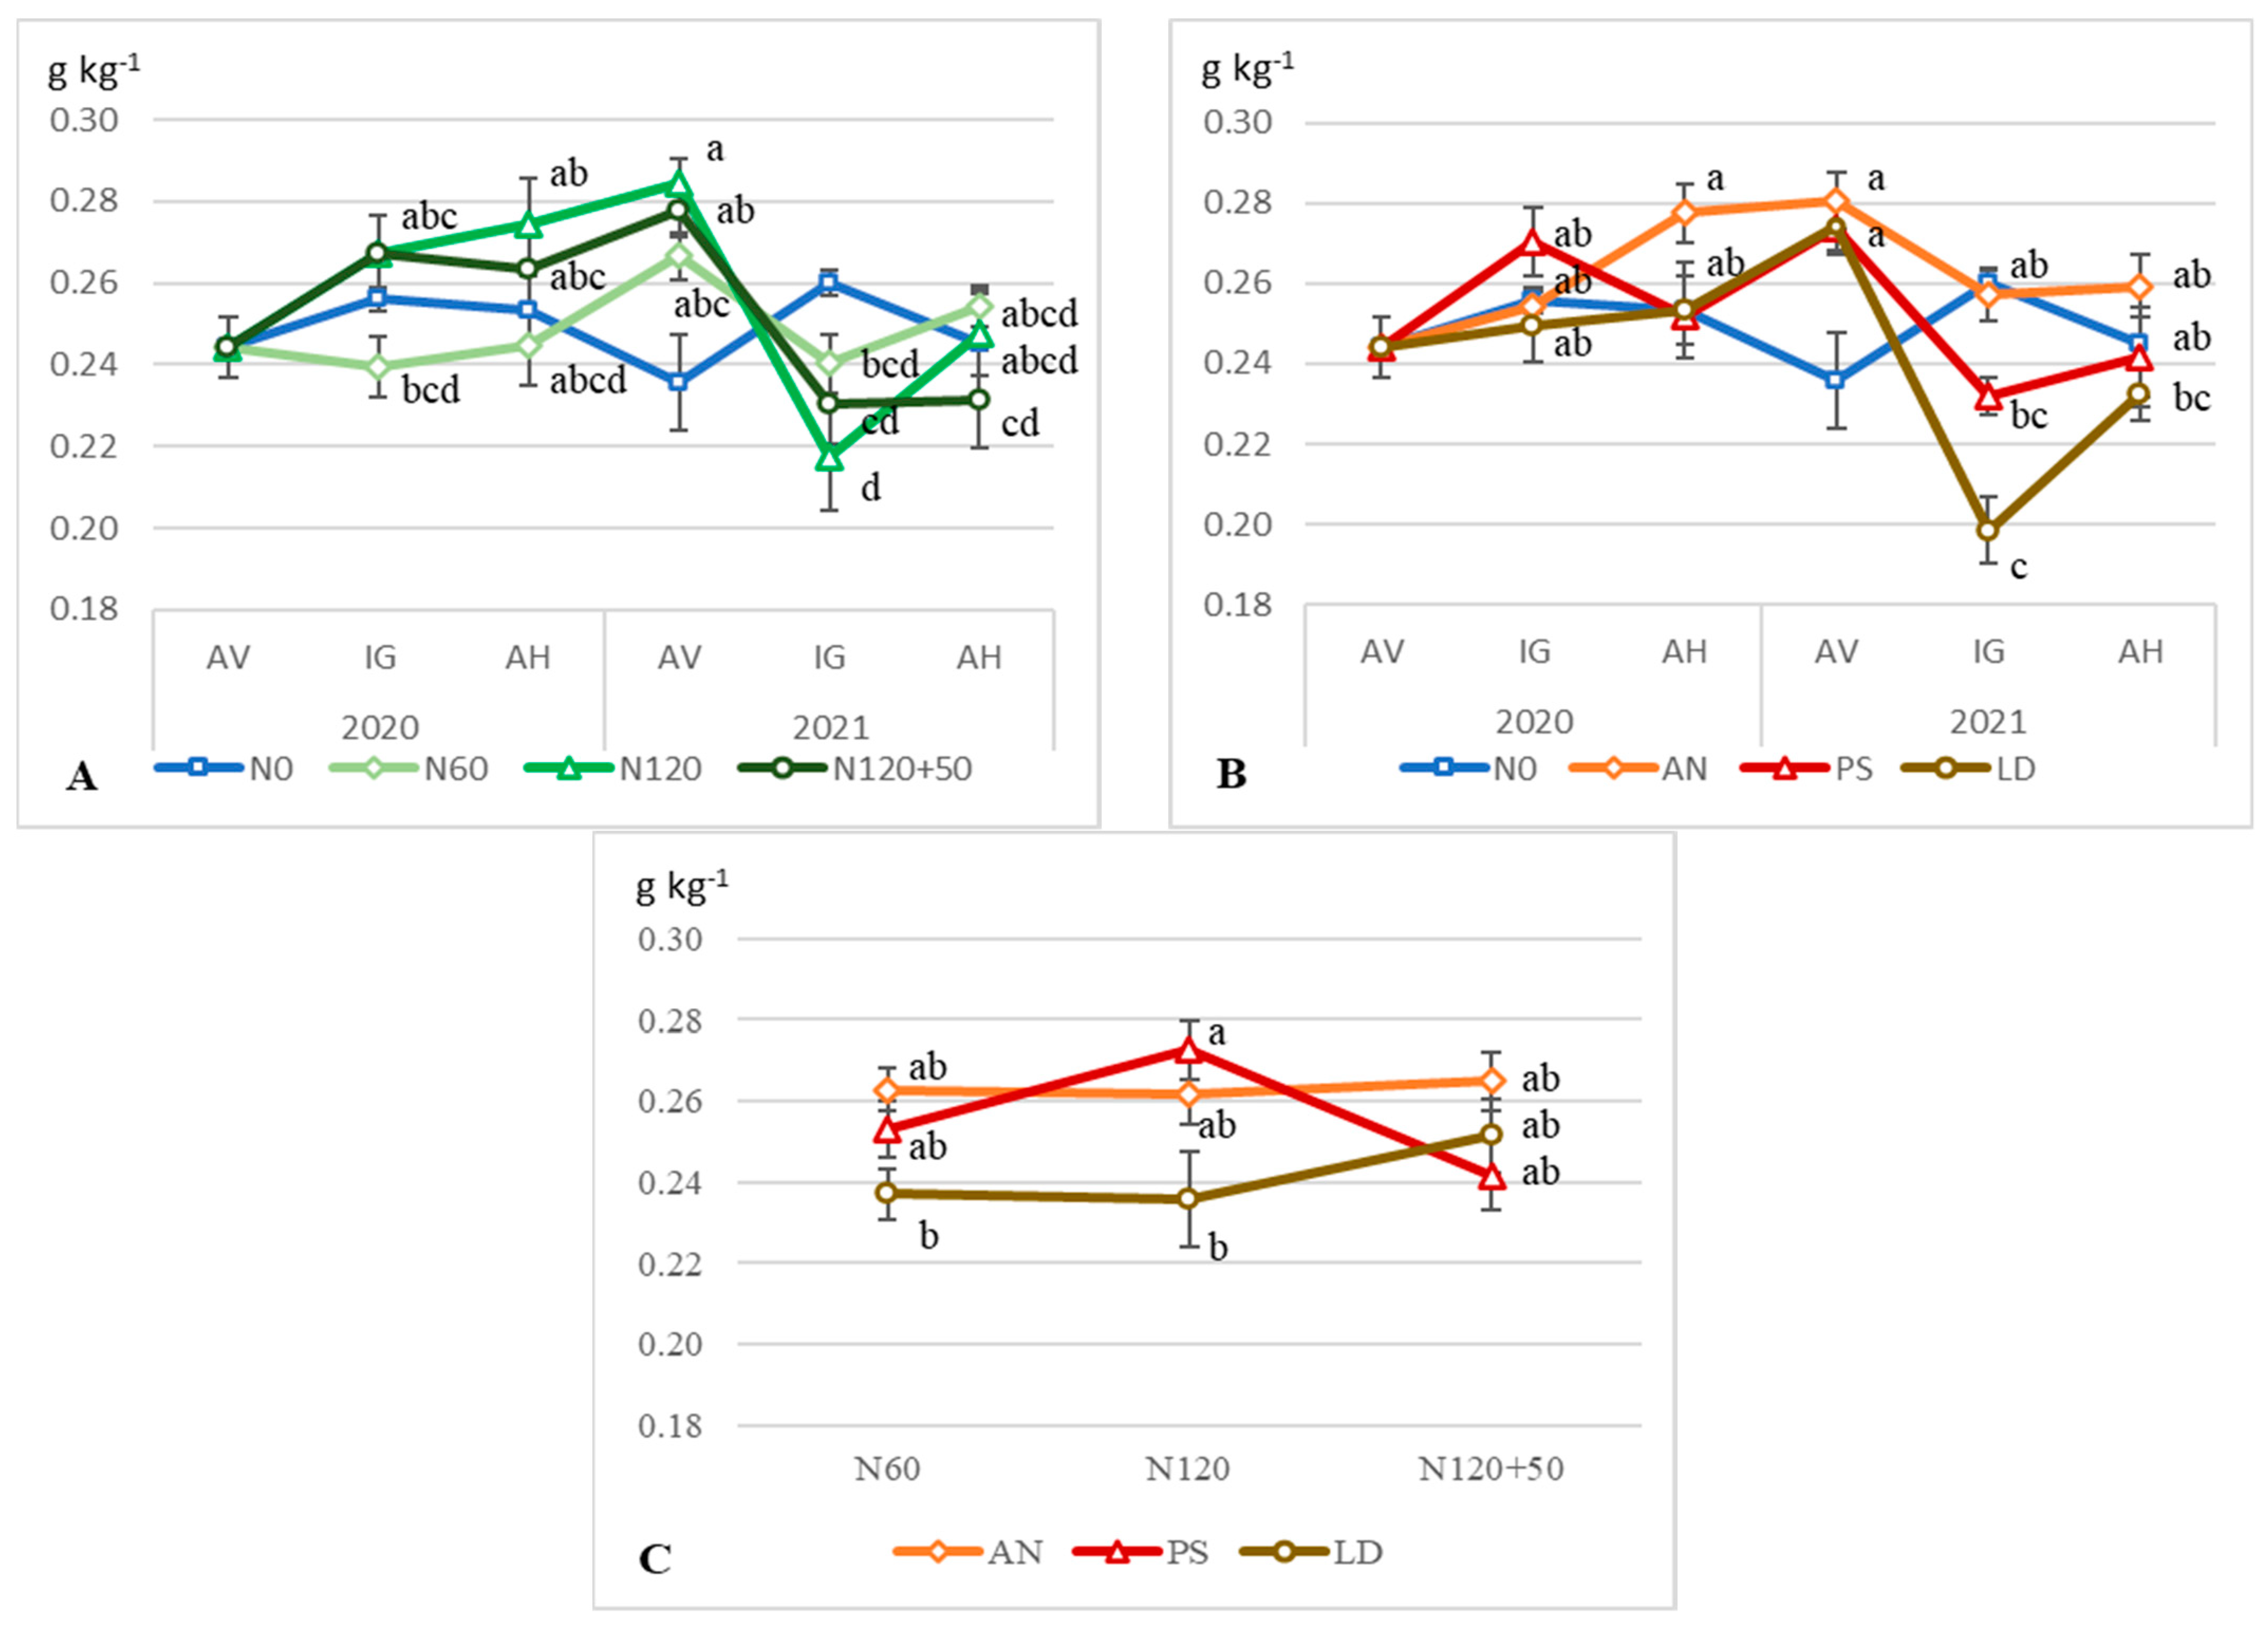
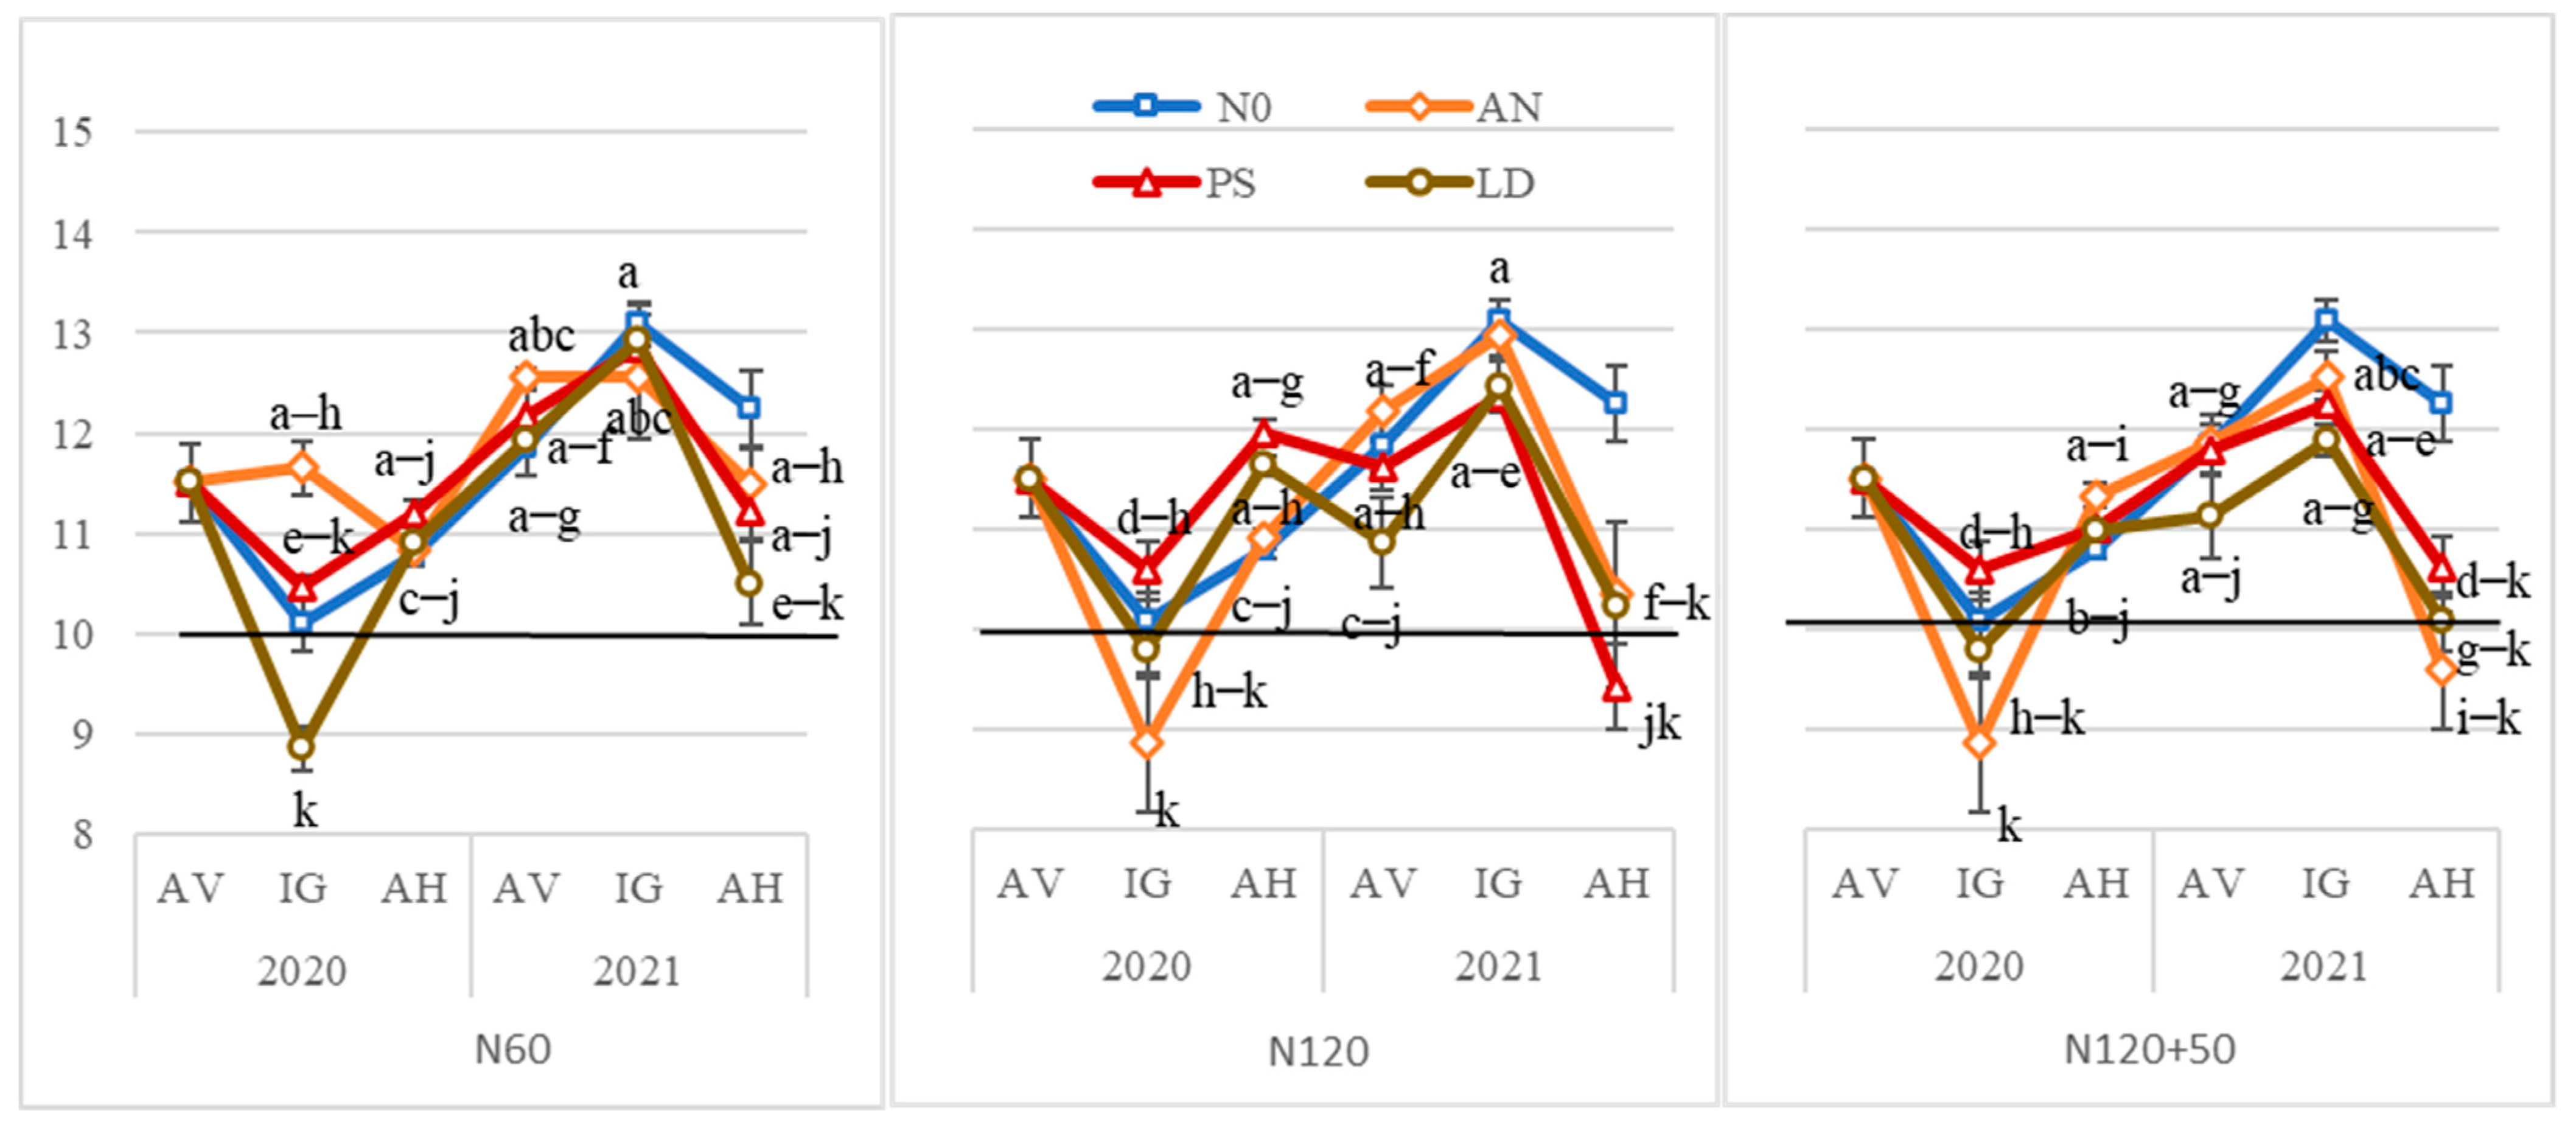
3.3.4. Carbon-to-Nitrogen Ratio

For the formation of stable soil organic compounds, the C:N ratio in ecosystem soils must be greater than 10, which indicates that the soil is undergoing humus formation. Values below 10 signal decomposition processes of organic matter [52,53]. In the first year during the wheat growing season (IG), C:N tended to decrease after fertilizer application (especially after using LD and AN) (Figure 5). After winter wheat harvest, the C:N value increased with nitrogen utilization by plants. During the intensive growth period (IG) in the second year (2021) of fertilizer application, the value of C:N was close to that seen in soil humification processes (11.89–13.09). After harvesting, the indicator decreased, mainly with higher fertilizer rates. The highest values of the indicator were recorded in the unfertilized plot and those with the lowest fertilizer rates (60 kg N·ha−1).

3.4. Productivity of Waxy Winter Wheat

During the experimental years, the performance of the waxy winter wheat was influenced by varietal characteristics and meteorological conditions. It can be concluded that the response of this wheat variety to nitrogen fertilizer was low. In the first year of fertilizer application, soil and environmental conditions were favorable for yield formation. During the growing season of winter wheat, N-NO3 content of the soil increased, with a significant proportion of mineral N coming from N-NH4 (Table 3 and Table 4). This was confirmed by the wheat grain yield of 3943 kg·ha−1 obtained in the unfertilized plot (Table 6). The yield structure elements showed that fertilization resulted in a high number of grains per unit area (on average, 18,209 units·m−2), although the 1000-grain weight was low (35.46 g). The yields of the plots fertilized with different fertilizer rates ranged from 4649 to 5946 kg·ha−1, and there were no significant differences between fertilizer rates (60, 120, and 120 + 50 kg N·ha−1) The highest yield increase was obtained at a fertilizer rate of 60 kg N·ha−1. There was an increasing trend in wheat yield with liquid organic fertilizer. A repeated application of fertilizer in 2021 resulted in half the yield of 2020 (on average 2412 kg·ha−1). Such yield was due to the low number of grains·m−2 (on average, 10,993 units·m−2) and the low 1000-grain weight (on average, 30.15 g). The main positive effect on grain number was due to AN. The 1000-grain weight did not differ significantly between fertilizer treatments. This indicates that waxy wheat varieties are adapted to use fertilizer N less efficiently than non-waxy wheat. Mineral N fertilizers were more effective during the 2021 experimental period. The most significant increase in grain yield was obtained at medium rates of N fertilizer (120 kg N·ha−1). Additional fertilization did not have any pronounced effect on grain yield.

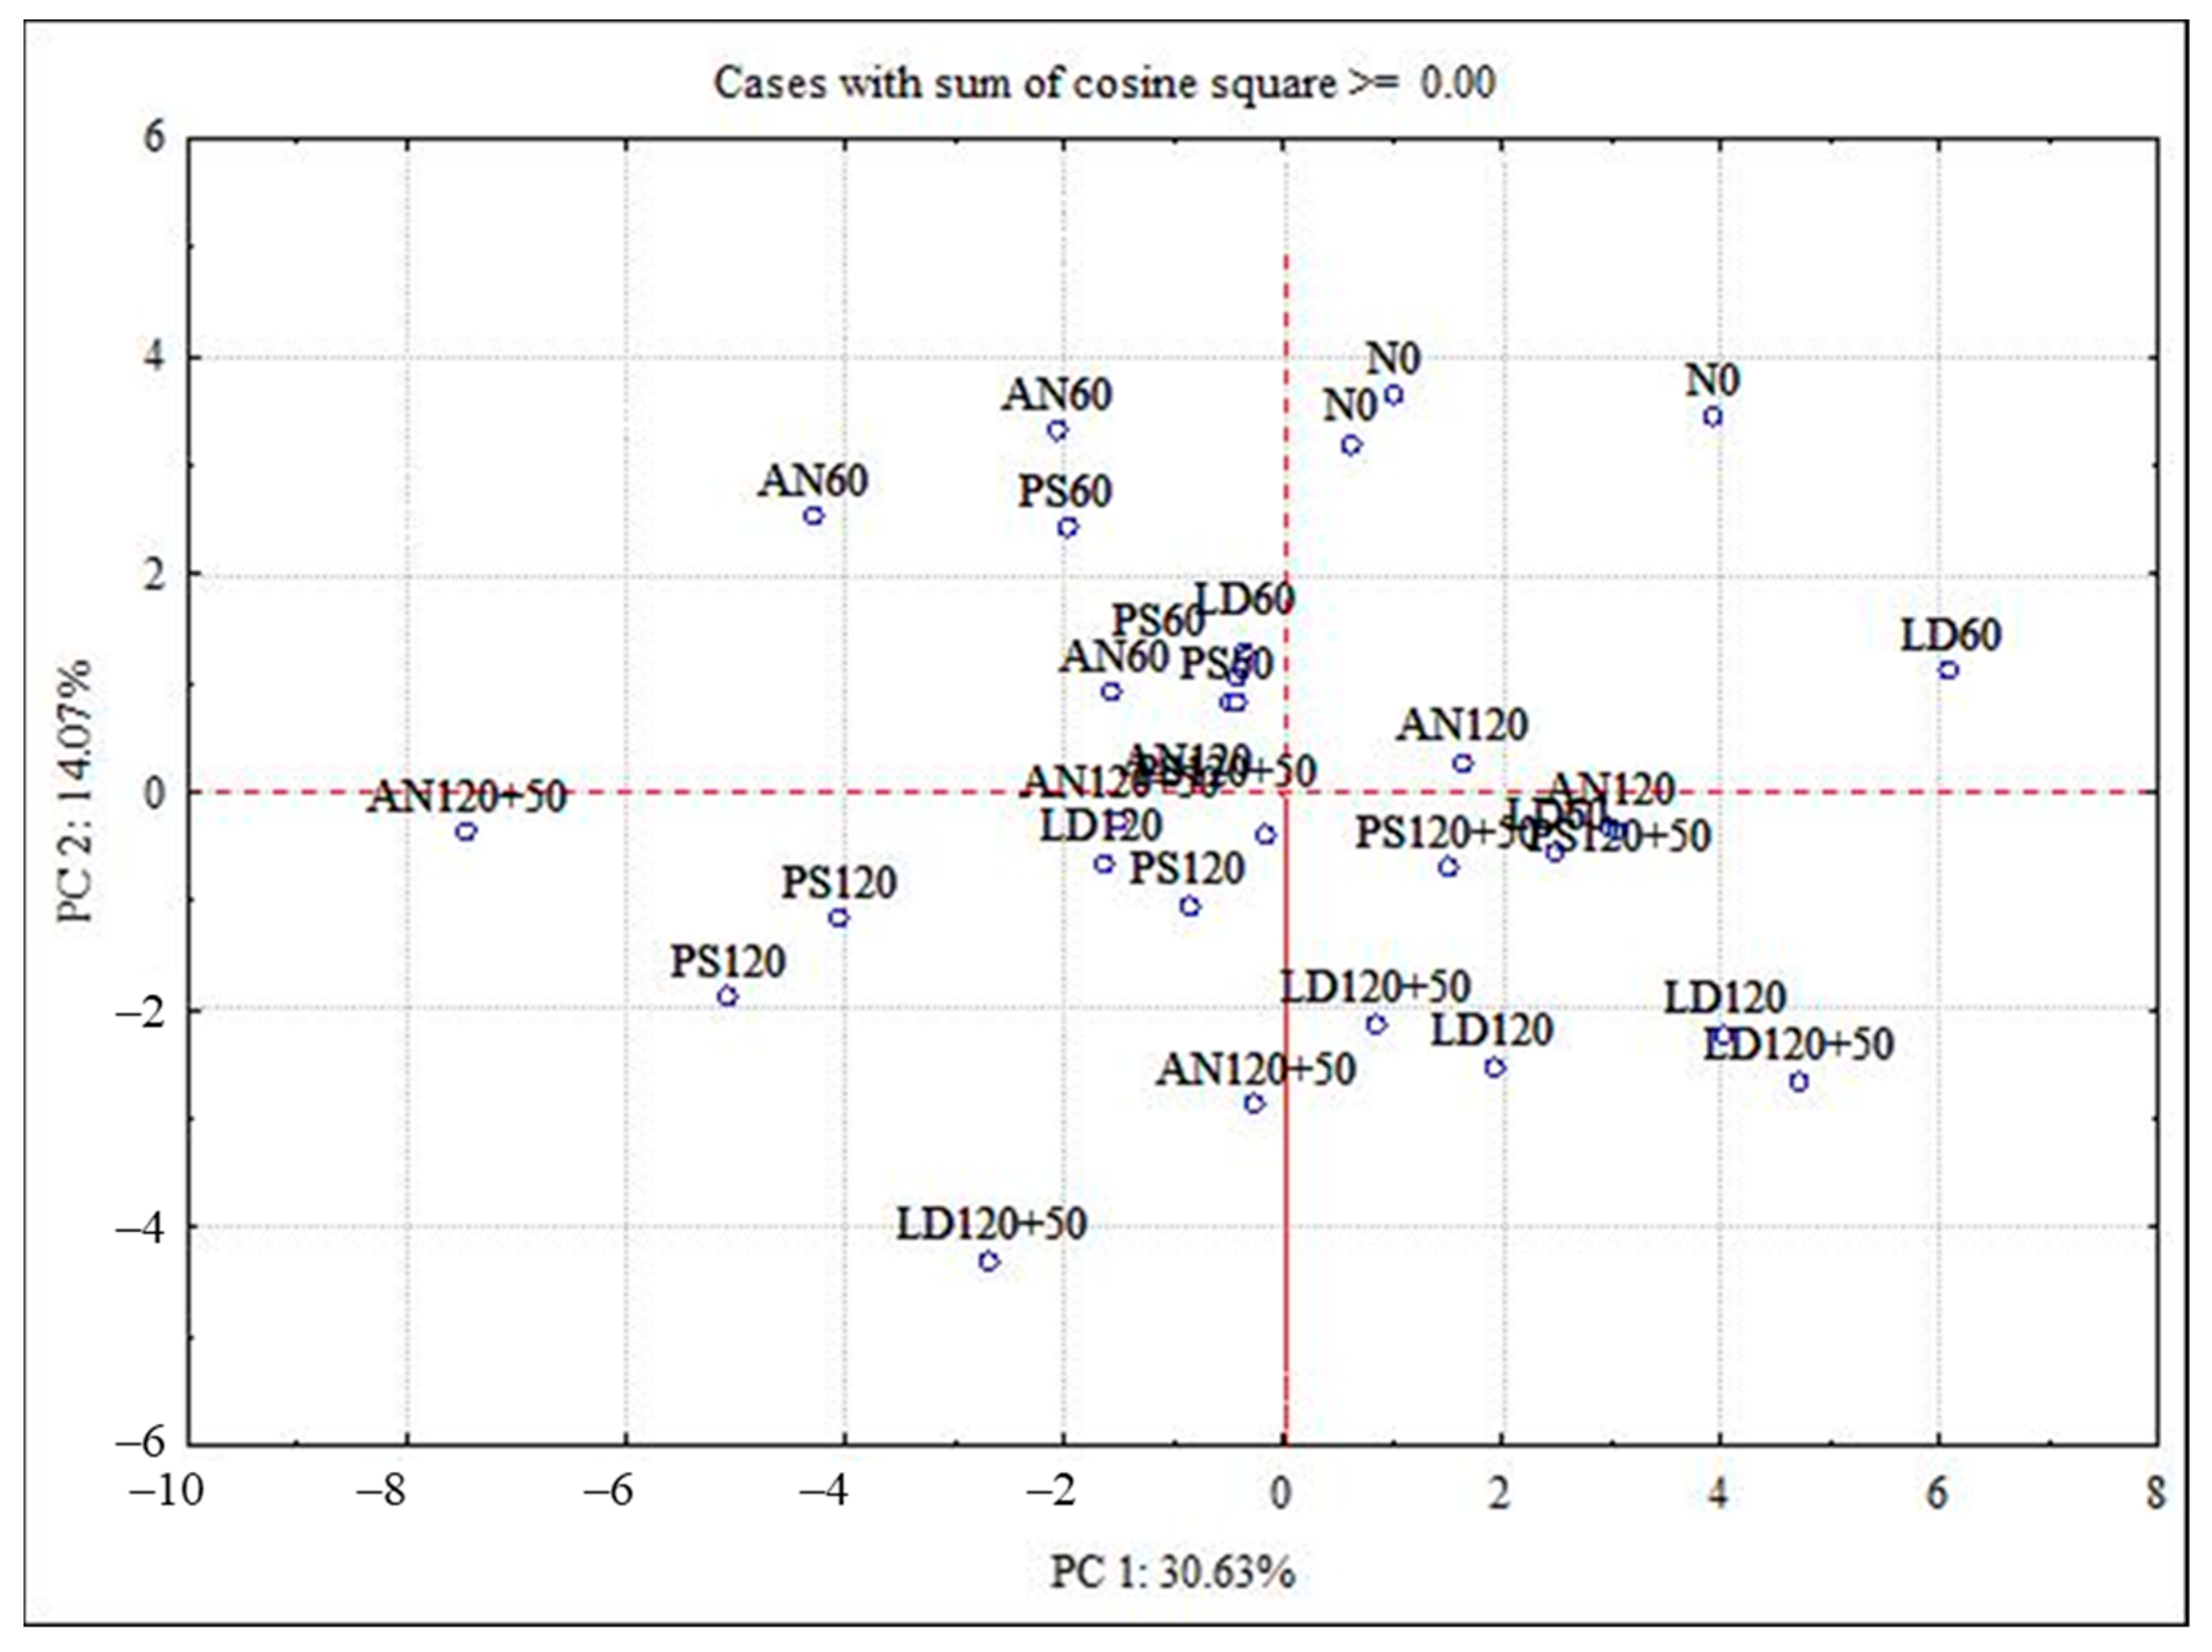
3.5. PCA Loadings Based on Correlations

Principal component analysis (PCA) was performed to obtain multivariate interactions. Datasets of different indicators of soil carbon, soil nitrogen, and waxy winter wheat grain productivity were used (Table 7), when testing three fertilizers (AN, PS, and LD), four nitrogen rates (0, 60, 120, and 120 + 50 kg N·ha−1), and soil collected two (2020: IG and AH) or three (2021: AV, IG, and AH) times (just for soil indicators) per year. The first two principal components (PC1 and PC2) accounted for 41.7% and 44.7% of the data variance in 2020 and 2021, respectively (Table 7; Figure 6).
Correlations were obtained using a PCA-based correlation procedure (Table 7). We analyzed the effect of different soil collection times on the correlation between soil and grain productivity indicators. Results of correlation analysis showed that, at all soil collection timepoints, decreasing SOC values had a strong negative correlation with MHSs, mostly with the separate acids (MFAs and MHAs). In addition, decreasing SOC and MHSs were also negatively correlated with Ntot and WEOC (moderate Ntot correlation detected at four of five collection timepoints; the strongest WEOC relations were detected at the 2020 IG and 2021 AH collection timepoints). All intercorrelations between separate soil collection times were determined in PC1 in 2021, whereas they were in distinct PCs in 2020. Unfortunately, the relationships between analyzed soil quality indicators and grain productivity parameters were weak in each year.
The diagram of the first two components presented for the second (2021) year showed a close distribution between unfertilized treatments (N0) and lower fertilization intensity (60 kg N·ha−1), but sparse and mixed distribution of higher fertilization intensities (120 and 120 + 50 kg N·ha−1) (Figure 6). The corresponding grouping in the first year (2020) was not observed (data not shown). The clustering related to different types of fertilizers was not defined in any year.

4. Discussion

Anaerobic digestion produces a biologically stable and valuable fertilizer, i.e., digestate, intended for sustainable production, as a response to climate change limiting fossil resources [54,55]. It is also a way to manage the digestate produced during biogas production and probably a cheaper way to fertilize plants [56]. Depending on the biogas technology, the digestate can be a solid or a liquid material with different chemical compositions. These biogas production wastes used for fertilization can contribute to soil organic matter (SOM) turnover, influencing the biological, chemical, and physical soil characteristics as a soil amendment [55,57]. However, the yield of fertilized plants remains similar or higher, compared to mineral fertilizers [58]. The favorable effects of digestate are caused by its soluble macro- and micronutrient content [59]
The physical and chemical differences between fertilizers explain the intensity of the fertilizer’s action. The liquid fraction of the anaerobic digestate decomposes quickly due to the narrow C:N ratio and the low cellulose content [60]. According to the literature, mineral N content in soil is increased more by digestate than by mineral NPK fertilizers [61]. The use of straw as a fertilizer in combination with digestate can increase N immobilization while reducing the N-NH4 content in soil [62]. Nitrogen from digestates is quickly available to plants, but it can be easily lost due to low temperatures when soil microbiological processes slow down [58]. The effect of digestates on soil biology is poorly understood, although half of the literature has indicated a neutral effect of biogas digestates on soil microbial quality [63]. Ammonia emission data indicated that the correct use of digestate and derived products required their injection into the soil, thus avoiding ammonia volatilization into the air and preserving fertilizer value. Incorporation of digestate into the soil reduces ammonia emissions by 69–77%, compared with spreading fertilizers on the soil surface [54].
Water-extractable organic carbon is found in soil leachate [64] and has high degradability; therefore, the variability in its concentration is primarily determined by seasonal weather conditions [65] and average annual rainfall [64]. Sharma et al. (2022) revealed that rice straw incorporation and N fertilization significantly increased labile C pools, especially during the period of intensive wheat growth [57]. It is suggested that application of N fertilizers does not affect the leaching of organic carbon; nevertheless, it may increase organic N leaching [66]. Barłóg et al. [62] reported that fertilization did not significantly affect the SOC, Ntot, and C:N ratio parameters; however, SOC and Ntot concentrations increased in the topsoil layer when fertilizers were applied compared to the control. Other researchers have reported that the biochemical composition of soil organic matter was less affected by digestate than by pig slurry [67]. Głowacka et al. [56] stated that the use of digestate improved the physicochemical properties of highly acidic soil and increased the yield of switchgrass forage without diminishing its nutritional value. In terms of sustainability, the combined use of biogas digestate and synthetic fertilizer is recommended [55].
Nitrogen is an efficient and effective element for increasing agricultural crop yields [23,24,25,26,27,28]. However, waxy winter wheat varieties have specific nutrient (especially N) requirements [24,31] with unique reactions to the nutrient medium in soil [25], which have been little studied. From a previous study, [24] it is known that waxy cultivars, including ‘Eldija’, are not very responsive to intensive cultivation (200 kg N·ha−1) compared with low-input cultivation (130 kg N·ha−1). According to our data, in 2021, the failure of the waxy wheat type to take up an average rate of N fertilizer (120 kg N·ha−1) may have led to N losses. Liquid organic fertilizers PS and LD are characterized by relatively low organic N content [28]. However, during the growing season, additional mineral N fertilization can make this N readily available to plants.
Reduced conversion of saccharase to starch at the late stage of grain filling is the main cause of the low kernel weight and total starch accumulation in waxy wheat, which is also responsible for the lower yields of waxy wheat grain [30]. The lower yield performance of waxy wheat ‘Eldija’ can also be partially explained by the differences in vegetation duration [24], as earlier genotypes had a lower grain yield. According to Skudra and Linina [26], the application of nitrogen increased the grain yield of late varieties by 10% as compared to early varieties.
Our research showed that the annual meteorological conditions had a significant influence on the variation of clay loam soil C and N compounds (especially their mobile forms) and on waxy winter wheat grain yield. It could be concluded that many of the N and SOC transformations were closely linked to soil biological properties, soil physical conditions, and meteorological conditions [68]. We believe that long-term field studies with liquid organic fertilizers under different pedoclimatic conditions are worthwhile in order to differentiate promising organic fertilization practices.

5. Conclusions

To summarize the data, it can be concluded that the annual meteorological conditions had a significant influence on the variation of soil C and N compounds (especially their mobile forms) and on waxy winter wheat grain yield. At the beginning of the growing season, soil SOC and Ntot tended to regenerate. However, during the growing season, variations in SOC were more influenced by N rates than fertilizer forms. After a 2 year application of mineral and organic fertilizers, SOC and Ntot increased compared to the data at the beginning of the experiment. This may have been due to the second year of unfavorable conditions for winter wheat cultivation, when the effect of fertilizer on yield was low. The highest SOC levels were found in the unfertilized plots and in the plots fertilized with 60 kg N·ha−1. The highest C:N ratio was recorded in the unfertilized plots, as well as in the plots fertilized with AN, PS, and LD with a 60 kg N·ha−1 rate, whereas the lowest ratio was observed in the fertilized plots with PS (120 kg N·ha−1) and AN (120 + 50 kg N·ha−1). Weather changes had a negative impact on N transformation in the soil, N uptake from fertilizer, and winter wheat grain yield.

Author Contributions

Conceptualization, A.A.; methodology, D.P., J.C., A.A., and A.S. (Alvyra Slepetiene); software, D.P., J.C., and V.G.; validation, D.P., A.A., J.C., and A.S. (Aida Skersiene); formal analysis, D.P. and A.S. (Aida Skersiene); investigation, D.P.; resources, D.P., A.A., A.S. (Alvyra Slepetiene), and V.G.; data curation, D.P., A.A., and J.C.; writing—original draft preparation, D.P., A.A., and J.C.; writing—review and editing, D.P., A.A., J.C., A.S. (Alvyra Slepetiene), A.S. (Aida Skersiene), and V.G.; visualization, D.P. and J.C.; supervision, A.A. and J.C.; project administration, J.C.; funding acquisition, D.P. All authors read and agreed to the published version of the manuscript.

Funding

The paper presented experimental findings obtained through the long-term research program “Biopotential of plants for multifunctional use and sustainability of agroecosystems” implemented by the Lithuanian Research Center for Agriculture and Forestry.

Institutional Review Board Statement

Not applicable.

Informed Consent Statement

Not applicable.

Data Availability Statement

Not applicable.

Acknowledgments

We acknowledge the technical personnel and other contributors for their support in fieldwork and laboratory analyses. We are thankful to the Director of Environment Tadas Palubinskas and other employees of UAB Idavang for the organic fertilizers and their delivery, as well as to Zilvinas Liatukas, Senior Researcher of Cereal Breeding Department, LAMMC, for the waxy wheat seeds.

Conflicts of Interest

The authors declare no conflict of interest.

References

  1. Gross, C.D.; Harrison, R.B. The case for digging deeper: Soil organic carbon storage, dynamics, and controls in our changing world. Soil Syst. 2019, 3, 28. [Google Scholar] [CrossRef] [Green Version]
  2. Bolinder, M.A.; Crotty, F.; Elsen, A.; Frac, M.; Kismányoky, T.; Lipiec, J.; Tits, M.; Tóth, Z.; Kätterer, T. The effect of crop residues, cover crops, manures and nitrogen fertilization on soil organic carbon changes in agroecosystems: A synthesis of reviews. Mitig. Adapt. Strateg. Glob. Chang. 2020, 25, 929–952. [Google Scholar] [CrossRef]
  3. Page, K.L.; Dang, Y.P.; Dalal, R.C. The ability of conservation agriculture to conserve soil organic carbon and the subsequent impact on soil physical, chemical, and biological properties and yield. Front. Sustain. Food Syst. 2020, 4, 31. [Google Scholar] [CrossRef] [Green Version]
  4. Kochiieru, M.; Lamorski, K.; Feizienė, D.; Feiza, V.; Šlepetienė, A.; Volungevičius, J. Land use and soil types affect macropore network, organic carbon and nutrient retention, Lithuania. Geoderma Reg. 2022, 28, e00473. [Google Scholar] [CrossRef]
  5. Lal, R. Soil health and carbon management. Food Energy Secur. 2016, 5, 212–222. [Google Scholar] [CrossRef]
  6. Franzluebbers, A.J. Grass roots of soil carbon sequestration. Carbon Manag. 2012, 3, 9–11. [Google Scholar] [CrossRef]
  7. Lal, R. Digging deeper: A holistic perspective of factors affecting soil organic carbon sequestration in agroecosystems. Glob. Chang. Biol. 2018, 24, 3285–3301. [Google Scholar] [CrossRef] [PubMed]
  8. Slepetiene, A.; Kochiieru, M.; Jurgutis, L.; Mankeviciene, A.; Skersiene, A.; Belova, O. The effect of anaerobic digestate on the soil organic carbon and humified carbon fractions in different land-use systems in Lithuania. Land 2022, 11, 133. [Google Scholar] [CrossRef]
  9. Sharma, P.; Singh, A.; Kahlon, C.S.; Brar, A.S.; Grover, K.K.; Dia, M.; Steiner, R.L. The role of cover crops towards sustainable soil health and agriculture—A review paper. Am. J. Plant Sci. 2018, 09, 1935–1951. [Google Scholar] [CrossRef] [Green Version]
  10. Mehra, P.; Baker, J.; Sojka, R.E.; Bolan, N.; Desbiolles, J.; Kirkham, M.B.; Ross, C.; Gupta, R.A. Review of Tillage Practices and Their Potential to Impact the Soil Carbon Dynamics. Adv. Agron. 2018, 150, 185–230. [Google Scholar] [CrossRef]
  11. Šlepetienė, A.; Kadžiulienė, Ž.; Feizienė, D.; Liaudanskienė, I.; Amalevičiūtė-Volungė, K.; Šlepetys, J.; Velykis, A.; Armolaitis, K.; Skersienė, A. The distribution of organic carbon, its forms and macroelements in agricultural soils. Zemdirbyste-Agriculture 2020, 107, 291–300. [Google Scholar] [CrossRef]
  12. Bhowmik, A.; Fortuna, A.M.; Cihacek, L.J.; Bary, A.I.; Cogger, C.G. Use of biological indicators of soil health to estimate reactive nitrogen dynamics in long-term organic vegetable and pasture systems. Soil Biol. Biochem. 2016, 103, 308–319. [Google Scholar] [CrossRef] [Green Version]
  13. Fortuna, A.; Harwood, R.; Kizilkaya, K.; Paul, E.A. Optimizing nutrient availability and potential carbon sequestration in an agroecosystem. Soil Biol. Biochem. 2003, 35, 1005–1013. [Google Scholar] [CrossRef]
  14. Iqbal, M.; van Es, H.M.; Anwar-ul-Hassan; Schindelbeck, R.; Moebius-Clune, B.N. Soil health indicators as affected by long-term application of farm manure and cropping patterns under semi-arid climates. Int. J. Agric. Biol. 2014, 16, 242–250. [Google Scholar]
  15. López-Garrido, R.; Madejón, E.; León-Camacho, M.; Girón, I.; Moreno, F.; Murillo, J.M. Reduced tillage as an alternative to no-tillage under Mediterranean conditions: A case study. Soil Tillage Res. 2014, 140, 40–47. [Google Scholar] [CrossRef]
  16. Bhowmik, A.; Fortuna, A.M.; Cihacek, L.J.; Bary, A.I.; Carr, P.M.; Cogger, C.G. Potential carbon sequestration and nitrogen cycling in long-term organic management systems. Renew. Agric. Food Syst. 2017, 32, 498–510. [Google Scholar] [CrossRef] [Green Version]
  17. Lithuanian Department of Statistics. 2022. Available online: https://osp.stat.gov.lt/statistiniu-rodikliu-analize#/ (accessed on 8 November 2022).
  18. Lithuania National Inventory Report. 2022, p. 275. Available online: https://unfccc.int/documents/461952/ (accessed on 14 November 2022).
  19. Lazcano, C.; Zhu-Barker, X.; Decock, C. Effects of organic fertilizers on the soil microorganisms responsible for N2O emissions: A review. Microorganisms 2021, 9, 983. [Google Scholar] [CrossRef]
  20. Lazcano, C.; Gómez-Brandón, M.; Revilla, P.; Domínguez, J. Short-term effects of organic and inorganic fertilizers on soil microbial community structure and function: A field study with sweet corn. Biol. Fertil. Soils 2013, 49, 723–733. [Google Scholar] [CrossRef]
  21. Ling, N.; Zhu, C.; Xue, C.; Chen, H.; Duan, Y.; Peng, C.; Guo, S.; Shen, Q. Insight into how organic amendments can shape the soil microbiome in long-term field experiments as revealed by network analysis. Soil Biol. Biochem. 2016, 99, 137–149. [Google Scholar] [CrossRef]
  22. García-Gil, J.C.; Plaza, C.; Soler-Rovira, P.; Polo, A. Long-term effects of municipal solid waste compost application on soil enzyme activities and microbial biomass. Soil Biol. Biochem. 2000, 32, 1907–1913. [Google Scholar] [CrossRef]
  23. Staugaitis, G.; Poškus, K.; Brazienė, Z.; Paltanavičius, V. Optimization of nitrogen fertilisation of winter wheat. Zemdirbyste-Agriculture 2021, 108, 203–208. [Google Scholar] [CrossRef]
  24. Cesevičienė, J.; Gorash, A.; Liatukas, Ž.; Armonienė, R.; Ruzgas, V.; Statkevičiūtė, G.; Jaškūnė, K.; Brazauskas, G. Grain yield performance and quality characteristics of waxy and non-waxy winter wheat cultivars under high and low-input farming systems. Plants 2022, 11, 882. [Google Scholar] [CrossRef]
  25. Makhammadiev, S.; Djurakul, S.; Bakhtiyor, A.; Jabbarov, Z.; Jobborov, B.; Mirzarakhmatovich, T.M.; Gulomovich, M.K. The formation of the nutrient medium in the soil is influenced by varieties and fertilizer and its impact on grain yield of winter wheat. Ann. Rom. Soc. Cell Biol. 2021, 25, 5218–5230. [Google Scholar]
  26. Skudra, I.; Linina, A. The influence of meteorological conditions and nitrogen fertilizer on wheat grain yield and quality. In Proceedings of the 6th Baltic Conference on Food Science and Technology: Innovations for Food Science and Production, FOODBALT-2011-Conference Proceedings, Jelgava, Latvia, 5–6 May 2011; pp. 23–26. [Google Scholar]
  27. Marinciu, C.M.; Şerban, G.; Ittu, G.; Mustăţea, P.; Mandea, V.; Păunescu, G.; Voica, M.; Săulescu, N.N. Response of several winter wheat cultivars to reduced nitrogen fertilization. Rom. Agric. Res. 2018, 2018, 177–182. [Google Scholar]
  28. Whalen, J.K.; Thomas, B.W.; Sharifi, M. Novel Practices and Smart Technologies to Maximize the Nitrogen Fertilizer Value of Manure for Crop Production in Cold Humid Temperate Regions. Adv. Agron. 2019, 153, 1–85. [Google Scholar] [CrossRef]
  29. Hung, V.P.; Maeda, T.; Morita, N. Waxy and high-amylose wheat starches and flours—Characteristics, functionality and application. Trends Food Sci. Technol. 2006, 17, 448–456. [Google Scholar] [CrossRef]
  30. Zi, Y.; Ding, J.; Song, J.; Humphreys, G.; Peng, Y.; Li, C.; Zhu, X.; Guo, W. Grain Yield, Starch Content and Activities of Key Enzymes of Waxy and Non-waxy Wheat (Triticum aestivum L.). Sci. Rep. 2018, 8, 4548. [Google Scholar] [CrossRef] [Green Version]
  31. Liatukas, Ž.; Ruzgas, V.; Gorash, A.; Cecevičienė, J.; Armonienė, R.; Statkevičiūtė, G.; Jaškūnė, K.; Brazauskas, G. Development of the new waxy winter wheat cultivars Eldija and Sarta. Czech J. Genet. Plant Breed. 2021, 57, 149–157. [Google Scholar] [CrossRef]
  32. Slepetiene, A.; Volungevicius, J.; Jurgutis, L.; Liaudanskiene, I.; Amaleviciute-Volunge, K.; Slepetys, J.; Ceseviciene, J. The potential of digestate as a biofertilizer in eroded soils of Lithuania. Waste Manag. 2020, 102, 441–451. [Google Scholar] [CrossRef]
  33. Jurgutis, L.; Šlepetienė, A.; Amalevičiūtė-Volungė, K.; Volungevičius, J.; Šlepetys, J. The effect of digestate fertilisation on grass biogas yield and soil properties in field-biomass-biogas-field renewable energy production approach in Lithuania. Biomass Bioenergy 2021, 153, 106211. [Google Scholar] [CrossRef]
  34. Baethgen, W.E.; Alley, M.M. A manual colorimetric procedure for measuring ammonium nitrogen in soil and plant Kjeldahl digests. Commun. Soil Sci. Plan. 1989, 20, 961–969. [Google Scholar] [CrossRef]
  35. Saez-Plaza, P.; Navas, M.J.; Wybraniec, S.; Michałowski, T.; Asuero, A.G. An overview of the Kjeldahl method of nitrogen determination. Part II. Sample preparation, working scale, instrumental finish, and quality control. Crit. Rev. Anal. Chem. 2013, 43, 224–272. [Google Scholar] [CrossRef]
  36. Nikitin, B.A. A method for soil humus determination. Agric. Chem. 1999, 3, 156–158. [Google Scholar]
  37. Ponomareva, V.V.; Plotnikova, T.A. Humus and Soil-Forming; Publishing house Nauka: Leningrad, Russia, 1980. [Google Scholar]
  38. Jokubauskaite, I.; Amaleviciute, K.; Lepane, V.; Slepetiene, A.; Slepetys, J.; Liaudanskiene, I.; Karcauskiene, D.; Booth, C.A. High performance liquid chromatography (HPLC)-size exclusion chromatography (SEC) for qualitative detection of humic substances and natural organic matter in mineral soils and peats in Lithuania. Int. J. Environ. Anal. Chem. 2014, 95, 508–519. [Google Scholar] [CrossRef]
  39. Volungevičius, J.; Amalevičiūtė, K.; Liaudanskienė, I.; Šlepetienė, A.; Šlepetys, J. Chemical properties of Pachiterric Histosol as influenced by different land use. Zemdirbyste-Agriculture 2015, 102, 123–132. [Google Scholar] [CrossRef] [Green Version]
  40. Klages, S.; Heidecke, C.; Osterburg, B. The impact of agricultural production and policy on water quality during the dry year 2018, a case study from Germany. Water 2020, 12, 1519. [Google Scholar] [CrossRef]
  41. Mahmud, K.; Panday, D.; Mergoum, A.; Missaoui, A. Nitrogen losses and potential mitigation strategies for a sustainable agroecosystem. Sustainability 2021, 13, 2400. [Google Scholar] [CrossRef]
  42. Yan, M.; Pan, G.; Lavallee, J.M.; Conant, R.T. Rethinking sources of nitrogen to cereal crops. Glob. Change Biol. 2020, 26, 191–199. [Google Scholar] [CrossRef] [Green Version]
  43. Rochette, P.; Liang, C.; Pelster, D.; Bergeron, O.; Lemke, R.; Kroebel, R.; MacDonaldb, D.; Yanf, W.; Flemming, C. Soil nitrous oxide emissions from agricultural soils in Canada: Exploring relationships with soil, crop and climatic variables. Agr. Ecosyst. Environ. 2018, 254, 69–81. [Google Scholar] [CrossRef]
  44. Zsolnay, Á. Dissolved organic matter: Artefacts, definitions, and functions. Geoderma 2003, 113, 187–209. [Google Scholar] [CrossRef]
  45. Liaudanskiene, I.; Šlepetienė, A.; Šlepetys, J. Distribution of organic carbon in humic and granulodensimetric fractions of soil as influenced by tillage and crop rotation. EST J. Ecol. 2013, 62, 1–17. [Google Scholar] [CrossRef] [Green Version]
  46. Slepetiene, A.; Slepetys, J. Status of humus in soil under various long-term tillage systems. Geoderma 2005, 127, 207–215. [Google Scholar] [CrossRef]
  47. Bogužas, V.; Mikučionienė, R.; Šlepetienė, A.; Sinkevičienė, A.; Feiza, V.; Steponavičienė, V.; Adamavičienė, A. Long-term effect of tillage systems, straw and green manure combinations on soil organic matter. Zemdirbyste-Agriculture 2015, 102, 243–250. [Google Scholar] [CrossRef] [Green Version]
  48. Zavarzina, A.G.; Kravchenko, E.G.; Konstantinov, A.I.; Perminova, I.V.; Chukov, S.N.; Demin, V.V. Comparison of the Properties of Humic Acids Extracted from Soils by Alkali in the Presence and Absence of Oxygen. Eurasian Soil Sci. 2019, 52, 880–891. [Google Scholar] [CrossRef]
  49. Jokubauskaitė, I.; Šlepetienė, A.; Karčauskienė, D. Organinė anglis ir kiti svarbūs makroelementai rūgščiame ir kalkintame dirvožemyje. Žemės Ūkio Moksl. 2014, 21, 133–141. [Google Scholar] [CrossRef] [Green Version]
  50. Filcheva, E.; Hristova, M.; Nikolova, P.; Popova, T.; Chakalov, K.; Savov, V. Quantitative and qualitative characterisation of humic products with spectral parameters. J. Soils Sediments 2018, 18, 2863–2867. [Google Scholar] [CrossRef]
  51. King, A.E.; Blesh, J. Crop rotations for increased soil carbon: Perenniality as a guiding principle: Perenniality. Ecol. Appl. 2018, 28, 249–261. [Google Scholar] [CrossRef] [PubMed]
  52. Hadas, A.; Kautsky, L.; Goek, M.; Kara, E.E. Rates of decomposition of plant residues and available nitrogen in soil, related to residue composition through simulation of carbon and nitrogen turnover. Soil Biol. Biochem. 2004, 36, 255–266. [Google Scholar] [CrossRef]
  53. Crème, A.; Rumpel, C.; Le Roux, X.; Romian, A.; Lan, T.; Chabbi, A. Ley grassland under temperate climate had a legacy effect on soil organic matter quantity, biogeochemical signature and microbial activities. Soil Biol. Biochem. 2018, 122, 203–210. [Google Scholar] [CrossRef]
  54. Riva, C.; Orzi, V.; Carozzi, M.; Acutis, M.; Boccasile, G.; Lonati, S.; Tambone, F.; D'Imporzano, G.; Adani, F. Short-term experiments in using digestate products as substitutes for mineral (N) fertilizer: Agronomic performance, odours, and ammonia emission impacts. Sci. Total Environ. 2016, 547, 206–214. [Google Scholar] [CrossRef] [PubMed]
  55. Baştabak, B.; Koçar, G. Biogas digestates in substitution for chemical fertilizers: A comparative study on Lactuca sativa seedling cultivation in Turkey. 2020. Available online: https://d1wqtxts1xzle7.cloudfront.net/63828389/BiogasdigestatesinsubstitutionforchemicalfertilizersAcomparativestudyonLactucasativaseedlingcultivationinTurkey20200704-10875-bgw153-with-cover-page-v2.pdf?Expires=1669364927&Signature=g1fw3lG3oK7Ra39KRnevgrZZojAt3JBg3ylXJhBZ4GgKL~k3YfDA6BEHx877kqpL0T6xAwHcyb3gzorAaHDGMEyIwo7LFcYRem~O0YNNkWWaP79t6TpLF0fMKwXPPGGWcVIM52EhoS42jbkpLVjqS0XUIrRFTKU5mrLAk9dA8a07yC1qreMDNbun9JUOgBqX1N~mAMyD~DVu5IFfvcPp1dtOBfI8KmmN6dFll-appOSS8MhrtD7~RvG3fYaWDtavLwFvMxLL6Gk8sSmpOLBCiZ7mwtSVrQ0QxSqf2LsFKZzmJYqASYSKBpS~uITVw0GJ1q3X~5WYpUInepw1VtLrNQ__&Key-Pair-Id=APKAJLOHF5GGSLRBV4ZA (accessed on 10 November 2022).
  56. Głowacka, A.; Szostak, B.; Klebaniuk, R. Effect of biogas digestate and mineral fertilisation on the soil properties and yield and nutritional value of switchgrass forage. Agronomy 2020, 10, 490. [Google Scholar] [CrossRef] [Green Version]
  57. Sharma, S.; Singh, S.; Singh, M.; Singh, A.; Ali, H.M.; Siddiqui, M.H.; Bhattarai, D. Changes in wheat rhizosphere carbon pools in response to nitrogen and straw incorporation. Agronomy 2022, 12, 2774. [Google Scholar] [CrossRef]
  58. Alburquerque, J.A.; de la Fuente, C.; Campoy, M.; Carrasco, L.; Nájera, I.; Baixauli, C.; Caravaca, F.; Roldán, A.; Cegarra, J.; Bernal, M.P. Agricultural use of digestate for horticultural crop production and improvement of soil properties. Eur. J. Agron. 2012, 43, 119–128. [Google Scholar] [CrossRef]
  59. Makádi, M.; Tomócsik, A.; Orosz, V. Digestate: A New Nutrient Source—Review. In Biogas; Kumar, B.S., Ed.; InTech: Rijeca, Croatia, 2012; pp. 295–310. Available online: http://www.intechopen.com/books/biogas/digestate-a-new-nutrient-source-review (accessed on 10 November 2022).
  60. Cavalli, D.; Corti, M.; Baronchelli, D.; Bechini, L.; Marino Gallina, P. CO2 emissions and mineral nitrogen dynamics following application to soil of undigested liquid cattle manure and digestates. Geoderma 2017, 308, 26–35. [Google Scholar] [CrossRef]
  61. Möller, K.; Stinner, W.; Deuker, A.; Leithold, G. Effects of different manuring systems with and without biogas digestion on nitrogen cycle and crop yield in mixed organic dairy farming systems. Nutr. Cycl. Agroecosystems 2008, 82, 209–232. [Google Scholar] [CrossRef]
  62. Barłóg, P.; Hlisnikovský, L.; Kunzová, E. Effect of digestate on soil organic carbon and plant-available nutrient content compared to cattle. Agronomy 2020, 10, 379. [Google Scholar] [CrossRef] [Green Version]
  63. Karimi, B.; Sadet-Bourgeteau, S.; Cannavacciuolo, M.; Chauvin, C.; Flamin, C.; Haumont, A.; Jean-Baptiste, V.; Reibel, A.; Vrignaud, G.; Ranjard, L. Impact of biogas digestates on soil microbiota in agriculture: A review. Environ. Chem. Lett. 2022, 20, 3265–3288. [Google Scholar] [CrossRef]
  64. Liu, F.; Wang, D.; Zhang, B.; Huang, J. Concentration and biodegradability of dissolved organic carbon derived from soils: A global perspective. Sci. Total Environ. 2021, 754, 142378. [Google Scholar] [CrossRef]
  65. Manninen, N.; Soinne, H.; Lemola, R.; Hoikkala, L.; Turtola, E. Effects of agricultural land use on dissolved organic carbon and nitrogen in surface runoff and subsurface drainage. Sci. Total Environ. 2018, 618, 1519–1528. [Google Scholar] [CrossRef] [PubMed] [Green Version]
  66. Hussain, M.Z.; Robertson, G.P.; Basso, B.; Hamilton, S.K. Leaching losses of dissolved organic carbon and nitrogen from agricultural soils in the upper US Midwest. Sci. Total Environ. 2020, 734, 139379. [Google Scholar] [CrossRef]
  67. Monard, C.; Jeanneau, L.; Le Garrec, J.L.; Le Bris, N.; Binet, F. Short-term effect of pig slurry and its digestate application on biochemical properties of soils and emissions of volatile organic compounds. Appl. Soil Ecol. 2020, 147, 103376. [Google Scholar] [CrossRef]
  68. Mickan, B.S.; Abbott, L.K.; Solaiman, Z.M.; Mathes, F.; Siddique, K.H.M.; Jenkins, S.N. Soil disturbance and water stress interact to influence arbuscular mycorrhizal fungi, rhizosphere bacteria and potential for N and C cycling in an agricultural soil. Biol. Fertil. Soils 2019, 55, 53–66. [Google Scholar] [CrossRef]
Figure 1. Meteorological conditions: monthly mean precipitation and temperature at the experimental site of the Joniskelis Experimental Station, LAMMC (SCN: standard climate norm, 1991–2020).
Agriculture 12 02016 g001
Figure 2. Variation in soil water-extractable organic carbon (WEOC) (0–30 cm) during winter wheat growing season as influenced by different nitrogen rates (A), fertilizers (B), and their interactions (C). The standard error (SE) of the mean is used to represent error bars. Means with different letters within individual interactions are significantly different at the p < 0.05 level (N0 and AV2020 values are not included in the calculations; the letters are only implied). Abbreviations. Soil collection time: AV, at the beginning of winter wheat vegetation; IG, during intensive winter wheat growing (~1.5 months after AV and fertilization); AH, after winter wheat harvest. Nitrogen (N) rates: N0, unfertilized; N60, 60 kg N·ha−1 rate; N120, 120 kg N·ha−1 rate; N120+50, 120 + 50 kg N·ha−1 rate. Fertilizers: N0, unfertilized; AN, ammonium nitrate; PS, pig slurry; LD, liquid anaerobic digestate.
Agriculture 12 02016 g002
Figure 3. Variation in soil mobile humic substances (MHSs) (0–30 cm) during winter wheat growing season as influenced by different nitrogen rates (A), fertilizers (B), and their interactions (C). The standard error (SE) of the mean is used to represent error bars. Means with different letters within individual interactions are significantly different at the p < 0.05 level (N0 and AV2020 values were not included in the calculations; the letters are only implied). Abbreviations. Soil collection time: AV, at the beginning of winter wheat vegetation; IG, during intensive winter wheat growing (~1.5 months after AV and fertilization); AH, after winter wheat harvest. Nitrogen (N) rates: N0, unfertilized; N60, 60 kg N·ha−1 rate; N120, 120 kg N·ha−1 rate; N120+50, 120 + 50 kg N·ha−1 rate. Fertilizers: N0, unfertilized; AN, ammonium nitrate; PS, pig slurry; LD, liquid anaerobic digestate.
Agriculture 12 02016 g003aAgriculture 12 02016 g003b
Figure 4. Variation of soil organic carbon (SOC) (0–30 cm) during winter wheat growing season as influenced by different nitrogen rates (A) and fertilizers (B). The standard error (SE) of the mean is used to represent error bars. Means with different letters within individual interactions are significantly different at the p < 0.05 level (N0 and AV2020 values were not included in the calculations; the letters are only implied). Abbreviations. Soil collection time: AV, at the beginning of winter wheat vegetation; IG, during intensive winter wheat growing (~1.5 months after AV and fertilization); AH, after winter wheat harvest. Nitrogen (N) rates: N0, unfertilized; N60, 60 kg N·ha−1 rate; N120, 120 kg N·ha−1 rate; N120+50, 120 + 50 kg N·ha−1 rate. Fertilizers: N0, unfertilized; AN, ammonium nitrate; PS, pig slurry; LD, liquid anaerobic digestate.
Agriculture 12 02016 g004
Figure 5. Variation of soil C:N ratio (0–30 cm) as influenced by winter wheat growing season, different nitrogen rates, and fertilizer interactions. The standard error (SE) of the mean is used to represent error bars. Means with different letters within interaction are significantly different at the p < 0.05 level (N0 and AV2020 values were not included in the calculations; the letters are only implied). Abbreviations. Soil collection time: AV, at the beginning of winter wheat vegetation; IG, during intensive winter wheat growing (~1.5 months after AV and fertilization); AH, after winter wheat harvest. Fertilizers: N0, unfertilized; AN, ammonium nitrate; PS, pig slurry; LD, liquid anaerobic digestate. Nitrogen (N) rates: N60, 60 kg N·ha−1 rate; N120, 120 kg N·ha−1 rate; N120+50, 120 + 50 kg N·ha−1 rate.
Agriculture 12 02016 g005
Figure 6. Principal components analysis (PCA) loading plot for PC1 and PC2 scores. Analysis was conducted using data of soil and grain productivity characteristics for waxy winter wheat grown in 2021 using three types of fertilizers (AN, ammonium nitrate; PS, pig slurry; LD, anaerobic liquid digestate) and different nitrogen rates (0, 60, 120, and 120 + 50 kg N·ha−1). The dataset used was of soil collected three times per year.
Agriculture 12 02016 g006
Table 1. Characteristic of liquid bio-fertilizers.
YearpHDMNtotN-NH4N-NO3CorgMHSsMHAsMHAs:MFAsC:N
g·kg−1
Pig Slurry
20207.6531.62.361.650.0187.413.41.180.533.14
20216.8640.44.742.940.01212.877.661.780.302.72
Mean7.2636.03.552.300.01510.145.531.480.422.93
SE0.404.41.190.650.0032.732.130.300.120.21
Liquid Anaerobic Digestate
20207.7227.52.761.660.01710.444.181.780.743.78
20217.7713.92.381.790.0174.463.121.370.781.87
Mean7.7520.72.571.730.0177.453.651.580.762.83
SE0.026.80.190.070.0002.990.530.200.020.95
Abbreviations. Quality indicators: DM, dry matter; Ntot, total nitrogen; N-NH4, ammonium nitrogen; N-NO3, nitrate nitrogen; Corg, organic carbon; MHSs, mobile humic substances; MHAs, mobile humic acids; C:N, carbon-to-nitrogen ratio; MHAs:MFAs, mobile humic to fulvic acids ratio; SE, standard error.
Table 2. Analysis of variance of fertilizer type, N rate, and soil collection time effects on soil quality characteristics during wheat growth (the table shows the sources of variation and probability for the F-test of each factor and its interactions).
EffectDegrees of FreedomN-NO3N-NH4NtotWEOCMHSsSOCC:N
Fertilizer24.95 **0.900.6810.75 **8.24 **8.59 **6.25 **
N rate218.00 **0.801.650.791.572.4710.17 **
Time4211.3 **873.0 **58.47 **14.49 **11.97 **56.96 **89.94 **
Fertilizer × N rate40.230.896.55 **4.33 **5.54 **6.63 **2.53 *
Fertilizer × time85.14 **3.18 **2.04 *4.21 **2.74 **2.89 **2.37 *
N rate × time86.29 **1.052.24 *3.57 **2.08 *1.292.61 *
Fertilizer × N rate × time161.250.451.681.510.951.003.85 **
Abbreviations. Soil quality indicators: N-NO3, nitrate nitrogen; N-NH4, ammonium nitrogen; Ntot, total nitrogen; WEOC, water-extractable organic carbon; MHSs, mobile humic substances; SOC, soil organic carbon; C:N, carbon-to-nitrogen ratio; * and ** significant at p < 0.05 and 0.01, respectively.
Table 3. Soil nitrate nitrogen (N-NO3) variation during winter wheat growing season in mg·kg−1 (0–60 cm).
Treatment20202021
AVIGAHAVIGAH
N rate × time
N02.67 ± 0.195.52 ± 0.6110.27 ± 0.393.56 ± 0.343.79 ± 0.592.25 ± 0.23
N606.88 ± 0.59 cd9.52 ± 0.27 b3.67 ± 0.13 efg4.82 ± 0.30 defg3.06 ± 0.25 g
N1207.06 ± 0.68 c12.35 ± 0.32 a3.63 ± 0.35 efg5.36 ± 0.38 cdef3.41 ± 0.47 fg
N120 + 507.06 ± 0.62 c12.21 ± 0.49 a3.77 ± 0.17 efg5.60 ± 0.35 cde6.29 ± 0.57 cd
Fertilizer × time
N02.67 ± 0.195.52 ± 0.6110.27 ± 0.393.56 ± 0.343.79 ± 0.592.25 ± 0.23
AN6.11 ± 0.56 c10.88 ± 0.58 ab3.43 ± 0.18 d6.15 ± 0.26 c4.36 ± 0.56 cd
PS6.07 ± 0.21 c11.34 ± 0.66 a4.00 ± 0.30 cd4.68 ± 0.28 cd4.04 ± 0.52 cd
LD8.82 ± 0.55 b11.86 ± 0.46 a3.64 ± 0.18 d4.95 ± 0.30 cd4.36 ± 0.90 cd
Abbreviations. Soil collection time: AV, at the beginning of winter wheat vegetation; IG, during intensive winter wheat growing (~1.5 months after AV and fertilization); AH, after winter wheat harvest. Nitrogen (N) rates: N0, unfertilized; N60, 60 kg N·ha−1 rate; N120, 120 kg N·ha−1 rate; N120+50, 120 + 50 kg N·ha−1 rate. Fertilizers: N0, unfertilized; AN, ammonium nitrate; PS, pig slurry; LD, liquid anaerobic digestate. The standard error (SE) of the mean is used to represent error values. Means with different letters within individual interactions are significantly different at the p < 0.05 level (N0 and AV2020 values were not included in the calculations; the letters are only implied).
Table 4. Soil ammonium nitrogen (N-NH4) variation during winter wheat growing season in mg·kg−1 (0–60 cm).
Treatment20202021
AVIGAHAVIGAH
Fertilizer × time
N02.43 ± 0.233.94 ± 0.033.00 ± 0.120.55 ± 0.060.89 ± 0.040.14 ± 0.05
AN4.25 ± 0.12 b3.27 ± 0.12 c0.83 ± 0.07 e1.50 ± 0.12 d0.17 ± 0.04 f
PS4.87 ± 0.22 a3.21 ± 0.06 c0.84 ± 0.07 e1.19 ± 0.06 de0.13 ± 0.02 f
LD4.79 ± 0.10 a3.34 ± 0.10 c1.02 ± 0.17 de1.20 ± 0.07 de0.13 ± 0.05 f
Abbreviations. Soil collection time: AV, at the beginning of winter wheat vegetation; IG, during intensive winter wheat growing (~1.5 months after AV and fertilization); AH, after winter wheat harvest. Fertilizers: N0, unfertilized; AN, ammonium nitrate; PS, pig slurry; LD, liquid anaerobic digestate. The standard error (SE) of the mean is used to represent error values. Means with different letters are significantly different at the p < 0.05 level (N0 and AV2020 values were not included in the calculations; the letters are only implied).
Table 5. Soil total nitrogen (Ntot) variation during winter wheat growing season in g·kg−1 (0–30 cm).
Treatment20202021
AVIGAHAVIGAH
N rate × time
N01.13 ± 0.021.17 ± 0.031.18 ± 0.051.28 ± 0.031.11 ± 0.021.27 ± 0.01
N601.23 ± 0.03 abc1.18 ± 0.02 bc1.31 ± 0.03 ab1.13 ± 0.03 c1.34 ± 0.02 a
N1201.34 ± 0.03 a1.10 ± 0.02 c1.37 ± 0.03 a1.12 ± 0.02 c1.37 ± 0.04 a
N120 + 501.34 ± 0.03 a1.14 ± 0.02 c1.36 ± 0.03 a1.14 ± 0.02 c1.35 ± 0.03 a
Fertilizer × time
N01.13 ± 0.021.17 ± 0.031.18 ± 0.051.28 ± 0.031.11 ± 0.021.27 ± 0.01
AN1.25 ± 0.06 ab1.16 ± 0.03 bc1.34 ± 0.03 a1.15 ± 0.03 bc1.37 ± 0.03 a
PS1.30 ± 0.01 a1.14 ± 0.02 bc1.35 ± 0.03 a1.15 ± 0.02 bc1.38 ± 0.04 a
LD1.36 ± 0.01 a1.12 ± 0.03 bc1.35 ± 0.03 a1.10 ± 0.03 c1.31 ± 0.02 a
Fertilizer × N rate
N60N120N120 + 50
AN1.24 ± 0.03 ab1.31 ± 0.04 a1.21 ± 0.03 b
PS1.26 ± 0.03 ab1.23 ± 0.03 ab1.31 ± 0.04 a
LD1.22 ± 0.03 ab1.26 ± 0.04 ab1.27 ± 0.04 ab
Abbreviations. Soil collection time: AV, at the beginning of winter wheat vegetation; IG, during intensive winter wheat growing (~1.5 months after AV and fertilization); AH, after winter wheat harvest. Nitrogen (N) rates: N0, unfertilized; N60, 60 kg N·ha−1 rate; N120, 120 kg N·ha−1 rate; N120+50, 120 + 50 kg N·ha−1 rate. Fertilizers: N0, unfertilized; AN, ammonium nitrate; PS, pig slurry; LD, liquid anaerobic digestate. The standard error (SE) of the mean is used to represent error values. Means with different letters within individual interactions are significantly different at the p < 0.05 level (N0 and AV2020 values were not included in the calculations; the letters are only implied).
Table 6. Harvest components and grain yield of waxy winter wheat.
Treatment20202021
Grain Number per Unit Area (m−2)1000-Grain Weight (g)Grain Yield (kg·ha−1)Grain Number per Unit Area (m−2)1000-Grain Weight (g)Grain Yield (kg·ha−1)
N014,972 b34.21 c3943 b8582 b29.51 a1754 b
AN6018,555 ab35.53 abc5131 ab11,411 ab29.74 a2345 ab
PS6021,105 a35.47 abc5649 a9803 ab30.01 a2397 ab
LD6017,370 ab36.32 ab5598 a9164 ab29.98 a2004 ab
AN12015,953 aba34.78 bc4649 ab13,920 a29.79 a2774 a
PS12019,505 ab35.02 abc5684 a11,601 ab30.86 a2556 ab
LD12018,059 aba35.61 abc5440 a10,037 ab29.73 a2486 ab
AN120 + 5018,563 ab35.39 abc5262 ab12,492 ab31.24 a2727 a
PS120 + 5019,636 ab35.76 abc5946 a10,535 ab30.26 a2527 ab
LD120 + 5018,371 ab36.48 a5538 a12,388 ab30.42 a2549 ab
Mean18,20935.46528410,99330.152412
Abbreviations. Fertilizers: N0, unfertilized; AN, ammonium nitrate; PS, pig slurry; LD, liquid anaerobic digestate. Means with different letters are significantly different at the p < 0.05 level.
Table 7. Effect of different soil collection times on PCA-based correlations between soil quality and waxy winter wheat grain yield indicators during 2020 and 2021 seasons. For calculation, datasets with three fertilizers (ammonium nitrate, pig slurry, and anaerobic liquid digestate) and four nitrogen rates (0, 60, 120, and 120 + 50 kg N·ha−1) were used.
Year20202021
Principal ComponentPC1PC2PC1PC2
Variability (%)23.817.930.614.1
WEOC_AV −0.488−0.549
MFAs_AV −0.567−0.403
MHAs_AV −0.453−0.157
MHSs_AV −0.716−0.423
SOC_AV −0.8310.066
Ntot_AV −0.600−0.336
C:N_AV −0.2680.478
N-NO3_AV −0.554−0.223
N-NH4_AV −0.110−0.067
WEOC_IG−0.6970.263−0.4480.589
MFAs_IG−0.6120.212−0.6240.129
MHAs_IG−0.6360.405−0.6670.497
MHSs_IG−0.8360.405−0.7940.393
SOC_IG−0.8070.132−0.7970.361
Ntot_IG−0.2640.253−0.807−0.108
C:N_IG−0.418−0.1170.0330.702
N-NO3_IG0.0310.256−0.324−0.298
N-NH4_IG−0.5410.026−0.461−0.035
WEOC_AH−0.1860.060−0.6420.281
MFAs_AH−0.108−0.632−0.504−0.079
MHAs_AH−0.577−0.553−0.7760.037
MHSs_AH−0.487−0.748−0.784−0.023
SOC_AH−0.320−0.837−0.6000.624
Ntot_AH0.070−0.860−0.623−0.287
C:N_AH−0.633−0.031−0.1210.757
N-NO3_AH−0.4930.360−0.317−0.518
N-NH4_AH−0.211−0.460−0.373−0.093
Grain number per unit area −0.487−0.302−0.300−0.247
1000-grain weight−0.0170.129−0.390−0.261
Grain yield−0.444−0.020−0.274−0.355
Abbreviations. Soil collection time: AV, at the beginning of winter wheat vegetation; IG, during intensive winter wheat growing (~1.5 months after AV and fertilization); AH, after winter wheat harvest. Soil quality indicators: WEOC, water-extractable organic carbon; MFAs, mobile fulvic acids, MHAs, mobile humic acids; MHSs, mobile humic substances; SOC, soil organic carbon; Ntot, total nitrogen; C:N, carbon-to-nitrogen ratio; N-NO3, nitrate nitrogen; N-NH4, ammonium nitrogen.
Publisher’s Note: MDPI stays neutral with regard to jurisdictional claims in published maps and institutional affiliations.

