
Hydrogeochemical Studies to Assess the Suitability of Groundwater for Drinking and Irrigation Purposes: The Upper East Region of Ghana Case Study

Abstract
:1. Introduction
2. Materials and Methods
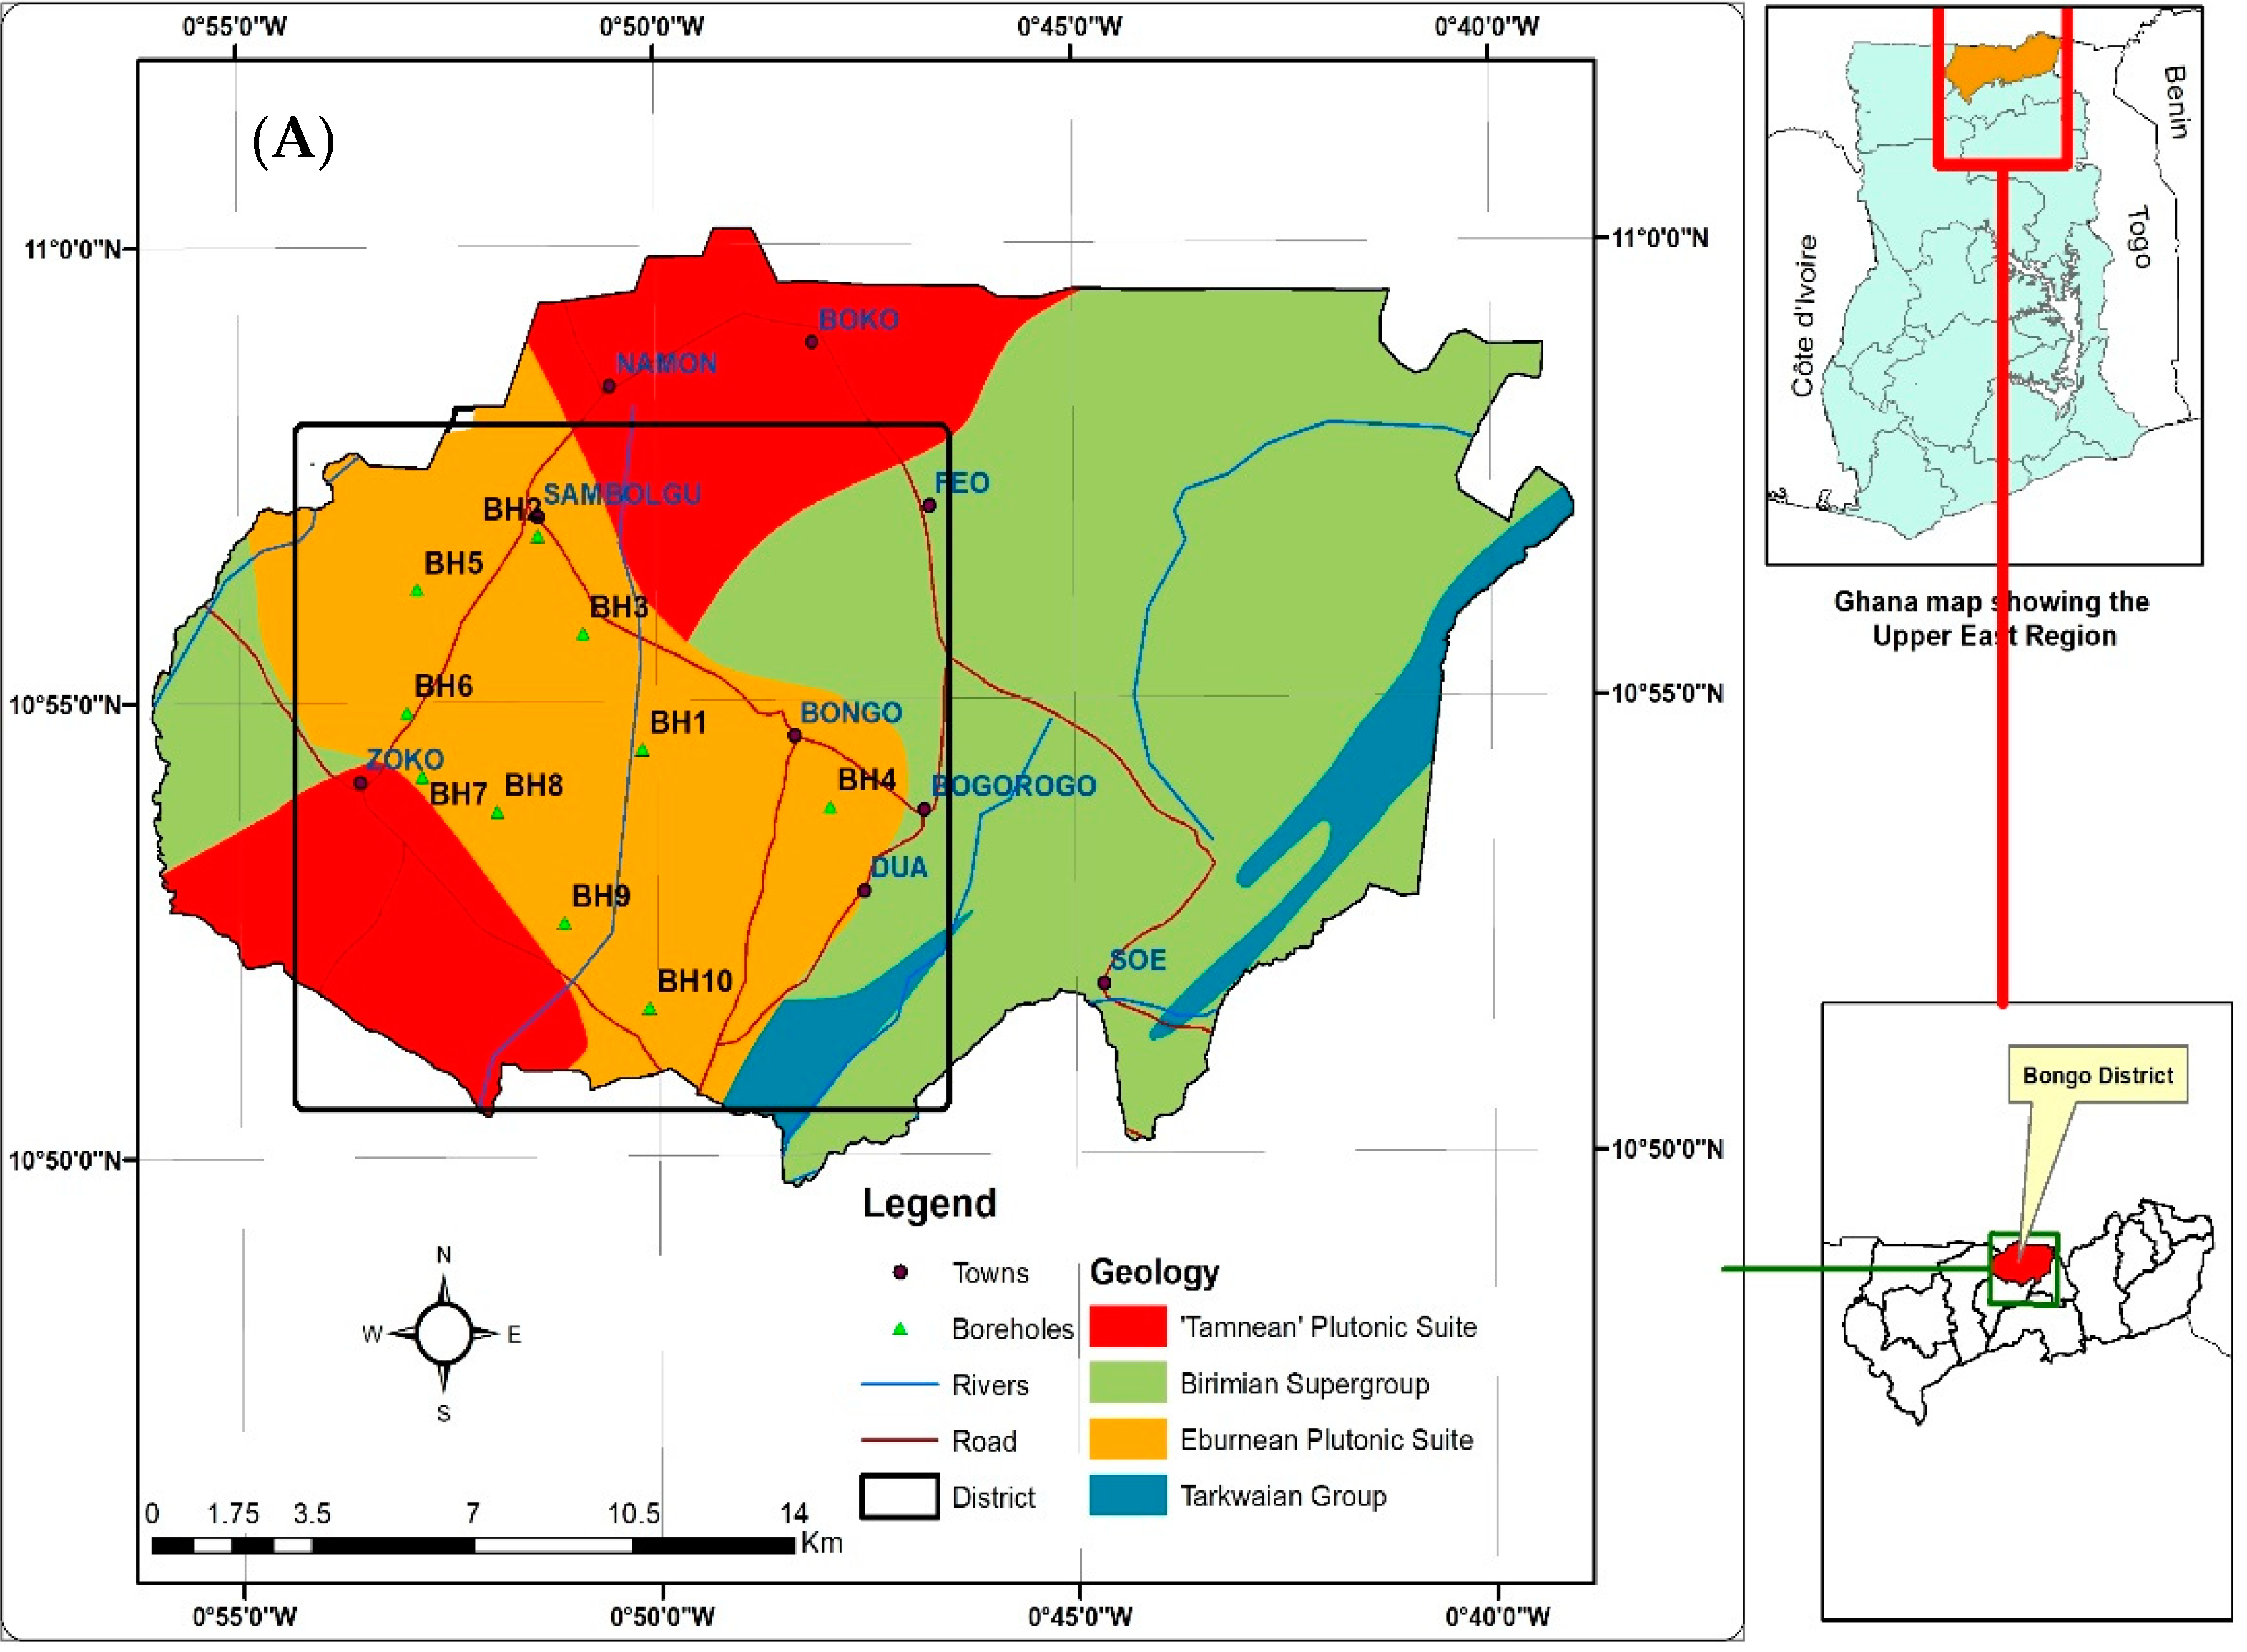
2.1. Study Area
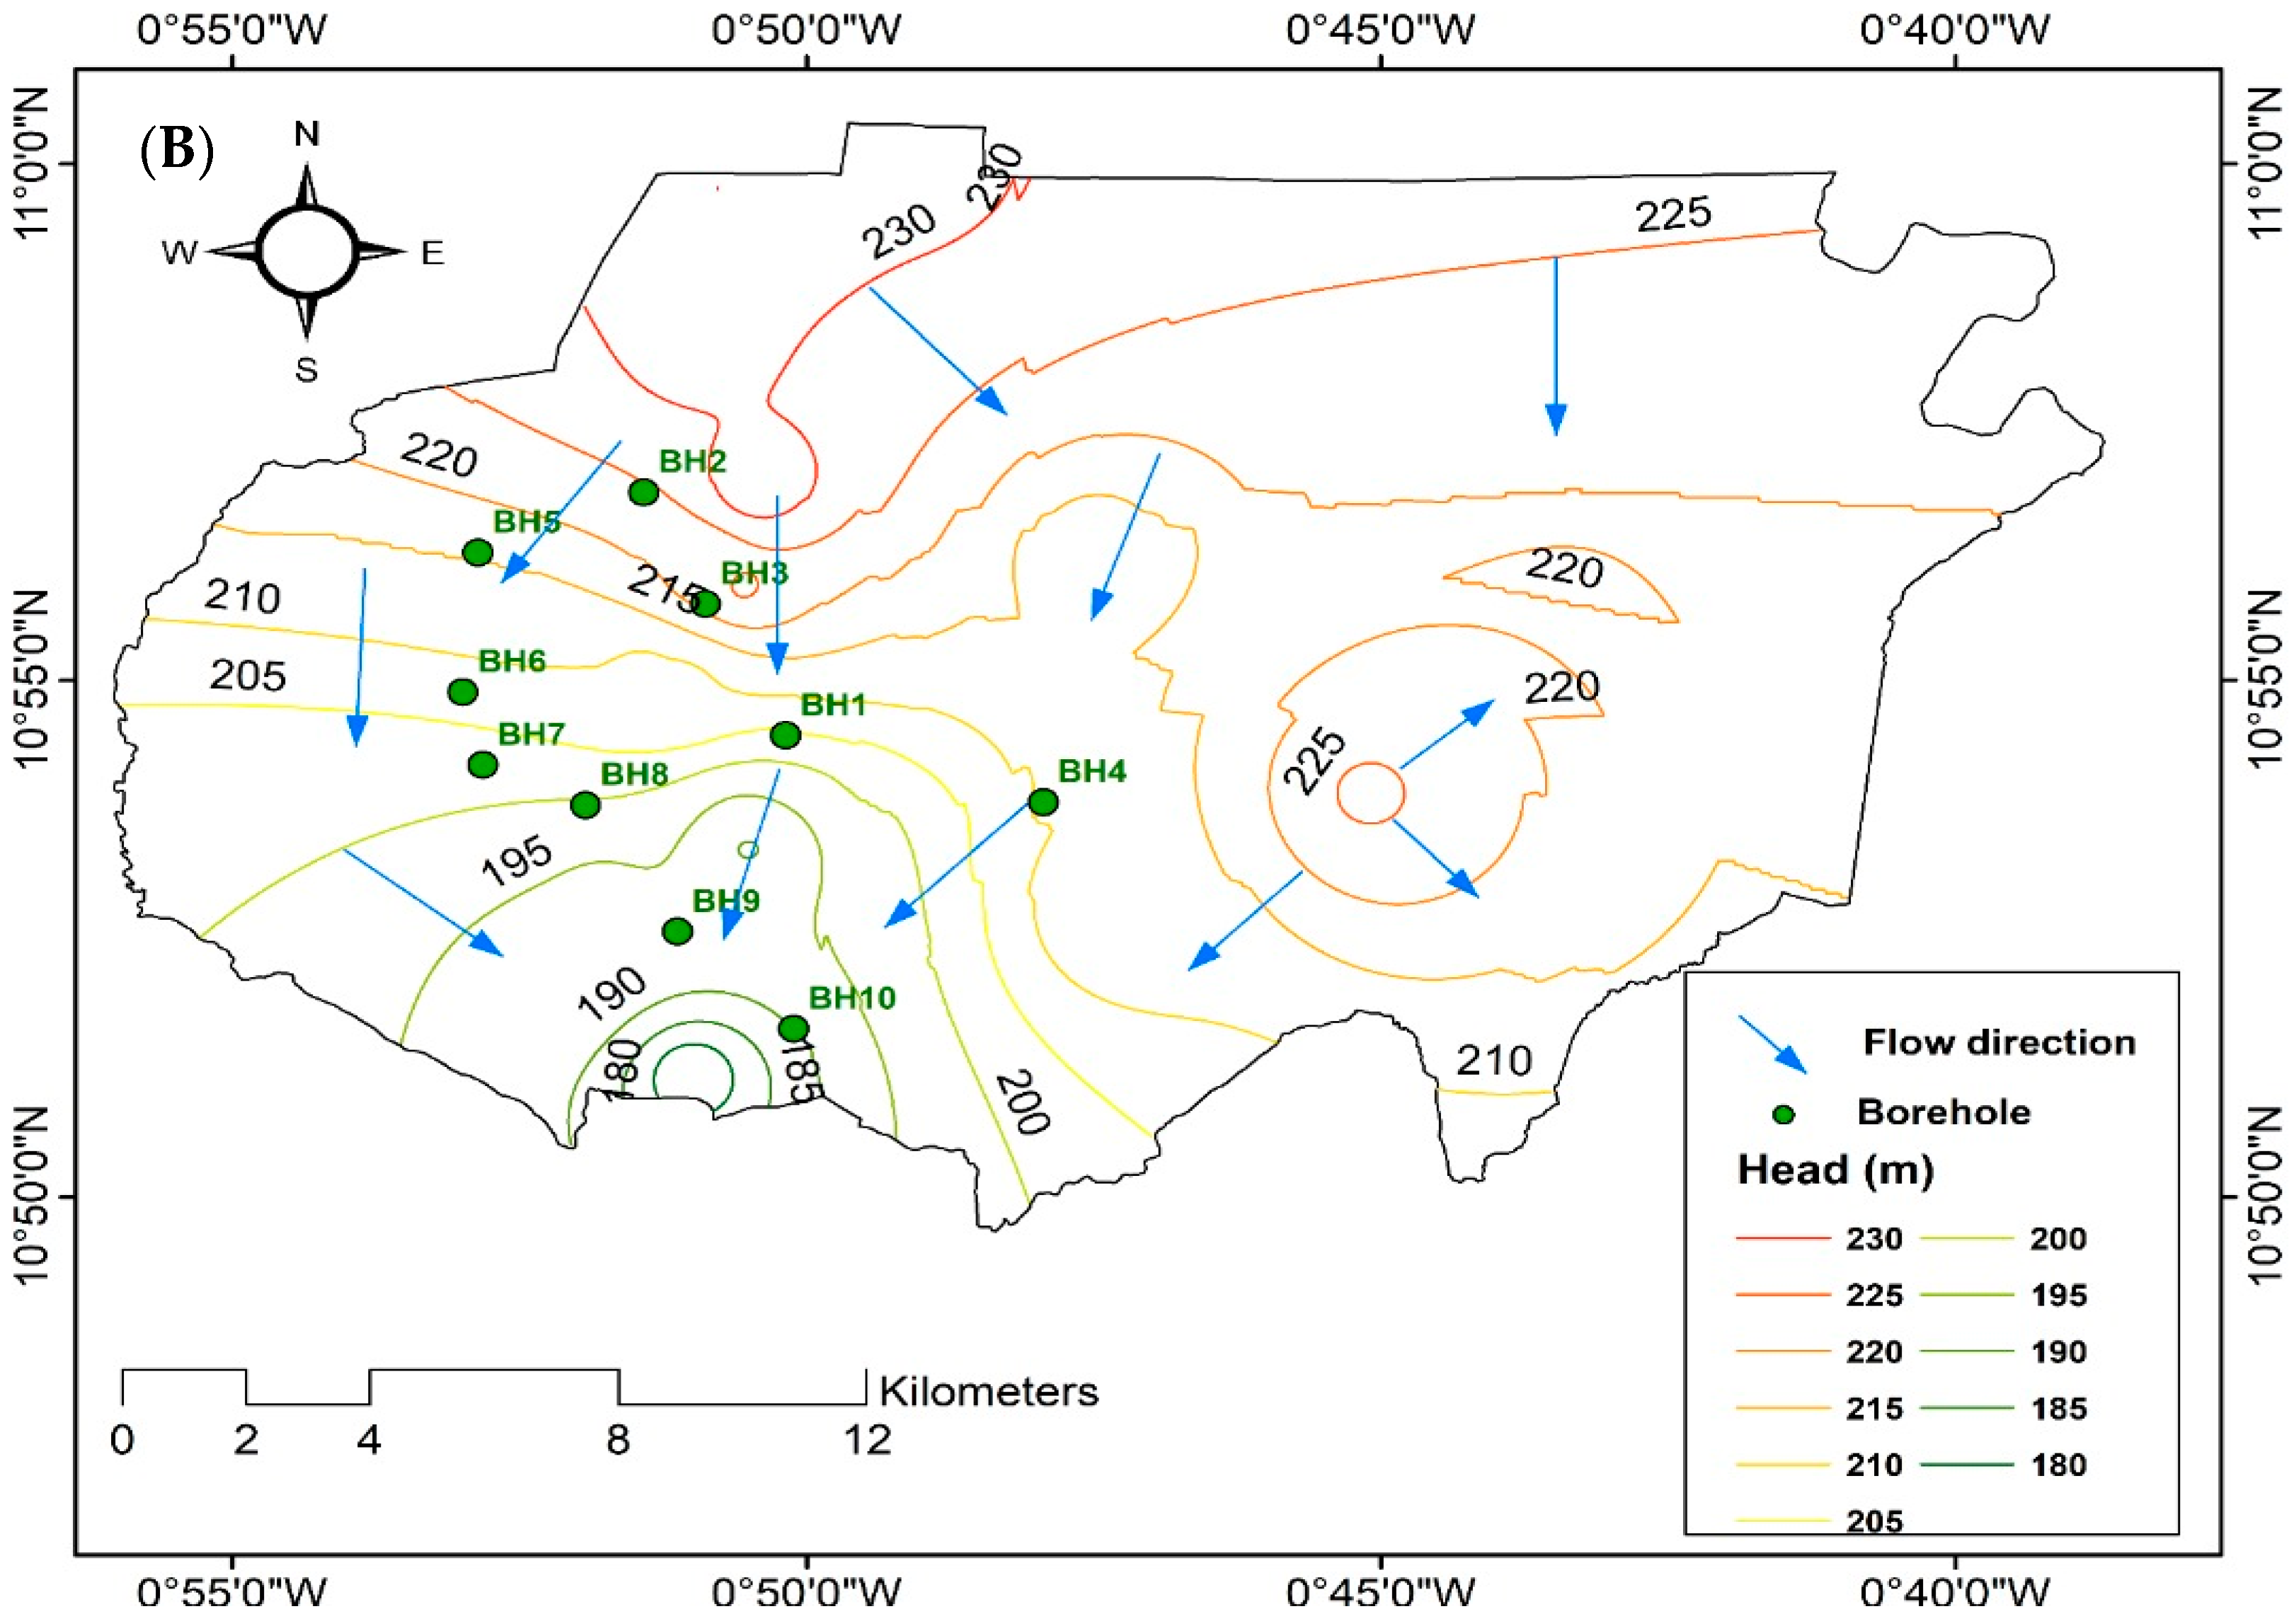
2.1.1. Location
2.1.2. Geology and Hydrogeology
2.2. Sampling and Analytical Procedures
2.3. Drinking Water Quality Assessment
2.4. Irrigation Water Quality Assessment
2.5. Identification of the Hydrogeochemical Processes
2.6. Multivariate Statistical Analyses
2.7. Health Risk Assessment
3. Results and Discussion
3.1. Physicochemical Characteristics of Groundwater
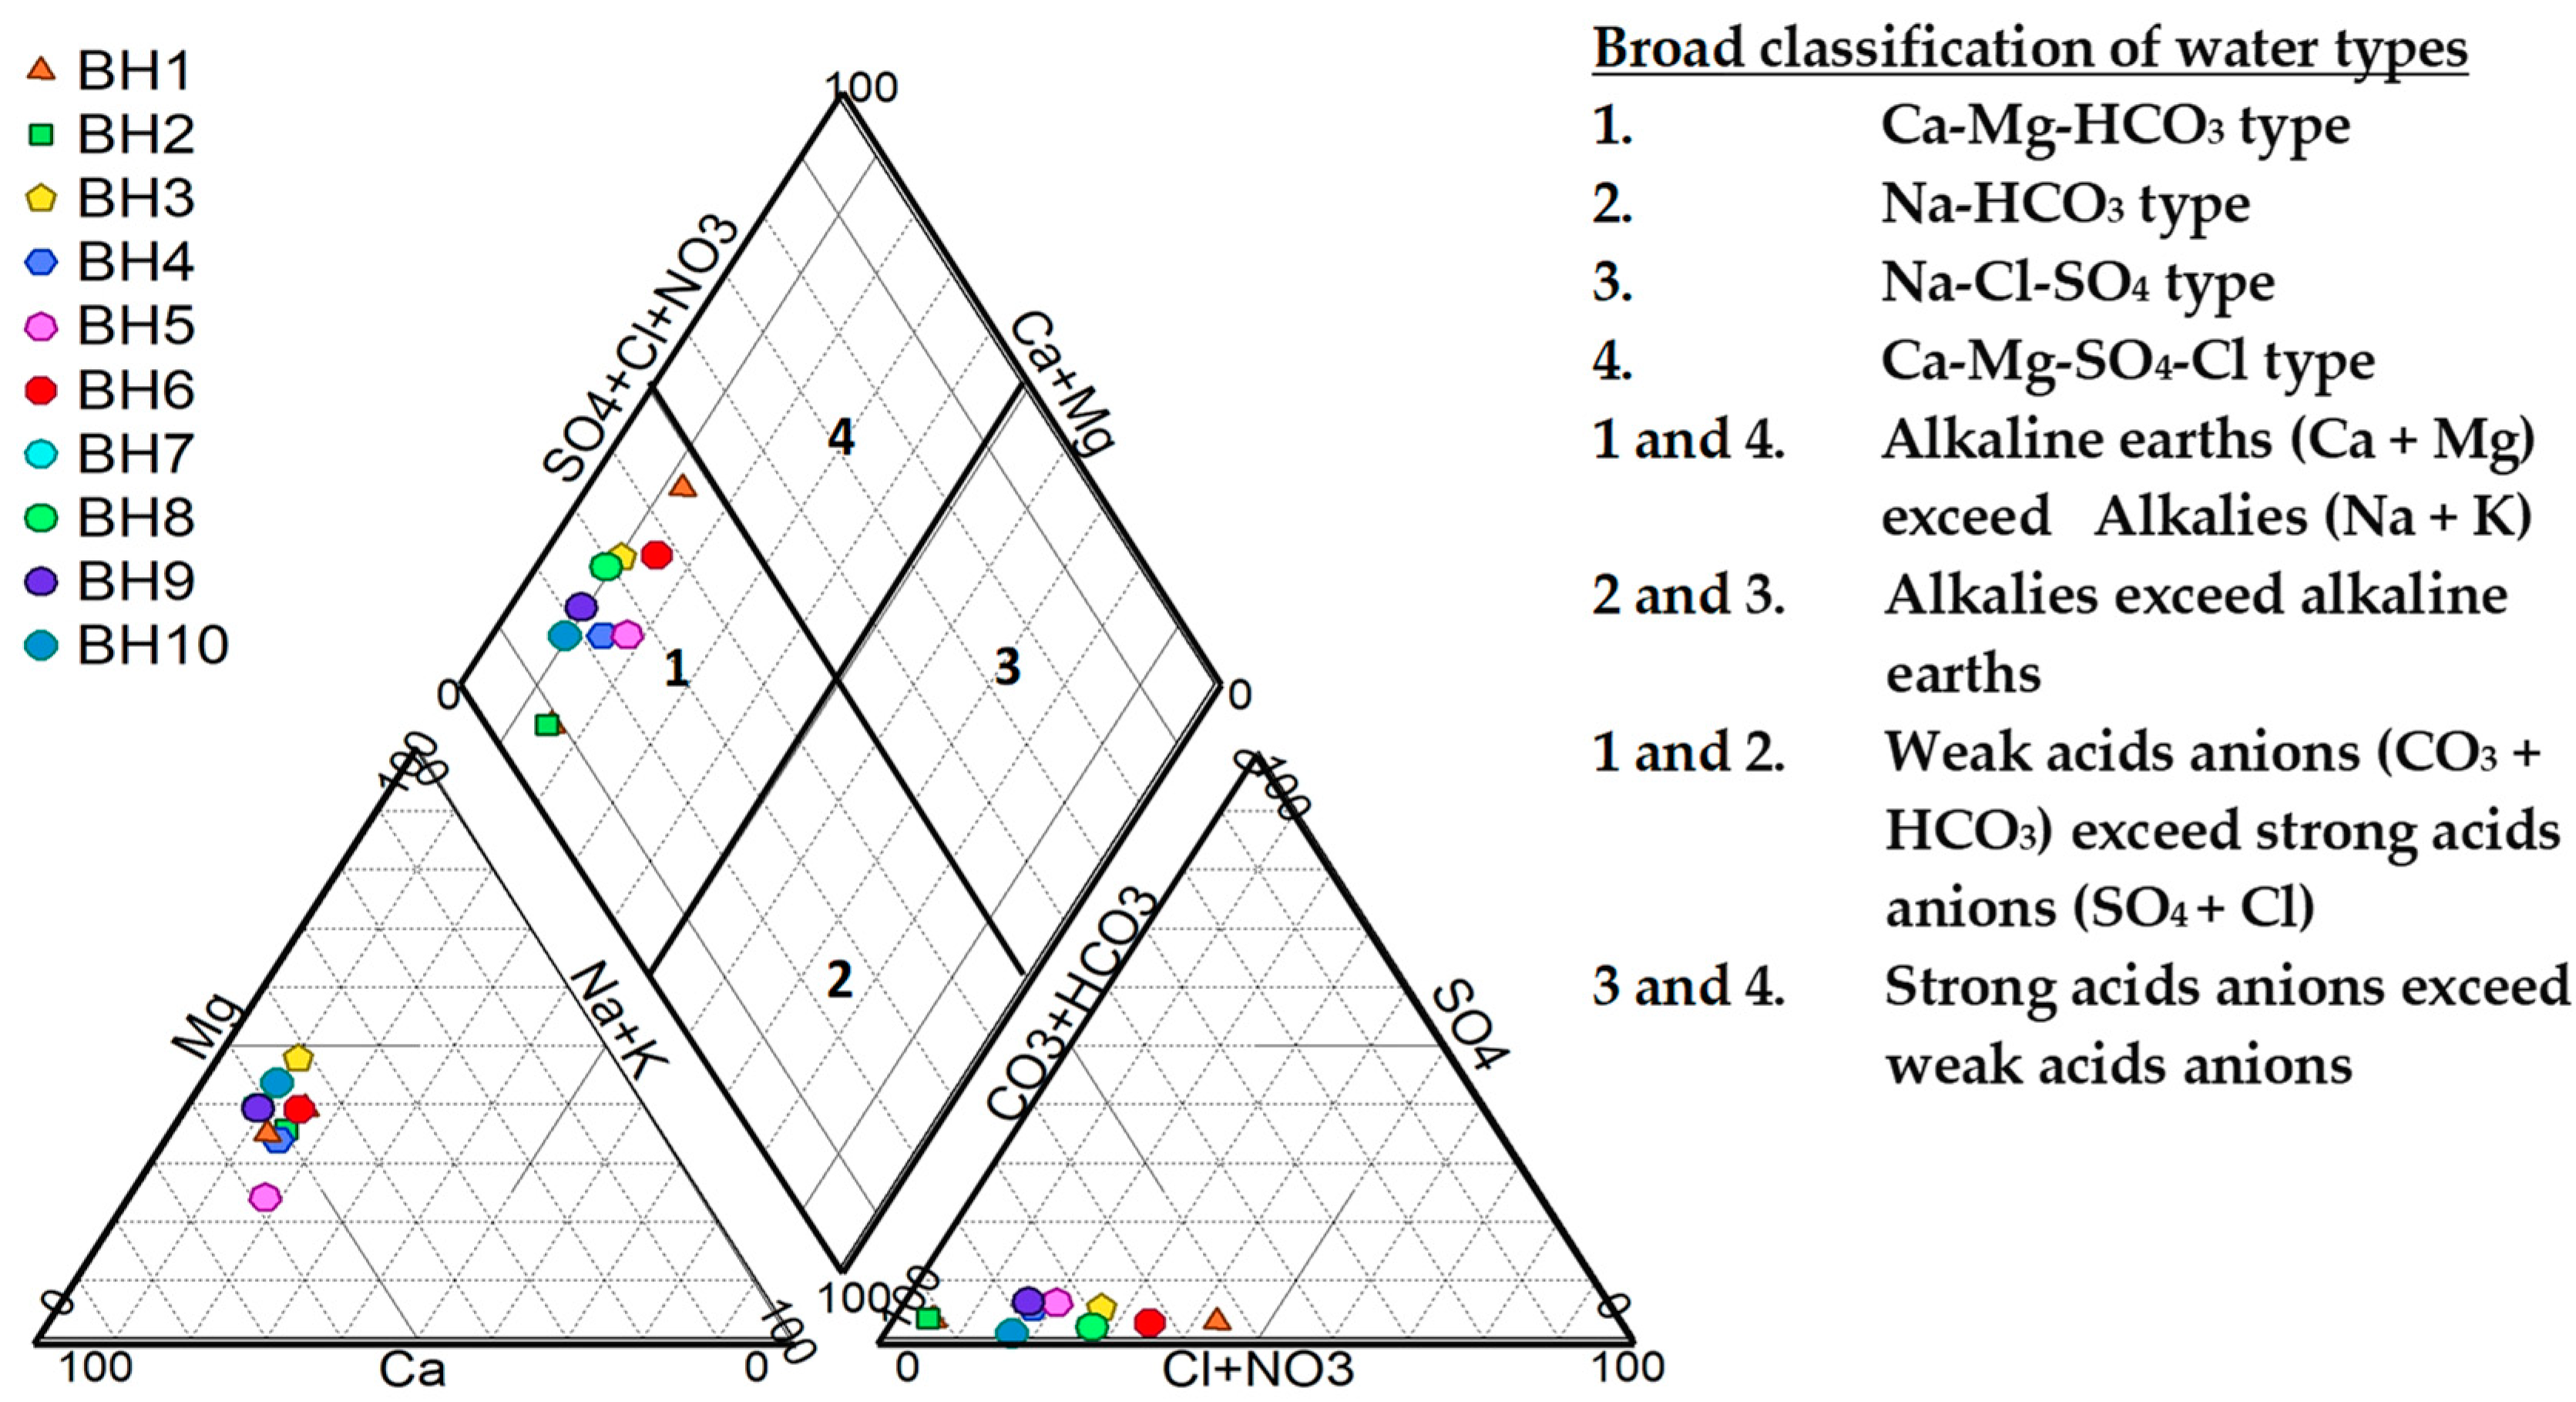
3.2. Hydrochemical Facies of Groundwater
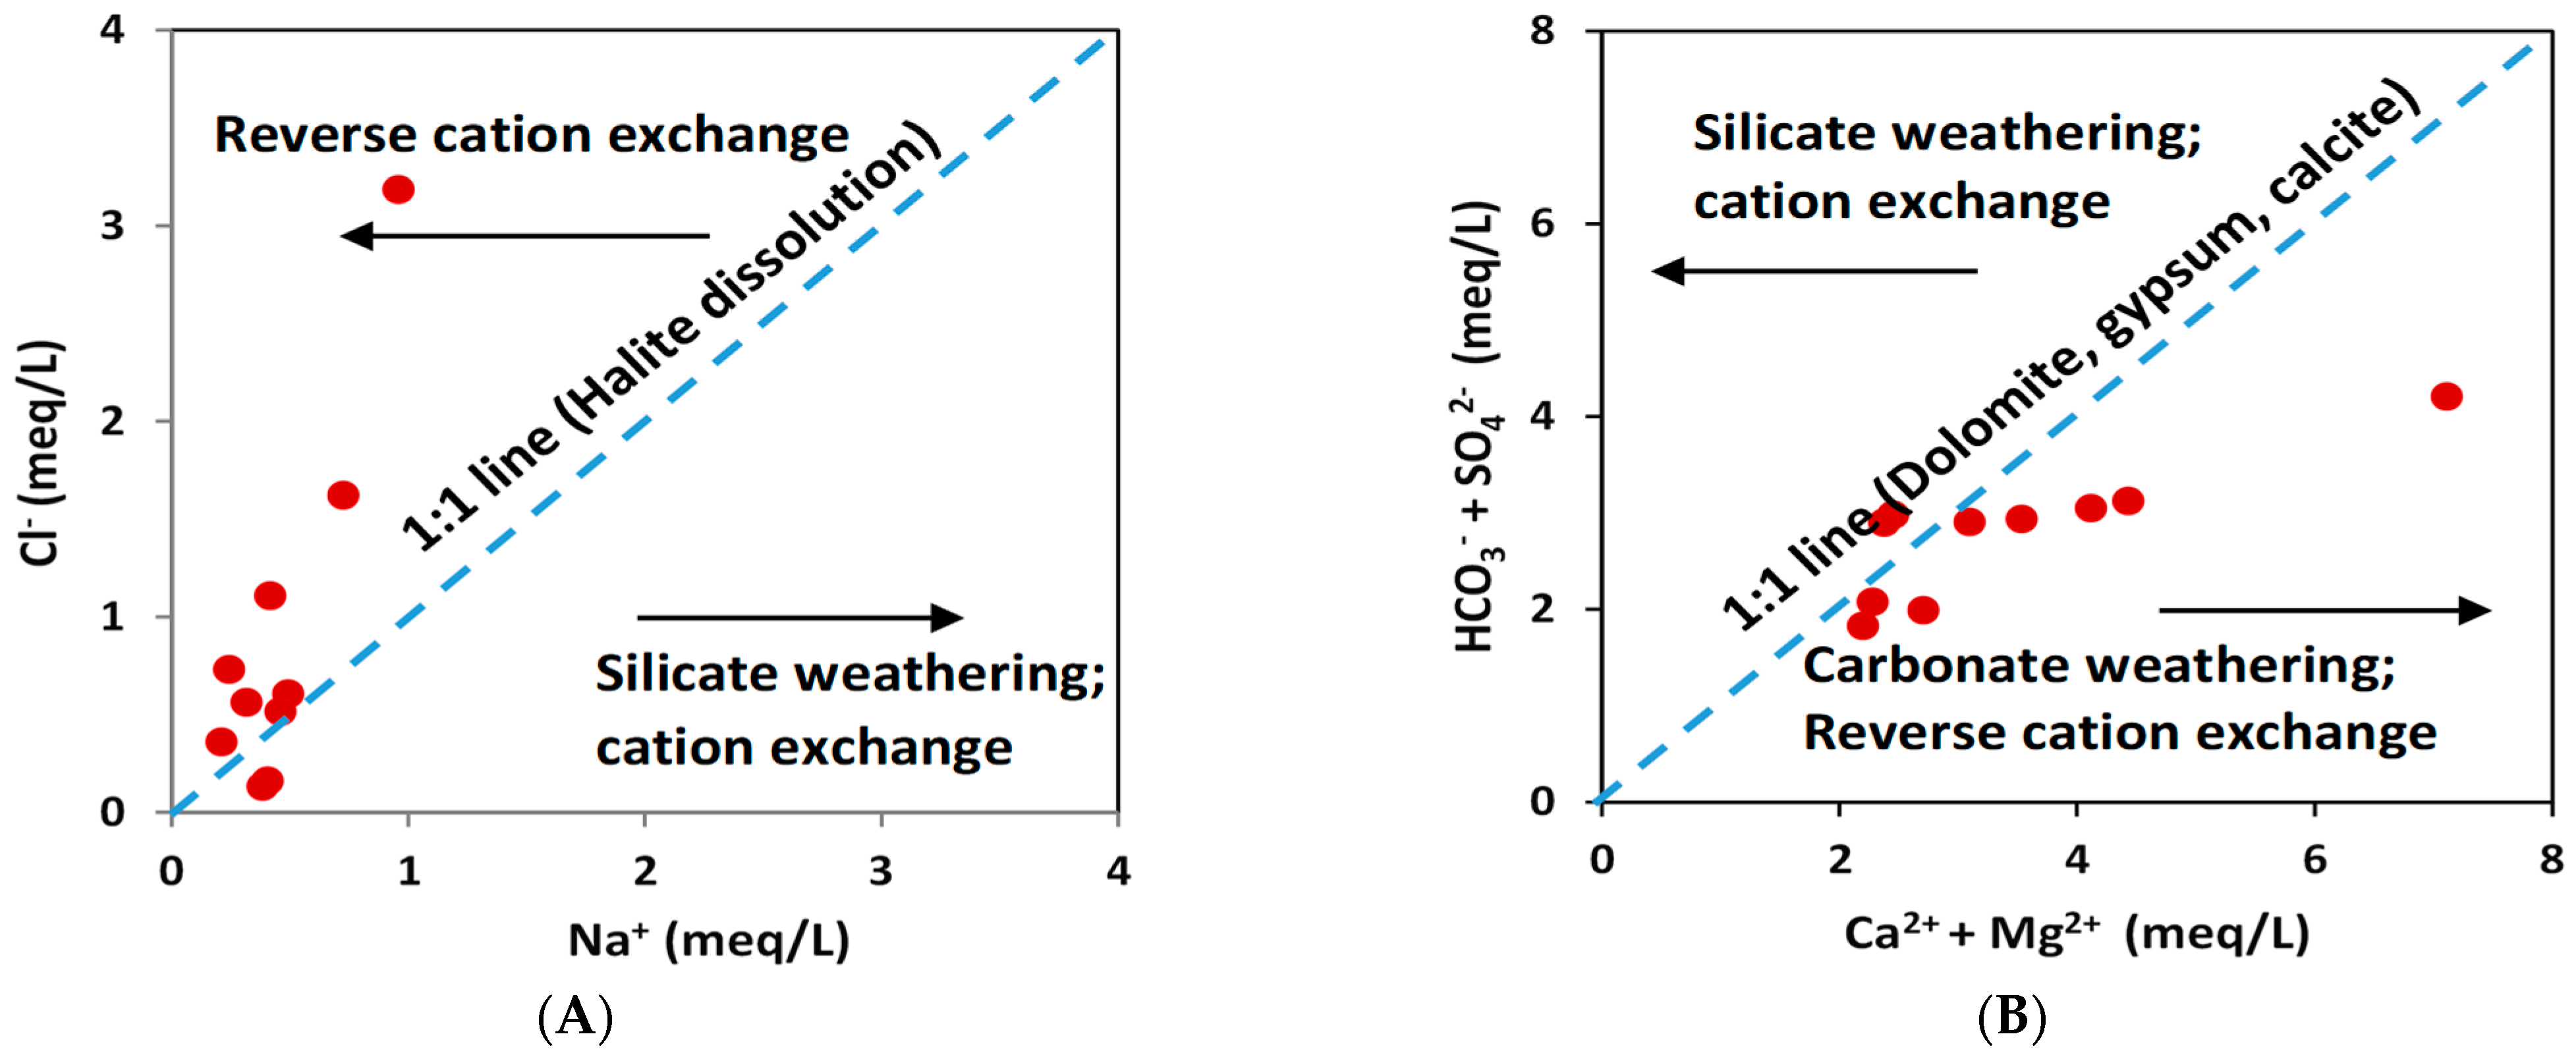
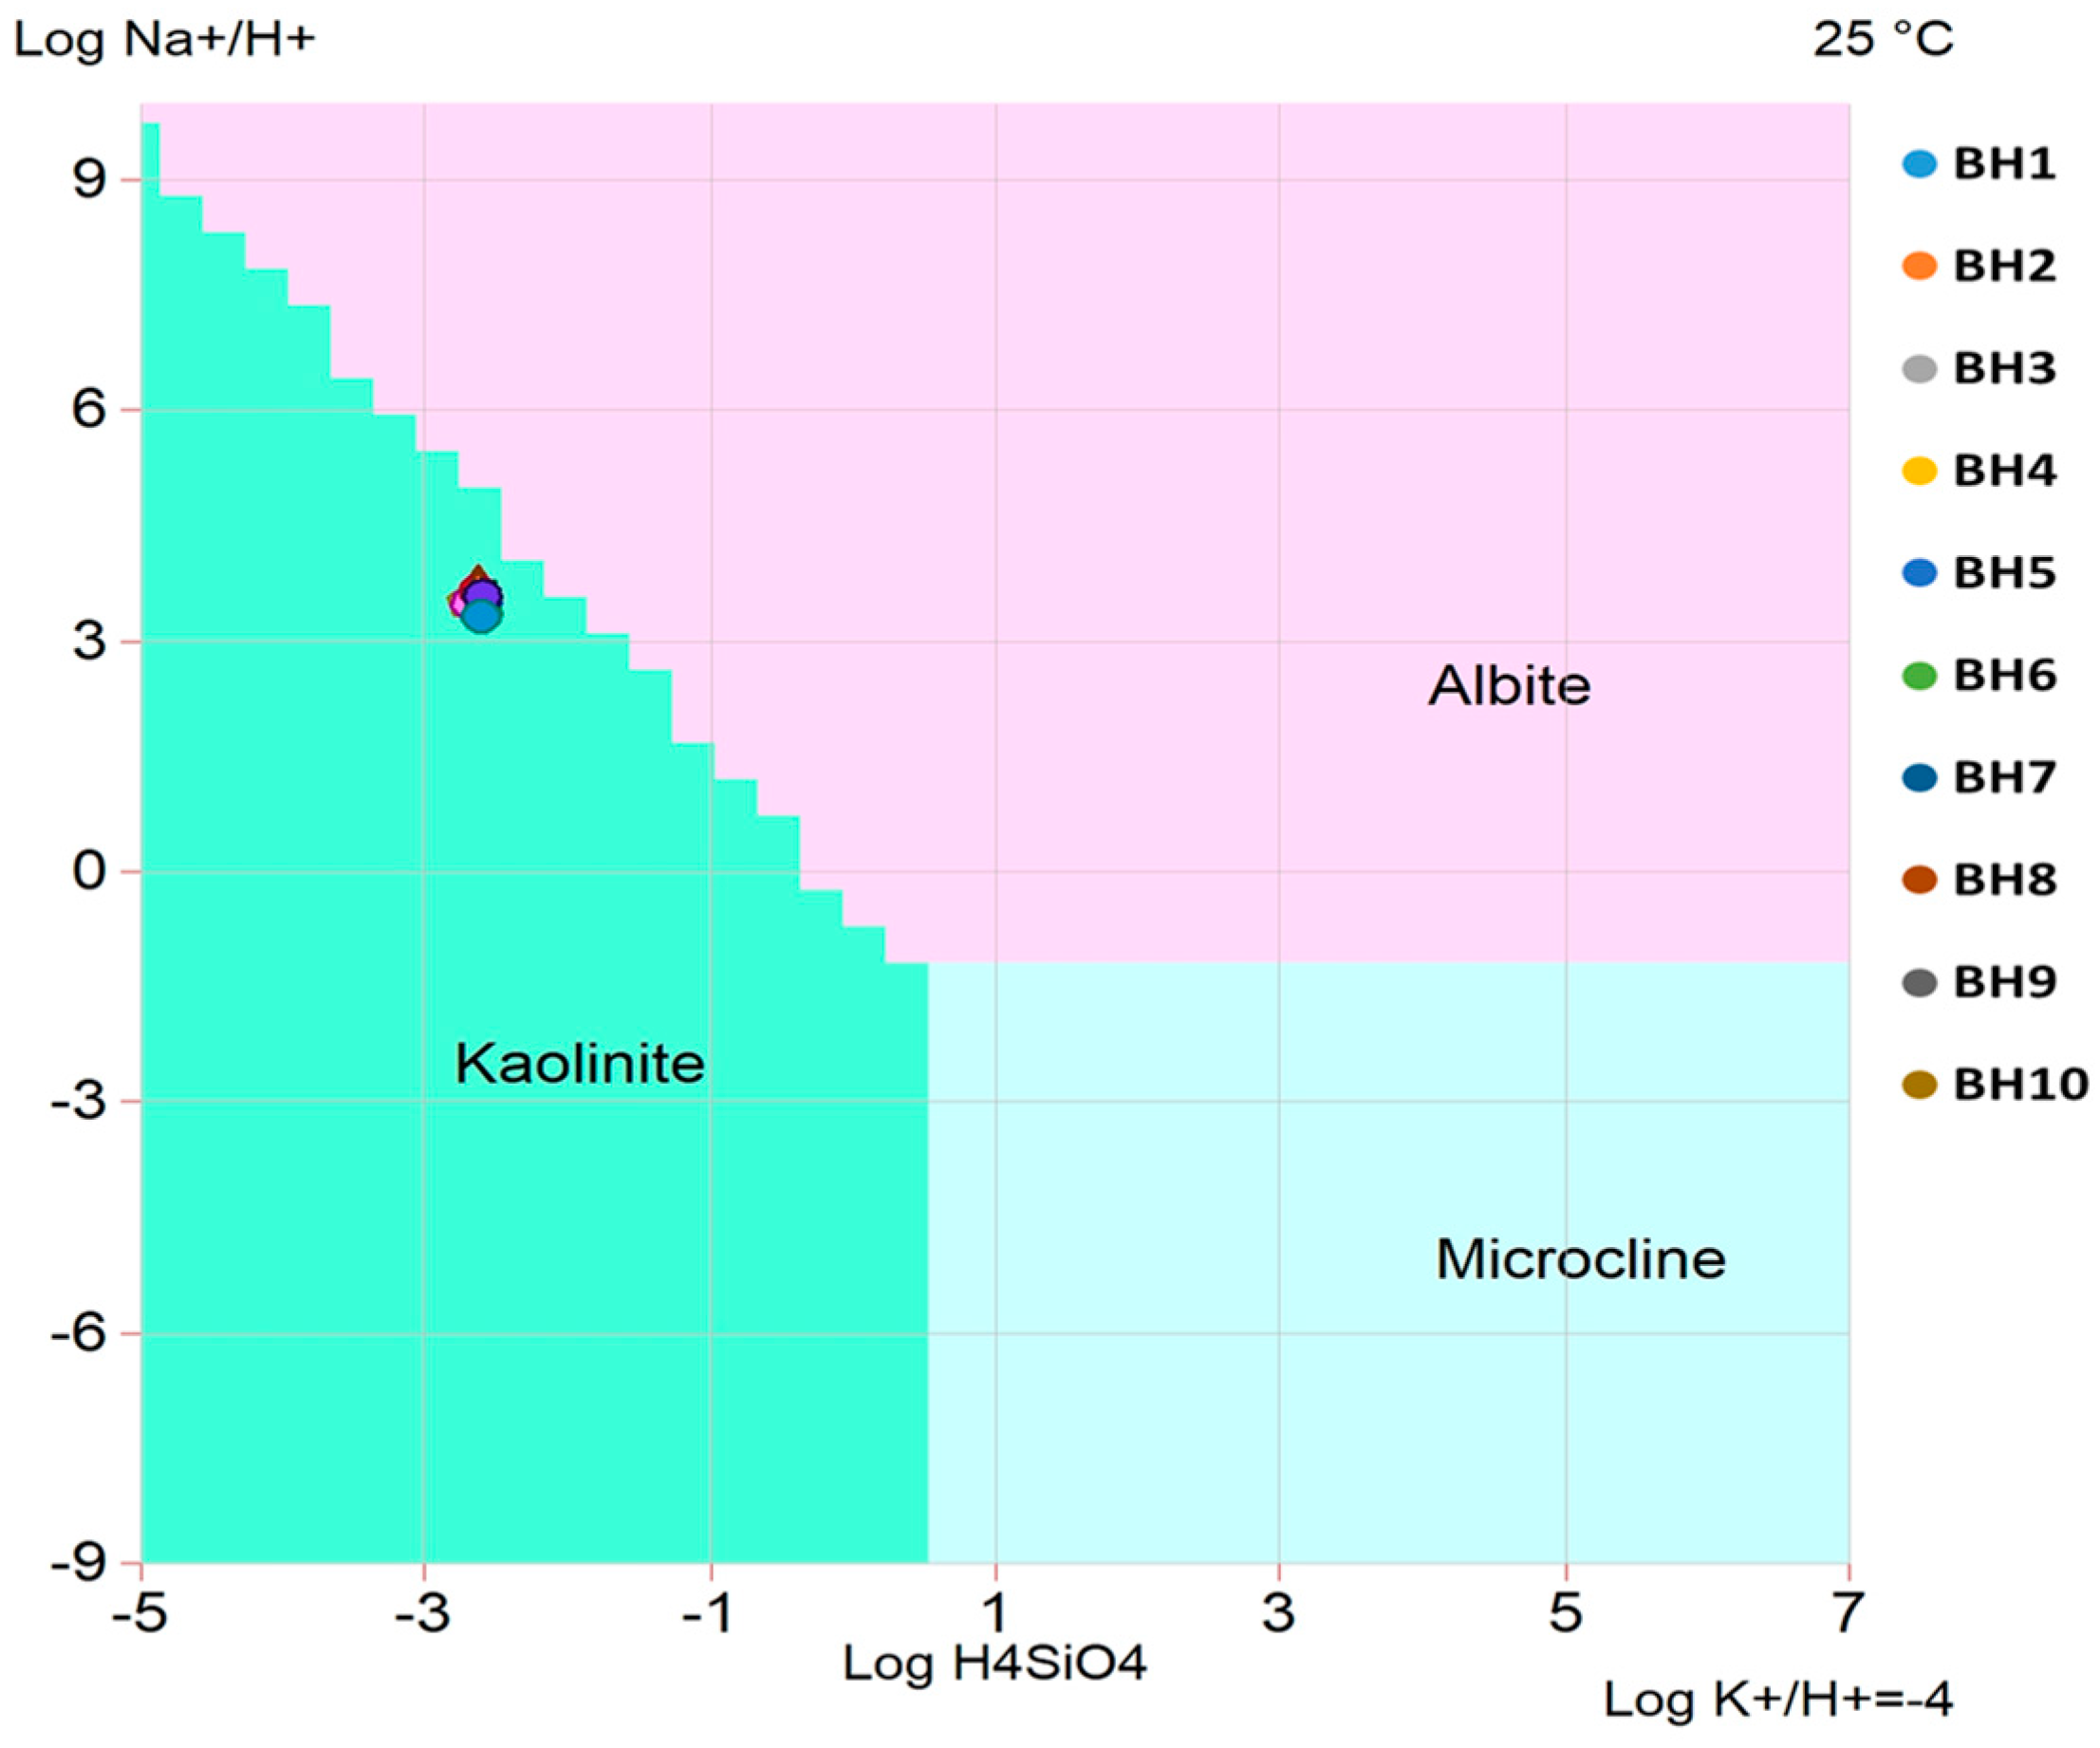
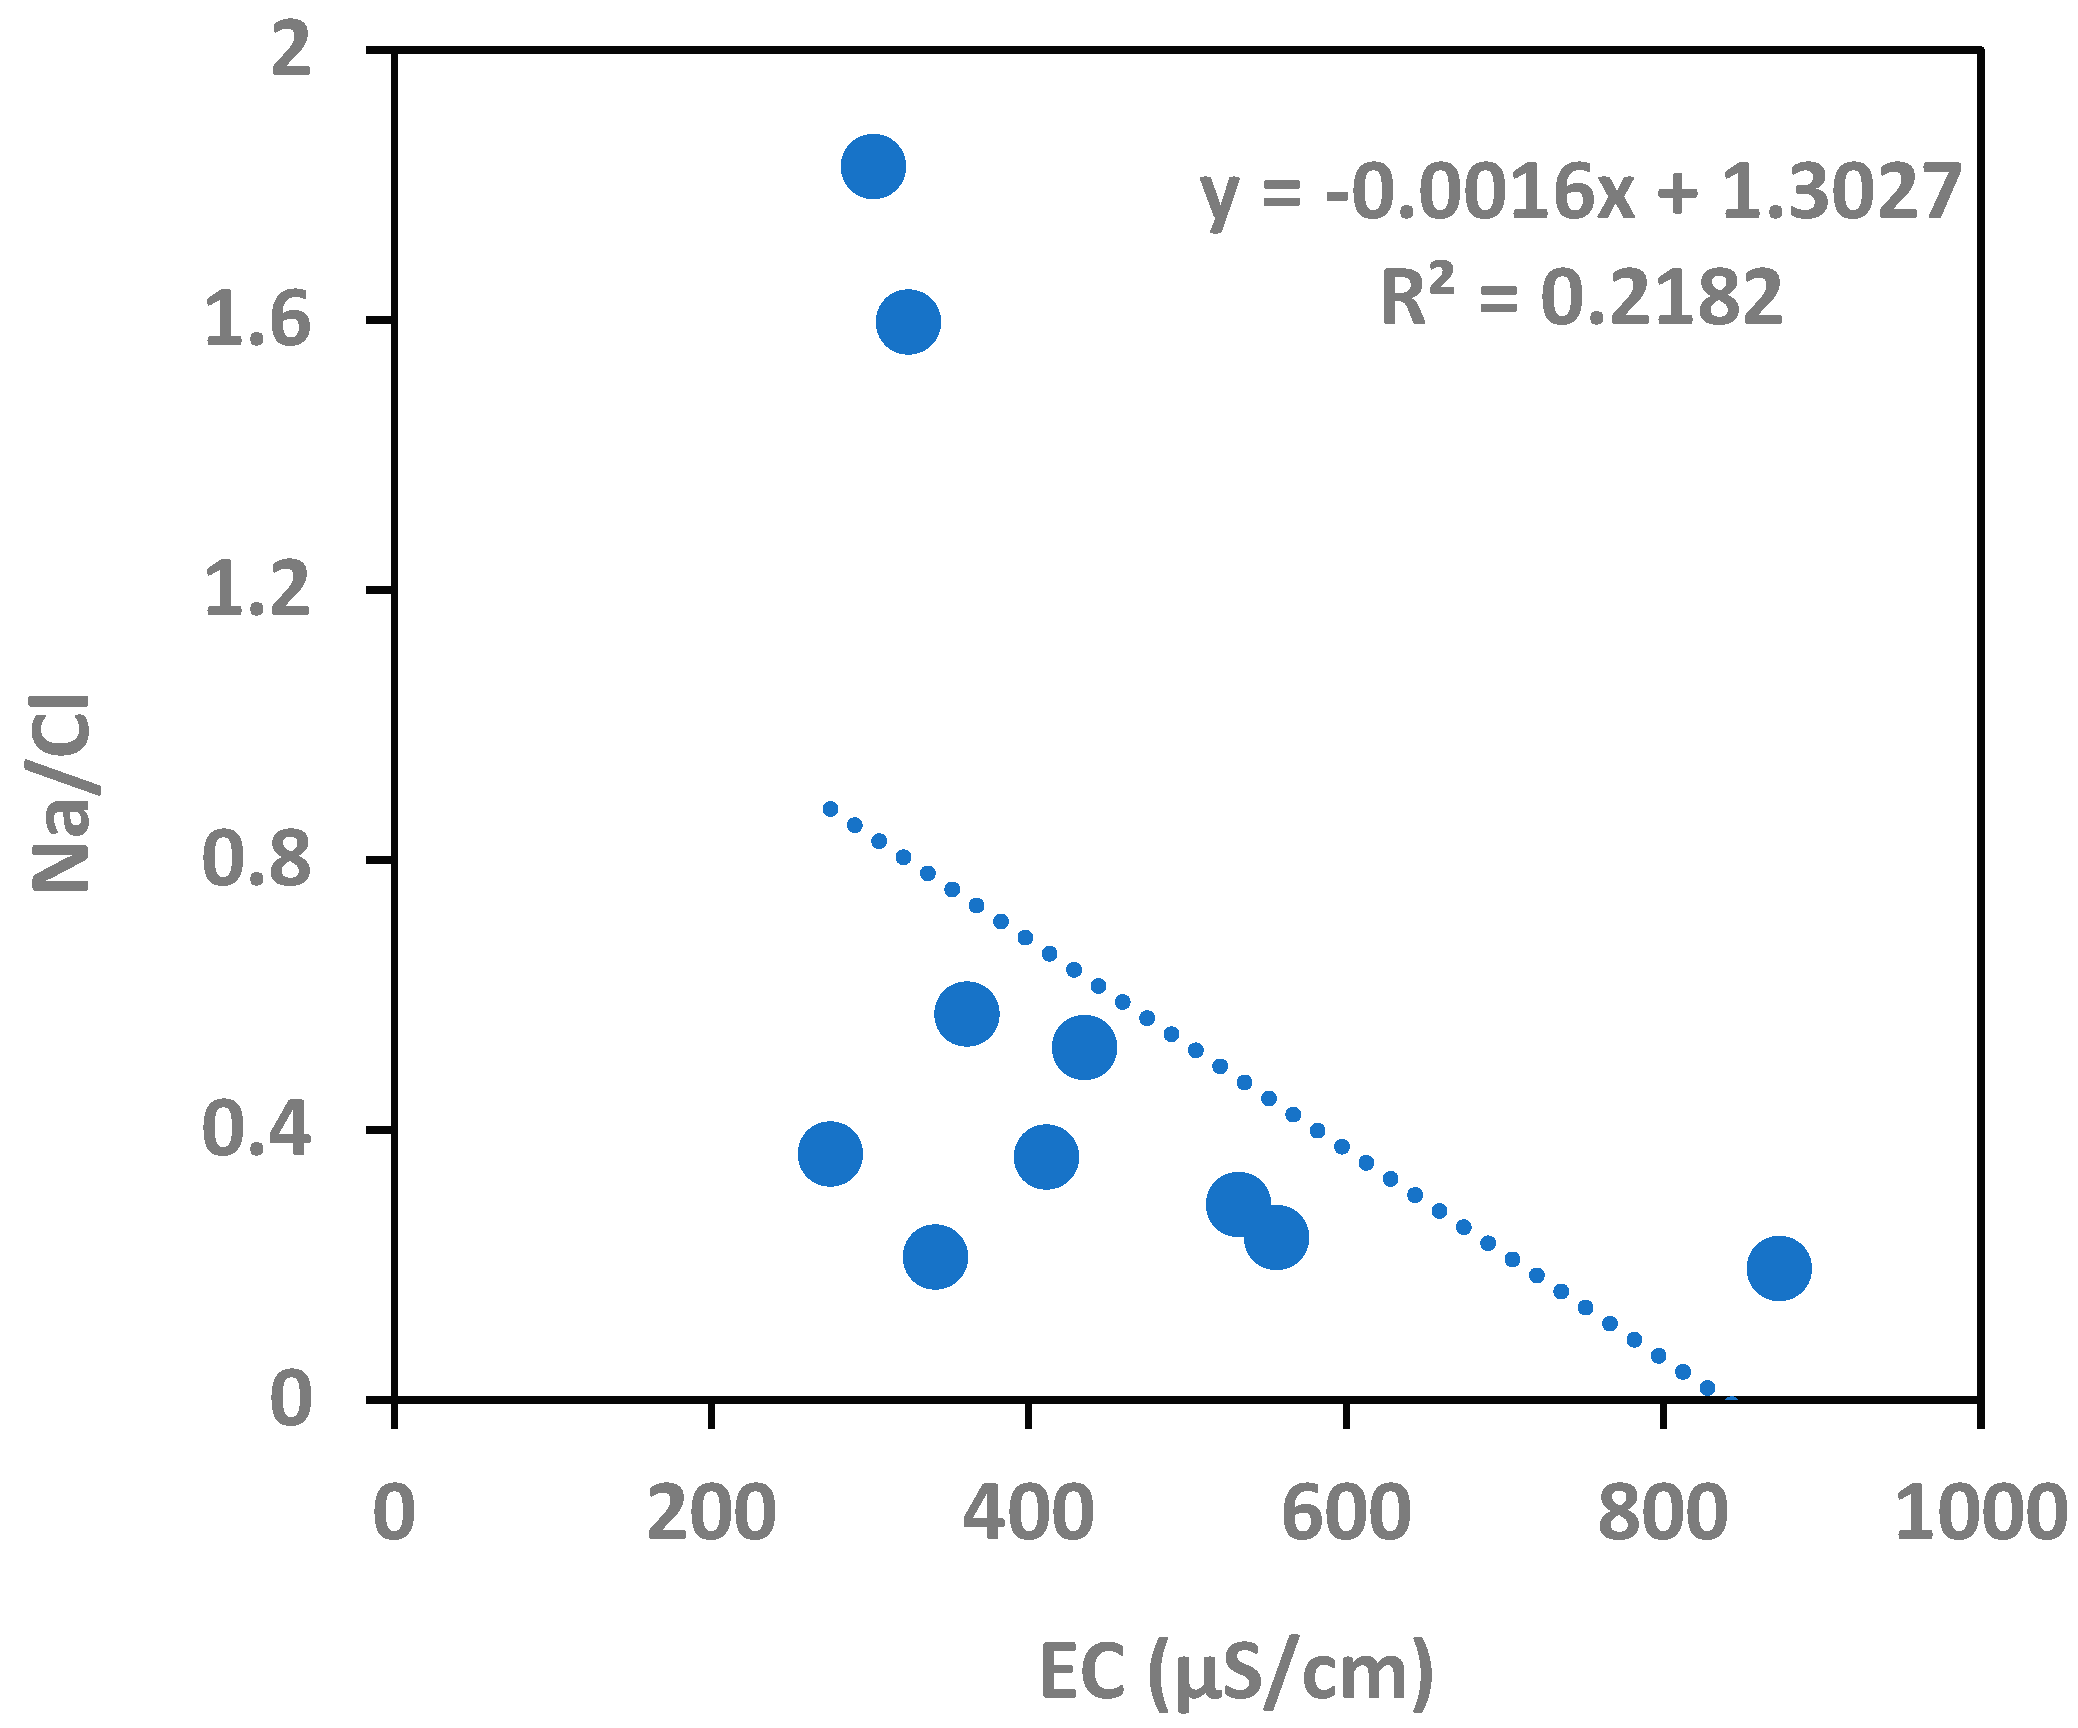
3.3. Hydrogeochemical Processes
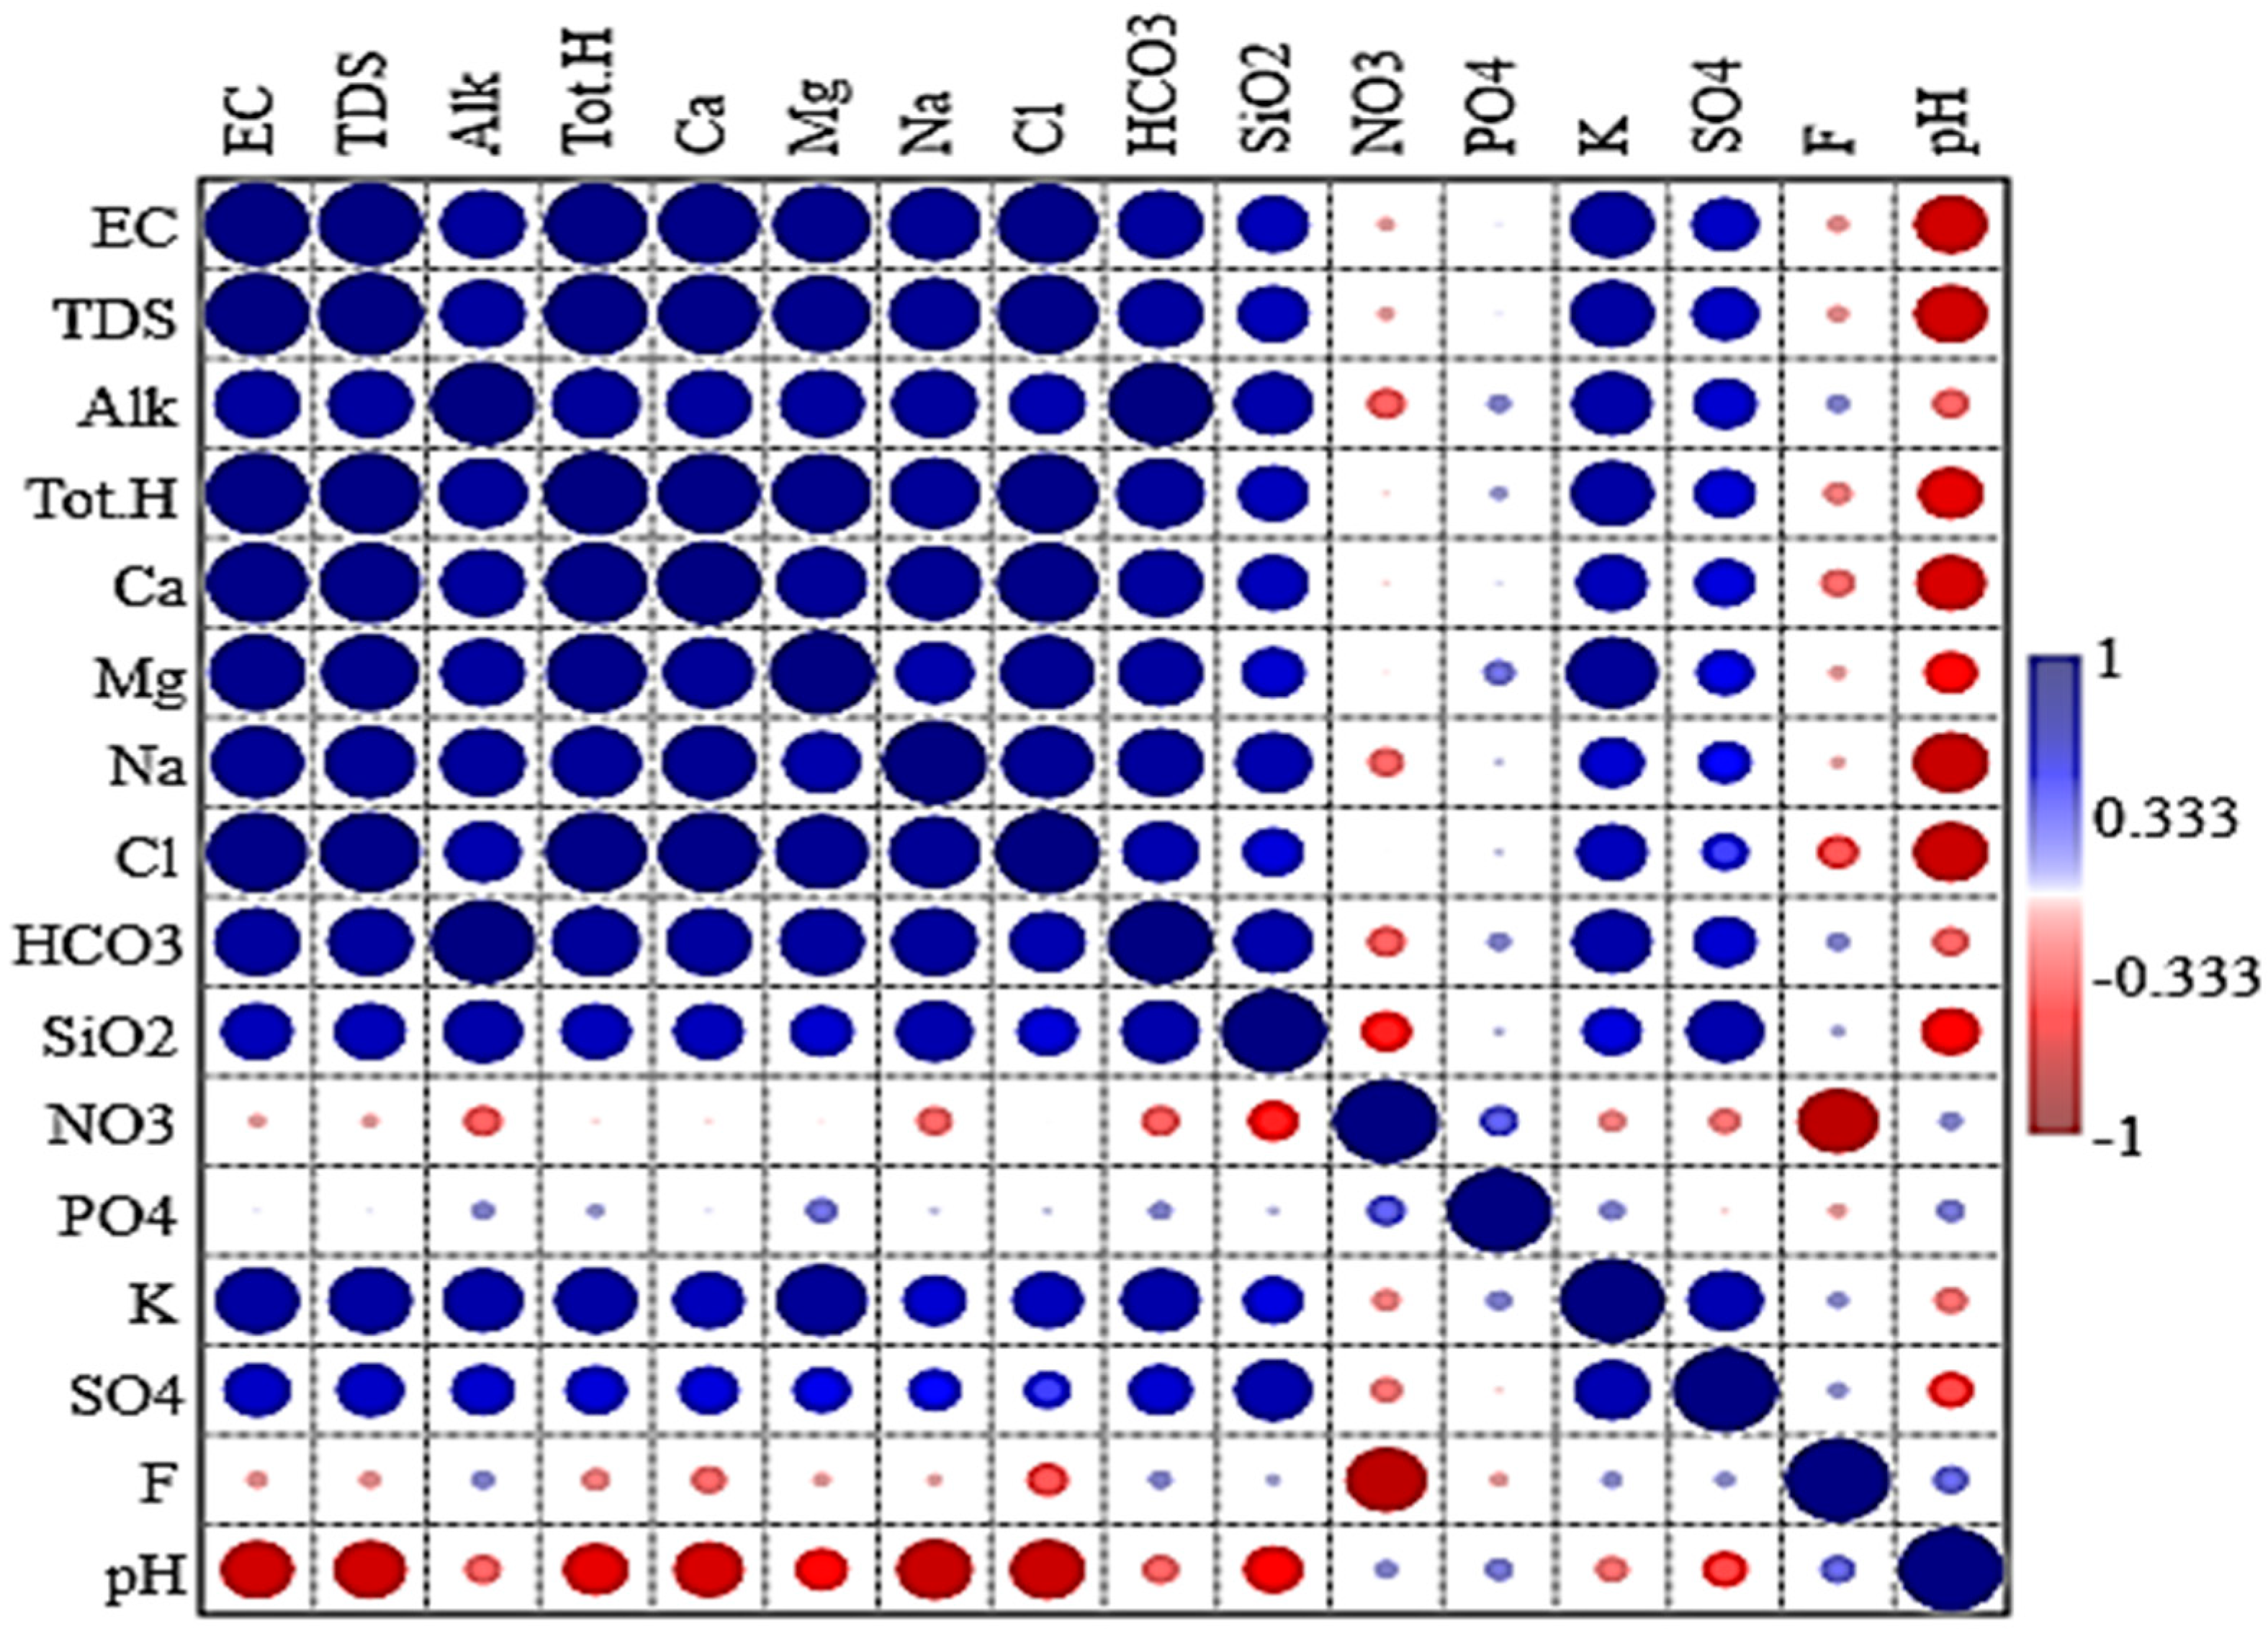
3.4. Multivariate Statistical
3.5. Drinking Water Quality
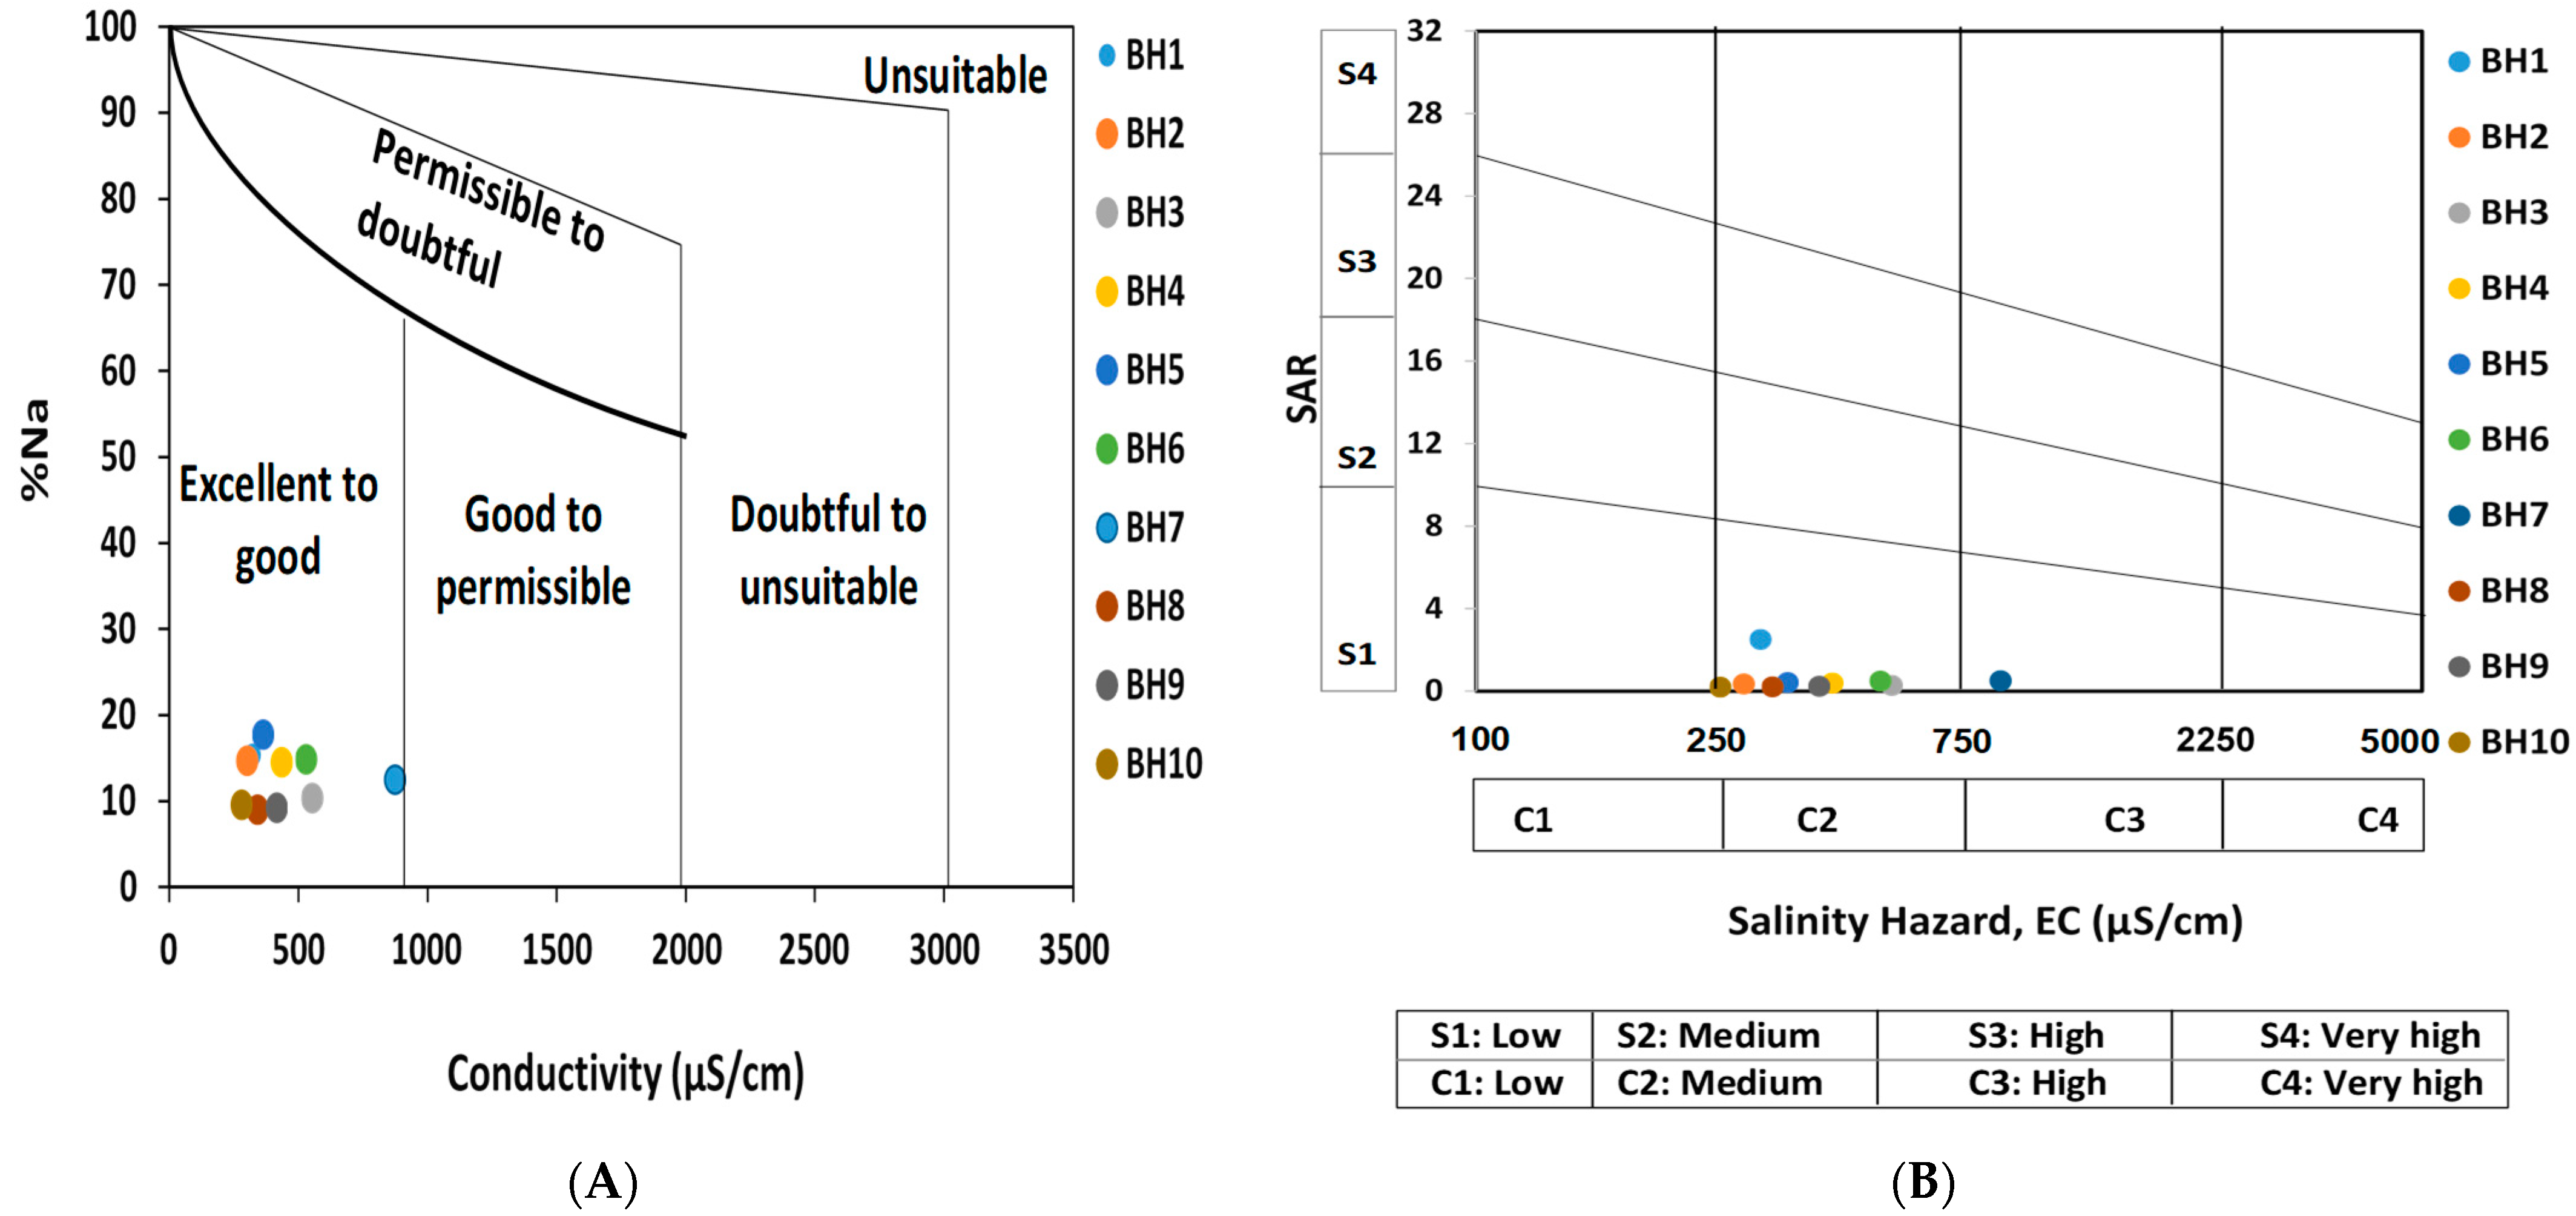
3.6. Irrigation Water Quality
3.7. Health Risk Assessment (HRA)
4. Conclusions
Author Contributions
Funding
Institutional Review Board Statement
Informed Consent Statement
Data Availability Statement
Acknowledgments
Conflicts of Interest
References
- Bhaduri, A.; Bogardi, J.; Siddiqi, A.; Voigt, H.; Vörösmarty, C.; Pahl-Wostl, C.; Bunn, S.E.; Shrivastava, P.; Lawford, R.; Foster, S.; et al. Achieving Sustainable Development Goals from a Water Perspective. Front. Environ. Sci. 2016, 4, 64. [Google Scholar] [CrossRef] [Green Version]
- Lamptey, D.; Nyamdi, B.; Minta, A. National Irrigation Policy, Strategies, and Regulatory Measures; Ghanaian Ministry of Food and Agriculture (MOFA): Accra, Ghana, 2011; pp. 1–37. ISBN 016031101213. [Google Scholar]
- Baldwin, G.L.; Stwalley, R.M. Opportunities for the Scale-Up of Irrigation Systems in Ghana, West Africa. Sustainability 2022, 14, 8716. [Google Scholar] [CrossRef]
- United Nations. The 2030 Agenda and the Sustainable Development Goals: An opportunity for Latin America and the Caribbean; (LC/G.2681-P/Rev.3); United Nations: Santiago, Chile, 2018. [Google Scholar]
- Akanle, O.; Kayode, D.; Abolade, I. Sustainable development goals (SDGs) and remittances in Africa. Cogent Social Sci. 2022, 8, 2037811 . [Google Scholar] [CrossRef]
- Pavelic, P.; Giordano, M.; Keraita, B.; Ramesh, V.; Rao, T. (Eds.) Groundwater Availability and Use in Sub-Saharan Africa: A Review of 15 Countries; International Water Management Institute (IWMI): Colombo, Sri Lanka, 2012. [Google Scholar] [CrossRef] [Green Version]
- Armah, F.A.; Ekumah, B.; Yawson, D.O.; Odoi, J.O.; Afitiri, A.-R.; Nyieku, F.E. Access to improved water and sanitation in sub-Saharan Africa in a quarter century. Heliyon 2018, 4, e00931. [Google Scholar] [CrossRef] [PubMed] [Green Version]
- Diao, X.; Hazell, P.B.R.; Kolavalli, S.; Resnick, D. Ghana’s Economic and Agricultural Transformation: Past Performance and Future Prospects: Synopsis; International Food Policy Research Institute (IFPRI): Washington, DC, USA, 2019. [Google Scholar] [CrossRef]
- Nyamekye, A.P.; Tian, Z.; Cheng, F. Analysis on the Contribution of Agricultural Sector on the Economic Development of Ghana. Open J. Bus. Manag. 2021, 09, 1297–1311. [Google Scholar] [CrossRef]
- Asafu-Adjaye, J. The Economic Impacts of Climate Change on Agriculture in Africa. J. Afr. Econ. 2014, 23, ii17–ii49. [Google Scholar] [CrossRef]
- IPCC. Climate Change 2014: Impacts, Adaptation, and Vulnerability. Part A: Global and Sectoral Aspects; Contribution of Working Group II to the Fifth Assessment Report of the Intergovernmental Panel on Climate Change; Field, C.B., Barros, V.R., Dokken, D.J., Mach, K.J., Mastrandrea, M.D., Bilir, T.E., Chatterjee, M., Ebi, K.L., Estrada, Y.O., Genova, R.C., et al., Eds.; Cambridge University Press: Cambridge, UK; Cambridge University Press: New York, NY, USA, 2014; p. 1132. [Google Scholar]
- FAO; IFAD; UNICEFF; WFP; WHO. The State of Food Security and Nutrition in the World 2018: Building Climate Resilience for Food Security and Nutrition; FAO: Rome, Italy, 2018. [Google Scholar]
- Beyene, G.; Aberra, D.; Fufa, F. Evaluation of the suitability of groundwater for drinking and irrigation purposes in Jimma Zone of Oromia, Ethiopia. Groundw. Sustain. Dev. 2019, 9, 100216. [Google Scholar] [CrossRef]
- Abanyie, S.K.; Sunkari, E.D.; Apea, O.B.; Abagale, S.; Korboe, H.M. Assessment of the quality of water resources in the Upper East Region, Ghana: A review. Sustain. Water Resour. Manag. 2020, 6, 52. [Google Scholar] [CrossRef]
- Gowing, J.; Walker, D.; Parkin, G.; Forsythe, N.; Haile, A.T.; Ayenew, D.A. Can shallow groundwater sustain small-scale irrigated agriculture in sub-Saharan Africa? Evidence from N-W Ethiopia. Groundw. Sustain. Dev. 2020, 10, 100290. [Google Scholar] [CrossRef]
- Saito, O.; Managi, S.; Kanie, N.; Kauffman, J.; Takeuchi, K. Sustainability science and implementing the sustainable development goals. Sustain. Sci. 2017, 12, 907–910. [Google Scholar] [CrossRef]
- Giordano, M. Agricultural groundwater use and rural livelihoods in sub-Saharan Africa: A first-cut assessment. Appl. Hydrogeol. 2006, 14, 310–318. [Google Scholar] [CrossRef]
- Pavelic, P.; Villholth, K.G.; Shu, Y.; Rebelo, L.-M.; Smakhtin, V. Smallholder groundwater irrigation in Sub-Saharan Africa: Country-level estimates of development potential. Water Int. 2013, 38, 392–407. [Google Scholar] [CrossRef]
- Amjath-Babu, T.; Krupnik, T.J.; Kaechele, H.; Aravindakshan, S.; Sietz, D. Transitioning to groundwater irrigated intensified agriculture in Sub-Saharan Africa: An indicator based assessment. Agric. Water Manag. 2016, 168, 125–135. [Google Scholar] [CrossRef]
- Shah, S.M.; Mistry, N.J. Groundwater quality assessment for irrigation use in Vadodara district, Gujarat, India. Int. J. Agric. Biosys. Eng. 2013, 7, 719–724. [Google Scholar] [CrossRef]
- Meireles, A.C.M.; De Andrade, E.M.; Chaves, L.C.G.; Frischkorn, H.; Crisostomo, L.A. A new proposal of the classification of irrigation water. Rev. Ciênc. Agron. 2010, 41, 349–357. [Google Scholar] [CrossRef] [Green Version]
- Suman, M.; Surender, S.; Poonam, Y.; Versha, R.; Pushpa, R.; Monika, S.; Gurmeet, S.; Khaiwal, R. Appraisal of salinity and fluoride in a semi-arid region of India using statistical and multivariate techniques. Environ. Geochem. Health 2009, 31, 643. [Google Scholar] [CrossRef] [Green Version]
- Yidana, S.M.; Banoeng-Yakubo, B.K.; Akabzaa, T. Analysis of groundwater quality using multivariate and spatial analyses in the Keta basin, Ghana. J. Afr. Earth Sci. 2010, 58, 220–234. [Google Scholar] [CrossRef]
- Adomako, D.; Gibrilla, A.; Akiti, T.T.; Fianko, R.; Maloszewski, P. Hydrogeochemical Evolution and Groundwater Flow in the Densu River Basin, Ghana. J. Water Resour. Prot. 2011, 03, 548–561. [Google Scholar] [CrossRef]
- Sunkari, E.D.; Abu, M. Hydrochemistry with special reference to fluoride contamination in groundwater of the Bongo district, Upper East Region, Ghana. Sustain. Water Resour. Manag. 2019, 5, 1803–1814. [Google Scholar] [CrossRef]
- Appelo, C.A.J.; Postma, D. Geochemistry, Groundwater and Pollution, 2nd ed.; CRC Press: London, UK, 2005; p. 683. [Google Scholar] [CrossRef]
- Apodaca, L.E.; Bails, J.B.; Smith, C.M. Water quality in shallow alluvial aquifers, upper colorado river basin, colorado, 1997. JAWRA J. Am. Water Resour. Assoc. 2002, 38, 133–149. [Google Scholar] [CrossRef]
- Martínez, D.; Bocanegra, E. Hydrogeochemistry and cation-exchange processes in the coastal aquifer of Mar Del Plata, Argentina. Appl. Hydrogeol. 2002, 10, 393–408. [Google Scholar] [CrossRef]
- Freeze, R.A.; Cherry, J.A. Groundwater, 2nd ed.; Prentice Hall: Englewood Cliffs, NJ, USA, 1979. [Google Scholar]
- Domenico, P.A.; Schwartz, F.W. Physical and Chemical Hydrogeology, 2nd ed.; John Wiley & Sons Inc.: New York, NY, USA, 1998. [Google Scholar]
- Jain, C.K.; Bandyopadhyay, A.; Bhadra, A. Assessment of ground water quality for drinking purpose, District Nainital, Uttarakhand, India. Environ. Monit. Assess. 2010, 166, 663–676. [Google Scholar] [CrossRef] [PubMed]
- Yidana, S.M.; Banoeng-Yakubo, B.; Aliou, A.-S.; Akabzaa, T.M. Groundwater quality in some Voltaian and Birimian aquifers in northern Ghana—Application of mulitvariate statistical methods and geographic information systems. Hydrol. Sci. J. 2012, 57, 1168–1183. [Google Scholar] [CrossRef] [Green Version]
- Helstrup, T.; Jørgensen, N.O.; Banoeng-Yakubo, B.K. Investigation of hydrochemical characteristics of groundwater from the Cretaceous-Eocene limestone aquifer in southern Ghana and southern Togo using hierarchical cluster analysis. Appl. Hydrogeol. 2007, 15, 977–989. [Google Scholar] [CrossRef]
- Zango, M.S.; Sunkari, E.D.; Abu, M.; Lermi, A. Hydrogeochemical controls and human health risk assessment of groundwa-ter fluoride and boron in the semi-arid North East region of Ghana. J. Geochem. Expl. 2019, 207, 106363. [Google Scholar] [CrossRef]
- Craig, L.; Thomas, J.M.; Lutz, A.; Decker, D.L. Determining the optimum locations for pumping low-fluoride groundwater to distribute to communities in a fluoridic area in the Upper East Region, Ghana. Chem. Geol. 2018, 476, 481–492. [Google Scholar] [CrossRef]
- Okofo, L.B.; Bedu-Addo, K.; Martienssen, M. Characterization of groundwater in the ‘Tamnean’ Plutonic Suite aquifers using hydrogeochemical and multivariate statistical evidence: A study in the Garu-Tempane District, Upper East Region of Ghana. Appl. Water Sci. 2022, 12, 22. [Google Scholar] [CrossRef]
- Piper, A.M. A graphic procedure in the geochemical interpretation of water-analyses. Eos Trans. Am. Geophys. Union 1944, 25, 914–928. [Google Scholar] [CrossRef]
- Gibbs, R.J. Mechanisms Controlling World Water Chemistry. Science 1970, 170, 1088–1090. [Google Scholar] [CrossRef]
- Hounslow, A.W. Water Quality Data: Analysis and Interpretation, 1st ed.; CRC Press: Boca Raton, FL, USA, 2018. [Google Scholar] [CrossRef]
- Richards, L.A. Diagnosis and Improvement of Saline and Alkali Soils; LWW: Philadelphia, PA, USA, 1954; Volume 78, p. 154. [Google Scholar]
- Doneen, L.D. Water Quality for Irrigated Agriculture. In Plants in Saline Environments; Ecological, Studies; Poljakoff-Mayber, A., Gale, J., Eds.; Springer: Berlin/Heidelberg, Germany, 1975; Volume 15. [Google Scholar] [CrossRef]
- Wilcox, L.V. Classification and Use of Irrigation Water; US Department of Agriculture, Circular 969; US Department of Agriculture: Washington, DC, USA, 1955. [Google Scholar]
- Hussain, G.; Alquwaizany, A.; Al-Zarah, A. Guidelines for Irrigation Water Quality and Water Management in The Kingdom of Saudi Arabia: An Overview. J. Appl. Sci. 2010, 10, 79–96. [Google Scholar] [CrossRef] [Green Version]
- Sunkari, E.D.; Abu, M.; Zango, M.S.; Wani, A.M.L. Hydrogeochemical characterization and assessment of groundwater quality in the Kwahu-Bombouaka Group of the Voltaian Supergroup, Ghana. J. Afr. Earth Sci. 2020, 169, 103899. [Google Scholar] [CrossRef]
- Singh, P.; Khan, I.A. Ground water quality assessment of Dhankawadi ward of Pune by using GIS International. J. Geomat. Geosci. 2011, 2, 688–703. [Google Scholar]
- Kawo, N.S.; Karuppannan, S. Groundwater quality assessment using water quality index and GIS technique in Modjo River Basin, central Ethiopia. J. Afr. Earth Sci. 2018, 147, 300–311. [Google Scholar] [CrossRef]
- Adimalla, N.; Li, P. Occurrence, health risks, and geochemical mechanisms of fluoride and nitrate in groundwater of the rock-dominant semi-arid region, Telangana State, India. Hum. Ecol. Risk Assess. Int. J. 2018, 25, 81–103. [Google Scholar] [CrossRef]
- Marghade, D.; Malpe, D.B.; Rao, N.S. Applications of geochemical and multivariate statistical approaches for the evaluation of groundwater quality and human health risks in a semi-arid region of eastern Maharashtra, India. Environ. Geochem. Health 2019, 43, 683–703. [Google Scholar] [CrossRef]
- Araya, D.; Podgorski, J.; Kumi, M.; Mainoo, P.A.; Berg, M. Fluoride contamination of groundwater resources in Ghana: Country-wide hazard modeling and estimated population at risk. Water Res. 2022, 212, 118083. [Google Scholar] [CrossRef]
- Dapaah-Siakwan, S.; Agyekum, W. The occurrence of groundwater in northeastern Ghana. In Applied Groundwater Studies in Africa, 1st ed.; CRC Press: Boca Raton, FL, USA, 2008; pp. 209–224. [Google Scholar]
- GSS. Ghana Statistical Service 2010 Population and Housing Census, Bongo District Analytical Report; Ghana Statistical Service: Accra, Ghana, 2014; 86p. [Google Scholar]
- Incoom, A.B.M.; Adjei, K.A.; Odai, S.N. Rainfall variabilities and droughts in the Savannah zone of Ghana from 1960–2015. Sci. Afr. 2020, 10, e00571. [Google Scholar] [CrossRef]
- Kesse, G.O. The Mineral and Rock Resources of Ghana; Balkema: Rotterdam, The Netherland, 1985; p. 610. [Google Scholar]
- Apambire, W.B.; Boyle, D.R.; Michel, F.A. Geochemistry, genesis, and health implications of fluoriferous groundwaters in the upper regions of Ghana. Environ. Earth Sci. 1997, 33, 13–24. [Google Scholar] [CrossRef]
- Murray, R.J. The Geology of the “Zuarungu” 1/2o Field Sheet with geological map. In Ghana Geological Survey Department Bulletin No. 25; Ghana Geological Survey Department: Accra, Ghana, 1960; 118p. [Google Scholar]
- Wright, E.P. The Hydrogeology of Crystalline Basement Aquifers in Africa; Geological Society Special Publication, No. 66; The Geological Society: London, UK, 1992. [Google Scholar]
- Martin, N. Development of a water balance for the Atankwidi catchment, West Africa—A case study of groundwater recharge in a semi-arid climate. In Ecology and Development Series No. 41; Cuvillier Verlag: Göttingen, Germany, 2006. [Google Scholar]
- Carrier, M.A.; Lefebvre, R.; Racicot, J.; Asare, E.B. Northern Ghana hydrogeological assessment project. In Proceedings of the Access to Sanitation and Safe Water: Global Partnerships and Local Actions—Proceedings of the 33rd WEDC International Conference, Accra, Ghana, 7 April 2008; pp. 353–361. Available online: http://wedc.lboro.ac.uk/resources/conference/33/Carrier_MA_GHA.pdf (accessed on 15 September 2022).
- Martin, N.; van de Giesen, N. Spatial distribution of groundwater production and development potential in the Volta River basin of Ghana and Burkina Faso. Int. Water Resourc. Assoc. 2005, 30, 239–249. [Google Scholar] [CrossRef]
- APHA. Standard Methods for the Examination of Water and Wastewater, 23rd ed.; American Public Health Association: Washington, DC, USA, 2017. [Google Scholar]
- Cotruvo, J.A. WHO guidelines for drinking water quality: First addendum to the fourth edition. J. Am. Water Work. Assoc. 2017, 109, 44–51. [Google Scholar] [CrossRef] [Green Version]
- Kortatsi, B.K. Hydrochemical characterization of groundwater in the Accra plains of Ghana. Environ. Geol. 2006, 50, 299–311. [Google Scholar] [CrossRef]
- Hammer, Ø.; Harper, D.A.T.; Ryan, P.D. PAST: Paleontological statistics software package for education and data analysis. Palaeontol. Electron. 2001, 4, 9. Available online: https://palaeo-electronica.org/2001_1/past/issue1_01.htm (accessed on 29 August 2022).
- Karami, M.A.; Fakhri, Y.; Rezania, S.; Alinejad, A.A.; Mohammadi, A.A.; Yousefi, M.; Ghaderpoori, M.; Saghi, M.H.; Ahmadpour, M. Non-Carcinogenic Health Risk Assessment due to Fluoride Exposure from Tea Consumption in Iran Using Monte Carlo Simulation. Int. J. Environ. Res. Public Health 2019, 16, 4261. [Google Scholar] [CrossRef] [Green Version]
- Rao, N.S.; Subrahmanyam, A.; Kumar, S.R.; Srinivasulu, N.; Rao, G.B.; Rao, P.S.; Reddy, G.V. Geochemistry and quality of groundwater of Gummanampadu sub-basin, Guntur District, Andhra Pradesh, India. Environ. Earth Sci. 2012, 67, 1451–1471. [Google Scholar] [CrossRef]
- Ullah, R.; Zafar, M.S.; Shahani, N. Potential fluoride toxicity from oral medicaments: A review. Iran. J. Basic Med. Sci. 2017, 20, 841–848. [Google Scholar] [CrossRef]
- Loh, Y.S.; Banoeng-Yakubo, B.; Yidana, S.M.; Asiedu, D.; Akabzaa, T.; Jørgensen, N.O. Hydrochemical characterisation of groundwater in parts of the Volta Basin, Northern Ghana. Ghana Min. J. 2012, 13, 24–32. [Google Scholar]
- Adams, S.; Titus, R.; Pietersen, K.; Tredoux, G.; Harris, C. Hydrochemical characteristics of aquifers near Sutherland in the Western Karoo, South Africa. J. Hydrol. 2001, 241, 91–103. [Google Scholar] [CrossRef] [Green Version]
- Marandi, A.; Shand, P. Groundwater chemistry and the Gibbs Diagram. Appl. Geochem. 2018, 97, 209–212. [Google Scholar] [CrossRef]
- Jankowski, J.; Acworth, R.I. Impact of Debris-Flow Deposits on Hydrogeochemical Processes and the Developement of Dryland Salinity in the Yass River Catchment, New South Wales, Australia. Appl. Hydrogeol. 1997, 5, 71–88. [Google Scholar] [CrossRef]
- Rogers, R.J. Geochemical Comparison of Ground Water in Areas of New England, New York, and Pennsylvania. Ground Water 1989, 27, 690–712. [Google Scholar] [CrossRef]
- Rajmohan, N.; Elango, L. Identification and evolution of hydrogeochemical processes in the groundwater environment in an area of the Palar and Cheyyar River Basins, Southern India. Environ. Geol. 2004, 46, 47–61. [Google Scholar] [CrossRef]
- Jalali, M. Hydrochemical Identification of Groundwater Resources and Their Changes under the Impacts of Human Activity in the Chah Basin in Western Iran. Environ. Monit. Assess. 2007, 130, 347–364. [Google Scholar] [CrossRef] [PubMed]
- Caspers, H.; Schoeller, H. Les Eaux Souterraines. Hydrologie dynamique et chimique, Recherche, Exploitation et Évaluation des Ressources. 187 fig. Paris: Masson et Cie, Éditeurs 1962. 642 p. NF 105. Int. Rev. Hydrobiol. 1964, 49, 182. [Google Scholar] [CrossRef]
- Edet, A.; Okereke, C. Hydrogeological and hydrochemical character of the regolith aquifer, northern Obudu Plateau, southern Nigeria. Appl. Hydrogeol. 2005, 13, 391–415. [Google Scholar] [CrossRef]
- Deshmukh, A.N.; Wadaskar, P.M.; Malpe, D.B. Fluorine in environment: A review. Gondwana Geol. Mag. 1995, 9, 1–20. [Google Scholar]
- Narsimha, A.; Rajitha, S. Spatial distribution and seasonal variation in fluoride enrichment in groundwater and its associated human health risk assessment in Telangana State, South India. Hum. Ecol. Risk Assess. Int. J. 2018, 24, 2119–2132. [Google Scholar] [CrossRef]
- Singaraja, C.; Chidambaram, S.; Jacob, N.; Babu, G.J.; Selvam, S.; Anandhan, P.; Rajeevkumar, E.; Balamurugan, K.; Tamizharasan, K. Origin of high fluoride in groundwater of the Tuticorin district, Tamil Nadu, India. Appl. Water Sci. 2018, 8, 54. [Google Scholar] [CrossRef] [Green Version]
- Pickering, W. The mobility of soluble fluoride in soils. Environ. Pollut. Ser. B Chem. Phys. 1985, 9, 281–308. [Google Scholar] [CrossRef]
- Holman, I.P.; Whelan, M.; Howden, N.J.K.; Bellamy, P.; Willby, N.; Casado, M.R.; McConvey, P.J. Phosphorus in groundwater-an overlooked contributor to eutrophication? Hydrol. Process. 2008, 22, 5121–5127. [Google Scholar] [CrossRef]
- Allison, L.E. Salinity in relation to irrigation. Adv. Agronom. 1964, 16, 139–180. [Google Scholar] [CrossRef]
- Akter, T.; Jhohura, F.T.; Akter, F.; Chowdhury, T.R.; Mistry, S.K.; Dey, D.; Barua, M.K.; Islam, A.; Rahman, M. Water Quality Index for measuring drinking water quality in rural Bangladesh: A cross-sectional study. J. Health Popul. Nutr. 2016, 35, 4. [Google Scholar] [CrossRef] [PubMed] [Green Version]
- Fipps, G. Irrigation Water Quality Standards and Salinity Management Strategies. 2003. Available online: https://hdl.handle.net/1969.1/87829 (accessed on 17 September 2022).
- Nagaraju, A.; Kumar, K.S.; Thejaswi, A. Assessment of groundwater quality for irrigation: A case study from Bandalamottu lead mining area, Guntur District, Andhra Pradesh, South India. Appl. Water Sci. 2014, 4, 385–396. [Google Scholar] [CrossRef] [Green Version]
- Suarez, D.L.; Wood, J.D.; Lesch, S.M. Effect of SAR on water infiltration under a sequential rain–irrigation management system. Agric. Water Manag. 2006, 86, 150–164. [Google Scholar] [CrossRef]


| Parameter | Unit | Assigned Weight (wi) | Relative Weight (Wr) | Drinking Water Guideline Value (mg/L) [61] |
|---|---|---|---|---|
| pH | pH units | 5 | 0.088 | 7.5 |
| TDS | mg/L | 5 | 0.088 | 1000 |
| Na+ | mg/L | 4 | 0.070 | 200 |
| K+ | mg/L | 3 | 0.053 | 30 |
| Ca2+ | mg/L | 5 | 0.088 | 200 |
| Mg2+ | mg/L | 4 | 0.070 | 150 |
| Cl− | mg/L | 5 | 0.088 | 250 |
| SO42− | mg/L | 4 | 0.070 | 250 |
| PO43− | mg/L | 3 | 0.053 | 0.7 |
| NO3− | mg/L | 4 | 0.070 | 10 |
| TH | mg/L | 5 | 0.088 | 200 |
| HCO3− | mg/L | 5 | 0.088 | 150 |
| F− | mg/L | 5 | 0.088 | 1.5 |
| Parameter | Interpretation | Units | Values | |
|---|---|---|---|---|
| Adult | Children | |||
| Cw | Contaminant concentration in groundwater | mg/L | Observed concentration | Observed concentration |
| IRwater | Ingestion rate | L/day | 2.2 | 1.8 |
| EF | Exposure frequency | Day/yr | 365 | 365 |
| ED | Exposure duration | yr | 30 | 6 |
| BW | Body weight | kg | 70 | 15 |
| AT | Average time (noncarcinogenic) | day | 10,950 | 2190 |
| RfD (F−) | Reference dose of fluoride | (mg/kg/day) | 6.0 × 10⁻² | 6.0 × 10⁻² |
| Statistics /Parameter | pH | EC (μS/cm) | TDS (mg/L) | Alk (mg/L) | Tot. H (mg/L) | Ca2+ (mg/L) | Mg+ (mg/L) | Na+ (mg/L) | K+ (mg/L) | Cl− (mg/L) | HCO3− (mg/L) | NO3-N (mg/L) | PO43− (mg/L) | SO42 (mg/L) | F− (mg/L) | SiO2 (mg/L) |
|---|---|---|---|---|---|---|---|---|---|---|---|---|---|---|---|---|
| N | 10.0 | 10.0 | 10.0 | 10.0 | 10.0 | 10.0 | 10.0 | 10.0 | 10.0 | 10.0 | 10.0 | 10.0 | 10.0 | 10.0 | 10.0 | 10.0 |
| Min | 6.7 | 275.0 | 165.0 | 90.6 | 107.8 | 22.8 | 8.1 | 4.7 | 1.1 | 4.8 | 110.5 | 0.0 | 0.1 | 1.0 | 1.9 | 114.7 |
| Max | 7.2 | 873.0 | 524.0 | 200.0 | 354.4 | 85.5 | 34.6 | 22.0 | 2.5 | 113.0 | 244.0 | 0.4 | 0.3 | 10.5 | 6.5 | 152.9 |
| Sum | 69.3 | 4410.0 | 2646.8 | 1331.4 | 1712.6 | 389.6 | 180.5 | 105.3 | 16.5 | 319.4 | 1624.0 | 1.7 | 1.8 | 67.3 | 35.4 | 1411 |
| Mean | 6.9 | 441.0 | 264.7 | 133.1 | 171.3 | 39.0 | 18.1 | 10.5 | 1.7 | 31.9 | 162.4 | 0.2 | 0.2 | 6.7 | 3.5 | 141.1 |
| Stand. dev | 0.1 | 178.3 | 107.0 | 32.5 | 75.4 | 18.0 | 8.1 | 5.2 | 0.5 | 32.6 | 39.7 | 0.1 | 0.1 | 3.3 | 1.9 | 12.6 |
| Median | 6.9 | 386.0 | 231.8 | 138.0 | 145.6 | 34.9 | 14.6 | 9.4 | 1.6 | 20.8 | 168.4 | 0.1 | 0.2 | 6.8 | 2.4 | 143.4 |
| WHO (2017) | 6.5–8.5 | - | 1000 | - | - | 200 | 150 | 200 | 30 | 250 | 150 | 50 | 0.7 | 250 | 1.5 | - |
| Mineral | Formula | Mean | Median | Standard Deviation | Minimum | Maximum |
|---|---|---|---|---|---|---|
| Anhydrite | CaSO4 | −3.27 | −3.16 | 0.40 | −4.15 | −2.79 |
| Calcite | CaCO3 | −0.73 | −0.71 | 0.18 | −0.99 | −0.45 |
| Dolomite | CaMg(CO3)2 | −1.46 | −1.37 | 0.42 | −2.24 | −0.93 |
| Gypsum | CaSO4:2H2O | −3.05 | −2.94 | 0.40 | −3.93 | −2.57 |
| Halite | NaCl | −8.26 | −8.34 | 0.55 | −8.94 | −7.19 |
| Fluorite | CaF2 | −0.26 | −0.36 | 0.42 | −0.81 | 0.26 |
| Amorphous Silica | SiO2 | 0.10 | 0.12 | 0.04 | 0.02 | 0.14 |
| Quartz | SiO2 | 1.36 | 1.37 | 0.05 | 1.26 | 1.40 |
| Parameters | PC1 | PC2 | PC3 |
|---|---|---|---|
| TDS | 0.98 | −0.09 | −0.12 |
| EC | 0.98 | −0.16 | −0.01 |
| Ca | 0.96 | −0.21 | −0.15 |
| Mg | 0.93 | −0.09 | 0.19 |
| Na | 0.89 | −0.07 | −0.13 |
| K | 0.83 | 0.28 | 0.22 |
| Cl | 0.92 | −0.33 | −0.12 |
| HCO3 | 0.89 | 0.25 | 0.13 |
| PO4 | 0.14 | −0.18 | 0.96 |
| SO4 | 0.68 | 0.47 | −0.09 |
| F | −0.11 | 0.92 | 0.07 |
| SiO2 | 0.77 | 0.33 | −0.05 |
| Eigenvalue | 7.93 | 1.55 | 1.10 |
| %Total variance | 66.09 | 12.89 | 9.17 |
| Cumulative eigenvalue | 7.93 | 9.48 | 10.58 |
| Cumulative % variance | 66.09 | 78.98 | 88.15 |
| WQI Range | Category |
|---|---|
| <50 | Excellent water |
| 50–100 | Good water |
| 100–200 | Poor water |
| 200–300 | Very poor water |
| >300 | Unsuitable water |
| Borehole | WQI | Category |
|---|---|---|
| BH 1 | 67.70 | Good water |
| BH 2 | 58.63 | Good water |
| BH 3 | 67.98 | Good water |
| BH 4 | 61.28 | Good water |
| BH 5 | 39.77 | Excellent water |
| BH6 | 50.53 | Good water |
| BH7 | 64.29 | Good water |
| BH8 | 37.86 | Excellent water |
| BH9 | 45.32 | Excellent water |
| BH10 | 35.97 | Excellent water |
| Parameter | Range | Quality Ratings | Percentage of Samples (%) |
|---|---|---|---|
| TDS (mg/L) [43] | <1000 | Satisfactory | 100 |
| 1000–2000 | Fair | – | |
| >2000 | Inferior | – | |
| EC (μS/cm) [40] | 0–250 | Excellent | – |
| 250–750 | Good | 90 | |
| 750–2250 | Permissible | 10 | |
| 2250–5000 | Unsuitable | – | |
| %Na [42,83] | <20 | Excellent | 100 |
| 20–40 | Good | – | |
| 40–60 | Permissible | – | |
| 60–80 | Doubtful | – | |
| >80 | Unsuitable | – | |
| MR (%) [44] | <50 | Suitable | 90 |
| >50 | Unsuitable | 10 | |
| PI [41] | <25 | Unsuitable | – |
| 25–75 | Moderately suitable | 100 | |
| >75 | suitable | – | |
| SAR [40] | <10 | Excellent | 100 |
| 10–18 | Good | – | |
| 18–26 | Fair | – | |
| >26 | Poor | – |
| Borehole | Adult | Children | ||
|---|---|---|---|---|
| CDI (mg/kg/Day) | HQ | CDI (mg/kg/Day) | HQ | |
| BH1 | 0.20 | 3.40 | 0.78 | 13.00 |
| BH2 | 0.17 | 2.78 | 0.64 | 10.60 |
| BH3 | 0.18 | 2.93 | 0.67 | 11.20 |
| BH4 | 0.16 | 2.72 | 0.62 | 10.40 |
| BH5 | 0.08 | 1.36 | 0.31 | 5.20 |
| BH6 | 0.06 | 1.06 | 0.24 | 4.04 |
| BH7 | 0.07 | 1.16 | 0.27 | 4.42 |
| BH8 | 0.06 | 1.00 | 0.23 | 3.80 |
| BH9 | 0.06 | 1.07 | 0.25 | 4.10 |
| BH10 | 0.06 | 1.04 | 0.24 | 3.96 |
Publisher’s Note: MDPI stays neutral with regard to jurisdictional claims in published maps and institutional affiliations. |
© 2022 by the authors. Licensee MDPI, Basel, Switzerland. This article is an open access article distributed under the terms and conditions of the Creative Commons Attribution (CC BY) license (https://creativecommons.org/licenses/by/4.0/).
Share and Cite
Obiri-Nyarko, F.; Asugre, S.J.; Asare, S.V.; Duah, A.A.; Karikari, A.Y.; Kwiatkowska-Malina, J.; Malina, G. Hydrogeochemical Studies to Assess the Suitability of Groundwater for Drinking and Irrigation Purposes: The Upper East Region of Ghana Case Study. Agriculture 2022, 12, 1973. https://doi.org/10.3390/agriculture12121973
Obiri-Nyarko F, Asugre SJ, Asare SV, Duah AA, Karikari AY, Kwiatkowska-Malina J, Malina G. Hydrogeochemical Studies to Assess the Suitability of Groundwater for Drinking and Irrigation Purposes: The Upper East Region of Ghana Case Study. Agriculture. 2022; 12(12):1973. https://doi.org/10.3390/agriculture12121973
Chicago/Turabian StyleObiri-Nyarko, Franklin, Stephen Junior Asugre, Sandra Vincentia Asare, Anthony Appiah Duah, Anthony Yaw Karikari, Jolanta Kwiatkowska-Malina, and Grzegorz Malina. 2022. "Hydrogeochemical Studies to Assess the Suitability of Groundwater for Drinking and Irrigation Purposes: The Upper East Region of Ghana Case Study" Agriculture 12, no. 12: 1973. https://doi.org/10.3390/agriculture12121973