Article

Application in Augmented Reality for Learning Mathematical Functions: A Study for the Development of Spatial Intelligence in Secondary Education Students

by
Francisco del Cerro Velázquez
and
Ginés Morales Méndez
*
Energy Engineering and Teaching Innovation Research Group in Technology, Faculty of Education (“C” Building), Campus de Espinardo, University of Murcia, 30100 Murcia, Spain
*
Author to whom correspondence should be addressed.
Mathematics 2021, 9(4), 369; https://doi.org/10.3390/math9040369
Submission received: 13 December 2020 / Revised: 2 February 2021 / Accepted: 8 February 2021 / Published: 13 February 2021
(This article belongs to the Special Issue Active Methodologies for the Promotion of Mathematical Learning)

Abstract

:
Spatial intelligence is an essential skill for understanding and solving real-world problems. These visuospatial skills are fundamental in the learning of different Science, Technology, Engineering and Mathematics (STEM) subjects, such as Technical Drawing, Physics, Robotics, etc., in order to build mental models of objects or graphic representations from algebraic expressions, two-dimensional designs, or oral descriptions. It must be taken into account that spatial intelligence is not an innate skill but a dynamic skill, which can be enhanced by interacting with real and/or virtual objects. This ability can be enhanced by applying new technologies such as augmented reality, capable of illustrating mathematical procedures through images and graphics, which help students considerably to visualize, understand, and master concepts related to mathematical functions. The aim of this study is to find out whether the integration of the Geogebra AR (Augmented Reality) within a contextualized methodological environment affects the academic performance and spatial skills of fourth year compulsory secondary education mathematics students.

1. Introduction

The term function in mathematics is defined as any relationship between two or more variables that can be represented graphically. Function learning provides students in Compulsory Secondary Education (ESO) with their first contact with the identification, visualization, and interpretation of the relationship between two independent variables and is therefore a key point of transition within mathematical development figure [1]. The cognitive transition of graphically representing a constant, linear, affine, quadratic, exponential, absolute value, inverse proportionality, and logarithmic function from its algebraic expression is included in the curriculum of this educational stage and tends to be a challenge for most students.
This study is based on research integrating ICT in the classroom, where we can detect their benefits and drawbacks, design resources to help implement these technological tools, collect and analyze data, and reflect on the results. These action research elements provide a backdrop for teachers to recreate a digital and proactive environment in the classroom within a contextualized methodology that favors the teaching-learning processes of mathematics, with the aim of making students the protagonists in the construction of their knowledge.
Several studies claim that the inclusion of ICT in the teaching and learning of mathematics helps students to visualize how changes in one variable affect others immediately, thus improving their experience and interaction with learning compared to solving formulas so as to obtain the answer [2,3,4,5,6]. It is common for students to associate the representation of functions with a collection of isolated points rather than a single entity, making it difficult to visualize and interpret graphically [7,8,9]. As a consequence, students often do not visualize and interpret correctly the representations of graphic functions as a solution in itself, therefore they do not manage to conceive the transition process from algebraic language to visual language and vice versa. Therefore, we pose the following questions: How could ICT based on augmented reality facilitate the process of representation, visualization, and analysis of algebraic functions? Is this cognitive-visual process linked to students’ spatial intelligence?

1.1. Spatial Intelligence

According to Bishop’s theory, an individual acquires the capacity for spatial visualization through three distinct stages of development [10]. In the first stage, children learn topological spatial visualization, where they can understand the relationship between different objects in space, i.e., the location of an object within a group of objects, the isolation of the object, etc. In the second stage of development, they acquire projective representation, where they can conceive how an object will look from different perspectives. Finally, the final stage of the development of spatial visualization is based on combining spatial projection skills with distance measurement.
On the other hand, spatial intelligence corresponds to one of the eight intelligences of the model proposed by Gardner [11] in the theory of Multiple Intelligences (MI). This type of intelligence implies having the capacity to perceive the visual world with accuracy, to mentally recreate objects or models, even in the absence of physical stimuli, and to carry out transformations or modifications of them.
In the study of the so-called knowledge areas of Science, Technology, Engineering, and Mathematics, better known by its popular homonym in English as STEM, this type of intelligence is fundamental for students to develop the ability to transfer numerical data and two-dimensional projections to three-dimensional objects with ease [12,13]. Within the contents of the subjects of Secondary Education, this skill has numerous applications, such as the conception and construction of spatial models, the analysis of geometric objects, the interpretation of diagrams, and the identification of functions among others.
The term spatial intelligence covers five fundamental skills: Spatial visualization, mental rotation, spatial perception, spatial relationship, and spatial orientation [14].
Spatial visualization [15] denotes the ability to perceive and mentally recreate two- and three-dimensional objects or models. Several authors [16,17] use the term spatial visualization to indicate the processes and abilities of individuals to perform tasks that require seeing or mentally imagining spatial geometric objects, as well as relating these objects and performing geometric operations or transformations with them.
Shepard and Metzler [18] define mental rotation as the cognitive ability to rotate ideal representations of dimensional and/or three-dimensional objects or models, and can be described as the movement of representations through the brain to help conceive each of its views or perspectives regarding a turn.
According to Gibson [19], spatial perception is defined as the ability to visually perceive and understand external spatial information, such as characteristics, properties, measurements, shapes, the position, and movement of an object in relation to an individual.
On the other hand, the spatial relationship determines how an object is located in space in relation to another reference object and this skill is the basis of cognitive development for walking and trapping objects in space [20].
Finally, we can refer to spatial orientation as a fundamental ability to move and locate oneself in space [21,22], being necessary for such common activities as writing straight, reading, differentiating between right and left, and, in general, locating objects and orienting them in space.
These five skills are malleable and can therefore be reinforced through the use of multi-sensory tools or applications that stimulate and improve these abilities [23]. However, the traditional method for teaching visual and spatial skills to students is based on analyzing and interpreting two-dimensional images, orthogonal views, and graphics on a blackboard or paper. This method has obvious limitations, as it hinders the conceptualization and assimilation of contents due to the lack of interaction between students and the representations [24].
This study relates the development of spatial skills to the representation of two and three-dimensional functions in mathematics, and demonstrates that augmented reality technology contributes to the improvement of spatial skills and the understanding of highly visual content. This might be due to the observation and experimentation of the models from different angles and relative positions, respecting the individual learning pace of each student. Some studies [25,26] state that visual and spatial abilities can be improved by emerging technologies such as augmented reality. The integration of this technology in the classroom favors a constructivist approach to learning by allowing teachers to introduce tangible and proactive experiences in the classroom where students interact and manipulate with the learning object. As educators, we must show a positive attitude towards the integration of ICT in education, as it effectively changes the way students learn [27], however, a lot of work still needs to be done in order to achieve a systematic development of augmented reality for educational purposes.

1.2. Augmented Reality as a Methologocial Resource in Teaching-Learning Processes

Augmented Reality, AR henceforth, offers multiple benefits that support the teaching-learning process. The applications of AR allow the human-machine interaction to be more natural by enabling the preservation of the user’s environment, providing a real frame of reference which the user can rely on to perform certain actions. This process can be achieved through the superimposition of virtual objects in a real environment. Students can experience the ability to combine their real environment with a virtual one designed, in this case, by themselves.
This technology allows any real environment to be enriched with digital information through the use of a camera and software that in recent years has focused its development on mobile devices which, due to their portability, contribute to off-site learning, where any scenario can be transformed for training purposes [26,28,29].
The reports of New Media Consortium [30,31,32,33,34,35] that identify and describe the trends, challenges, and technological advances in education, estimate that AR technology will be established in secondary and higher education classrooms in the short term as an information access tool that will generate new applications of technology in the learning process.
This indicator, together with the omnipresence of mobile devices, which have become the main tool for accessing information in different formats and in an immediate form, can be used as access portals to Open Educational Resources (OER) that adapt the pace of learning to the needs of each user; it combines an AR-mobile device binomial that equates access to learning opportunities and facilitates the provision of mobile, interactive, individualized, and adapted learning services [26].
The integration of AR technology into the field of education has enabled an evolution of the educational model. Initially, this technology was used only as a tool for immediate access to digital information, involving students in the theories of behaviorism and objectivism. Recently the applications of this technology are undergoing some changes, with students moving from being recipients to providers of knowledge and the teacher taking on the role of guide and tutor with the objective that students generate knowledge using this technology in an interactive way, where the main theories of this new model are: Cognitivism, constructivism, and constructionism [36].
The fact that the educational scene is one in which the acquisition of digital competences is particularly relevant must be noted [37], although the vast majority of technological tools and resources do not promote the same learning opportunities for all. The Sustainable Development Goal 4 aims to ensure inclusive, equitable, and quality education and promote continuous learning opportunities for all. Mobile devices are driving a revolution in education, allowing learners to access learning resources anywhere, anytime. Therefore, the role of mobile learning is relevant, as it has the ability to help break down economic barriers, differences between rural and urban areas, as well as functional limitations. The omnipresence of mobile devices is changing the way people interact with information and their environment. In addition, the continuous improvement of the hardware of these devices and their reduction in cost, positions them as the first tool for accessing the most widespread information worldwide [26]. Consequently, in order to conduct this study, mobile devices were chosen as the learning platform, since all students had one or had access to them, thus guaranteeing access to training for all students.
Thanks to new technologies, we enter for the first time a place where we interact with real objects and at the same time with virtual ones, which allow us to remember previous learning and restructure our thinking, thus giving meaning to what we perceive from the surrounding world. As Vigotsky [38] stated, people develop ways of interpreting and strategies to relate to physical and cognitive space in such a way that this type of interaction can be established with tools and systems that provide various types of stimulation, thus it is certain that the use of AR will lead to substantial changes in the way knowledge is accessed, interpreted, and communicated, which must be considered in the field of education [39].
AR as an integrated technology in teaching acquires a dimension that emphasizes sensory transformation, so if it is integrated into the teaching-learning processes it could promote meaningful and contextualized learning acquired through multiple sensory experiences [40].
This technology can be used in education to represent 3D models of objects that, because of their size, cost, danger, distance and tangibility, are not within the real reach of students. Moreover, working in contexts with AR, there is a direct interaction with the environment or the object of study, making learning more meaningful.
With the representation of objects in 3D through AR technology we have the freedom of spatial exploration, so students can really perceive and understand space as it is. In addition to spatial perception, students can view models in space and modify parameters that alter their geometry. In this way, the spatial visualization is exercised and they can rotate or flip these representations to visualize each of their perspectives or views, thus promoting spatial rotation. At the same time, and while the user observes the parameters that correlate various objects recreated in space and places the designs in the plane, the skills of spatial relationship and orientation are also developed. With all this, we stimulate, work, and enhance all the fundamental fields of spatial skills established by Maier in 1994 [14] through a multi-sensorial tool, such as AR and mobile devices.

1.3. Geogebra AR as a Tool to Support the Learning of Mathematical Functions

In accordance with the constructivist theory, it is believed that technology can help students in teaching-learning processes. One of the first technological tools for learning functions is graphical calculators, which emerged as an instrument to enable students to solve systems of equations, represent graphs, and perform other tasks with variables [41]. Despite their benefits, these calculators have limitations when solving and representing certain expressions due to their small output interface. In addition, they must be implemented cautiously, as many students have difficulties when using symbols, which can be counterproductive and slow down the resolution of operations [42].
The most recent graphical interfaces offer direct manipulation mechanisms for the representation of mathematical functions, allowing users to interact intuitively and directly in the visualization they are editing, providing immediacy and simplicity when obtaining results, and helping their interpretation and learning. The term direct manipulation describes a style of interaction that stands out for the following characteristics: Continuous representation of objects and actions of interest; change from complex command syntax to manipulation of objects and actions; fast, incremental, and reversible actions that have an immediate effect on the selected object [43]. Therefore, direct manipulation is, by far, the most common type of interaction in mobile applications, and it is found to a greater extent in AR interfaces, since it provides us with an immediate handling of virtual objects in our real environment.
Numerous research studies claim that didactics through AR applications positively influence students’ attitude and motivation towards learning [44,45,46,47,48,49,50,51,52,53], providing an active teaching environment where the capacity for enquiry and research is encouraged, while promoting the development of autonomous student work in their learning [26,54]. Likewise, several studies state that the correct integration of AR applications in the classroom improves students’ learning results [55,56,57,58,59].
Despite the numerous research studies cited on AR resource didactics, few are concerned with the possible impact of AR technology on spatial intelligence [12,60] and, thus, there is an interest in conducting research so as to determine if there is a real contribution of AR to the acquisition of spatial skills.
In order to explore the development of spatial intelligence in relation to mathematical learning, our classroom experience revolves around the open source application, Geogebra AR, for mobile devices which helps students learn analysis, geometry, algebra, and calculus. This mathematical application is specifically designed for educational purposes. It allows the dynamic drawing of geometric constructions of all kinds, as well as the graphic representation, algebraic treatment, and calculation of functions in a simple and effective way, which permits us to use it as a support tool for the study, promoting mathematical self-learning. There is a large volume of research that has shown that Geogebra, in its version for personal computers, has been effective for the teaching-learning of mathematics [61,62,63,64,65], improving the understanding of abstract concepts and enabling their correlation through a meaningful and effective learning experience.
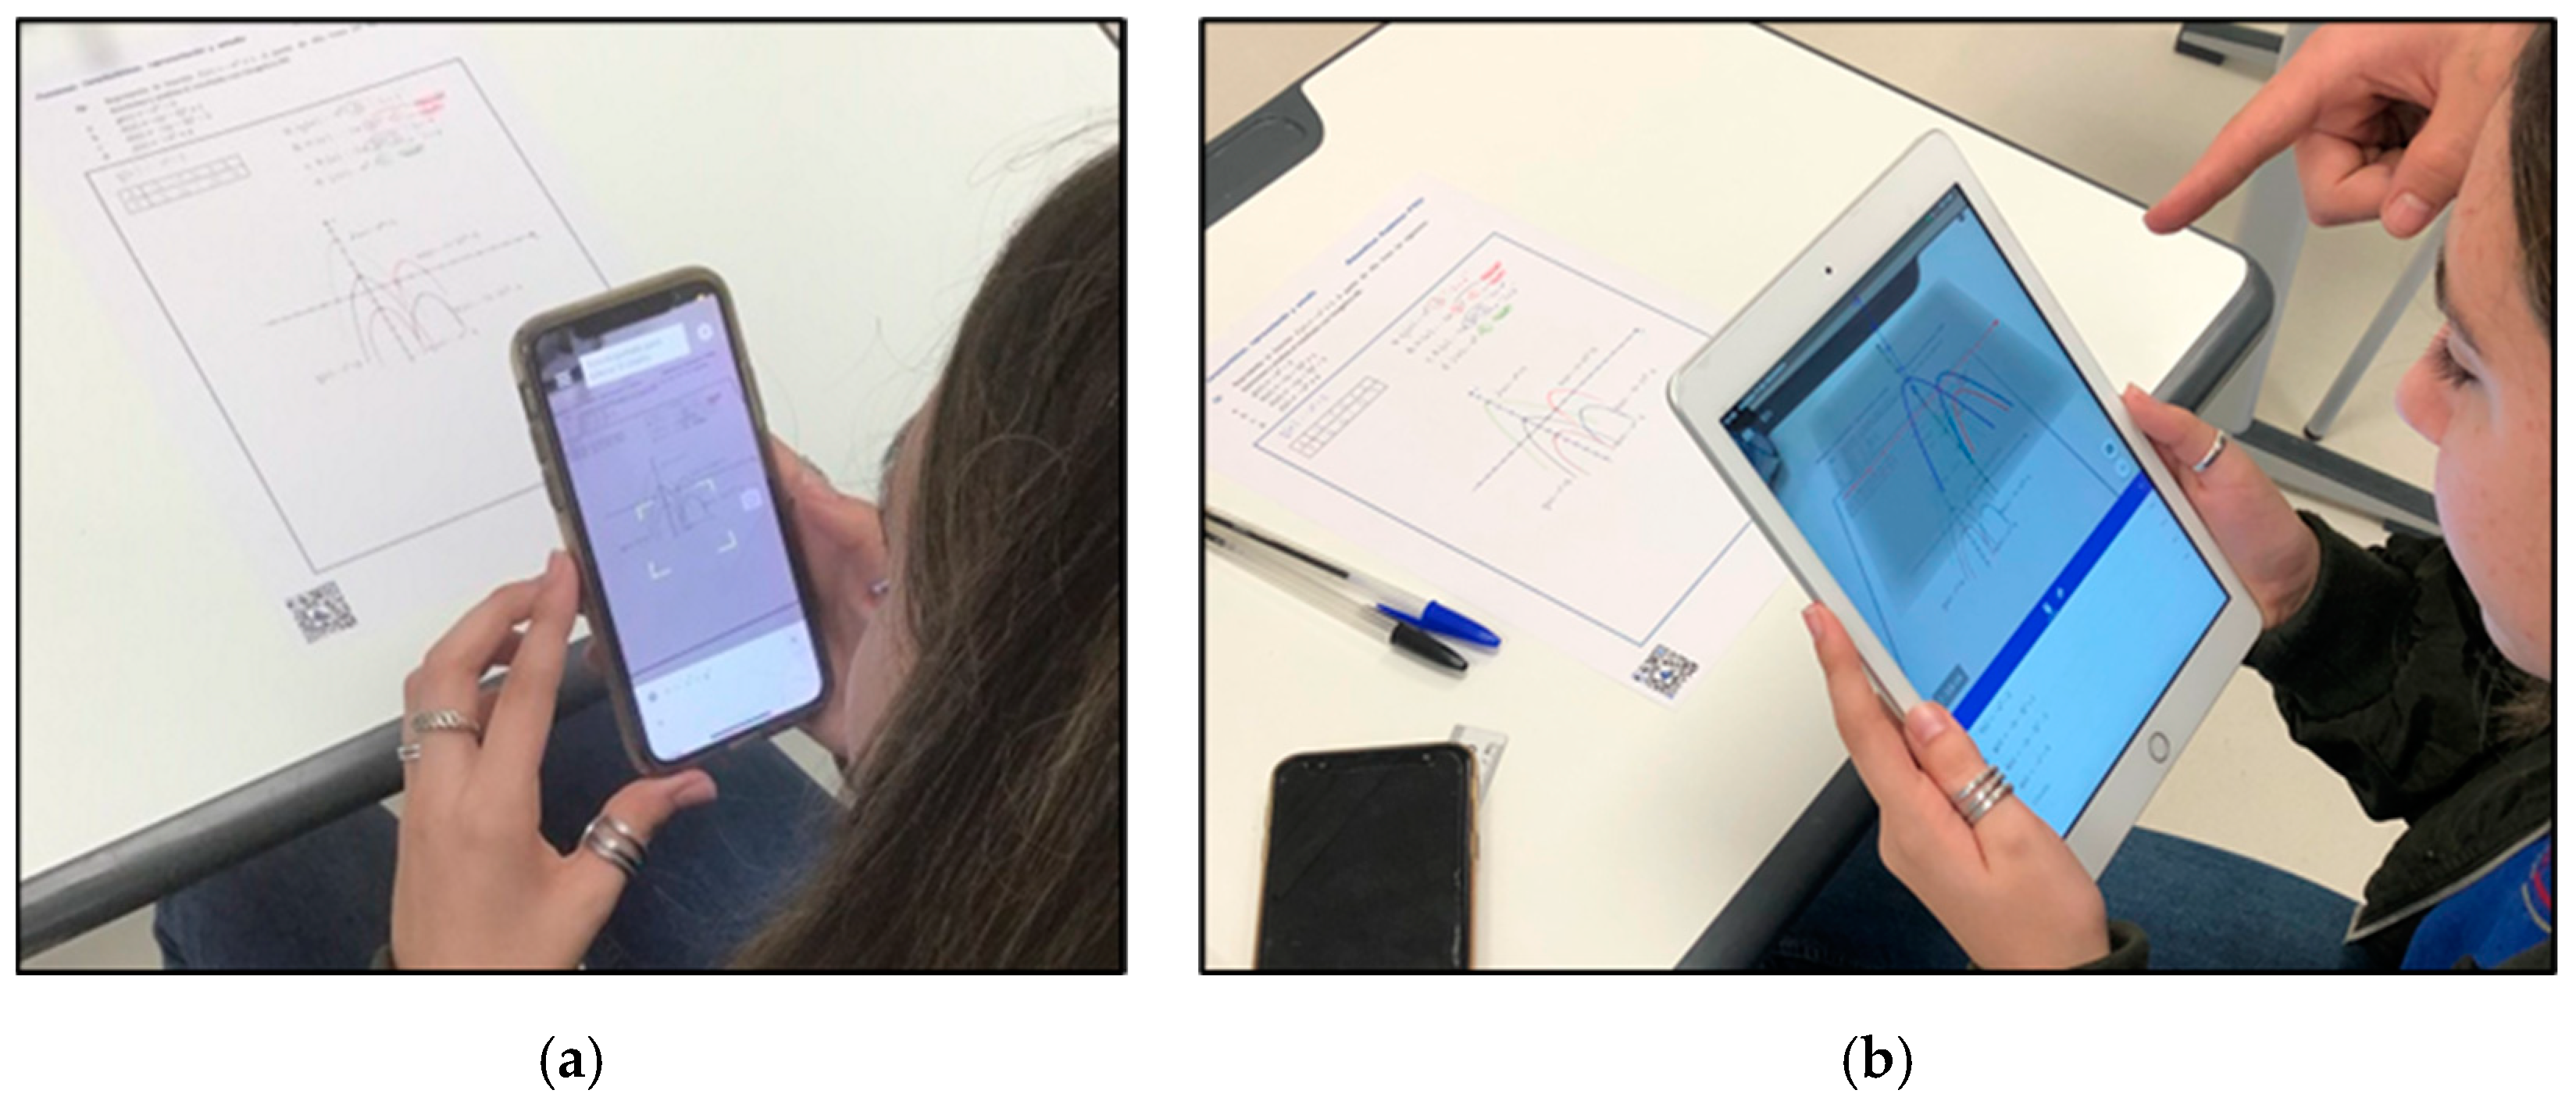
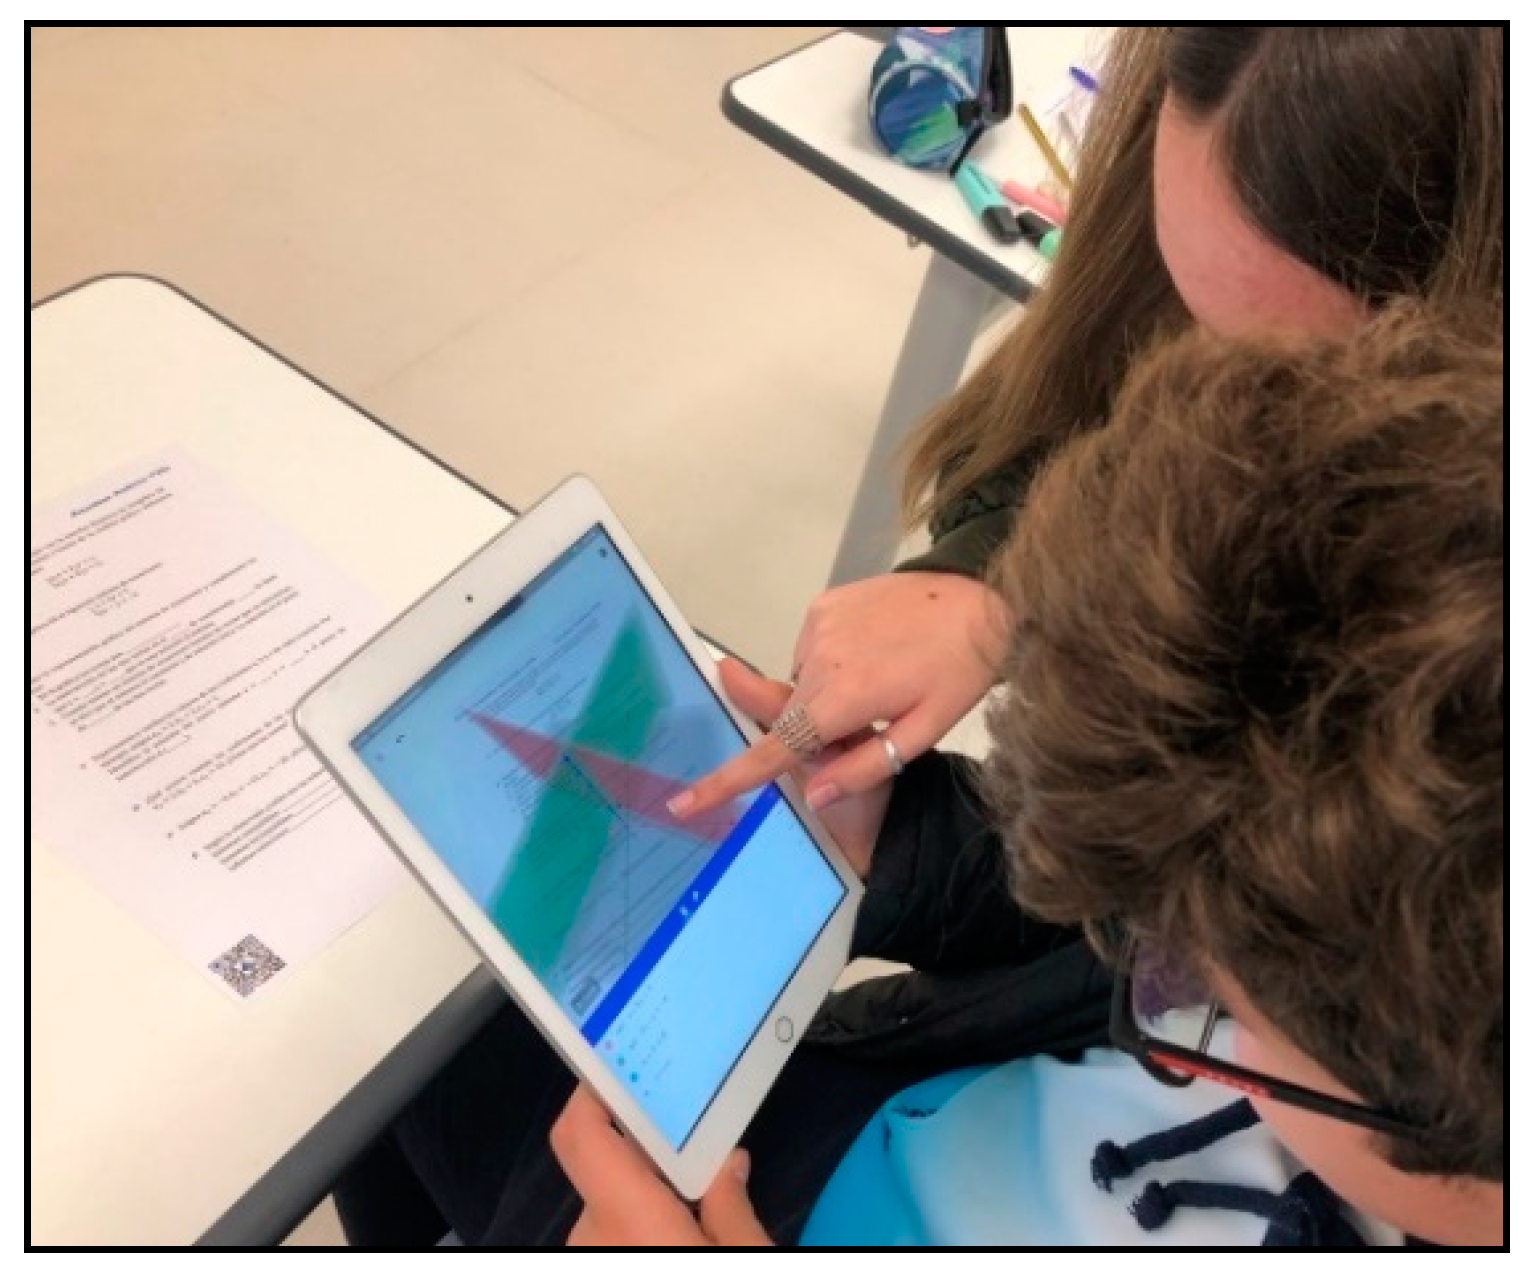
In its AR version, it allows us to generate 3D objects and mathematical functions, which we can place on an imaginary plane in our real environment (Figure 1a) and then experiment with them in a tangible way, being able to visualize and rotate them with total freedom, which helps to improve the understanding of the function itself through manipulative learning. The user interface of the Geogebra AR application is direct and intuitive. At the bottom of the screen, it includes a section where we can introduce the algebraic expressions of our naturally defined functions, as they appear in the textbooks or as they are written by the teacher on the blackboard, through a virtual keyboard incorporated in the mobile device, generating immediately the graphic representations of the introduced functions (Figure 1b).
Through the application menu, located in the upper left corner, we can search and open existing resources, save and share our work, as well as make changes to the program settings (hide or show axes, change the coordinate grid, distances between axes, hide or show descriptions or labels, etc.).
The application design promotes the learning and analysis of mathematical functions, not only generating them in AR, but also emphasizing the cognitive-visual process that occurs when an object is built in space. In particular, introducing the algebraic expression of defined functions, representing them in space and interacting with them in AR, is a major cognitive step in the transition from algebraic expression, through 2D linear designs, to the 3D object representation that covers the five fundamental skills of Maier’s spatial intelligence [14].

2. Materials and Methods

2.1. Researh Design

The research approach adapted for this study is based on a quasi-experimental design. Two pre-test/post-test models were applied to each of the two ordinary class groups, formed by students who do not have any type of special educational need, that participated in the study: One to assess the level of spatial ability and the other to determine the level of learning of mathematical functions. The experimental group underwent a contextualized methodology that integrated the binomial RA-mobile devices for the use of the Geogebra AR application in the study of mathematical functions, while in the control group, a traditional teaching-learning methodology was used. At the end of the experience, the experimental group completed a questionnaire in order to obtain the students’ perceptions after using Geogebra AR.

2.2. Researh Objectives

The research question posed is whether there is a significant difference between students who use the application of Geogebra AR in a contextualized methodological environment and those who use traditional teaching-learning methods with regard to their spatial intelligence and the level of learning acquired. In order to assess the scope of these research objectives, the following hypotheses are established:
-
H0 (null hypothesis): There is no statistically significant difference in the performance and spatial intelligence scores of students exposed to the Geogebra AR application and those not exposed to it;
-
H1 (alternative hypothesis): There is a statistically significant difference in the performance and spatial intelligence scores of students exposed to the Geogebra AR application and those not exposed to it.

2.3. Sample

The total number of participants was 48 students, who were taking the subject Academic Mathematics in their 4th year of ESO, taught by one of the teachers who conducted this study. Out of the total number of participants, the 47.92% (f = 23) belonged to the experimental group and 52.08% (f = 25) belonged to the control group, presenting no significant curricular adaptations. The sample used in the research is non-probabilistic and, as a consequence, the results cannot be generalized with statistical precision [66].

2.4. Data Collection Instrument

The study uses three different instruments to collect information: A pre-test/post-test model to evaluate spatial intelligence, a second pre-test/post-test model, which is a written test to detect previous knowledge, and another one to evaluate the learning standards of the functions block within the curriculum of the subject Academic Mathematics in the 4th year of ESO. Finally, the students were given a questionnaire to detect the motivation levels of the experimental group.
There are several standardized tests to measure a person’s ability in the first two stages of spatial development. For our study the Purdue Spatial Visualization Test: Rotations (PSVT:R) has been used because of its design to evaluate a person’s ability in the second stage of spatial development [67]. Figure 2 presents a random question extracted from the PSVT:R test. This 12-item test has been used as an evaluation instrument at the beginning and end of the experience in the experimental and control group, with the aim of identifying the level of visualization and spatial rotation that the students started from, and to evaluate the impact on the spatial intelligence of the students through the experience in the classroom with the Geogebra AR application, as an aid for the analysis and study of mathematical functions.
Likewise, and in the perspective of evaluating the learning of mathematical functions within the block of contents of functions in the curriculum of Academic Mathematics in the 4th year of ESO in Spain established by the Royal Decree 1105/2014 [68], an individual written test of detection of an initial assessment of knowledge and another final assessment test made up of 8 items that includes the evaluable learning standards were used as data collection instruments, having been both instruments designed by the authors of the study.
After the final test, the experimental group carried out a 10-item Likert scale questionnaire with 6 answer options so as to identify the feasibility, motivation, and students’ perception of the experience, thus evaluating the AR enriched learning environment. The questionnaire focused mainly on determining the following aspects:
  • The use of AR technology in the teaching-learning process;
  • The contribution of AR tools for a better visualization of the contents;
  • Impact of AR technology on the degree of motivation;
  • The difficulty of using the Geogebra AR application.
Finally, the reliability of the evaluation instruments designed by the authors of the research (written test and Likert questionnaire) is established by means of Cronbach’s internal consistency coefficient α [69], considered by several researchers to be one of the most appropriate statistical methods to obtain quality values [51,70,71]. Table 1 shows that the internal consistency reliability indexes are adjusted to a high level for each one of the scales that constitute the evaluation instruments elaborated.
Once the data from the PSVT:R test and the individual written test were collected, they were analyzed using descriptive and inferential statistics. The descriptive statistics are composed of the mean obtained from the pre-test and post-test results, the standard deviation, the range, etc. On the other hand, for inferential statistics, a student t-test with a 5% confidence level is used along with a bilateral test to test the study hypothesis.

2.5. Learning Experience

In May 2019, the classroom experience was carried out with 4th year ESO Academic Mathematics students, distributed in 12 class sessions within a three-week period. The objective of this trial was to determine the scope and limitations of integrating the mobile device in the classroom with the Geogebra AR application (Figure 3), as a support for the analysis and study of mathematical functions, in addition to checking its impact on the spatial intelligence of the students.
The learning standards that are evaluated within the block of content of functions of the curriculum of the subject of Academic Mathematics in the 4th of ESO in Spain, established by Royal Decree 1105/2014, explicitly indicates that students must explain and graphically represent the relationship model between two magnitudes for cases of linear, quadratic, inverse proportionality, exponential, and logarithmic relationship, using technological means, if necessary. This makes it flexible enough to allow the introduction of other teaching methods such as approaches based on new technologies, in our case Geogebra AR, which facilitates the exploration, representation, and analysis of functions among other things. Therefore, by integrating Geogebra AR as a support to the teaching-learning of functions, students can explore and develop cognitive schemes that allow them not only to draw graphs of functions, but also to enhance proactive self-learning by achieving a progression in the development of analysis, application, reflection, and interpretation of knowledge.

2.6. Generated Material

To carry out the experience in the classroom, worksheets were generated, integrating the mobile device as a platform for access to classroom learning through the application Geogebra AR in order to solve the proposed activities. In relation to the above, it should be noted that the teachers do not necessarily have to follow the textbook, but they can create their own work material, in this case cards linked to objects in AR. In order to do this, teachers must have enough knowledge. In this sense, some authors design their own activity cards or OER work materials in what they call “production of augmented materials” which is generally systematic and sequential, adapting to the learning rhythm and needs of each user [12].
The collection of contents generated deals with aspects such as the representation, study, and analysis of functions such as: Constant, affine, linear, quadratic, absolute value, inverse proportionality, exponential, logarithmic, and trigonometric. These materials were used in paper format (Figure 4), so that the students could solve the activities in written form while superimposing in the work card the graphic representations in AR generated by Geogebra AR. A QR code was located at the bottom of each worksheet, giving access to downloading the application.
In this way, students interact directly with the object of study with total freedom of spatial exploration, rotating or flipping the representations to visualize the function in total detail and from any perspective. It is important to emphasize that the activities that are part of the collection of exercises are not far from a traditional teaching methodological framework of mathematical functions, which gives a great advantage when integrating technological AR tools as Geogebra AR.
Although students had never used interactive mathematical software in AR as a teaching tool before, Geogebra AR’s smooth learning curve allowed us to design a classroom experience with a discovery-based learning format. Therefore, instead of dedicating teaching sessions to explain the operation, tools, or elements of the program interface, a routine was established in the classroom based on brief instructions and directed activities through proactive and tangible learning that made students gradually master the software according to the demands of each activity, their needs, and inquiry. As in the development of any other training unit, students were assigned tasks to perform outside school hours. The use of the binomial RA-mobile devices allows students to access information regardless of where they are, thus combining classroom work with online work, which results in an educational model closer to the needs of new generations known as b-learning [72]. This has a greater significance nowadays due to the change of paradigm that the educational system is facing in times of Covid-19, and due to the leading and essential role that technologies have taken, we are facing a scenario in which we must help strengthen self-learning and autonomy in students, as well as motivate them to help capture their interest and enhance their desire to investigate [73].

3. Results

During the execution of the experience it was observed in the experimental group that, firstly, the students quickly learned to generate graphic functions through the application as an alternative to the traditional system of representation. Secondly, students learned to visualize and analyze graphical solutions as an alternative to algebraic solutions. Thirdly, students moved from conceiving a graph as a collection of isolated points, to thinking of a graph as an entity, which caused them to begin doing comprehensive studies and analysis of function behavior. Fourthly, students understood the conceptualization of a function and understood the relationship of variables over them. Fifthly, it was detected that the students experimented freely and autonomously with the Geogebra AR application and contributed to the rest of the group with their perception of the operations carried out. It should be noted that these interpretations were typical of students from higher education levels.
Finally, one of the findings observed in the experimental group is that students related the different solutions between the systems of equations through their graphic representations. This shows us that students are able to visualize and identify a point or a line of intersection in a graph as a solution to a system of equations (Figure 5).

3.1. Analysis of the Variation in the Teaching-Learning of Mathematical Functions

The descriptive statistical results of the initial knowledge assessment test within the function content block for both the experimental and the control group are shown in Table 2.
The experimental group with 23 participants obtained a mean score in the initial evaluation test of 5.7478, while the control group obtained a mean score of 6.0921. A t-test for independent samples was carried out to determine if there was a significant difference between the mean score of the two groups in the initial assessment test with a level of reliability of 5%. These results are shown in Table 3.
According to the results of Table 3, the Levene test has a value of 0.818, which is higher than 0.05, therefore assuming that the group variations are equal. The value of the test for bilaterality for the experimental and control group is 0.448 for both cases, which implies that the difference in measurements is not statistically significant at a probability of 0.05. The results show that there is no statistically significant difference (p > 0.05) between the mean value of the two groups based on the results of the initial evaluation test. This statistically indicates that students in both groups had similar performance levels at the beginning of the research. Therefore, any difference in performance observed later can be attributed to the use of the Geogebra AR application.
Table 4 compares the descriptive statistics of both groups according to the results obtained by the students in the final assessment test that collects the evaluable learning standards. The experimental group obtained a mean score in the final test of 7.3391, a standard deviation of 1.61125, and a mean error of 0.33597. On the other hand, the mean score of the control group was 6.0841, the standard deviation was 1.52334, and the mean error was 0.30467. The mean score obtained in the final evaluation test by the students of the experimental group is significantly higher than that of the control group.
The results obtained from the t-test for independent samples are shown in Table 5. The statistic of the Levene test is 0.034, which is less than 0.05 and therefore, it is not assumed that the group variations are equal with respect to the results obtained in the final knowledge evaluation test. The bilateral value is less than 0.05, which implies that the difference in means is statistically significant at a level of 0.05. These results indicate that the students of the experimental group achieved higher scores than the students of the control group. Therefore, according to the results of the t-test, we can reject the null hypothesis (there is no statistically significant difference in the performance scores of the students exposed to the Geogebra AR application and those who are not exposed to it) in favor of the alternative hypothesis (there is a statistically significant difference in the performance scores of the students exposed to the Geogebra AR application and those who are not exposed to it).
After analyzing the existence of a relationship between the groups, it is worth asking the intensity of their relationship, for which we use the mean of the effect size in ANOVA. The results of this test are shown in Table 6, where it can be observed that 20.4% of the variation in the teaching-learning of student functions can be attributed to the use of the Geogebra AR application.

3.2. Analysis of the Variation of Visualization and Spatial Rotation Skills

In the same way, an analysis using descriptive statistics and the t-test of the pre-test and post-test PSVT:R was carried out in order to find out if there were any significant differences. By doing so, the impact of the Geogebra AR application is evaluated with the aim of improving the capacity of visualization and spatial rotation of the students.
The descriptive statistical analysis of the pre-test based on the PSVT:R model for the experimental and control groups is shown in Table 7. The participants in the experimental and control groups obtained a mean score of 4.9643 and 5.3332, respectively.
A t-test for independent samples was conducted so as to determine if there was any significant difference between the mean score of the two groups of the pre-test based on the PSVT:R model with a 5% confidence level, the results are shown in Table 8. The Levene test had a value of 0.137 which, being higher than 0.05, means that the group variations are equal. The result of the bilaterality test was 0.425 for equal variances and 0.422 for different variances, so the difference in the means is not statistically significant with a probability of 0.05. Along with the results of the t-test carried out with the scores of the initial evaluation test, it was detected that the groups had a similar level of spatial intelligence at the beginning of the investigation. In this case, any difference detected later in terms of the improvement of the students’ visualization and spatial rotation skills can be attributed to the integration of the Geogebra AR application in the classroom methodology.
Table 9 shows the results of the descriptive statistical analysis according to the scores obtained in the PSVT:R post-test for the two groups. The experimental group obtained a mean score in the post-test of 7.0652, a standard deviation of 1.60574, and a mean error of 0.33482. On the other hand, the mean of the control group was 5.6664, the standard deviation was 1.73463, and the mean error was 0.34693. It should be noted that the mean score obtained by the experimental group in the PSVT:R post-test was significantly higher than that of the control group.
The results obtained from the t-test for independent samples in relation to the scores obtained from the two groups in the PSVT:R post-test are shown in Table 10. The value of the Lenvene test is 0.029, which is lower than 0.05, so it is detected that the group variations are not equal. The bilateral test has a value of less than 0.05, implying that the difference in means is statistically significant at a probability of 0.05. For the results obtained in the t-test in relation to the scores obtained in the final written test, the students of the experimental group reached higher scores in the PSVT:R test than the students of the control group, therefore, according to the results of the t-test, the null hypothesis (there is no statistically significant difference in the level of spatial intelligence of the students exposed to the Geogebra AR application and those not exposed to it) was rejected in favor of the alternative hypothesis (there is a statistically significant difference in the level of spatial intelligence of the students exposed to the Geogebra AR application and those not exposed to it) with respect to the improvement of the students’ visualization and spatial rotation skills.
In addition, Table 11 shows the impact of the Geogebra AR application in the obtained scores, which shows that 21.3% of the improvement of the visualization and spatial rotation skills can be attributed to the integration of the Geogebra AR application in the classroom methodology.

3.3. Descriptive Analysis of the Evaluation Questionnaire

Finally, Table 12 presents the results obtained in relation to the data obtained from the Likert scale questionnaire in order to determine the motivation, feasibility, and perception of students in relation to the experience with AR technology. A total of 52.17% of students agreed to use AR resources for content learning and 65.21% believe that AR tools have helped improve their visualization and spatial rotation skills. It is noteworthy that virtually all students report having worked with great motivation and interest, and the vast majority of them confirm the ease of use of the application Geogebra AR.

4. Discussion

The results of the final evaluation test and the post-test demonstrate that there is a statistically significant difference in the level of achievement reached by students in the experimental group compared to those in the control group. From the findings of the study, it is evident that students who were exposed to a learning methodology with Geogebra AR (the experimental group) obtained better results both in the level of learning achieved in the formative unit functions and in their visualization and spatial rotation skills, compared to those students who were not exposed to learning supported by AR tools (the control group). Therefore, this finding suggests that the use of the Geogebra AR application as a support in the process of teaching and learning mathematical functions improved the academic performance and spatial intelligence of the students. This finding is related to the findings of Kaufmann and Schmalstieg [22] and del Cerro and Morales [12] about the effectiveness of AR tools in the teaching-learning processes in STEM knowledge areas and, especially, in all subjects where spatial intelligence is fundamental for the development of learning. In addition, the results of this study coincide with those obtained by Hohanwarter [74], who through the use of graphic software improved student performance in the study of functions. Likewise, the findings of this study also coincide with previous research where the software Geogebra was used in its version for personal computers with the objective of improving learning results in the subject of mathematics [61,75,76].
The students in the experimental group were exposed to a not yet fully established educational technology, which most likely captured their attention and interest during the lessons in which it was incorporated into classroom methodology. The interactive and dynamic nature of Geogebra AR allowed students in the experimental group to represent, visualize, rotate, analyze, and compare graphs of mathematical functions with ease. This allowed students to better understand the concept of function, identifying a greater number of characteristics of the function in relation to its form than the control group. In addition, the integration of this technology managed to enhance the proactive learning of students, as well as awakening their inquiry and need to know more. The students of the experimental group had the possibility to verify and evaluate the correction and accuracy of the results of their exercises in an autonomous way through Geogebra AR. Similarly, the experimental group was able to draw and analyze several graphs at the same time without having to perform algebraic calculations, tables of values, or draw by hand each one of them through the application, Geogebra AR. This, in general, made them complete the proposed activities in class in a shorter time than the control group, a factor that may have contributed to the deepening of contents and the higher score in the final written test than the one obtained by the control group.
For all these reasons, it is recommended that teachers integrate tools such as Geogebra AR as support in the resolution of activities for teaching mathematical functions, since it has proven to be effective in improving learning by reducing the effort of students in the tedious task of drawing functions manually, allowing them to focus on other more relevant elements, such as exploring and analyzing them.
Before the study, we discovered that not many ESO students could manipulate and use mathematical software effectively due to their lack of training, but this was not the case with Geogebra AR, in which most students excelled in its intuitive and simple operation, obtaining great results.
The integration of tangible tools such as Geogebra AR in a classroom changes the role of teachers, relocating them as a permanent guide that gives students more freedom and autonomy, as well as encouraging critical and creative thinking, instead of just being a transmitter of knowledge.
As authors, we can assert that the process of integrating Geogebra AR into classroom methodology has been simple and satisfactory. However it must be taken into account that educators must be well trained in the use and integration of ICT, such as mobile devices [77] and AR, in the teaching-learning processes. In this sense, if they are applied in an adequate way and always within a contextualized methodology, it can be very useful in not only facilitating teaching-learning processes, but also making them more interactive, motivating, and interesting [26].

5. Conclusions

Our study explicitly sought to transform the teaching-learning processes of mathematics, with the purpose of promoting mathematical skills linked to spatial intelligence, instead of focusing only on learning specific mathematical content. The integration of Geogebra AR through a contextualized methodology in the teaching-learning process of mathematical functions meant a significant difference in the levels of academic achievement and spatial intelligence of the students exposed to it [12,26]. The results also showed that the students had a positive perspective on the use of the application which managed to capture their attention and increase their motivation from the beginning.
AR technology has come to transform the concept of what, until now, was not possible to implement in the subject of mathematics, allowing efficient and effective learning experiences in the classroom, which must be accompanied by appropriate resources and methods to deepen and stimulate the skills of students [29]. The study evaluates the academic and cognitive achievement of students through the scores obtained in each of the tests and addresses other factors, such as motivation, which have influenced students to obtain this performance. Therefore, we can say that the value of any technology integrated in the classroom depends largely on the level of student engagement.
Lastly, Geogebra AR has proven to be an effective tool in teaching mathematical functions and improving students’ spatial intelligence. Therefore, we recommend that teachers integrate this software in the development of learning activities, which can also be adapted for the development of other concepts, with other curricula at different teaching levels. Therefore, its relevance in the field of mathematics covers a wide range of possible uses.
This study was developed around the subject Academic Mathematics of the 4th year of ESO in order to investigate the effect of integrating Geogebra AR in the teaching-learning of functions. Given the scope and potential of the models learned in an interconnected and ubiquitous environment not yet established, the conclusions drawn from this work should be taken with prudence [78]. Therefore, the generalization of the results of this study to other content and levels of mathematical education should be made with caution.
Our findings can be used as a starting point for future research. For example, studies can be carried out to analyze the impact of the Geogebra AR application through mobile devices as part of the learning of mathematics in different situations and contexts inside and outside the classroom (b-learning). This includes integrating our study to the current educational context to effectively stimulate self-learning, improve levels of attention, and motivate students through the paradigm shift caused by the Covid-19 pandemic.
Finally, we recommend that future studies perform qualitative meta-analyses to assess educators’ perceptions towards the use and integration of emerging ICTs, such as AR, in the teaching of STEM areas.

Author Contributions

Conceptualization, F.d.C.V. and G.M.M.; methodology, F.d.C.V. and G.M.M.; software, G.M.M.; validation, F.d.C.V. and G.M.M.; formal analysis, F.d.C.V.; investigation, F.d.C.V. and G.M.M.; data curation, F.d.C.V. and G.M.M.; writing—original draft preparation, F.d.C.V. and G.M.M.; writing—review and editing, F.d.C.V. and G.M.M. All authors have read and agreed to the published version of the manuscript.

Funding

This research received no external funding.

Institutional Review Board Statement

The study was conducted according to the guidelines of the Declaration of Helsinki.

Informed Consent Statement

Informed consent was obtained from all subjects involved in the study.

Data Availability Statement

The data are not publicly available due to privacy restrictions.

Acknowledgments

To the teachers, students, and institutions involved.

Conflicts of Interest

The authors declare no conflict of interest.

References

  1. Pierce, R. Linear functions and a triple influence-f teaching-n the development-f students algebraic expectation. Int. Group Psychol. Math. Educ. 2005, 4, 81–88. [Google Scholar]
  2. Means, B.; Haertel, G.D. Using Technology Evaluation to Enhance Student Learning; Teachers College Press: New York, NY, USA, 2004. [Google Scholar]
  3. Thambi, N.; Eu, L.K. Effect of students’ achievement in-ractions using GeoGebra. SAINSAB 2013, 16, 97–106. [Google Scholar]
  4. Fuentes-Cabrera, A.; Parra-González, M.E.; López-Belmonte, J.; Segura-Robles, A. Learning mathematics with emerging methodologies—The Escape room as a case study. Mathematics 2020, 8, 1586. [Google Scholar] [CrossRef]
  5. Sanz, M.T.; López-Iñesta, E.; Garcia-Costa, D.; Grimaldo, F. Measuring arithmetic word problem complexity through heading-omprehension and learning analytics. Mathematics 2020, 8, 1556. [Google Scholar] [CrossRef]
  6. Valovičová, L.; Ondruška, J.; Zelenický, L.; Chytrý, V.; Medová, J. Enhancing computational thinking through interdisciplinary STEAM activities using tablets. Mathematics 2020, 8, 2128. [Google Scholar] [CrossRef]
  7. Moschkovich, J.; Schoenfeld, A.H.; Arcavi, A. Aspects of understanding: On multiple perspectives and representations of linear-elations and connections among them. Integrat. Res. Graph. Represent. Funct. 1993, 90, 69–100. [Google Scholar]
  8. Yerushalmy, M.; Schwartz, J.L. Seizing the-pportunity to make algebra mathematically and pedagogically interesting. In Integrating Research on the Graphical representation Functions; Omberg, T.A., Fennema, E., Arpenter, T., Eds.; Lawrence Erlbaum: Hillsdale, NJ, USA, 1993; pp. 41–68. [Google Scholar]
  9. Knuth, E.J. Student understanding of the Cartesian connection: An exploratory study. J. Res. Math. Educ. 2000, 31, 500–507. [Google Scholar] [CrossRef]
  10. Bishop, J.E. Developing students’ spatial ability. Sci. Teach. 1978, 45, 20–23. [Google Scholar]
  11. Gardner, H. Frames of Mind: The Theory of Multiple Intelligences; Hachette: New York, NY, USA, 1983. [Google Scholar]
  12. Del Cerro, F.; Morales, G. Realidad Aumentada como herramienta de mejora de la inteligencia espacial en estudiantes de educación secundaria. Revista Educación Distancia (RED) 2017, 17, 298831. [Google Scholar]
  13. Del Cerro, F.; Lozano, F. Proyecto Técnico Ecourbano apoyado en las TIC para el aprendizaje STEM (Dibujo Técnico) y la consolidación de los ODS en el aula. Revista Educación Distancia (RED) 2019, 19. [Google Scholar] [CrossRef] [Green Version]
  14. Maier, P.H. Räumliches Vorstellungsvermögen: Komponenten, geschlechtsspezifische Differenzen, Relevanz, Entwicklung und Realisierung in der Realschule; Lang: Bern, Switzerland, 1994. [Google Scholar]
  15. Linn, M.C.; Petersen, A.C. Emergence and characterization of sex differences in spatial ability: A meta-analysis. Child Dev. 1985, 56, 1479–1498. [Google Scholar] [CrossRef] [PubMed]
  16. Gutiérrez, A. Visualization in 3-dimensional geometry: In search of a framework. In Proceedings of the 20th PME International Conference, Valencia, Spain, 8–12 July 1996; pp. 3–19. [Google Scholar]
  17. Carajaville, J.; Fernández, T.; Godino, J. Configuraciones epistémicas y cognitivas en tareas de visualización y razonamiento espacial. In Investgación en Educación Matemáticas. X Simposio de la SEIEM; Bolea, P., Camacho, M., Flores, P., Gómez, B., Murillo, J., González, M., Eds.; SEIEM: Huesca, 2006; pp. 7–26. [Google Scholar]
  18. Shepard, R.N.; Metzler, J. Mental rotation of three-dimensional objects. Science 1971, 191, 701–703. [Google Scholar] [CrossRef] [PubMed] [Green Version]
  19. Gibson, J.J. The Perception of the Visual World; Houghton Mifflin: Oxford, UK, 1950. [Google Scholar]
  20. Freeman, J. The modelling of spatial relations. Comput. Graph. Image Process. 1975, 4, 156–171. [Google Scholar] [CrossRef]
  21. Oitzl, M.S.; De Kloet, E.R. Selective corticosteroid antagonists modulate specific aspects of spatial orientation learning. Behav. Neurosci. 1992, 106, 62. [Google Scholar] [CrossRef]
  22. Park, J.; Carter, G.; Butler, S.; Slykhuis, D.; Reid-Griffin, A. Re-dimensional thinking in earth science: From 3-d virtual reality panoramas to 2-d contour maps. J. Interact. Learn. Res. 2008, 19, 75–90. [Google Scholar]
  23. Samsudin, K.; Rafi, A.; Hanif, A.S. Training in mental rotation and spatial visualization and its impact on orthographic drawing performance. J. Educ. Technol. Soc. 2011, 14, 179–186. [Google Scholar]
  24. Chen, Y.C.; Chi, H.L.; Hung, W.H.; Kang, S.C. Use of tangible and augmented reality models in engineering graphics courses. J. Prof. Issues Eng. Educ. Pr. 2011, 137, 267–276. [Google Scholar] [CrossRef]
  25. Kaufmann, H.; Schmalstieg, D. Mathematics and geometry education with collaborative augmented reality. In Proceedings of the ACM SIGGRAPH, Online. 17–28 August 2020; pp. 37–41. [Google Scholar]
  26. Del Cerro, F.; Morales, G. Augmented reality and mobile devices: A binominal methodological resource for inclusive education (SDG 4). An example in secondary education. Sustainability 2018, 10, 3446. [Google Scholar] [CrossRef] [Green Version]
  27. Fernández, F.; Hinojo, F.; Aznar, I. Las actitudes de los docentes hacia la formación en Tecnologías de la Información y Comunicación (TIC) aplicadas a la educación. Contextos Educ. 2002, 5, 253–270. [Google Scholar]
  28. Molina, I.; Martínez, L.; López, G. Utilización de la realidad aumentada en el trabajo de campo geográfico: Posibilidades y dificultades para su uso docente. In La Investigación e Innovación en la Enseñanza de la Geografía; Universidad de Alicante: San Vicente del Raspeig, Spain, 2016; pp. 641–657. [Google Scholar]
  29. Cabero, J.; Fernández, B. Las tecnologías digitales emergentes entran en la Universidad: RA y RV. RIED 2018, 21, 119–138. [Google Scholar] [CrossRef] [Green Version]
  30. García, I.; Peña, I.; Johnson, L.; Smith, R.; Levine, A.; Haywood, K. Informe Horizon: Edición Iberoamericana 2010; The New Media Consortium: Austin, TX, USA, 2010. [Google Scholar]
  31. Johnson, L.; Adams, S.; Cummins, M. The NMC Horizon Report: 2012 Higher Education Edition; The New Media Consortium: Austin, TX, USA, 2012. [Google Scholar]
  32. Johnson, L.; Adams Becker, S.; Cummins, M.; Estrada, V.; Freeman, A.; Ludgate, H. Technology Outlook for Australian Tertiary Education 2013–2018: An NMC Horizon Project Regional Analysis; The New Media Consortium: Austin, TX, USA, 2013. [Google Scholar]
  33. Johnson, L.; Adams Becker, S.; Cummins, M.; Estrada, V.; Freeman, A.; Ludgate, H. NMC Horizon Report: 2013 K-12 Edition; The New Media Consortium: Austin, TX, USA, 2013. [Google Scholar]
  34. Johnson, L.; Adams Becker, S.; Cummins, M.; Estrada, V.; Freeman, A.; Ludgate, H. NMC Horizon Report: 2013 Higher Education Edition; The New Media Consortium: Austin, TX, USA, 2013. [Google Scholar]
  35. Johnson, L.; Adams Becker, S.; Gago, D.; García, E.; Martín, S. NMC Perspectivas tecnológicas: Educación Superior en América Latina 2013–2018; The New Media Consortium: Austin, TX, USA, 2013. [Google Scholar]
  36. Hoic-Bozic, N.; Mornar, V.; Boticki, I. A blended learning approach to course design and implementation. IEEE Trans. Educ. 2008, 52, 19–30. [Google Scholar] [CrossRef]
  37. Garzón, E.; Sola, T.; Ortega, J.L.; Marín, J.A.; Gómez, G. Teacher training in lifelong learning—The importance of digital competence in the encouragement of teaching innovation. Sustainability 2020, 12, 2852. [Google Scholar] [CrossRef] [Green Version]
  38. Vigotsky, L.S. Thought and Language; MIT Press: Cambridge, UK, 1978. [Google Scholar]
  39. Estebanell, M. Interactividad e interacción. Revista Interuniversitaria de Tecnología Educativa 2002, 1, 15–25. [Google Scholar]
  40. Vian, K. Blended Reality: Superstructing Reality, Superstructing Selves. Available online: http://www.iftf.org/node/2598 (accessed on 25 November 2020).
  41. Doerr, H.M.; Zangor, R. Creating Meaning for and with the Graphing Calculator. Educ. Stud. Math. 2000, 41, 143–163. [Google Scholar] [CrossRef]
  42. Yerushalmy, M. Slower algebra students meet faster tools: Solving algebra word problems with graphing software. J. Res. Math. Educ. 2006, 36, 356–387. [Google Scholar]
  43. Hutchins, E.; Hollan, J.; Norman, D. Direct manipulation interfaces. Hum. Comput. Inter. 1985, 1, 311–338. [Google Scholar] [CrossRef]
  44. Dunleavy, M.; Dede, C.; Mitchell, R. Affordances and limitations of immersive participatory augmented reality simulations for teaching and learning. J. Sci. Educ. Technol. 2009, 18, 7–22. [Google Scholar] [CrossRef]
  45. Choi, B.; Baek, Y. Exploring factors of media characteristic influencing flow in learning through virtual worlds. Comp. Educ. 2011, 57, 2382–2394. [Google Scholar] [CrossRef] [Green Version]
  46. Bressler, D.M.; Bodzin, A.M. A mixed methods assessment of students’ flow experiences during a mobile augmented reality science game. J. Comput. Assist. Learn. 2013, 29, 505–517. [Google Scholar] [CrossRef]
  47. Kamarainen, A.; Metcalf, S.; Grotzer, T.; Browne, A.; Mazzuca, D.; Tutwiler, M.; Dede, C. EcoMOBILE: Integrating augmented reality and probeware with environmental education field trips. Comput. Educ. 2013, 68, 545–556. [Google Scholar] [CrossRef] [Green Version]
  48. Di Serio, A.; Blanca, M.; Delgado, C. Impact of an augmented reality system on students’ motivation for a visual art course. Comput. Educ. 2013, 68, 586–596. [Google Scholar] [CrossRef] [Green Version]
  49. Cózar, R.; De Moya, M.; Hernández, J.; Hernández, J. Tecnologías emergentes para la enseñanza de las Ciencias Sociales—Una experiencia con el uso de Realidad Aumentada en la formación inicial de maestros. Dig. Educ. Rev. 2015, 27, 138–153. [Google Scholar]
  50. Meža, S.; Turk, Ž.; Dolenc, M. Measuring the potential of augmented reality in civil engineering. Adv. Eng. Softw. 2015, 90, 1–10. [Google Scholar] [CrossRef]
  51. Cabero, J.; Fernández, B.; Marín, V. Dispositivos móviles y realidad aumentada en el aprendizaje del alumnado universitario. RIED 2017, 20, 167–185. [Google Scholar] [CrossRef] [Green Version]
  52. Pérez, S.M.; Robles, B.F. Objetos de Realidad Aumentada: Percepciones del alumnado de Pedagogía. Píxel Bit Revista Medios Educación 2018, 53, 207–220. [Google Scholar] [CrossRef]
  53. Campos, N.; Ramos, M.; Moreno, A.J. Virtual reality and motivation in the educational context: Bibliometric study of the last twenty years from Scopus. Alteridad Revista Educación 2020, 15, 47–60. [Google Scholar]
  54. Fombona, J.; Pascual, M.J.; Madeira, M.F. Realidad aumentada, una evolución de las aplicaciones de los dispositivos móviles. Píxel Bit. Revista Medios Educación 2012, 41, 197–210. [Google Scholar]
  55. Bacca, J.; Fabregat, R.; Baldiris, S.; Graf, S. Augmented reality trends in education: A systematic review of research and applications. Educ. Technol. Soc. 2014, 17, 133–149. [Google Scholar]
  56. Bower, M.; Howe, C.; McCredie, N.; Robinson, A.; Grover, D. Augmented reality in education-cases, places and potentials. Educ. Media Int. 2014, 51, 1–15. [Google Scholar] [CrossRef]
  57. Akçayir, M.; Akçayir, G. Advantages and challenges associated with augmented reality for education: A systematic review of the literature. Educ. Res. Rev. 2017, 20, 1–11. [Google Scholar] [CrossRef]
  58. Ozdemir, M.; Sahin, C.; Arcagok, S.; Demir, M.K. The effect of augmented reality applications in the learning process: A MetaAnalysis study. Eur. J. Educ. Res. 2018, 74, 165–186. [Google Scholar] [CrossRef] [Green Version]
  59. Garzón, J.; Pavón, J.; Baldiris, S. Systematic review and meta-analysis of augmented reality in educational settings. Virt. Real. 2019, 23, 447–459. [Google Scholar] [CrossRef]
  60. Behmke, D.; Kerven, D.; Lutz, R.; Paredes, J.; Pennington, R.; Brannock, E.; Stevens, K. Augmented Reality Chemistry: Transforming 2-D Molecular Representations into Interactive 3-D Structures. Proc. Interdiscipl. STEM Teach. Learn. Conf. 2018, 2, 4–12. [Google Scholar] [CrossRef] [Green Version]
  61. Hohenwarter, M.; Fuchs, K. Combination of dynamic geometry, algebra and calculus in the software system GeoGebra. In Computer Algebra Systems and Dynamic Geometry Systems in Mathematics Teaching Conference; ZDM Mathematics Education: Pécs, Hungary, 2004; pp. 1–6. [Google Scholar]
  62. Rincon, L.F. Designing Dynamic and Interactive Applications Using Geogebra Software in the 6–12 Mathematics Curriculum. Ph.D. Thesis, Kean University, Union, NJ, USA, 2019. [Google Scholar]
  63. Saha, R.A.; Ayub, A.F.M.; Tarmizi, R.A. The effects of GeoGebra on mathematics achievement: Enlightening coordinate geometry learning. Proc. Soc. Behav. Sci. 2010, 8, 686–693. [Google Scholar] [CrossRef] [Green Version]
  64. García, M.D.M. Evolución de Actitudes y Competencias Matemáticas en Estudiantes de Secundaria al Introducir Geogebra en el Aula. Ph.D. Thesis, Departamento de Didáctica de la Matemática y de las Ciencias Experimentales Facultad de Ciencias de la Educación Universidad de Almería, Almeria, Spain, 2011. [Google Scholar]
  65. Fabian, K.; Topping, K.J.; Barron, I.G. Mobile technology and mathematics: Effects on students’ attitudes, engagement, and achievement. J. Comput. Educ. 2016, 3, 77–104. [Google Scholar] [CrossRef] [Green Version]
  66. Lastra, R.P. Encuestas probabilísticas vs. no probabilísticas. Polít. Cult. 2020, 13, 263–276. [Google Scholar]
  67. Guay, R.B. Purdue Spatial Visualization Test-Visualization of Rotations; Lafayette, W., Ed.; Purdue Research Foundation: West Lafayette, IN, USA, 1977. [Google Scholar]
  68. Del Estado, B.O. Real Decreto 1105/2014, de 26 de Diciembre, Por el Que se Establece el Currículo Básico de la Educación Secundaria Obligatoria y del Bachillerato; Ministerio de Educación, Cultura y Deporte: Madrid, Spain, 2015; pp. 169–546. [Google Scholar]
  69. Cronbach, L.J. Coefficient alpha and the internal structure of tests. Psychometrika 1951, 16, 297–334. [Google Scholar] [CrossRef] [Green Version]
  70. García, C.F.; Sánchez, M.D.P.; Martínez, P.B.; García, M.R.B. Validez y fiabilidad de los instrumentos de evaluación de las inteligencias múltiples en los primeros niveles instruccionales. Psicothema 2014, 16, 7–13. [Google Scholar]
  71. O’Dwyer, L.M.; Bernauer, J.A. Quantitative Research for the Qualitative Researcher; SAGE Publications: Thousand Oaks, CA, USA, 2013. [Google Scholar]
  72. Hinojo, F.J.; Trujillo, J.M.; Marín, J.A.; Rodríguez, C. B-learning in basic vocational training students for the development of the module of applied sciences I. Mathematics 2020, 8, 1102. [Google Scholar] [CrossRef]
  73. Moreno, A.; Aznar, I.; Cáceres, P.; Alonso, S. E-learning in the teaching of mathematics: An educational experience in adult high school. Mathematics 2020, 8, 840. [Google Scholar] [CrossRef]
  74. Hohenwarter, M. Dynamic investigation of functions using GeoGebra. In Proceedings of the Dresden International Symposium on Technology and its Integration into Mathematics Education, Dresden, Germany, 20–23 July 2006; pp. 1–5. [Google Scholar]
  75. Aydos, M. The Impact of Teaching Mathematics with Geogebra on the Conceptual Understanding of Limits and Contınuıty: The Case of Turkish Gifted and Talented Students. Ph.D. Thesis, Bilkent University, Ankara, Turkey, 2015. [Google Scholar]
  76. Carvalho, C.V.D.A.; De Medeiros, L.G.F.; De Medeiros, A.P.M.; Santos, R.M. Papert’s microworld and geogebra: A proposal to improve teaching of functions. Create. Educ. 2019, 10, 1525. [Google Scholar] [CrossRef] [Green Version]
  77. Rodríguez, A.M.; Romero, J.M.; Fuentes, A. Ampliando fronteras de comunicación y colaboración a través de la red: La competencia digital como medio para promover la interculturalidad académica. Tendencias Pedagógicas 2019, 33, 59–68. [Google Scholar] [CrossRef] [Green Version]
  78. Zapata, M. Teorías y modelos sobre el aprendizaje en entornos conectados y ubicuos. Bases para un nuevo modelo teórico a partir de una visión crítica del “conectivismo”. Educ. Know. Soc. 2015, 16, 69–102. [Google Scholar] [CrossRef] [Green Version]
Figure 1. Geogebra AR (Augmented Reality) interface: (a) Surface detection and (b) introduction and representation of functions.
Mathematics 09 00369 g001
Figure 2. Sample Purdue Spatial Visualization Test: Rotations (PSVT:R) test question (correct answer D).
Mathematics 09 00369 g002
Figure 3. Students working in the classroom during the development of the experience.
Mathematics 09 00369 g003
Figure 4. Worksheets with RA content, with QR code for access to the Geogebra AR application.
Mathematics 09 00369 g004
Figure 5. Students in the classroom working the graphical intersection through Geogebra AR.
Mathematics 09 00369 g005
Table 1. Internal consistency reliability coefficient for designed tests.
DimensionCronbach’s α
Curriculum evaluable learning standards0.893
AR as a teaching-learning tool0.762
AR as a spatial visualization tool0.838
Motivation and stimulation of learning through AR0.921
Difficulty using the app0.874
Table 2. Descriptive statistics of the results obtained in the initial evaluation test.
Initial Eval. TestNMaximumMinimumMedianMeanStd. DeviationStd. Error Mean
Experimental Control238.72.35.85.74781.527290.31846
258.62.56.16.09211.585590.31712
Table 3. T-test of results obtained in the initial evaluation test.
Initial Eval. TestLevene’s Test for Quality of Variancet-Test for Equality of Means
FSig.tdfSig. (2-Tailed)Mean DifferenceStd. Error Difference95% Confidence Interval of the Difference
LowerUpper
Equal variance assumed0.0540.818−0.765460.448−0.344170.45014−1.25030.5619
Equal variance not assumed −0.76645.8950.448−0.344170.44942−1.24890.5605
Table 4. Descriptive statistics of the results obtained in the final assessment test.
Final Eval. TestNMaximumMinimumMedianMeanStd. DeviationStd. Error Mean
Experimental Control239.64.67.17.33911.611250.33597
258.73.26.16.08411.523340.30467
Table 5. T-test of the results obtained in the final evaluation test.
Final Eval. TestLevene’s Test for Quality of Variancet-Test for Equality of Means
FSig.tdfSig. (2-Tailed)Mean DifferenceStd. Error Difference95% Confidence Interval of the Difference
LowerUpper
Equal variance assumed0.4120.0342.774460.0081.255130.452460.344382.16588
Equal variance not assumed 2.76745.1020.0081.255130.453540.341712.16855
Table 6. Measures of association between groups.
Teaching-Learning Process of Mathematical FunctionsEtaEta Square
Experimental or Control Score0.4520.204
Table 7. PSVT:R pre-test descriptive statistical results.
Pre-Test PSVT:RNMaximumMinimumMedianMeanStd. DeviationStd. Error Mean
Experimental Control237.52.554.96431.409990.29400
258.332.55.835.33321.734550.34691
Table 8. T-test results obtained in the PSVT:R pre-test.
Pre-Test PSVT:RLevene’s Test for Quality of Variancet-Test for Equality of Means
FSig.tdfSig. (2-Tailed)Mean DifferenceStd. Error Difference95% Confidence Interval of the Difference
LowerUpper
Equal variance assumed2.2910.137−0.804460.425−0.368850.45871−1.292180.55448
Equal variance not assumed −8.1145.3410.422−0.368850.45474−1.284550.54684
Table 9. PSVT:R post-test descriptive statistical results.
Post-Test PSVT:RNMaximumMinimumMedianMeanStd. DeviationStd. Error Mean
Experimental Control239.174.177.57.06521.605740.33482
258.332.55.835.66641.734630.34693
Table 10. T-test results obtained in the PSVT:R post-test.
Post-Test PSVT:RLevene’s Test for Quality of Variancet-Test for Equality of Means
FSig.tdfSig. (2-Tailed)Mean DifferenceStd. Error Difference95% Confidence Interval of the Difference
LowerUpper
Equal variance assumed0.1010.0292.892460.0061.398820.483730.425132.37251
Equal variance not assumed 2.90145.9970.0061.398820.482140.428312.36932
Table 11. Measures of association between groups for PSVT:R.
PSVT:REtaEta Square
Experimental or Control Score0.4620.213
Table 12. Descriptive analysis of the results of the application of the questionnaire.
ItemsIn Disagreement (%)Indifferent (%)In Agreement (%)
123456
AR as a teaching-learning tool 4.3613.0430.4334.7817.39
AR as a spatial visualization tool 4.368.6921.7434.7830.43
Motivation in learning through AR 4.368.6952.1734.78
Easy to use 8.6921.7439.1430.43
Publisher’s Note: MDPI stays neutral with regard to jurisdictional claims in published maps and institutional affiliations.

