
Historic and Simulated Desert-Oasis Ecotone Changes in the Arid Tarim River Basin, China

 ,
, 


Abstract

1. Introduction
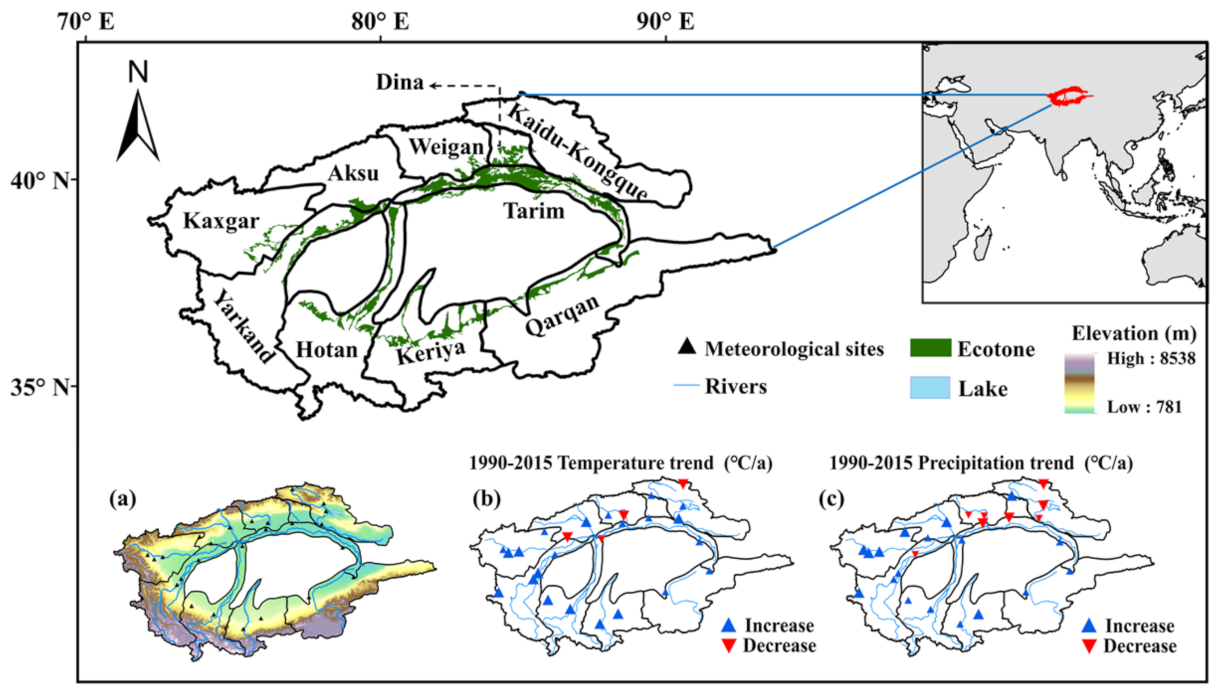
2. Study Area
3. Materials and Methods
3.1. Materials
3.1.1. Remote Sensing Data
3.1.2. LUCC Data
3.1.3. Meteorological Data
3.1.4. Groundwater Data
3.2. Methods
3.2.1. NDVI Calculation
3.2.2. Land-Use Transfer Matrix
3.2.3. The Standardized Precipitation Evapotranspiration Index
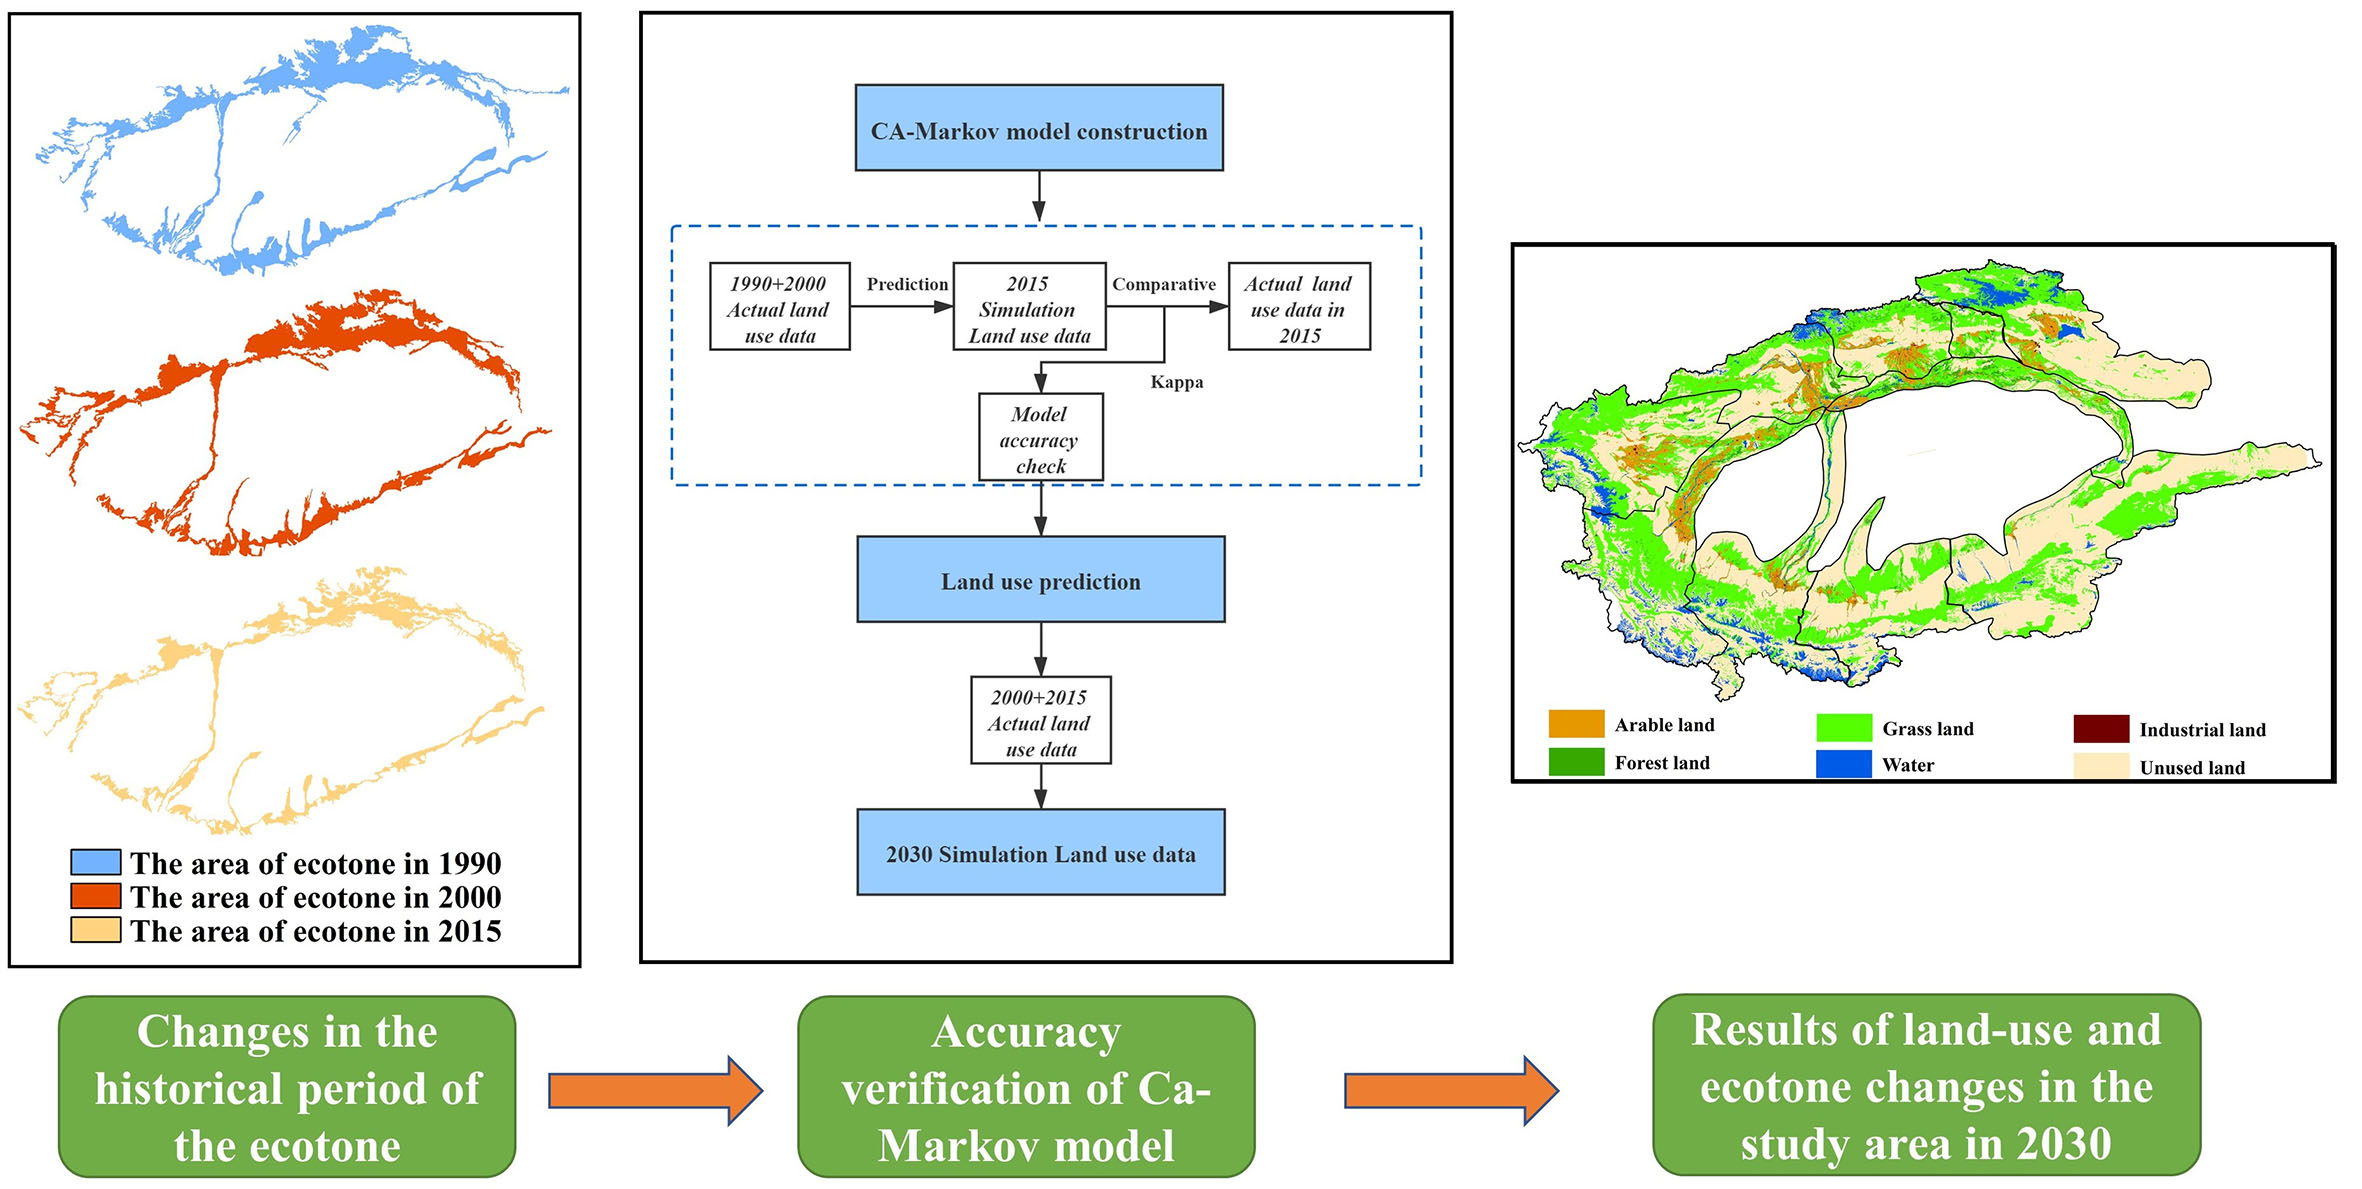
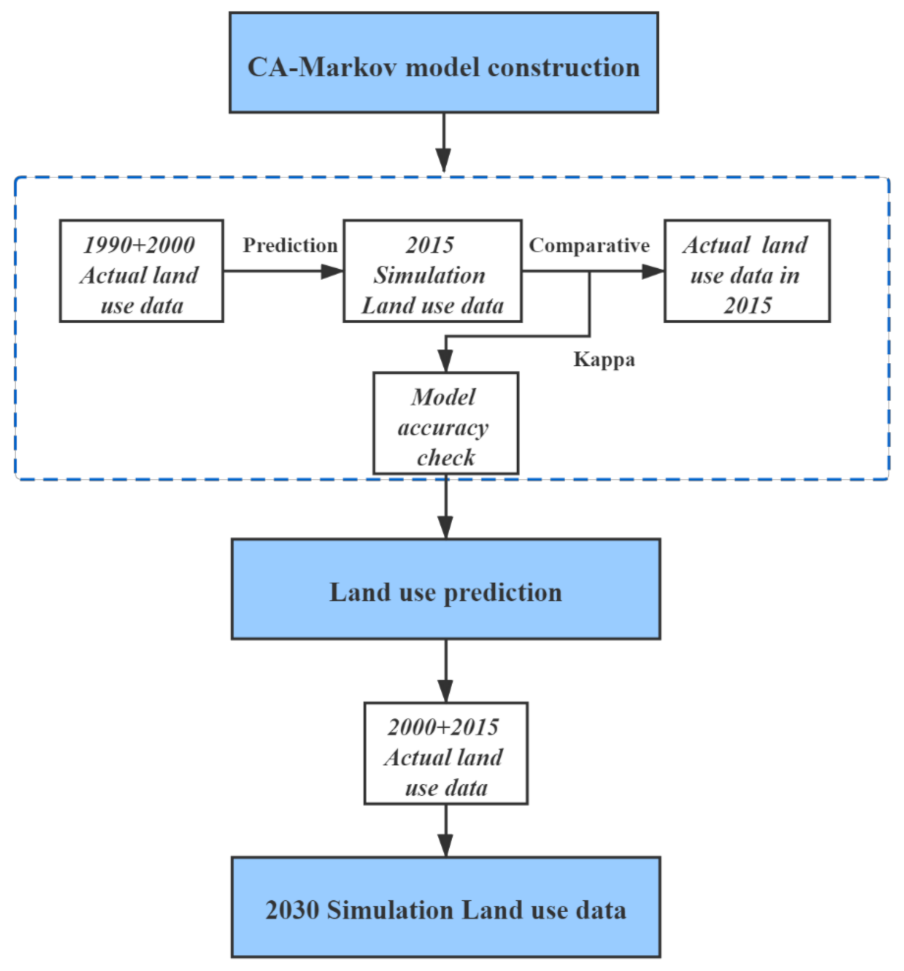
3.2.4. The CA-Markov Model
3.2.5. The Kappa Index
4. Results
4.1. Desert-Oasis Ecotone and Land-Use Changes in the Tarim River Basin
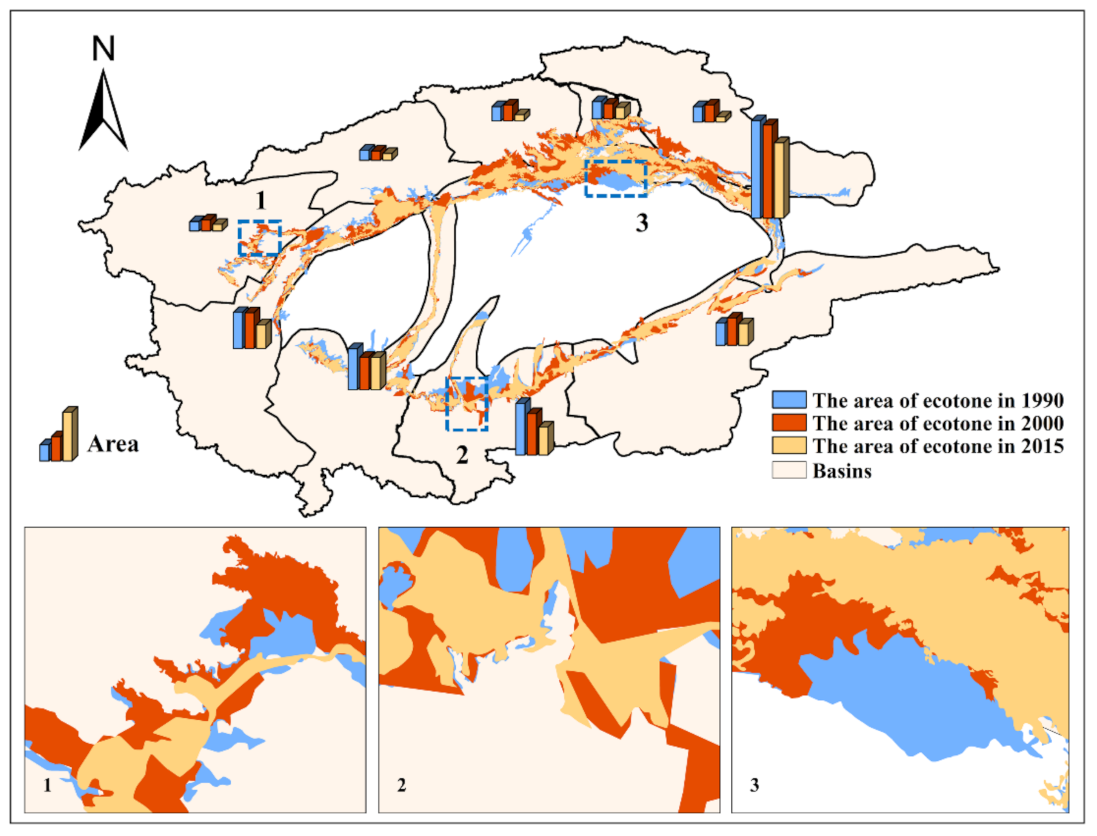
4.1.1. Desert-Oasis Ecotone Changes in the Tarim River Basin
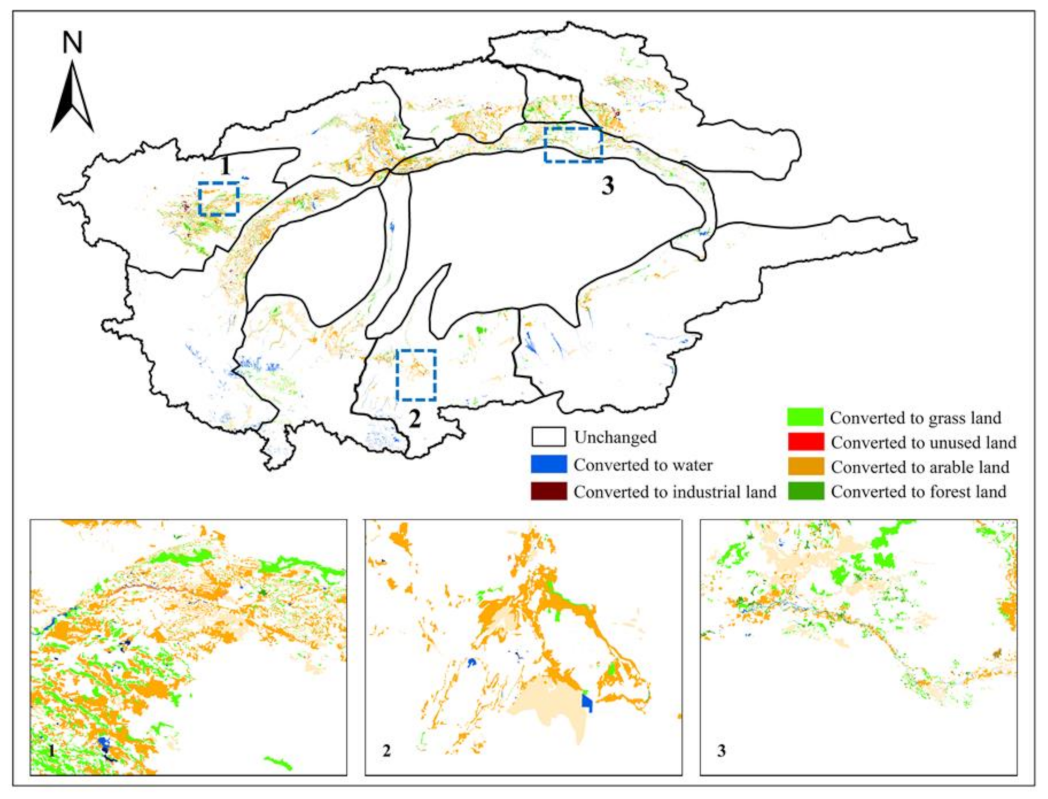
4.1.2. Land-Use Changes in the Tarim River Basin
4.2. Driving Force Analysis
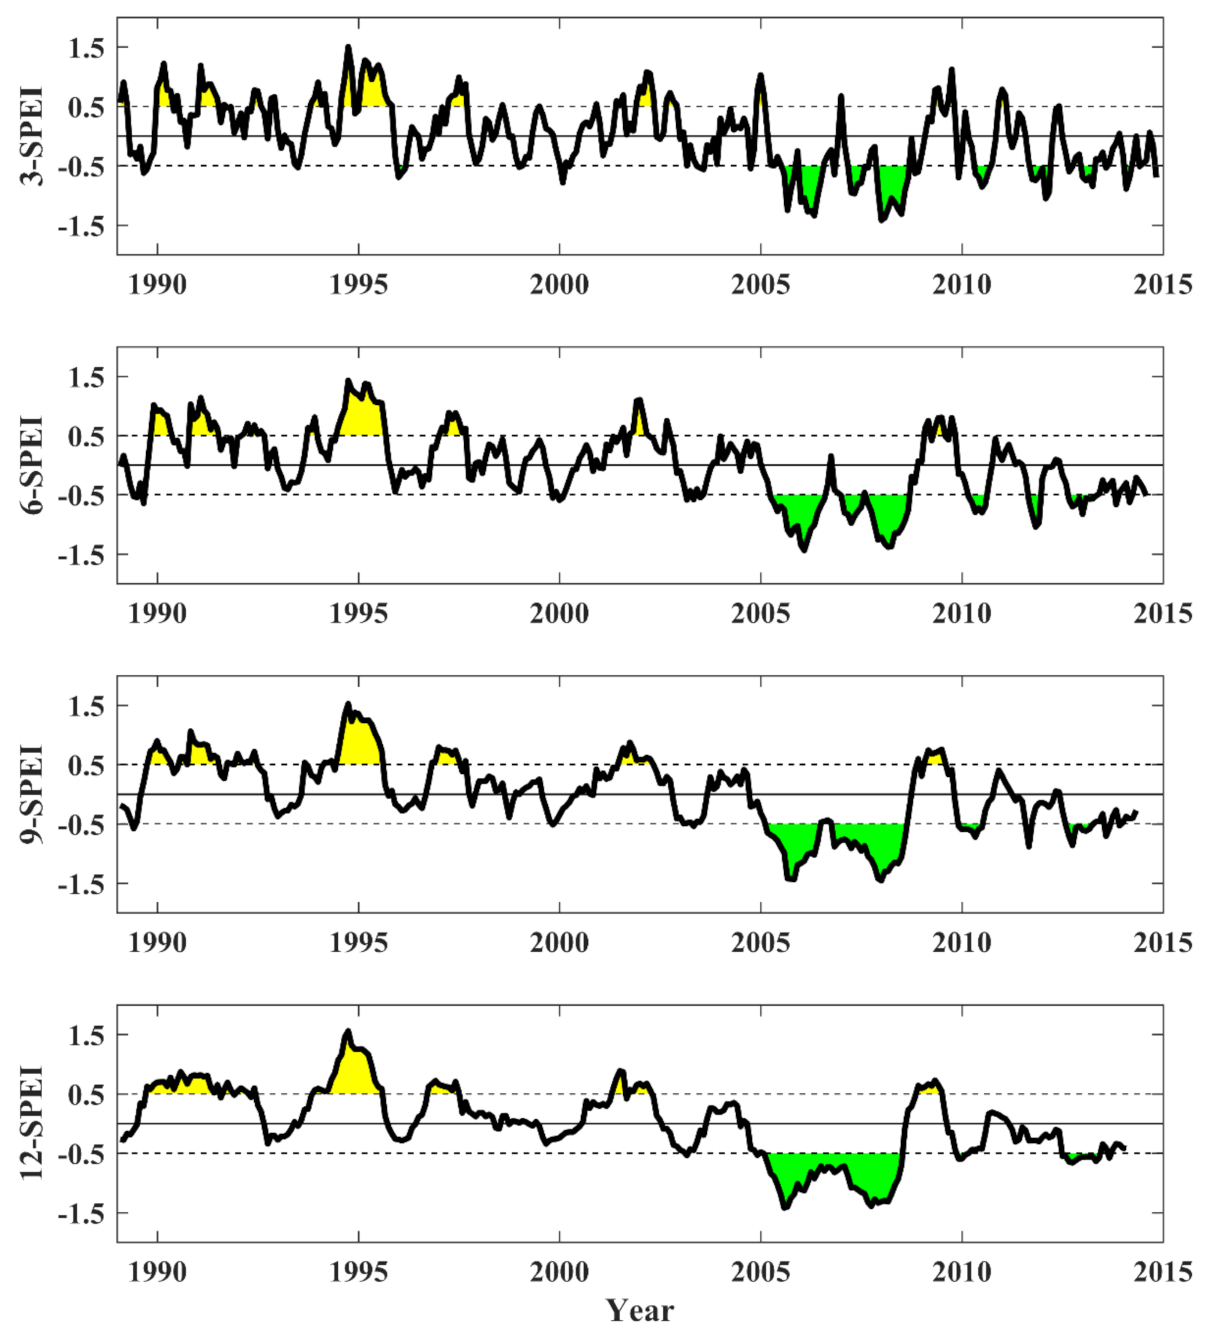
4.2.1. Meteorological Factors
4.2.2. Human Factors: Groundwater Changes
4.3. Simulation and Prediction of Land Use in the Ecotone and Its Basin in 2030
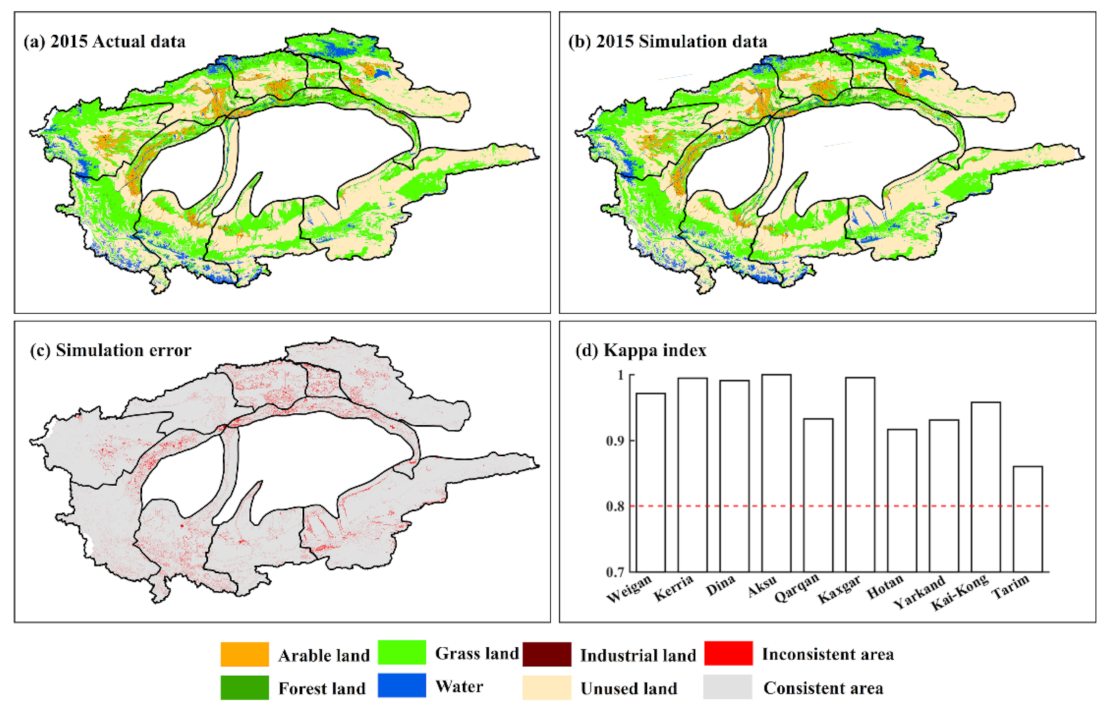
4.3.1. Accuracy Verification
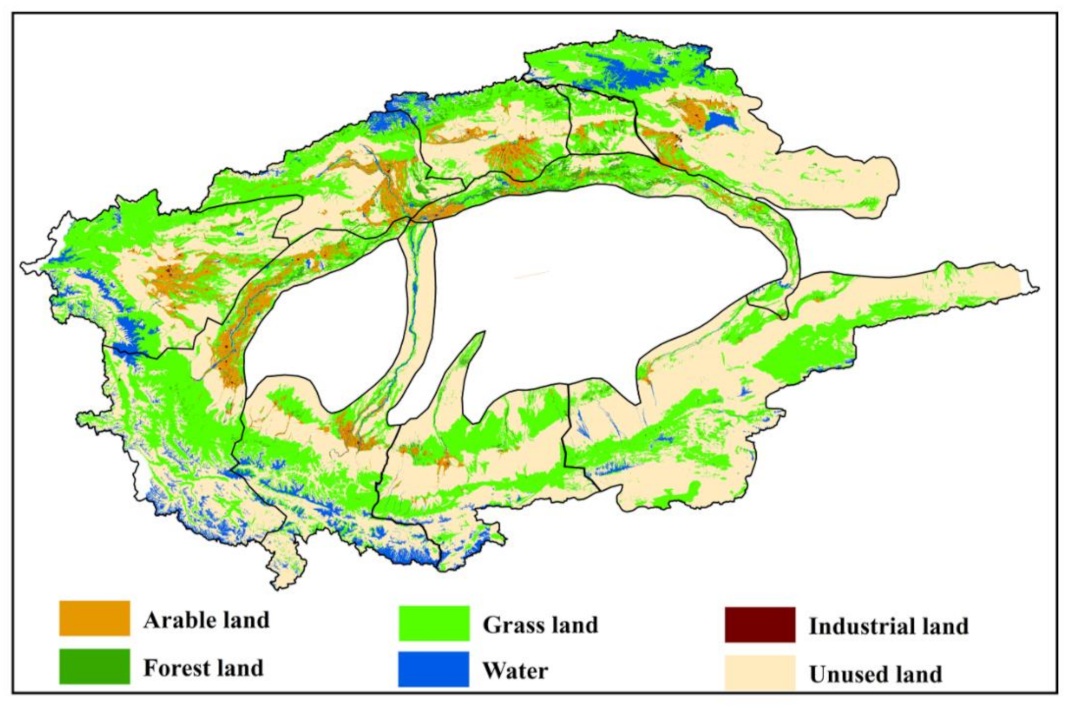
4.3.2. Forecast of Changes in the Desert-Oasis Ecotone in the Tarim River Basin
5. Discussion
5.1. Criteria for the Classification of the Desert-Oasis Ecotone
5.2. Combined Effect of Climate Change and Human Activities on the Desert-Oasis Ecotone
5.3. Applicability of the Land-Use Change Model and Future Work
6. Conclusions
Supplementary Materials
Author Contributions
Funding
Institutional Review Board Statement
Informed Consent Statement
Data Availability Statement
Acknowledgments
Conflicts of Interest
References
- Chen, Y.; Chen, Y.; Zhu, C.; Li, W. The concept and mode of ecosystem sustainable management in arid desert areas in northwest China. Acta Ecol. Sin. 2019, 39, 7410–7417. [Google Scholar]
- Allen, R.G. Crop Evapotranspiration-Guidelines for Computing Crop Water Requirements; FAO Irrigation and Drainage Paper No.56; FAO: Rome, Italy, 1998; p. 300. [Google Scholar]
- Zhou, X.; Tao, Y.; Wu, L.; Li, Y.; Zhang, Y. Divergent Responses of Plant Communities under Increased Land-Use Intensity in Oasis-Desert Ecotones of Tarim Basin. Rangel. Ecol. Manag. 2020, 73, 811–819. [Google Scholar] [CrossRef]
- Rosenfeld, D.; Rudich, Y.; Lahav, R. Desert dust suppressing precipitation: A possible desertification feedback loop. Proc. Natl. Acad. Sci. USA 2001, 98, 5975–5980. [Google Scholar] [CrossRef] [PubMed]
- Chen, Y.; Zhang, X.; Fang, G.; Li, Z.; Wang, F.; Qin, J.; Sun, F. Potential risks and challenges of climate change in the arid region of northwestern China. Reg. Sustain. 2020, 1, 20–30. [Google Scholar] [CrossRef]
- Gosz, J.R. Ecological functions in a biome transition zone: Translating local responses to broad-scale dynamics. In Landscape Boundaries; Springer: New York, NY, USA, 1992; pp. 55–75. [Google Scholar]
- Traut, B.H. The role of coastal ecotones: A case study of the salt marsh/upland transition zone in California. J. Ecol. 2005, 93, 279–290. [Google Scholar] [CrossRef]
- Li, X.; Yang, K.; Zhou, Y. Progress in the study of oasis-desert interactions. Agric. Meteorol. 2016, 230–231, 1–7. [Google Scholar] [CrossRef]
- Hou, J.; Du, L.; Liu, K.; Hu, Y.; Zhu, Y. Characteristics of vegetation activity and its responses to climate change in desert/grassland biome transition zones in the last 30 years based on GIMMS3g. Theor. Appl. Climatol. 2019, 136, 915–928. [Google Scholar] [CrossRef]
- Fan, Z.; Li, J.; Yue, T. Land-cover changes of biome transition zones in Loess Plateau of China. Ecol. Model. 2013, 252, 129–140. [Google Scholar] [CrossRef]
- Ji, S.; Bai, X.; Qiao, R.; Wang, L.; Chang, X. Width identification of transition zone between desert and oasis based on NDVI and TCI. Sci. Rep. 2020, 10, 8672. [Google Scholar] [CrossRef]
- Wang, J.; Gao, Y.; Sheng, W. Land use/cover change impacts on water table change over 25 years in a desert-oasis transition zone of the Heihe River basin, China. Water 2015, 8, 11. [Google Scholar] [CrossRef]
- Verburg, P.H.; Soepboer, W.; Veldkamp, A.; Limpiada, R.; Espaldon, V.; Mastura, S.S.A. Modeling the spatial dynamics of regional land use: The CLUE-S model. Environ. Manag. 2002, 30, 391–405. [Google Scholar] [CrossRef] [PubMed]
- Buckland, C.E.; Bailey, R.M.; Thomas, D.S.G. Using artificial neural networks to predict future dryland responses to human and climate disturbances. Sci. Rep. 2019, 9, 3855. [Google Scholar] [CrossRef]
- Memarian, H.; Balasundram, S.; Talib, J.; Teh, C.; Sood, A.; Abbaspour, K. Validation of CA-Markov for simulation of land use and cover change in the Langat Basin, Malaysia. J. Geogr. Inf. Syst. 2012, 44, 542–554. [Google Scholar] [CrossRef]
- Huang, Q.; Shi, P.; He, C.; Li, X. Modelling land use change dynamics under different aridification scenarios in Northern China. Acta Geogr. Sin. 2006, 61, 1299. [Google Scholar]
- Shen, Q.; Chen, Q.; Tang, B.; Yeung, S.; Hu, Y.; Cheung, G. A system dynamics model for the sustainable land use planning and development. Habitat Int. 2009, 33, 15–25. [Google Scholar] [CrossRef]
- Civco, D.L. Artificial neural networks for land-cover classification and mapping. Int. J. Geogr. Inf. Syst. 1993, 7, 173–186. [Google Scholar] [CrossRef]
- Nouri, J.; Gharagozlou, A.; Arjmandi, R.; Faryadi, S.; Adl, M. Predicting urban land use changes using a CA–Markov model. Arab. J. Sci. Eng. 2014, 39, 5565–5573. [Google Scholar] [CrossRef]
- Sang, L.; Zhang, C.; Yang, J.; Zhu, D.; Yun, W. Simulation of land use spatial pattern of towns and villages based on CA–Markov model. Math. Comput. Model. 2011, 54, 938–943. [Google Scholar] [CrossRef]
- Kamusoko, C.; Aniya, M.; Adi, B.; Manjoro, M. Rural sustainability under threat in Zimbabwe–Simulation of future land use/cover changes in the Bindura district based on the Markov-cellular automata model. Appl. Geogr. 2009, 29, 435–447. [Google Scholar] [CrossRef]
- Chen, H.; Chen, Y. Changes of desert riparian vegetation along the main stream of Tarim River, Xinjiang. Chin. J. Ecol. 2015, 34, 3166. [Google Scholar]
- Zhao, R.; Chen, Y.; Shi, P.; Zhang, L.; Pan, J.; Zhao, H. Land use and land cover change and driving mechanism in the arid inland river basin: A case study of Tarim River, Xinjiang, China. Environ. Earth Sci. 2013, 68, 591–604. [Google Scholar] [CrossRef]
- Chen, Y.; Hao, X.; Chen, Y.; Zhu, C. Study on water system connectivity and ecological protection countermeasures of Tarim River Basin in Xinjian. Bull. Chin. Acad. Sci. 2019, 34, 1156–1164. [Google Scholar]
- Fang, G.; Yang, J.; Chen, Y.; Li, Z.; Ji, H.; De Maeyer, P. How hydrologic processes differ spatially in a large basin: Multi-site and multi-objective modeling in the Tarim River Basin. J. Geophys. Res. Atmos. 2018, 123, 7098–7113. [Google Scholar]
- Chen, Y.; Xu, C.; Hao, X.; Li, W.; Chen, Y.; Zhu, C.; Ye, Z. Fifty-year climate change and its effect on annual runoff in the Tarim River Basin, China. Quat. Int. 2009, 208, 53–61. [Google Scholar]
- Xu, Z.; Chen, Y.; Li, J. Impact of climate change on water resources in the Tarim River basin. Water Resour. Manag. 2004, 18, 439–458. [Google Scholar] [CrossRef]
- Wang, F.; Chen, Y.; Li, Z.; Fang, G.; Li, Y.; Xia, Z. Assessment of the irrigation water requirement and water supply risk in the Tarim River Basin, Northwest China. Sustainability 2019, 11, 4941. [Google Scholar] [CrossRef]
- Lai, L.; Huang, X.; Yang, H.; Chuai, X.; Zhang, M.; Zhong, T.; Chen, Z.; Chen, Y.; Wang, X.; Thompson, J.R. Carbon emissions from land-use change and management in China between 1990 and 2010. Sci. Adv. 2016, 2, e1601063. [Google Scholar] [CrossRef] [PubMed]
- Zhang, W.; Lu, Y.; van der Werf, W.; Huang, J.; Wu, F.; Zhou, K.; Deng, X.; Jiang, Y.; Wu, K.; Rosegrant, M.W. Multidecadal, county-level analysis of the effects of land use, Bt cotton, and weather on cotton pests in China. Proc. Natl. Acad. Sci. USA 2018, 115, E7700. [Google Scholar] [CrossRef]
- Ma, M.; Veroustraete, F. Reconstructing pathfinder AVHRR land NDVI time-series data for the Northwest of China. Adv. Space Res. 2006, 37, 835–840. [Google Scholar] [CrossRef]
- Piao, S.; Wang, X.; Park, T.; Chen, C.; Lian, X.; He, Y.; Bjerke, J.W.; Chen, A.; Ciais, P.; Tømmervik, H. Characteristics, drivers and feedbacks of global greening. Nat. Rev. Earth Environ. 2020, 1, 14–27. [Google Scholar] [CrossRef]
- Zhang, Y.; Song, C.; Band, L.E.; Sun, G.; Li, J. Reanalysis of global terrestrial vegetation trends from MODIS products: Browning or greening? Remote Sens. Environ. 2017, 191, 145–155. [Google Scholar] [CrossRef]
- Deng, Y.; Wang, S.; Bai, X.; Luo, G.; Wu, L.; Chen, F.; Wang, J.; Li, C.; Yang, Y.; Hu, Z. Vegetation greening intensified soil drying in some semi-arid and arid areas of the world. Agric. For. Meteorol. 2020, 292, 108103. [Google Scholar] [CrossRef]
- Sun, F.; Wang, Y.; Chen, Y. Dynamic changes of the desert-oasis ecotone and its influencing factors in Tarim Basin. Chin. J. Ecol. 2020, 39, 3397–3407. [Google Scholar]
- Long, H.; Liu, Y.; Hou, X.; Li, T.; Li, Y. Effects of land use transitions due to rapid urbanization on ecosystem services: Implications for urban planning in the new developing area of China. Habitat Int. 2014, 44, 536–544. [Google Scholar] [CrossRef]
- Li, Y.; Chen, Y.; Li, Z. Dry/wet pattern changes in global dryland areas over the past six decades. Glob. Planet. Chang. 2019, 178, 184–192. [Google Scholar] [CrossRef]
- Stagge, J.H.; Tallaksen, L.M.; Gudmundsson, L.; Van Loon, A.F.; Stahl, K. Candidate distributions for climatological drought indices (SPI and SPEI). Int. J. Climatol. 2015, 35, 4027–4040. [Google Scholar] [CrossRef]
- Beguería, S.; Vicente-Serrano, S.M.; Reig, F.; Latorre, B. Standardized precipitation evapotranspiration index (SPEI) revisited: Parameter fitting, evapotranspiration models, tools, datasets and drought monitoring. Int. J. Climatol. 2014, 34, 3001–3023. [Google Scholar] [CrossRef]
- Manzano, A.; Clemente, M.A.; Morata, A.; Luna, M.Y.; Beguería, S.; Vicente-Serrano, S.M.; Martín, M.L. Analysis of the atmospheric circulation pattern effects over SPEI drought index in Spain. Atmos. Res. 2019, 230, 104630. [Google Scholar] [CrossRef]
- Veldkamp, A.; Lambin, E.F. Predicting land-use change. Agric. Ecosyst. Environ. 2001, 85, 1–6. [Google Scholar] [CrossRef]
- Fischer, G.; Sun, L. Model based analysis of future land use development in China. Agric. Ecosyst. Environ. 2001, 85, 163–176. [Google Scholar] [CrossRef]
- Pijanowski, B.; Brown, D.; Shellito, B.; Manik, G. Using neural networks and GIS to forecast land use changes: A land transformation model. Comput. Environ. Urban Syst. 2002, 26, 553–575. [Google Scholar] [CrossRef]
- Van Vliet, J.; Hurkens, J.; White, R.; van Delden, H. An activity-based cellular automaton model to simulate land-use dynamics. Environ. Plan. B Plan. Des. 2011, 39, 198–212. [Google Scholar] [CrossRef]
- Li, X.; Liu, X. Defining agents’ behaviors to simulate complex residential development using multicriteria evaluation. J. Environ. Manag. 2007, 85, 1063–1075. [Google Scholar] [CrossRef] [PubMed]
- Wood, E.C.; Lewis, J.E.; Tappan, G.G.; Lietzow, R.W. The development of a land cover change model for southern Senegal. In Land Use Modeling Workshop; EROS Data Center: Sioux Falls, SD, USA, 1997; pp. 5–6. [Google Scholar]
- Pontius, R.; Huffaker, D.; Denman, K. Useful techniques of validation for spatially explicit land-change models. Ecol. Model. 2004, 179, 445–461. [Google Scholar] [CrossRef]
- Jiang, P.; Cheng, L.; Li, M.; Zhao, R.; Duan, Y. Impacts of LUCC on soil properties in the riparian zones of desert oasis with remote sensing data: A case study of the middle Heihe River basin, China. Sci. Total Environ. 2015, 506, 259–271. [Google Scholar] [CrossRef]
- Li, J.; Zhao, C.; Zhu, H.; Li, Y.; Wang, F. Effect of plant species on shrub fertile island at an oasis–desert ecotone in the South Junggar Basin, China. J. Arid Environ. 2007, 71, 350–361. [Google Scholar] [CrossRef]
- Chen, Z.; Chen, Y.; Li, B. Quantifying the effects of climate variability and human activities on runoff for Kaidu River Basin in arid region of northwest China. Theor. Appl. Climatol. 2013, 111, 537–545. [Google Scholar] [CrossRef]
- Shen, Y.; Chen, Y. Global perspective on hydrology, water balance, and water resources management in arid basins. Hydrol. Process. 2009, 24, 129–135. [Google Scholar] [CrossRef]
- Chen, Y.; Ye, Z.; Shen, Y. Desiccation of the Tarim River, Xinjiang, China, and Mitigation Strategy. Quat. Int. 2011, 244, 264–271. [Google Scholar] [CrossRef]
- Fang, G.; Chen, Y. Variation in agricultural water demand and its attributions in the arid Tarim River Basin. J. Agric. Sci. 2018, 156, 1–11. [Google Scholar] [CrossRef]


| Type | 1990 | 2000 | 2015 | |||
|---|---|---|---|---|---|---|
| Area (km2) | Ratio (%) | Area (km2) | Ratio (%) | Area (km2) | Ratio (%) | |
| Arable land | 24,522.41 | 3.79 | 26,725.11 | 4.13 | 31,647.51 | 4.89 |
| Forest land | 12,055.43 | 1.86 | 12,688.41 | 1.96 | 12,062.48 | 1.87 |
| Grassland | 232,629.10 | 35.97 | 226,322.97 | 35.00 | 223,717.63 | 34.60 |
| Water | 34,774.43 | 5.38 | 35,508.45 | 5.49 | 35,057.50 | 5.42 |
| Industrial land | 1563.65 | 0.24 | 1497.20 | 0.23 | 1630.12 | 0.25 |
| Unused land | 341,124.92 | 52.75 | 343,917.04 | 53.18 | 342,543.93 | 52.97 |
| Type | Predicted Area (km2) | Ratio (%) | Actual Area (km2) | Ratio (%) | Quantitative Accuracy Error (%) |
|---|---|---|---|---|---|
| Arable land | 33,073.94 | 5.04 | 31,647.51 | 4.89 | 4.51 |
| Forest land | 12,786.20 | 1.27 | 12,062.48 | 1.87 | 6.00 |
| Grassland | 216,813.78 | 33.36 | 223,717.63 | 34.60 | 3.09 |
| Water | 38,060.14 | 6.14 | 35,057.50 | 5.42 | 8.56 |
| Industrial land | 1638.14 | 0.26 | 1630.12 | 0.25 | 0.49 |
| Unused land | 344,293.60 | 53.93 | 342,543.93 | 52.97 | 0.51 |
Publisher’s Note: MDPI stays neutral with regard to jurisdictional claims in published maps and institutional affiliations. |
© 2021 by the authors. Licensee MDPI, Basel, Switzerland. This article is an open access article distributed under the terms and conditions of the Creative Commons Attribution (CC BY) license (http://creativecommons.org/licenses/by/4.0/).
Share and Cite
Sun, F.; Wang, Y.; Chen, Y.; Li, Y.; Zhang, Q.; Qin, J.; Kayumba, P.M. Historic and Simulated Desert-Oasis Ecotone Changes in the Arid Tarim River Basin, China. Remote Sens. 2021, 13, 647. https://doi.org/10.3390/rs13040647
Sun F, Wang Y, Chen Y, Li Y, Zhang Q, Qin J, Kayumba PM. Historic and Simulated Desert-Oasis Ecotone Changes in the Arid Tarim River Basin, China. Remote Sensing. 2021; 13(4):647. https://doi.org/10.3390/rs13040647
Chicago/Turabian StyleSun, Fan, Yi Wang, Yaning Chen, Yupeng Li, Qifei Zhang, Jingxiu Qin, and Patient Mindje Kayumba. 2021. "Historic and Simulated Desert-Oasis Ecotone Changes in the Arid Tarim River Basin, China" Remote Sensing 13, no. 4: 647. https://doi.org/10.3390/rs13040647
APA StyleSun, F., Wang, Y., Chen, Y., Li, Y., Zhang, Q., Qin, J., & Kayumba, P. M. (2021). Historic and Simulated Desert-Oasis Ecotone Changes in the Arid Tarim River Basin, China. Remote Sensing, 13(4), 647. https://doi.org/10.3390/rs13040647