Article

Comprehensive Evaluation of Healthcare Benefits of Different Forest Types: A Case Study in Shimen National Forest Park, China

Guangdong Key Laboratory for Innovative Development and Utilization of Forest Plant Germplasm, College of Forestry and Landscape Architecture, South China Agricultural University, Guangzhou 510642, China
*
Author to whom correspondence should be addressed.
Forests 2021, 12(2), 207; https://doi.org/10.3390/f12020207
Submission received: 4 January 2021 / Revised: 4 February 2021 / Accepted: 7 February 2021 / Published: 10 February 2021
(This article belongs to the Special Issue Ecosystem Services and Disservices of Urban Forests)

Abstract

:
Studies have shown that contact with nature plays a crucial role in the amelioration of human health. Forest therapy has recently received widespread attention as a novel and subsidiary treatment approach for stress recovery and health promotion. However, there is a lack of ample research on the comprehensive evaluation of the forest healthcare benefits. Moreover, it is not entirely clear what kind of forest types and seasons are suitable for forest therapy activities and how healthcare forests should be constructed and managed. From September 2019 to January 2020 and May to August 2020., five forest types of Phyllostachys edulis forest, subtropical evergreen broad-leaved forest, Liquidambar formosana forest, Cunninghamia lanceolata forest, coniferous and broad-leaved mixed forest and a forestless control group in Shimen National Forest Park, Guangzhou City, Guangdong Province, China were selected. Variations in the character of negative air ion concentration, air oxygen content, human comfort index and phytoncide relative content were analyzed. Principal component analysis and systematic clustering were used to construct forest comprehensive healthcare index and evaluation grade in order to assess the healthcare benefits of different forest types. In terms of negative air ion concentration, the subtropical evergreen broad-leaved forest was far ahead of the other forest types throughout the year, while the forestless control group was the worst. All stands reached the annual maximum in summer, followed by spring, autumn and winter. From the perspective of air oxygen content, summer > spring > autumn > winter, among them, all forest stands clearly exceeded the normal atmospheric oxygen content (20.9%) in the first three quarters. Moreover, the air oxygen content of coniferous and broad-leaved mixed forest was the highest in five forest types; the forestless control group was the lowest. Judging from the human comfort index, in the whole year, all forest types, including the forestless group, were at the comfortable level and above. However, the five forest types still differed greatly in diverse seasons, among which Phyllostachys edulis forest and subtropical evergreen broad-leaved forest were superior to Liquidambar formosana forest, Cunninghamia lanceolata forest, coniferous and broad-leaved mixed forest in spring and summer, while it was in reverse in autumn and winter. In view of the phytoncide relative content, the subtropical evergreen broad-leaved forest was the highest, followed by the Cunninghamia lanceolata forest. The relative content of phytoncide was released more in summer, second, by spring, autumn and winter. Furthermore, establishing forest comprehensive healthcare index (FCHI = 0.1NAICi + 0.35AOCi + 0.27HCIi + 0.28PRCi), according to the FCHI value, it was divided into five rating levels. Overall, the comprehensive healthcare index of the five forest stands distinctly outperformed the forestless control group in all seasons. In addition, the five forest types were at level I in spring and summer. From the comprehensive data of the whole year, the comprehensive healthcare index of the coniferous and broad-leaved mixed forest was the best, followed by the subtropical evergreen broad-leaved forest. The forest environment has a favorable influence on the human body and mind, so it is suggested that citizens go to the forest environment regularly for healthcare and physical and mental washing. In terms of the forest healthcare benefits, the best seasons for forest therapy in Shimen National Forest Park are spring and summer; autumn is suitable as well. When planning and constructing the forest therapy bases in Shimen National Forest Park in the future, coniferous and broad-leaved mixed forests should be allocated more in the stand transformation to promote forest healthcare benefits. Protecting and developing the landscape resources of the subtropical evergreen broad-leaved forests should be paid close attention, as well as making rational use of their health activity space.

1. Introduction

In recent years, due to environmental contamination combined with intense social competition and heavier life pressure, a growing number of people are affected by lifestyle-related diseases and are in a sub-healthy state. Moreover, medical costs are increasing at home and abroad [1,2]. Increasingly, people have reached a consensus on self-care. At the same time, traveling for health purposes is a global tourism trend. Numerous countries have identified health, medical, and wellness tourism as a key development area for the near or distant future. China has significant resources, as well as plans for developing health tourism [3]. Furthermore, according to surveys, most people realize that the forest environment has a favorable influence on human physical and mental health [4]. There has been increasing interest in forest therapy, defined as making contact with nature and taking in the atmosphere of the forest, as an environmentally friendly therapeutic approach for improving an individual’s mental and physical relaxation and relieving stress [5]. Studies conducted over the past twenty years have systematically illustrated the effects of forest therapy on human health, as well [6,7,8,9]. Therefore, with the development of health tourism and the enhancement of people’s awareness of healthcare, forest healthcare resources and function evaluation issue have been receiving unprecedented attention.
Forest healthcare resources are defined as all biological and abiotic factors with healthcare benefits in the forest environment, including negative air ions, phytoncide, air oxygen content, forest microclimate advantages, acoustic environment advantages, surface water environment, natural radiation level, biological population advantage, forest food and other forest healthcare factors. Negative air ions—the general names of negatively charged single gas molecules and light ion clusters in the atmosphere—are a vital indicator of forest healthcare benefits and are significant for the evaluation of air quality of different forest types. Early research has shown the beneficial effects of negative air ions in improving neuropsychological performance and treating mood disorders [10], alleviating depression [11], promoting sleep quality [12]. In addition, under different influences of tree species, structures, ages, densities, heights, and so on, negative air ion concentrations of diverse forest types are significantly various. Phytoncides, first coined in 1928 by Boris P. Tokin, a Russian biochemist, are defined as natural volatile compounds derived from trees and plants to defend against decay or attack by herbivores [13]. Previous research findings strongly suggest that tree-derived phytoncides have beneficial effects on antifungal, anti-inflammatory, antimicrobial, analgesic, anti-stress, antioxidant [14,15,16,17,18,19], human immune functions [20], even sleep quality improvement [13,21]. The forest air has high oxygen content. Oxygen is our primary life support. The air we breathe is so vital that hypoxia would cause fatigue, memory loss, inattention, insomnia and other symptoms [22]. Regular forest bathing activities can improve the sub-healthy status and make physical functions, intelligence and blood oxygen concentration reach the best states. Forest microclimate advantages refer to the human body’s perception of the forest environment’s temperature, relative humidity, wind speed and other factors, which is often measured by a human comfort index. The potential of the forest microclimate environment in regulating temperature is widely known, which is conducive to human leisure and healthcare [23,24]. At the same time, evaluation of the human comfort index is one of the bases of the construction of the scientific human settlement environment. There have been many studies on the evaluation and analysis of single-forest healthcare factors of negative oxygen ions, phytoncide, human comfort and the natural soundscape. However, the forest healthcare benefits reflected by a single index are one-sided; there have been few studies that have focused on evaluating forest healthcare benefits by multiple comprehensive indices. The aim of this study, in which the healthcare benefits of multiple environmental factors are considered comprehensively, therefore, was mainly to investigate three scientific problems as follows: (1) How can we comprehensively evaluate the healthcare benefits of diverse forest types? (2) Which forest types are suitable for people to carry out forest therapy activities? (3) How do we construct a healthcare forest, improve its healthcare benefits and optimize forest structure in a later period? In the article Suggestions on Promoting the Development of Forest Therapy Industry in 2019, The Chinese government mentioned that forest therapy bases are necessary to create a forest healthcare environment with obvious effects, targeted construction and improvement of stands with healthcare benefits. Hence, it is of great theoretical and practical significance to explore these problems. Shimen National Forest Park is one of the first batches of forest therapy bases in Guangdong Province, China. In this study, five different forest types and a forestless control group in Shimen National Forest Park were taken as the research objects, and the changes of environmental healthcare indicators such as negative air ion concentration, air oxygen content, forest microclimate (temperature, relative humidity and wind speed) and phytoncide were monitored. By using principal component analysis and system clustering method, the forest comprehensive healthcare index (FCHI) and evaluation criteria were constructed. The results will not only provide a theoretical basis for the comprehensive evaluation of the healthcare benefits of different forest types but also offer powerful data support for the future construction and structure optimization of healthcare forest, affording an essential selection basis of time and destination for forest therapy.

2. Materials and Methods
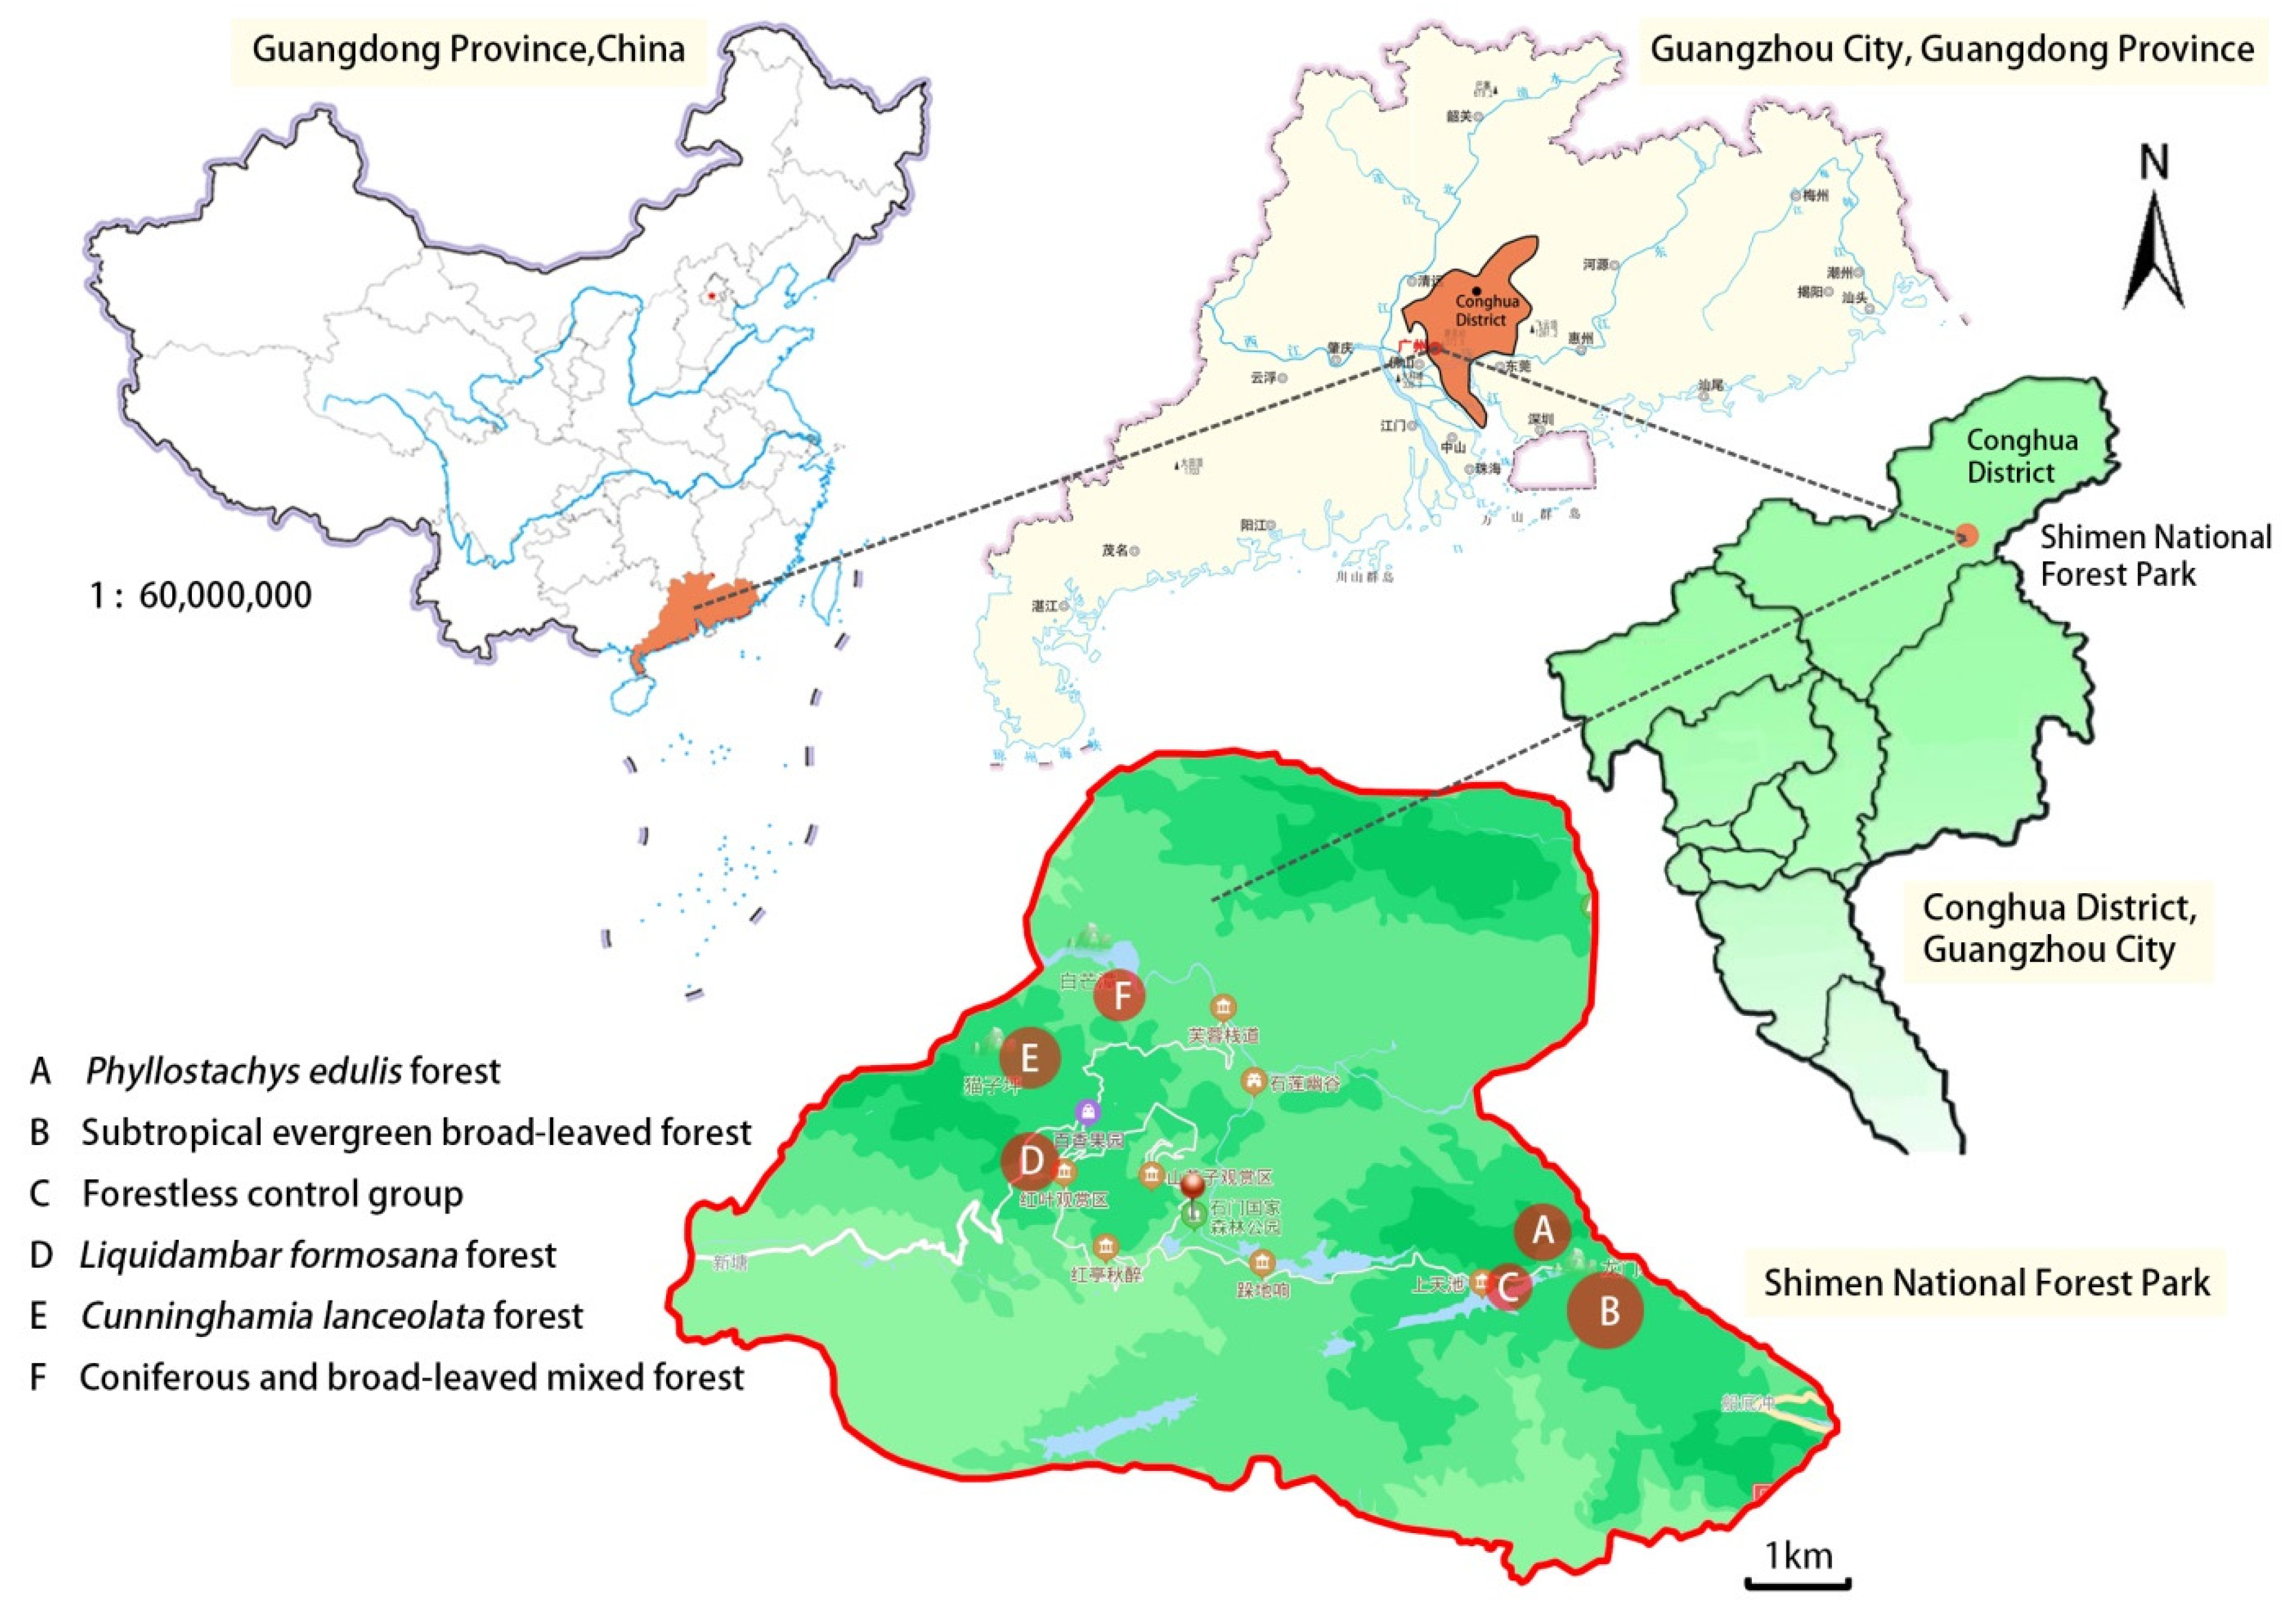
2.1. Study Area

Shimen National Forest Park is located in the northeast part of Conghua District, Guangzhou City, Guangdong Province, China (23°36′50 ″N~23°39′20″ N, 113°46′16 ″E~113°49′17″ E), see Figure 1. It has a total area of 26.36 square kilometers, with a forest coverage rate of 98.91%, which is China’s first international forest bathing beach and also one of the first forest therapy tourism bases in Guangdong Province. The landform types of Shimen National Forest Park are mainly middle mountain, low mountain and hill, and its altitude ranges from 270 m to 1210 m. The terrain is high in the southeast, low in the northwest, surrounded by mountains in the north, east and south. Shimen National Forest Park is located at the northern edge of the tropic of cancer, with a south subtropical monsoon climate, which has wet, scorching summers and mild, sunny winters. The average air temperature fluctuates between 19.5 °C to 21.4 °C, where the coldest days are in January with an average temperature of 12.4 °C, and the hottest days are in July with an average temperature of 28.5 °C. Sunshine is plentiful all year;the mean annual solar radiation is approximately 440,870 J/cm2. The subtropical monsoon brings abundant rainfall with a long rainy season from May to August, and the annual average rainfall is about 1800 mm.

2.2. Plot Settings

There were five forest types and a forestless control group considered in this study; the details are presented in Table 1 and Figure 2. In the forestless control group, we selected three sample points in open spaces with no tree layer, mainly herbs and very close to the water (about 30 m). In the Phyllostachys edulis forest plots, we selected four sample points inside the forest. Its vegetation was mainly Phyllostachys edulis and a small number of herbs. Four sample points were selected inside the subtropical evergreen broad-leaved forest, which was mainly mingled with Machilus breviflora, Machilus Chekiangensis, Machilus chinensis, Diospyros morrisian, Lithocarpus corneus, Michelia maudiae, Sapium sebiferum, Manglietia pachyphylla, Bretschneidera sinensis, etc., with undergrowth of Melastoma candidum, Rhodomyrtus tomentosa, Melastoma dodecandrum, Sarcandra glabra, Lobelia angulata, Senecio scandens, Mucuna birdwoodiana, etc. In the Liquidambar formosana forest plots, we selected three sample points inside the forest. Its tree layer was exclusively Liquidambar formosana, with undergrowth of Lophatherum gracile. In the Cunninghamia lanceolata forest plots, we selected three sample points inside the forest. Its tree layer was exclusively Cunninghamia lanceolata, with undergrowth of Lophatherum gracile, Blechnum orientale, Pteris semipinnata, etc. Three sample points were set up inside the coniferous and broad-leaved mixed forest, in which the tree layer was mainly mingled with Liquidambar formosana (taking up 40%) and Cunninghamia lanceolata (accounting for 60%), with undergrowth of Callicarpae formosanae, Lophatherum gracile, Blechnum orientale, Nephrolepis auriculata, Gleichenia linearis, etc.

2.3. Methods

2.3.1. Observation Methods

Observations of sunny and stable weather-related data were conducted from September 2019 to January 2020 and May to August 2020. The field data were measured for three consecutive days at the end of each month. Due to the influence of the COVID-19 pandemic, research data from February to April 2020 are missing. Synchronous observations were performed in the morning (9:00–11:00), noon (12:00–14:00) and afternoon (15:00–17:00) of each test day. Four indices of negative air ion concentration (NAIC), air oxygen content (AOC), forest microclimate and phytoncide relative content (PRC) were measured in the five forested stands and the forestless control group. The negative air ion concentration was investigated by a unified corrected COM-3200PRO II negative ion monitor produced in Japan with an observation range of 10−1.999 × 10⁶ ions/cm3. Its measurement accuracy is ±10%; its mobility is ±10%. The data were measured 1.5 m from the ground, which was basically consistent with the adult breathing height. When the instrument was stable at each observation point, we read the data in four directions (east, south, west, north) and repeated it three times after zeroing. With a total of twelve data points, we obtained the negative air ion concentration by taking the average value. The oxygen content was measured by a TD6000-SH-O2 oxygen content tester produced in China, which was repeated 3 times. Each instrument was corrected before measurement. The forest microclimate was measured with Kestrel 5500 hand-held meteorological instrument produced in the USA; synchronous monitoring data included three environmental factors, namely temperature (T), relative humidity (RH) and wind speed (V), which were each repeated three times. The sampling height of wind speed was 2 m. The relative content of phytoncide was tested by the open, dynamic headspace adsorption collection method. The phytoncide collection devices provided by South China Botanical Garden, Chinese Academy of Sciences, which were hung at 1.5 m in the forest at the average breathing height of the human body, needed to work continuously for at least 8 h from 9:00 to 17:00. The experimental instruments mentioned above are shown in Figure 3.

2.3.2. Specific Calculation Methods

(1) Air oxygen content
In order to eliminate the influence of altitude on air oxygen content, the measured value was corrected according to the fact that the air oxygen content decreases by 0.16% every 100 m above sea level [25]. The correction formula used was:
correction value = measured value + altitude/100 × 0.16
(2) Human comfort index
Lu Dinghuang [26] used the relevant data of environmental hygiene methods to comprehensively consider the influence of temperature, relative humidity and wind speed on the human comfort index, which was frequently used. Therefore, the human comfort index proposed by Lu Dinghuang was used in this study, and the formula for calculating the human comfort index was as follows:
HCI = 0.6 × |T − 24| + 0.07 × |RH − 70| + 0.5 × |V − 2|
In the formula, HCI is the human comfort index, T is the temperature (°C), RH is relative humidity (%), and Vis wind speed (m/s). The lower the HCI value, the higher the comfort level. Among them, “S ≤ 4.55” denotes a very comfortable level, “4.55 < S ≤ 6.95” represents a comfortable level, “6.95 < S ≤ 9.00” indicates an uncomfortable level, “S > 9.00” means extremely uncomfortable.
(3) Phytoncide relative content
The adsorption tube was properly sealed and preserved after the phytoncide gas was collected, eluted with dichloromethane solution in time, and then analyzed those processed samples with a gas chromatography–mass spectrometry (GC–MS). The test instrument model was Agilent 7890B-5977B/GC–MS, which is manufactured by Agilent in the USA. GC working conditions were as follows: The chromatographic column was HP-5MS elastic quartz capillary column (30 m, 0.25 mm, 0.25 μm). The temperature program for Volatile Organic Chemicals (VOCs) were: initial temperature 50 °C and kept for 2 min, 50 °C to 200 °C at 10 °C/min, 200 °C to 280 °C at 30 °C/min, held 2 min, 280 °C to 300 °C at 40 °C/min for 10 min. The carrier gas was helium, and the sample injection volume was 1 μL. The split ratio was 20:1, the inlet temperature was 250 °C, and the split flow was 20 mL/min. MS working conditions were as follows: electron energy was 70 eV, transmission line temperature was 250 °C, and ion source temperature was 230 °C. The scanning mode was full ion scanning, and the quality scanning range was m/z 25–500 u. The total ion flow diagram was obtained by TM Software4.0, and the chemical information represented by each peak was confirmed and screened by searching the NIST standard spectrum library by computer. The volatile organic compounds were determined by consulting a relevant chemical dictionary or referring to relevant data for final confirmation and screening, and the relative content of phytoncide components of each plant was calculated by combining the peak area normalization method.

2.3.3. Multiple Indicators Comprehensive Evaluation Methods

(1) Data standardization
According to the effects of each index on environmental quality, the above four indexes were divided into positive and negative indices. Positive indicators meant that the greater the value, the better the healthcare benefits. In this study, positive indicators were negative air ion concentration, air oxygen content and phytoncide relative content. The negative index meant that the greater the value, the worse the healthcare benefits. The negative index in this study was the human comfort index. In order to bring it into a unified evaluation system for comparison, the range normalization method was adopted for standardization, and the calculation formula was:
positive indicator: indicator score = (current value − minimum)/(maximum–minimum)
negative indicator: indicator score = (maximum − current value)/(maximum–minimum)
(2) Principal component analysis and weight determination
Through standardization, the original value was unified to the dimensionless 0–1, which eliminated the difference of each index’s influence on healthcare benefits. Using SPSS20.0, the original data were standardized and analyzed by principal component analysis, with a Kaiser-Meyer-Olkin (KMO) value of 0.504 and a significance of 0.000. According to the requirements of the KMO value range suitable for principal component analysis, the degree of principal component analysis in this study was “average”, and the weight can be basically calculated by principal component analysis. As shown in Table 2, the original four environmental indicators could be summarized into two principal components. The cumulative contribution rate of these two principal components reached 85.237%, more than 80%, which can better reflect the information of all indicators. The two principal components were linearly combined as follows:
F1 = −0.302X1 + 0.71X2 + 0.411X3 + 0.185X4
F2 = 0.754X1 − 0.299X2 − 0.016X3 + 0.379X4
(3) Establishing forest comprehensive healthcare index
A comprehensive evaluation index of the forest environmental healthcare benefits was named the “forest comprehensive healthcare index” (FCHI), with the specific calculation formula of FCHI was as follows:
FCHI = 0.1 NAICi + 0.35 AOCi + 0.27 HCIi + 0.28 PRCi (i = 1, 2, 3, …… n)
(In the formula, NAICi is the normalized value of negative air ion concentration at the i-th observation site. OCi is the normalized value of air oxygen content at the i-th observation site. HCIi is the normalized value of the human comfort index at the i-th observation site. PRCi w is as the normalized value of the phytoncide relative content at the i-th observation site)
(4) Evaluation criteria of the forest comprehensive healthcare index
In SPSS20.0, Ward and Euclidean distance methods were used to analyze FCHI values systematically, and a tree diagram of Ward connections was obtained (Figure 4). Combined with literature research and practical needs, the red line was taken as a reference line and divided into five grades according to the value from high to low. The strength of the comprehensive healthcare benefits represented by different numerical intervals was explained; thus, a grading standard of comprehensive evaluation index of the forest environmental healthcare benefits was gained (Table 3).

2.3.4. Data Processing and Analysis

SPSS20.0 was used for variance analysis, multiple comparisons, principal component analysis and systematic cluster analysis; Origin 2021 was used to draw the chart. Due to the impacts of the COVID-19 epidemic, the data of February–April 2020 are missing. Therefore, the spring data are only represented by May 2020. The summer data came from June to August 2020; the autumn data are derived from September to November 2019, and the winter data are derived from December 2019 and January 2020.

3. Results

3.1. Characteristics of Negative Air Ion Concentration in Different Forest Types in Different Seasons

According to the analysis of variance, the negative air ion concentration in different forest types showed a strongly significant difference (p = 0.000 < 0.01) in different seasons (Figure 5). In spring, the order according to the negative air ion concentration mean value (±SD) was: subtropical evergreen broad-leaved forest (7394 ± 1811 ions/cm3) > Phyllostachys edulis forest (2644 ± 1044 ions/cm3) > Cunninghamia lanceolata forest (2461 ± 709 ions/cm3) > coniferous and broad-leaved mixed forest (2373 ± 562 ions/cm3) > Liquidambar formosana forest (1823 ± 650 ions/cm3) > forestless control group (1158 ± 430 ions/cm3). In summer, the order was: subtropical evergreen broad-leaved forest (8377 ± 3749 ions/cm3) > Phyllostachys edulis forest (4257 ± 2021 ions/cm3) > Cunninghamia lanceolata forest (2930 ± 1917 ions/cm3) > coniferous and broad-leaved mixed forest (2907 ± 2012 ions/cm3) > Liquidambar formosana forest (2529 ± 1996 ions/cm3) > forestless control group (1386 ± 556 ions/cm3). In autumn, the order was: subtropical evergreen broad-leaved forest (7234 ± 3465 ions/cm3) > Phyllostachys edulis forest (2589 ± 1028 ions/cm3) > Cunninghamia lanceolata forest (1671 ± 631 ions/cm3) > coniferous and broad-leaved mixed forest (1623 ± 643 ions/cm3) > Liquidambar formosana forest (1247 ± 693 ions/cm3) > forestless control group (941 ± 287 ions/cm3). In winter, the order was: subtropical evergreen broad-leaved forest (5409 ± 2567 ions/cm3) > Phyllostachys edulis forest (2131 ± 855 ions/cm3) > Cunninghamia lanceolata forest (2057 ± 620 ions/cm3) > coniferous and broad-leaved mixed forest (1943 ± 648 ions/cm3) > Liquidambar formosana forest (1726 ± 644 ions/cm3) > forestless control group (862 ± 413 ions/cm3).

3.2. Characteristics of Air Oxygen Content in Different Forest Types in Different Seasons

According to the analysis of variance, the air oxygen content of different stands demonstrated strongly significant differences (p = 0.000 < 0.01) in different seasons (Figure 6). In spring, the order was: coniferous and broad-leaved mixed forest (21.210%) > Cunninghamia lanceolata forest (21.155%) > Liquidambar formosana forest (21.072%) > Phyllostachys edulis forest (21.053%) > subtropical evergreen broad-leaved forest (21.000%) > forestless control group (20.936%). In summer, the order was: coniferous and broad-leaved mixed forest (21.807%) > Cunninghamia lanceolata forest (21.652%) > Liquidambar formosana forest (21.589%) > Phyllostachys edulis forest (21.517%) > subtropical evergreen broad-leaved forest (21.449%) > forestless control group (21.338%). In autumn, the order was: coniferous and broad-leaved mixed forest (21.170%) > Cunninghamia lanceolata forest (21.083%) > Liquidambar formosana forest (21.030%) > Phyllostachys edulis forest (20.997%) > subtropical evergreen broad-leaved forest (20.955%) > forestless control group (20.898%). In winter, the order was: coniferous and broad-leaved mixed forest (20.927%) > Cunninghamia lanceolata forest (20.893%) > Liquidambar formosana forest (20.858%) > Phyllostachys edulis forest (20.745%) > subtropical evergreen broad-leaved forest (20.726%) > forestless control group (20.631%).

3.3. Characteristics of Human Comfort Index in Different Forest Types in Different Seasons

It is clear that the temperature in the five forest types and forestless control group was highest in summer, followed by spring and autumn, and lowest in winter (Figure 7). In addition, the relative humidity was highest in spring, followed by summer and winter, and lowest in autumn from the vast majority of the forest types, excluding Phyllostachys edulis forest, in which relative humidity in autumn was higher than in winter, as can be seen from Figure 8. The wind speed of the forestless control group was significantly higher than the other five stands throughout the year. Simultaneously, the wind speed of most stands in spring and summer was higher than that in autumn and winter (Figure 9).
The human comfort index of different forest types and forestless control group were calculated by formula 2 (HCI = 0.6 × |T − 24| + 0.07 × |RH − 70| + 0.5 × |V − 2|) mentioned above. Through variance analysis, the human comfort index of five forest types and forestless control group indicated a highly significant difference (p = 0.000 < 0.01) in different seasons (Figure 10). In spring, the order was: Phyllostachys edulis forest (2.80) > subtropical evergreen broad-leaved forest (2.97) > Liquidambar formosana forest (3.54) > forestless control group (3.63) > Cunninghamia lanceolata forest (4.02) > coniferous and broad-leaved mixed forest (4.36). In summer, the order was: Phyllostachys edulis forest (2.78) > subtropical evergreen broad-leaved forest (2.81) > Liquidambar formosana forest (3.96) > Cunninghamia lanceolata forest (4.29) > coniferous and broad-leaved mixed forest (4.51) > forestless control group (4.85). In autumn, the order was: coniferous and broad-leaved mixed forest (3.06) > Liquidambar formosana forest (3.16) > Cunninghamia lanceolata forest (3.19) > subtropical evergreen broad-leaved forest (3.38) > Phyllostachys edulis forest (3.40) > forestless control group (4.89). In winter, the order was: coniferous and broad-leaved mixed forest (3.87) > Cunninghamia lanceolata forest (3.97) > Liquidambar formosana forest (4.45) > Phyllostachys edulis forest (5.77) > subtropical evergreen broad-leaved forest (5.93) > forestless control group (6.20). Throughout the whole year, all forest types and the forestless group were at a comfortable level and above.

3.4. Characteristics of Phytoncide Relative Content in Different Forest Types in Different Seasons

The relative content analysis of phytoncide in spring revealed that 6 classes of 16 species of phytoncide substances were co-volatilized from the five forest types (Table 4, Figure 11). Among them, 9 species (8.66%) were discharged from the Phyllostachys edulis forest, mainly alcohols (2.88%), ketones (2.54%) and terpenes (1.78%). The subtropical evergreen broad-leaved forest yielded 14 species (17.44%), principally including acids (5.54%), terpenes (4.26%), alcohols (3.21%), ketones (2.92%). There were 12 species (7.44%) released from the Liquidambar formosana forest, primarily involving alcohols (2.18%), esters (1.88%), terpenes (1.38%) and ketones (1.1%). The Cunninghamia lanceolata forest liberated 10 species (11.67%), chiefly containing alcohols (4%), terpenes (2.49%), ketones (2.26%) and esters (2.02%). The coniferous and broad-leaved mixed forest released 11 species (9.61%), mostly ketones (2.82%), terpenes (2.5%), alcohols (2.07%) and esters (1.03%).
The relative content analysis of phytoncide in summer revealed that 6 classes of 78 species of phytoncide substances were co-volatilized from the five forest types (Table 5, Figure 11). Among them, 45 species (35.64%) were discharged from the Phyllostachys edulis forest, mainly terpenes (12.78%) and alcohols (11.1%). The subtropical evergreen broad-leaved forest yielded 64 species (63.32%), principally including terpenes (18.59%), alcohols (17.98%), esters (9.48%) and acids (8.41%). There were 41 species (30.81%) released from the Liquidambar formosana forest, primarily involving alcohols (8.62%), terpenes (8.09%), ketones (5.81%) and esters (5.01%). The Cunninghamia lanceolata forest liberated 42 species (44.26%), chiefly containing esters (17.09%), terpenes (10.37%) and alcohols (8.47%). The coniferous and broad-leaved mixed forest released 47 species (33.69%), mostly terpenes (16.59%), alcohols (6.63%) and aldehydes (3.96%).
The relative content analysis of phytoncide in autumn revealed that 6 classes of 59 species of phytoncide substances were co-volatilized from the five forest types (Table 6, Figure 11). Among them, 17 species (7.77%) were discharged from the Phyllostachys edulis forest, mainly terpenes (4.53%) and ketones (2.68%). The subtropical evergreen broad-leaved forest yielded 46 species (26.74%), principally including terpenes (12.6%), aldehydes (4.68%), esters (4.55%) and acids (2.86%). There were 22 species (11.02%) released from the Liquidambar formosana forest, primarily involving terpenes (4.72%), aldehydes (2.41%) and esters (2.36%). The Cunninghamia lanceolata forest liberated 20 species (13.06%), chiefly containing terpenes (9.62%) and esters (2.24%). The coniferous and broad-leaved mixed forest released 16 species (10.45%), mostly terpenes (9.33%).
The relative content analysis of phytoncide in winter demonstrated that 5 classes of 13 species of phytoncide substances were co-volatilized from the five forest types (Table 7, Figure 11). Among them, 7 species (2.87%) were discharged from the Phyllostachys edulis forest, mainly esters (1.21%). The subtropical evergreen broad-leaved forest yielded 13 species (9.7%), primarily including terpenes (4.99%), alcohols (1.77%), esters (1.28%) and acids (1.08%). There were 5 species (2.23%) released from the Liquidambar formosana forest, principally alcohols (1.37%). The Cunninghamia lanceolata forest liberated 8 species (5.22%), chiefly containing terpenes (2.8%), alcohols (1.2%) and esters (1.2%). The coniferous and broad-leaved mixed forest released 6 species (2.47%), mostly alcohols (1.27%).
According to variance analysis, the mean value of relative content of phytoncide in different forest types illuminated extremely significant differences (p = 0.000 < 0.01) in different seasons (Figure 11). In spring, the order was: subtropical evergreen broad-leaved forest (17.44%) > Cunninghamia lanceolata forest (11.67%) > coniferous and broad-leaved mixed forest (9.61%) > Phyllostachys edulis forest (8.66%) > Liquidambar formosana forest (7.44%) > forestless control group (0.00%). In summer, the order was: subtropical evergreen broad-leaved forest (21.11%) > Cunninghamia lanceolata forest (14.75%) > Phyllostachys edulis forest (11.88%) > coniferous and broad-leaved mixed forest (11.23%) > Liquidambar formosana forest (10.27%) > forestless control group (0.00%). In autumn, the order was: subtropical monsoon evergreen broad-leaved forest (8.91%) > Cunninghamia lanceolata forest (4.35%) > Liquidambar formosana forest (3.67%) > coniferous and broad-leaved mixed forest (3.48%) > Phyllostachys edulis forest (2.59%) > forestless control group (0.00%). In winter, the order was: subtropical evergreen broad-leaved forest (4.85%) > Cunninghamia lanceolata forest (2.61%) > Phyllostachys edulis forest (1.44%) > coniferous and broad-leaved mixed forest (1.24%) > Liquidambar formosana forest (1.16%) > forestless control group (0.00%). In addition, there are wide differences in phytoncide substances emitted from forests in different seasons. Mainly alcohols, terpenes, ketones and acids in spring. Terpenes, alcohols and esters were primary volatilized in summer. Terpenes were the dominating species in autumn, and very little phytoncide substances were discharged in winter, among, which terpenes account for the highest proportion.

3.5. Evaluation of Comprehensive Healthcare Benefits of Different Forest Types

The values of four environmental healthcare indicators in different seasons were normalized in accordance with the abovementioned formulas (3) and (4). At the same time, in terms of the forest comprehensive healthcare index (FCHI) mentioned in the research methods, the comprehensive healthcare benefits of each stand were evaluated (Table 8). From the table below, according to the FCHI values, the five forest types were all at level I in spring and summer, while the forestless control group at level II. This meant that in spring and summer, the comprehensive healthcare benefits of five forest types were all very strong, which was extremely beneficial to human health. Meanwhile, the comprehensive healthcare benefits of the forest control group were strong as well. In autumn, the subtropical evergreen broad-leaved forest and coniferous and broad-leaved mixed forest were at level I, which had extremely strong healthcare benefits. In addition, Phyllostachys edulis forest, Liquidambar formosana forest and Cunninghamia lanceolata forest were at level II, which had strong healthcare benefits. Moreover, the forestless control group was at the III level; its’ healthcare benefits were weak. In winter, Liquidambar formosana forest and Cunninghamia lanceolata forest and coniferous and broad-leaved mixed forest were at level II, which had a strong healthcare benefit. The subtropical evergreen broad-leaved forest and Phyllostachys edulis forest were at level III, and their healthcare benefits were weak. The forestless control group was at level V, having null healthcare benefits.
In general, the comprehensive healthcare benefits of five forest types and a forestless control group was very strong in spring and summer, followed by autumn and the worst in winter. From the comprehensive data of the whole year, the coniferous and broad-leaved mixed forest is most suitable for the forest recreational and healthcare activities, second, by the subtropical evergreen broad-leaved forest. Moreover, the comprehensive healthcare index of the coniferous and broad-leaved mixed forest was at the “I” very strong level in spring, summer and autumn, except in winter at the “II” strong level. While subtropical evergreen broad-leaved forest at the “I” very strong level in the first three quarters, “III” weak level in winter.

4. Discussion

4.1. Characteristics of Negative Air Ion Concentration (NAIC) Differences in Different Forest Types

4.1.1. Seasonal Variation

Our results demonstrated large seasonal differences in NAIC of five forest types and forestless control group in the Shimen National Forest Park. The seasonal variation of NAIC in Phyllostachys edulis forest, subtropical evergreen broad-leaved forest and forestless control group were summer > spring > autumn > winter, while Liquidambar formosana forest, Cunninghamia lanceolata forest and coniferous and broad-leaved mixed forest were summer > spring > winter > autumn. Generally speaking, NAIC in summer and spring were higher than that in autumn and winter. This finding contrasts with some previous studies in temperate regions that reported the higher NAIC in the summer and autumn, while the lower in the spring and winter [27]. This difference can be explained by the source of negative air ions, which naturally occurred from ultraviolet radiation, photosynthesis, etc. [28]. The stronger solar radiation and photosynthesis, the higher NAIC [29]. In addition, According to the generation mechanism of negative air ions, the main forms of negative air ions were O2·(H2O)n, OH·(H2O)n, CO4·(H2O) n, etc. and negative air ions can be formed only with certain water content in the environment [30,31]. The relationship between NAIC and humidity has long been a focus of research; different scholars [32,33,34,35,36] have studied this dynamic problem and have reached a more general conclusion, namely, that the relationship between NAIC and humidity was positive, more important, the most significant meteorological factor affecting NAIC was the air relative humidity. When the humidity is high, the amount of OH·(H2O)n increases, and with humidity increased, NAIC rises continuously [29]. In summer, strong solar radiation, high relative humidity, vigorous plant physiological activities and strong photosynthesis promote the production of negative air ions. Meanwhile, Shimen National Forest Park, located in the south subtropical zone, warmed up earlier in spring when trees entered the growing season, with lush foliage and enhanced photosynthesis. Therefore, its observation results were higher than those in autumn and winter when trees were close to withering, with heaps of fallen leaves and reduced photosynthesis. As can be seen from Figure 6, the relative humidity in spring was highest, followed by summer, which was 15–30% higher than that in autumn and winter. Thus, the NAIC in summer and spring was higher than that in autumn and winter.

4.1.2. Stands Difference

The different forest types were widely separated in terms of NAIC. It was clear that the NAIC of five forest types was remarkably higher than that in the forestless control group. This finding was consistent with most academics [29,37,38]. The NAIC in the subtropical evergreen broad-leaved forest was approximately 2–4 times that of the other four stands, which may be related to natural forest community structure, forest area, canopy density and forest community leaf area index, etc. Previous studies have found that the higher canopy density [39], the larger community leaf area index [40], and the more complicated forest community structure [41], the higher NAIC. This was also consistent with the research conclusions of some researchers [41,42,43]: the NAIC of the natural forest was higher than that of the artificial forest. The NAIC in the mature forest was the highest, followed by middle-aged forest and the lowest in young forest. Therefore, as the subtropical evergreen broad-leaved forest is a natural and mature forest, there was no doubt that NAIC produced by it was much higher than that in the other four artificial stands.
In the artificial forest, the NAIC of Phyllostachys edulis forest was significantly higher than that of the other three stands, which was consistent with the research conclusion of Qin Jun et al. [44]. This perhaps accounts for the larger leaf area index and higher biomass and canopy density of Phyllostachys edulis forest. Plants can produce higher NAIC through photosynthesis and gas exchange [45]. Phyllostachys edulis forest with lush branches and straight trunks were beneficial to photosynthesis and gas exchange. However, there was very little distinction between the NAIC of Cunninghamia lanceolata forest and coniferous and broad-leaved mixed forest (p > 0.05). In spring and autumn, the NAIC of Cunninghamia lanceolata forest and coniferous and broad-leaved mixed forest were higher than Liquidambar formosana forest (p < 0.05), while in summer and winter, the three forest types without differences. This conclusion is in contrast with some scholars [37,42,46] who have advocated the NAIC of the broad-leaved forest is higher than coniferous and broad-leaved mixed forest and coniferous forest. A possible cause might be Liquidambar formosana forest in the young forest, with lower canopy density, which was not conducive to producing negative air ions.

4.2. Characteristics of Air Oxygen Content Differences in Different Forest Types

Overall, the variation of air oxygen content in different forest types showed consistency throughout the different seasons, namely, summer > spring > autumn > winter. This finding is in accord with the views of Li Chunhua [47]. The air oxygen content has a very significant positive correlation with air temperature and light intensity [48], a significant negative correlation with air humidity [49]. The correlation coefficient between air oxygen content and meteorological factors was air temperature > air humidity > light intensity [48]. Seasonal variation of air oxygen content in the forest community was not only related to meteorological factors but also related to its growth cycle. In spring and summer, when trees are in the growing season with high light intensity, sufficient sunlight, larger canopy density and vegetation coverage, vegetation has strong photosynthesis and releases more oxygen into the atmospheric environment. This is particularly the case in spring, with the highest humidity all around the year, in which air oxygen content is lower than that in summer. Although there was no deciduous period for vegetation in Shimen National Forest Park, and the forest community still carries out photosynthesis, though the physiological activity of plants in autumn and winter is correspondingly weakened, and the light time and temperature are reduced gradually, which retards the activity of photosynthetic enzymes. These factors all lead to the seasonal differences in oxygen content in the forest communities. Meanwhile, relevant studies had shown that the oxygen content in the air generally accounts for 20.9% of the air volume [22,50]. The air oxygen content of different forest types in spring, summer and autumn were higher than 20.9%, except winter. This also reflected that Shimen National Forest Park was just like an enormous forest oxygen bar, whose forest environment was conducive to human health.
As can be seen from Figure 4, the air oxygen content in different forest types was as follows: coniferous and broad-leaved mixed forest > Cunninghamia lanceolata forest > Liquidambar formosana forest > Phyllostachys edulis forest > subtropical evergreen broad-leaved forest > forestless control group, which coniferous and the broad-leaved mixed forest was the highest all year round. Consistent with the relationship of the air oxygen content with tree age, the oxygen content was positively correlated with the forest ages in the middle and young forest stage but negatively correlated after the trees mature. Therefore, the oxygen concentration in different forest types of the environment increased with the increase of the forest’s age and gradually decreased with the age of trees after they matured [25]. Hence, subtropical evergreen broad-leaved forest as the mature forest, which ability to release oxygen was worse than the other four stands.

4.3. Characteristics of Human Comfort Index Differences in Different Forest Types

In general, compared to the forestless control group, five forest types done well in the human comfort index. The forestless control group lacked the shelter of trees, the temperature and humidity changed greatly, the wind speed was higher; indisputably, its environment was less comfortable in contrast with the forest surroundings. People reached a consensus in the conclusion that the forest environment plays a better role in regulating microclimate than forestless [23,51,52]. The human comfort index of the five stands varied significantly in different seasons. In spring and summer, the Phyllostachys edulis forest and subtropical evergreen broad-leaved forest were more comfortable than Liquidambar formosana forest, Cunninghamia lanceolata forest and coniferous and broad-leaved mixed forest. While in autumn and winter, it was in reverse. Among them, the human comfort index of Phyllostachys edulis forest and subtropical evergreen broad-leaved forest were most comfortable in summer, while Liquidambar formosana forest, Cunninghamia lanceolata forest and coniferous and broad-leaved mixed forest are done best in autumn. Most researchers manifested that different microclimate elements had various influences on the human comfort index, among which air temperature had the greatest impact on the human comfort index [24,53,54]. The attitude of Phyllostachys edulis forest and subtropical evergreen broad-leaved forest was approximately 800 m, which cold in winter and cool in summer. It is mainly affected by its temperature, which forest circumstances were more comfortable in warm seasons and less comfortable in chill seasons. Liquidambar formosana forest, Cunninghamia lanceolata forest and coniferous and broad-leaved mixed forest were located in about 290–450 m. In summer, three forest types with high-temperature, which was less comfortable than that in autumn.

4.4. Characteristics of Phytoncide Relative Content Differences in Different Forest Types

Biogenic volatile organic compounds vary widely between plant species and vegetation types [55]. This conclusion was also found in this paper. There were great differences in the phytoncide relative content and species volatilized by five stands in different seasons, from the mean, summer > spring > autumn > winter. The temperature had a crucial effect on the release of phytoncide in terms of environmental factors, and there was a positive correlation between phytoncide volatilization and temperature [56,57,58,59,60]. In general, phytoncide relative content gradually increased when the temperature rose. The main reason was that the activity of synthetase was affected by temperature. This directly led to the obvious seasonal variation in phytoncide emissions. In addition, Light had an effect on plant photosynthesis rate, transpiration rate and stomatal conductance [61]. The light intensity had a sharp influence on the release of phytoncide, and its release rose with the increase of light intensity [60,62,63]. Hence, summer with higher temperature and ample sunlight, in which five forest stands emitted more phytoncide, followed by spring.
Furthermore, there were great differences in phytoncide substances emitted from forests in different seasons. This confirmed the views of Xu Jiehua [64]: different enzymes have different responses to temperature, and the components of phytoncide volatilized from forests are various under different temperature conditions. Among the five stands, the species and relative content of phytoncide in the subtropical evergreen broad-leaved forest were apparently higher than those in the other stands, which may be related to the mature and natural secondary forest community, with rich vegetation types, complete community structure, high forest coverage and canopy density, which can produce more species and relative content of phytoncide. The majority of scholars [65,66,67] commonly asserted that tree species play a decisive role in the phytoncide components and the emission rate. Tree age and plant development stage also had a certain impact on phytoncide components and their content.

5. Conclusions

The forest comprehensive healthcare index (FCHI) was established by using the principal component analysis method, including negative air ion concentration, air oxygen content, human comfort index and phytoncide relative content. Moreover, the evaluation criteria were divided by using the method of system cluster analysis. It provides a theoretical basis for the comprehensive evaluation of the forest healthcare benefits, which is conducive to in-depth research of the forest health environment in the future. To sum up, the FCHI of five stands, which ranged evidently in different seasons, preceded a distinctly forestless control group in the whole year. The forest environment has a favorable influence on the human body and mind, so it is suggested that citizens go to the forest environment persistently for healthcare and physical and mental washing. Moreover, five forest types were all suitable to conduct forest therapy in spring and summer, followed by autumn, and the FCHI in winter were poorer. From the comprehensive data of all years, the coniferous and broad-leaved mixed forest is most suitable for the forest recreational and healthcare activities, followed by the subtropical evergreen broad-leaved forest. Therefore, when planning and constructing the forest therapy base in Shimen National Forest Park in the future, the coniferous and broad-leaved mixed forest should be allocated more in the stand transformation to improve forest healthcare benefits. We should focus on protecting and developing the landscape resources of the subtropical evergreen broad-leaved forest and make rational use of their health activity space.
In this paper, the comprehensive healthcare benefits of different stands in Shimen National Forest Park were analyzed and discussed in depth. Future research work can be carried out from the following aspects: (1) To fully explore the healthcare benefits of the forest, besides the environmental indicators monitored in this paper, other environmental indicators should also be considered, such as air particulate matter and air bacteria content. (2) The healthcare benefits of the forest ultimately affect the human body. Therefore, we should link forests with human health and study the physical and mental healthcare benefits of different forest communities. (3) In this study, all data were monitored in the forest, but the forest edge is the primary area where people carry out forest recreation activities, so it is necessary to pay attention to the experimental gradient inquiry of the forest edge healthcare benefits subsequently.

Author Contributions

Experimental design: S.-x.Z., Q.Q., Q.H., Y.S. and J.-y.L.; field investigation and laboratory experiments: S.-x.Z., S.-y.H. and F.-f.H.; data analysis: S.-x.Z.; drafting manuscript: S.-x.Z.; critical reading: Q.Q., Q.H. and J.-y.L. All authors have read and agreed to the published version of the manuscript.

Funding

This research was financially supported by the National Natural Science Foundation of China (Grant number: 32001246); Guangdong Provincial Forestry Science and Technology Innovation Project (Grant number: 2018KJCX012).

Conflicts of Interest

The authors declare that they have no conflict of interest.

References

  1. Chen, W.; Zheng, R.; Zhang, S.; Zeng, H.; Zuo, T.; Xia, C.; Yang, Z.; He, J. Cancer incidence and mortality in China in 2013: An analysis based on urbanization level. Chin. J. Cancer Res. 2017, 29, 1–10. [Google Scholar] [CrossRef]
  2. Huang, H.; Shi, J.; Guo, L.; Zhu, X.; Wang, L.; Liao, X.; Liu, G.; Bai, Y.; Mao, A.; Ren, J.; et al. Expenditure and financial burden for common cancers in China: A hospital-based multicentre cross-sectional study. Lancet 2016, 388, S10. [Google Scholar] [CrossRef]
  3. UNWTO; GTERC. Asia Tourism Trends—2019 Edition, Executive Summary; World Tourism Organization and Global Tourism Economy Research Centre: Macau, China, 2019; Volume 10. [Google Scholar]
  4. Pu, B.; Zhang, L.; Wei, J. Chinese Consumers’ Perception on Forest Therapy. In Proceedings of the 2019 International Conference on Global Economy and Business Management (GEBM 2019), Chongqing, China, 29–30 November 2019. [Google Scholar]
  5. Park, B.; Tsunetsugu, Y.; Kasetani, T.; Hirano, H.; Kagawa, T.; Sato, M.; Miyazaki, Y.; Chiba, P.F.R.C.; Nagasaki, J.C.; Ministry, O.T.E.; et al. Physiological Effects of Shinrin-yoku (Taking in the Atmosphere of the Forest)—Using Salivary Cortisol and Cerebral Activity as Indicators. J. Physiol. Anthropol. 2007, 26, 123–128. [Google Scholar] [CrossRef] [PubMed] [Green Version]
  6. Grilli, G.; Sacchelli, S. Health Benefits Derived from Forest: A Review. Int. J. Envirion. Res. Pub. Health 2020, 17, 6125. [Google Scholar] [CrossRef] [PubMed]
  7. Hansen, M.M.; Jones, R.; Tocchini, K. Shinrin-Yoku (Forest Bathing) and Nature Therapy: A State-of-the-Art Review. Int. J. Environ. Res. Public Health 2017, 14, 851. [Google Scholar] [CrossRef] [Green Version]
  8. Li, Q. Effect of forest bathing (shinrin-yoku) on human health: A review of the literature. Santé Publique (Vandoeuvre-lès-Nancy, France) 2019, S1, 135–143. [Google Scholar] [CrossRef] [PubMed] [Green Version]
  9. Huang, Q.D.; Wu, Q.; Mao, G.X.; Wang, S.Y.; Jia, B.B.; Wang, G.F. Current Status of Forest Medicine Research in China. Biomed. Environ. Sci. 2018, 31, 551–554. [Google Scholar]
  10. Pino, O.; La Ragione, F. There’s Something in the Air: Empirical Evidence for the Effects of Negative Air Ions (NAI) on Psychophysiological State and Performance. Res. Psychol. Behav. Sci. 2013, 1, 48–53. [Google Scholar]
  11. Bowers, B.; Flory, R.; Ametepe, J.; Staley, L.; Patrick, A.; Carrington, H. Controlled trial evaluation of exposure duration to negative air ions for the treatment of seasonal affective disorder. Psychiatry Res. 2018, 259, 7–14. [Google Scholar] [CrossRef]
  12. Liu, R.; Lian, Z.; Lan, L.; Qian, X.; Chen, K.; Hou, K.; Li, X. Effects of negative oxygen ions on sleep quality. Proc. Eng. 2017, 205, 2980–2986. [Google Scholar] [CrossRef]
  13. Woo, J.; Lee, C.J. Sleep-enhancing Effects of Phytoncide via Behavioral, Electrophysiological, and Molecular Modeling Approaches. Exp. Neurobiol. 2020, 29, 120–129. [Google Scholar] [CrossRef] [PubMed]
  14. Antonelli, M.; Donelli, D.; Barbieri, G.; Valussi, M.; Maggini, V.; Firenzuoli, F. Forest Volatile Organic Compounds and Their Effects on Human Health: A State-of-the-Art Review. Int. J. Environ. Res. Pub. Health 2020, 17, 6506. [Google Scholar] [CrossRef] [PubMed]
  15. Hmamouchi, M.; Hamamouchi, J.; Zouhdi, M.; Bessiere, J.M. Chemical and Antimicrobial Properties of Essential Oils of Five Moroccan Pinaceae. J. Essent. Oil. Res. 2001, 13, 298–302. [Google Scholar] [CrossRef]
  16. Kim, C.; Cho, M.; Kim, J. Effects of Phytoncide Aromatherapy on Stress, Symptoms of Stress and Heart Rate Variability among Nursing Students. J. Korean Biol. Nurs. Sci. 2012, 14, 249–257. [Google Scholar] [CrossRef]
  17. Süntar, I.; Tumen, I.; Ustün, O.; Keleş, H.; Küpeli Akkol, E. Appraisal on the wound healing and anti-inflammatory activities of the essential oils obtained from the cones and needles of Pinus species by in vivo and in vitro experimental models. J. Ethnopharmacol. 2012, 139, 533–540. [Google Scholar] [CrossRef] [PubMed]
  18. Xie, Q.; Liu, Z.; Li, Z. Chemical Composition and Antioxidant Activity of Essential Oil of Six Pinus Taxa Native to China. Molecules 2015, 20, 9380–9392. [Google Scholar] [CrossRef] [PubMed] [Green Version]
  19. Abe, T.; Hisama, M.; Tanimoto, S.; Shibayama, H.; Mihara, Y.; Nomura, M. Antioxidant Effects and Antimicrobial Activites of Phytoncide. Biocontrol. Sci. 2008, 13, 23–27. [Google Scholar] [CrossRef] [Green Version]
  20. Li, Q.; Kobayashi, M.; Wakayama, Y.; Inagaki, H.; Katsumata, M.; Hirata, Y.; Hirata, K.; Shimizu, T.; Kawada, T.; Park, B.J.; et al. Effect of phytoncide from trees on human natural killer cell function. Int. J. Immunopathol. Pharmacol. 2009, 22, 951–959. [Google Scholar] [CrossRef] [PubMed]
  21. Woo, J.; Yang, H.; Yoon, M.; Gadhe, C.G.; Pae, A.N.; Cho, S.; Lee, C.J. 3-Carene, a Phytoncide from Pine Tree Has a Sleep-enhancing Effect by Targeting the GABAA-benzodiazepine Receptors. Exp. Neurobiol. 2019, 28, 593–601. [Google Scholar] [CrossRef] [Green Version]
  22. Santhosh, K.V.; Roy, B.K.; Bhowmik, P.K. Oxygen level monitoring in an oxygen cylinder. In Proceedings of the IEEE-International Conference on Advances in Engineering, Science and Management, ICAESM Nagapattinam, India, 30–31 March 2012; pp. 592–595. [Google Scholar]
  23. Rahman, M.A.; Hartmann, C.; Moser-Reischl, A.; von Strachwitz, M.F.; Paeth, H.; Pretzsch, H.; Pauleit, S.; Rötzer, T. Tree cooling effects and human thermal comfort under contrasting species and sites. Agric. For. Meteorol. 2020, 287, 107947. [Google Scholar] [CrossRef]
  24. Teshnehdel, S.; Akbari, H.; Di Giuseppe, E.; Brown, R.D. Effect of tree cover and tree species on microclimate and pedestrian comfort in a residential district in Iran. Build. Environ. 2020, 178, 106899. [Google Scholar] [CrossRef]
  25. Zhao, J.J.; Li, Y.M.; Tian, H.L.; Liu, Y.S.; Xiang, S.M. Analysis of oxygen content in forest environment in Qiannan Guizhou province. Shandong For. Sci. Technol. 2012, 42, 24–26. [Google Scholar]
  26. Lu, D.H.; Cui, S.; Li, C.H. The influence of Beijing urban greening and summer microelimatic conditions on human fitness. In Forestry and Metrology Papers; Meteorological Press: Beijing, China, 1984; pp. 144–152. [Google Scholar]
  27. Hong, L.X.C.J. The spatial-temporal pattern and influencing factors of negative air ions in urban forests, Shanghai, China. J. For. Res. 2014, 25, 847–856. [Google Scholar]
  28. Lin, H.; Lin, J. Generation and Determination of Negative Air Ions. J. Anal. Testing 2017, 1, 1–6. [Google Scholar] [CrossRef]
  29. Wang, H.; Wang, B.; Niu, X.; Song, Q.; Li, M.; Luo, Y.; Liang, L.; Du, P.; Peng, W. Study on the change of negative air ion concentration and its influencing factors at different spatio-temporal scales. Glob. Ecol. Conserv. 2020, 23, e1008. [Google Scholar] [CrossRef]
  30. Xing, G.W.; Li, Y.; Lin, J.M. Recent advances in generation and detection of gaseous negative ions. Chin. J. Anal. Labor. 2019, 38, 112–118. [Google Scholar]
  31. Li, S.N.; Han, S.W.; Shang, T.Y.; Lu, R.Q.; Zhang, Y.P.; Pan, Q.H.; Jin, W.M. Research progresson aero-anion’s monitoring and evaluation at home and abroad. J. Anhui Agric. Sci. 2009, 37, 3736–3738. [Google Scholar]
  32. Wang, J.M.; Yi, Z.J.; Sui, T.B.; Wang, J.; Jin, Z.Z. Influence of temperature and humidity on negative ion concentration. Res. Environ. Sci. 2004, 17, 68–70. [Google Scholar]
  33. Yu, H.; Xin, X.B.; Pei, S.X.; Wu, D.; Wu, S.; Fa, L.; Ma, S.M.; Guo, H. Characteristics of air anion change and its relationship with meteorological factors in forest margin area of Jiulong Mountain. Ecol. Sci. 2018, 37, 191–198. [Google Scholar]
  34. Wei, C.L.; Wang, J.T.; Jiang, Y.L.; Zhang, Q.G. Air negative charge ion concentration and its relationships with meteorological factors in different ecological functional zones of Hefei City. Chin. J. Appl. Ecol. 2006, 17, 2158–2162. [Google Scholar]
  35. Miao, S.; Zhang, X.; Han, Y.; Sun, W.; Liu, C.; Yin, S. Random Forest Algorithm for the Relationship between Negative Air Ions and Environmental Factors in an Urban Park. Atmosphere (Basel) 2018, 9, 463. [Google Scholar] [CrossRef] [Green Version]
  36. Luo, L.; Sun, W.; Han, Y.; Zhang, W.; Liu, C.; Yin, S. Importance Evaluation Based on Random Forest Algorithms: Insights into the Relationship between Negative Air Ions Variability and Environmental Factors in Urban Green Spaces. Atmosphere (Basel) 2020, 11, 706. [Google Scholar] [CrossRef]
  37. Feng, P.F.; Yu, X.W.; Zhang, X. Variations in Negative Air Ion Concentrations Associated with Different Vegetation Types and Influencing Factors in Beijing. Ecol. Environ. Sci. 2015, 24, 818–824. [Google Scholar]
  38. Liang, H.; Chen, X.S.; Da, L.J. Aero-Anion Dynamics and Its Influence Factors in Sheshan National Forest Park, Shanghai. Urb. Environ. Econ. 2014, 27, 7–11. [Google Scholar]
  39. Wu, C.C.; Zhong, L.S.; Liu, X.M. The influence of stand factors on aero-anion concentration in masson’ 5 pine pure forest. J. Cent. South For. Univ. 1998, 18, 70–73. [Google Scholar]
  40. Liu, X.; Wu, L.H.; Zhang, H.; Wang, X.R. Study on the concentration of negative air ions and the influential factors in different urban plant communities. J. Fudan Univ. (Nat. Sci.) 2011, 50, 206–212. [Google Scholar]
  41. Wang, L.J.; Han, Z.R.G.T.; Bai, Y.R.; Li, X.F.; Mou, Y.N.; Sun, G.C. Study on Spatial and Temporal Variation Characteristics of Negative Air Ion Concentration in Honghuaerji Forest Park. For. Sci. Technol. 2018, 23, 46–48. [Google Scholar]
  42. Liu, X.X.; Hua, C.; Zhang, M.R.; Zhang, J.G.; Liu, D. Aero-anion concentration in different forest communities of Laoshan Forest Farm, Chun’an County. J. Zhejiang A F Univ. 2012, 29, 366–373. [Google Scholar]
  43. Tan, Y.J.; Wang, E.; Zhang, P.C.; Zhang, Y.K. Research progress of spatio-temporal changes and health effects of negative air ions. North. Horticul. 2013, 9, 208–211. [Google Scholar]
  44. Qin, j.; Wang, L.M.; Gao, K.; Hu, Y.H.; Wang, Y.Q.; You, W.H. Improvement of Negative Air Ions Concentration by Plant Communities. J. Huazhong Agric. Univ. 2008, 27, 303–308. [Google Scholar]
  45. Shi, Y.L.; Yu, S.Q.; Zheng, Q.L. Aero-anion ecological efficacy in six types of plant communities. J. Zhejiang For. Coll. 2010, 27, 185–189. [Google Scholar]
  46. Pan, J.B.; Dong, L.; Liao, S.X.; Qiao, L.; Yan, H. Negative air ion concentration and affecting factors in Beijing Olympic Forest Park. J. Beijing For. Univ. 2011, 33, 59–64. [Google Scholar]
  47. Li, C.H.; Liu, F.G.; Chen, R.; Luo, Z.X.; Wu, C.Y. Quantitative study on tourism climate comfort in Lhasa. J. Arid Land Res. Environ. 2014, 28, 203–208. [Google Scholar]
  48. Wang, Y.Y.; Wang, C.; Dong, J.W.; Wang, Q.; Lin, S.Y.; Fu, W.C.; Zhu, L.X. Diurnal Oxygen Concentration Changes in Mixed Evergreen Broad-Leaved Forest at Qishan, Fuzhou. J. Chin. Urb. For. 2014, 12, 6–9. [Google Scholar]
  49. Chen, T.; Wang, W.; La, B. Study on Oxygen Content Change in Lhasa. Plat. Mount. Meteorol. Res. 2010, 30, 65–67. [Google Scholar]
  50. Hong, H.Y. Research progress of medical oxygen. World Latest Med. Infor. (Electronic Version) 2015, 15, 55–57. [Google Scholar]
  51. Gu, L.; Wang, C.; Wang, Y.Y.; Wang, X.L.; Sun, Z.K.; Wang, Q.; Sun, R.L. Patterns of temporal variation of microclimate and extent of human comfort in the recreation forests in Huishan National Forest Park. Sci. Silvae Sin. 2019, 55, 150–159. [Google Scholar]
  52. Dong, J.H.; He, Q.J.; Gao, Y.; Wang, Y.Y.; Ye, B.; Zhang, Z.Y.; Hua, J.X. The Microclimate Effects of Typical Urban Forests and Wetland and Its Effects on Human Comfort Degree: Taking Hangzhou as an Example. Environ. Protect. Sci. 2019, 45, 101–107. [Google Scholar]
  53. Ruiz, M.A.; Correa, E.N. Adaptive model for outdoor thermal comfort assessment in an Oasis city of arid climate. Build. Environ. 2015, 85, 40–51. [Google Scholar] [CrossRef]
  54. Liu, C.; Xu, N.; Song, J.D.; Hu, S.C. Research on visitors’ thermal sensation and space choices in an urban forest park. Acta Ecol. Sin. 2017, 37, 3561–3569. [Google Scholar]
  55. Kesselmeier, J.; Staudt, M. Biogenic Volatile Organic Compounds (VOC): An Overview on Emission, Physiology and Ecology. J. Atmos Chem. 1999, 33, 23–88. [Google Scholar] [CrossRef]
  56. Harley, P.; Eller, A.; Guenther, A.; Monson, R.K. Observations and models of emissions of volatile terpenoid compounds from needles of ponderosa pine trees growing in situ: Control by light, temperature and stomatal conductance. Oecologia 2014, 176, 35–55. [Google Scholar] [CrossRef] [PubMed] [Green Version]
  57. Faubert, P.; Tiiva, P.; Michelsen, A.; Rinnan, Å.; Ro-Poulsen, H.; Rinnan, R. The shift in plant species composition in a subarctic mountain birch forest floor due to climate change would modify the biogenic volatile organic compound emission profile. Plant. Soil 2012, 352, 199–215. [Google Scholar] [CrossRef]
  58. Tingey, D.T.; Manning, M.; Grothaus, L.C.; Burns, W.F. Influence of light and temperature on monoterpene emission rates from slash pine. Plant. Physiol. 1980, 65, 797–801. [Google Scholar] [CrossRef] [PubMed] [Green Version]
  59. Vallat, A.; Gu, H.; Dorn, S. How rainfall, relative humidity and temperature influence volatile emissions from apple trees in situ. Phytochemistry 2005, 66, 1540–1550. [Google Scholar] [CrossRef]
  60. Guenther, A.B.; Monson, R.K.; Fall, R. Isoprene and monoterpene emission rate variability: Observations with eucalyptus and emission rate algorithm development. J. Geophys. Res. 1991, 96, 10799. [Google Scholar] [CrossRef]
  61. Guenther, A.B.; Zimmerman, P.R.; Harley, P.C.; Monson, R.K.; Fall, R. Isoprene and monoterpene emission rate variability: Model evaluations and sensitivity analyses. J. Geophys. Res. 1993, 98, 12609. [Google Scholar] [CrossRef] [Green Version]
  62. Gouinguené, S.P.; Turlings, T.C.J. The Effects of Abiotic Factors on Induced Volatile Emissions in Corn Plants. Plant. Physiol. 2002, 129, 1296–1307. [Google Scholar] [CrossRef] [Green Version]
  63. Meeningen, Y.V.; Schurgers, G.; Rinnan, R.; Holst, T. Isoprenoid emission response to changing light conditions of English oak, European beech and Norway spruce. Biogeosciences 2017, 14, 4045–4060. [Google Scholar] [CrossRef] [Green Version]
  64. Xu, J.H.; Wen, S.W.; Wu, D.P. Influence of temperature on pythoncidere of Lavandula angustifolia Mill.flower. Acta Ecol. Sin. 2010, 30, 645–651. [Google Scholar]
  65. Wu, L.; Sun, Q.; Zhao, J.; Zhang, Y. Current Status and Prospects of Research on Plant Pythoncidere. Int. J. Ecol. 2019, 8, 9–14. [Google Scholar] [CrossRef]
  66. Lun, X.; Lin, Y.; Chai, F.; Fan, C.; Li, H.; Liu, J. Reviews of emission of biogenic volatile organic compounds (BVOCs) in Asia. J. Environ. Sci. 2020, 95, 266–277. [Google Scholar] [CrossRef] [PubMed]
  67. Kim, J.; Kim, K.; Kim, D.; Han, J. Seasonal variations of monoterpene emissions from coniferous trees of different ages in Korea. Chemosphere 2005, 59, 1685–1696. [Google Scholar] [CrossRef] [PubMed]
Figure 1. Location of the Shimen National Forest Park.
Forests 12 00207 g001
Figure 2. Sample plots of the Shimen National Forest Park. (A) Phyllostachys edulis forest; (B) Subtropical evergreen broad-leaved forest; (C) Forestless control group; (D) Liquidambar formosana forest; (E) Cunninghamia lanceolata forest; (F) Coniferous and broad-leaved mixed forest.
Forests 12 00207 g002
Figure 3. The experimental instruments. 1—COM-3200PRO II negative ion monitor (Guangzhou Extreme Technology Co., Ltd., Guangzhou, China); 2—Kestrel 5500 hand-held meteorological instrument (Beijing Kestrel Instrument & Meter Co. Ltd., Beijing, China); 3—Gas collecting equipment; 4—TD6000-SH-O2 oxygen content tester (Beijing Tiandi Shouhe Technology Development Co., Ltd., Beijing, China); 5—Agilent 7890B-5977B/GC-MS.
Forests 12 00207 g003
Figure 4. Results of system cluster analysis—tree diagram.
Forests 12 00207 g004
Figure 5. Comparison of negative air ion concentration in different forest types. A—Phyllostachys edulis forest; B—Subtropical evergreen broad-leaved forest; C—Forestless control group; D—Liquidambar formosana forest; E—Cunninghamia lanceolata forest; F—Coniferous and broad-leaved mixed forest. The different lowercase letters indicate significant difference among the stand types in the same time (p < 0.05).
Forests 12 00207 g005
Figure 6. Comparison of air oxygen content in different forest types. A—Phyllostachys edulis forest; B—Subtropical evergreen broad-leaved forest; C—Forestless control group; D—Liquidambar formosana forest; E—Cunninghamia lanceolata forest; F—Coniferous and broad-leaved mixed forest. The different lowercase letters indicate significant difference among the stand types in the same time (p < 0.05).
Forests 12 00207 g006
Figure 7. The temperature changes of different forest types in different seasons. A—Phyllostachys edulis forest; B—Subtropical evergreen broad-leaved forest; C—Forestless control group; D—Liquidambar formosana forest; E—Cunninghamia lanceolata forest; F—Coniferous and broad-leaved mixed forest. The different lowercase letters indicate significant difference among the stand types in the same time (p < 0.05).
Forests 12 00207 g007
Figure 8. The relative humidity changes of different forest types in different seasons. A—Phyllostachys edulis forest; B—Subtropical evergreen broad-leaved forest; C—Forestless control group; D—Liquidambar formosana forest; E—Cunninghamia lanceolata forest; F—Coniferous and broad-leaved mixed forest. The different lowercase letters indicate significant difference among the stand types in the same time (p < 0.05).
Forests 12 00207 g008
Figure 9. The wind speed changes of different forest types in different seasons. A—Phyllostachys edulis forest; B—Subtropical evergreen broad-leaved forest; C—Forestless control group; D—Liquidambar formosana forest; E—Cunninghamia lanceolata forest; F—Coniferous and broad-leaved mixed forest. The different lowercase letters indicate significant difference among the stand types in the same time (p < 0.05).
Forests 12 00207 g009
Figure 10. Comparison of the human comfort index in different forest types. A—Phyllostachys edulis forest; B—Subtropical evergreen broad-leaved forest; C—Forestless control group; D—Liquidambar formosana forest; E—Cunninghamia lanceolata forest; F—Coniferous and broad-leaved mixed forest. The different lowercase letters indicate significant difference among the stand types in the same time (p < 0.05).
Forests 12 00207 g010
Figure 11. Comparison of phytoncide species and relative content in different forest types. A—Phyllostachys edulis forest; B—Subtropical evergreen broad-leaved forest; C—Forestless control group; D—Liquidambar formosana forest; E—Cunninghamia lanceolata forest; F—Coniferous and broad-leaved mixed forest.
Forests 12 00207 g011
Table 1. Overview of the sample plots.
Forest TypesTest
Site
Longitude
(°E)
Latitude
(°N)
Altitude
(m)
Area
(hm2)
Stand Age (year)Stand Density
(N·hm−2)
Tree’s
Height
(m)
Tree’s Average Diameter
(cm)
Canopy DensityDistance from
Water Source (m)
Phyllostachys edulis forestA113.82423.62881019.3≥30114320.54 ± 2.3611.48 ± 1.590.8≈300
Subtropical evergreen
broad-leaved forest
B113.82923.62682065≥100104536.69 ± 6.3435.45 ± 5.690.9≈400
Liquidambar formosana forestD113.77623.63645015.6≥2063724.55 ± 3.0420.36 ± 2.410.6-
Cunninghamia lanceolata forestE113.77423.64935017.9≥3086133.10 ± 4.8325.04 ± 3.170.7-
Coniferous and broad-leaved
mixed forest
F113.78223.65229025.6≥2060826.38 ± 5.4419.52 ± 3.780.5≈150
Forestless control groupC113.81823.6257901.7-----≈30
Table 2. Principal component score coefficient matrix and index weight of all indicators.
IndicatorsPrincipal ComponentComponent MatrixWeight Value
1212
Negative air ion concentration/NAIC (X1)−0.3020.7540.750−0.6350.10
Air oxygen content/AOC (X2)0.710−0.2990.6900.6060.35
Human comfort index/HCI (X3)0.411−0.0160.6610.2560.27
Phytoncide relative content/PRC (X4)0.1850.3790.941−0.1170.28
Eigenvalues2.3591.050
Variance contribution rate (%)58.98326.254
Cumulated contribution rate (%)58.98385.237
Table 3. Criteria for the forest comprehensive healthcare index (FCHI) grades.
GradesIndex RangeDegree of Comprehensive Healthcare Benefits
Level IFCHI ≥ 0.445Very strong
Level II0. 445 > FCHI ≥ 0.213Strong
Level III0.213 > FCHI ≥ 0.047Weak
Level IV0.047 > FCHI ≥ 0.011Very weak
Level VFCHI < 0.011Null
Table 4. Relative content of phytoncide (spring).
Serial NumberSpeciesChemical CompoundChemical FormulaRelative Contents of Phytoncide in Spring (%)
ABDEF
1Terpenes1-Heptene,2,4-dimethyl-C9H18 0.510.08 1.63
2 1-UndeceneC11H220.670.30.211.47
3 (+)-LimoneneC10H160.752.250.231.020.56
4 cis-3-Methyl-2-penteneC6H120.361.20.86 0.31
5Alcohols2-EthylhexanolC8H18O1.921.320.981.070.69
6 LinaloolC10H18O 0.651.21.810.52
7 2-Ethyl-4-(2,2,3-trimethylcyclopent-3-en-yl)-but-2-en-1-olC14H24O0.961.24 1.120.86
8EstersBornyl acetateC12H20O2 0.781.882.021.03
9Ketones2-CamphanoneC10H16O1.672.360.871.752.61
10 6-Methyl-5-hepten-2-oneC8H14O 0.56 0.21
11 Cyclopentyl methyl ketoneC7H12O0.87 0.230.51
12AldehydesUndecanalC11H22O 0.73 0.5
13 Decyl aldehydeC10H20O0.9 0.520.69
14AcidsDecanoic acidC10H20O2 0.86 0.21
15 Palmitic acidC16H32O20.562.360.15 0.69
16 Tridecanoic acidC13H26O2 2.320.23
Total 8.6617.447.4411.679.61
Table 5. Relative content of phytoncide (summer).
Serial NumberSpeciesChemical CompoundChemical FormulaRelative Contents of Phytoncide in Summer (%)
ABDEF
1Terpenes(E)-(β)-FarneseneC15H24 0.230.54 0.52
2 α-CedreneC15H240.060.170.030.54
3 LongifoleneC15H240.912.220.240.671.86
4 CampheneC10H161.291.250.140.980.12
5 PineneC10H160.550.861.630.61.21
6 SabineneC10H160.671.54 0.75
7 TerpinoleneC10H16 0.69 0.03
8 β-MyrceneC10H161.481.361.331.450.66
9 cis-2-OcteneC8H16 0.08 0.020.37
10 α-LongipineneC10H160.14 0.07
11 (+)-LimoneneC10H160.240.470.750.370.14
12 1,5-dimethyl-1,5-cyclooctadieneC10H16 0.28 0.71
13 DipenteneC10H160.190.11
14 1-UndeceneC11H220.181.160.020.380.5
15 6,6-DimethylfulveneC8H100.230.760.27 1.25
16 cis-3-Methyl-2-penteneC6H120.23.36 1.14.18
17 TricycleneC15H24 0.210.06
18 1-TrideceneC13H260.14 0.02 0.06
19 Terpinen-4-olC10H160.070.24 0.08
20 3-CareneC10H160.120.580.3
21 α-PineneC10H160.560.120.861.23
22 β-PineneC10H162.351.44 1.190.89
23 LimoneneC10H163.171.230.890.56
24 2,3-dimethylpent-1-eneC7H14 0.150.76
25 tetramethylethyleneC6H12 0.25 1.62
26 2-methylhept-2-eneC8H16 0.08 0.421.62
27 trans-3-methyl-2-penteneC6H120.23 0.81
28AlcoholsLinaloolC10H18O1.162.690.921.750.47
29 GeranyllinaloolC20H34O 0.42 0.05
30 2-EthylhexanolC8H18O4.535.672.682.693.84
31 CedrolC15H26O 0.75 0.32
32 GeraniolC10H18O0.850.640.241.020.22
33 α-TerpineolC10H18O1.070.47 0.770.16
34 Isooctyl alcoholC8H18O 0.5 0.21
35 TridecanolC13H28O 0.140.210.870.72
36 2-propylpentan-1-olC8H18O2.11.041.46 0.56
37 SpathulenolC15H24O0.81.412.34
38 BorneolC10H18O0.050.81
39 Citronellol-dextroC10H18O 0.21 0.14
40 1-HexadecanolC16H34O 0.56
41 IsophytolC20H40O 1.54 0.84
42 PhytolC20H40O0.541.32
43 (E)-3-Methylpent-2-en-4-yn-1-olC6H8O 0.58 0.47
44EstersIsoamyl nonanoateC14H28O20.561.981.22.540.53
45 2-Ethylhexyl acetateC10H20O20.530.43 0.12
46 Bornyl acetateC12H20O20.984.892.68.70.89
47 Triethyl citrateC12H20O7 0.320.03
48 Isobornyl acetateC12H20O2 0.68 0.79
49 L-Bornyl acetateC12H20O20.55 1.185.73
50 Linalyl acetateC12H20O2 1.18 0.51
51Ketones1-MenthoneC10H18O1.211.141.331.30.78
52 PulegoneC10H18O 1.021.891.90.52
53 L (-)-CarvoneC9H12O2 0.85 0.41
54 6-Methyl-5-hepten-2-oneC8H14O0.210.540.260.210.56
55 6-Methyl-2-heptanoneC8H16O 0.81 0.11
56 2-CamphanoneC10H16O1.020.23 0.15
57 2-Methyl-5-(1-methylethenyl)-2-Cyclohexen-1-oneC10H14O 0.4 0.03
58 2-Acetyl-cyclopentanoneC7H10O20.50.581.12 0.13
59 3-OctanoneC8H16O0.890.24 0.57
60 3-Ene-nonanone-2C9H16O 0.42
61Aldehydesα-CitralC10H16O0.260.840.420.891.2
62 NonanalC9H18O0.50.82 0.510.08
63 UndecanalC11H22O0.640.240.22 0.44
64 Decyl aldehydeC10H20O 0.12 0.52
65 HeptaldehydeC7H14O 0.57 0.4
66 OctanalC8H180.32 0.21 0.18
67 Undecan-4-olideC14H28O0.430.47 0.840.8
68 TridecanalC13H26O 0.18
69 α-Longine alkenalC10H16O0.390.51 0.410.27
70 β-CyclocitralC10H16O0.25 0.57 0.49
71 trans-CinnamaldehydeC9H8O 0.27 0.5
72 trans-2-DecenalC10H18O2.1
73 2-NonenalC9H16O 1.51
74AcidsLauric acidC12H24O20.420.75 0.45
75 Myristic acidC14H28O2 0.360.170.02
76 Palmitic acidC16H32O2 1.18 0.120.8
77 Neoabietic acidC20H30O2 5.62
78 Neodecanoic acidC10H20O2 0.5 0.49
Total 35.6463.3230.8144.2633.69
Table 6. Relative content of phytoncide (autumn).
Serial NumberSpeciesChemical CompoundChemical FormulaRelative Contents of Phytoncide in Autumn (%)
ABDEF
1Terpenesα-PineneC10H160.70.80.710.70.03
2 (+)-LimoneneC10H160.72.471.721.783.61
3 Artemisia trieneC10H160.621.55 0.5
4 6,6-DimethylfulveneC8H100.120.060.26
5 CampheneC10H160.380.520.341.120.02
6 1-UndeceneC11H220.040.11
7 1-TrideceneC13H26 0.25
8 Terpinen-4-olC10H160.50.40.30.12
9 3-careneC10H16 0.440.170.7
10 trans-2-HepteneC7H14 0.08 0.06
11 1,5-Dimethyl-1,5-cyclooctadieneC10H16 0.72
12 trans-2,2-Dimethyl-3-hepteneC9H18 0.11
13 2-Ethyl-1-buteneC6H12 0.11
14 trans-3-Methyl-2-penteneC6H12 0.11
15 DipenteneC10H160.251.730.21.54.22
16 (+)-α-LongipineneC15H240.20.22
17 LongifoleneC15H240.941.050.030.70.63
18 (-)-ThujopseneC15H24 0.350.05 0.25
19 CembreneC20H32 0.21 0.06
20 Octadec-1-eneC18H36 0.06
21 trans-SqualeneC30H50 0.580.22
22 SqualeneC30H50 0.14
23 PineneC10H160.080.96 0.050.18
24 ValenceneC15H24 0.47
25 α-CedreneC15H24 0.62 1.92
26AlcoholsIsooctyl alcoholC8H18O0.210.05 0.2
27 TridecanolC13H28O 0.01
28 2-Hexyl-1-decanolC16H34O 0.04
29 HexadecanolC16H34O 0.02
30 2-Octyldodecyl alcoholC20H42O 0.06
31 TetrahydrolavandulolC10H20O 0.4
32 MentholC10H20O 0.54 0.3
33 (3S)-3,7-Dimethyloct-7-en-1-olC10H20O 0.6
34EstersIsoamyl nonanoateC14H28O20.25 0.1
35 2,2,4-Trimethyl-1,3-pentanediol diisobutyrateC16H30O4 0.170.110.08
36 octyl P-MethoxycinnamateC18H26O3 0.340.18
37 tributyl O-acetylcitrateC20H34O8 2.520.970.72
38 Tributyl citrateC18H32O7 1.5211.44
39Ketones3,5,5-Trimethylcyclohex-3-en-1-oneC9H14O0.140.18
40 Cyclohexane-1,2-dioneC6H8O2 0.03
41 6-Methyl-5-hepten-2-oneC8H14O 0.2
42 Cyclopentyl methyl ketoneC7H12O2.540.56 0.12
43AldehydesDecyl aldehydeC10H20O 1.561.230.05
44 NonanalC9H18O 0.6 0.4
45 OctanalC8H18 0.2
46 HeptaldehydeC7H14O 0.2 0.45
47 DodecanalC12H24O 0.290.1
48 TridecanalC13H26O 0.7
49 Undecan-4-olideC14H28O 0.7
50 L-PerillylaldehydeC10H14O 0.72
51 trans-2-Dodecen-1-alC12H22O 0.17
52 IsocyclocitralC10H16O 0.07
53 trans-2-PentenalC5H8O 0.65 0.06
54Acids(5-Methyl-2-propan-2-ylhexyl) acetateC12H24O20.06
55 8-Dodecen-1-ol,1-acetate, (8E)-C14H26O20.04
56 2-Propenoic acid,3-(4-methoxyphenyl)-, 2-ethylhexyl ester, (2E)-C18H26O3 0.23
57 Palmitic acidC16H32O2 2.121.26
58 trans-13-Octadecenoic acidC18H34O2 0.06
59 Stearic acidC18H36O2 0.450.27
Total 7.7726.7411.0213.0610.45
Table 7. Relative content of phytoncide (winter).
Serial NumberSpeciesChemical CompoundChemical FormulaRelative Contents of Phytoncide in Winter (%)
ABDEF
1Terpenes1-OctadeceneC18H360.181.43 0.840.21
2 1-HeptadeceneC17H340.21.50.70.730.36
3 3,3-Dimethyl-1-hexeneC8H16 0.18
4 1,5-Dimethyl-1,5-cyclooctadieneC10H16 0.79
5 DipenteneC10H160.181.09 1.23
6Alcohols2-EthylhexanolC8H18O0.70.631.030.560.95
7 LinaloolC10H18O 1.140.340.560.32
8EstersIsoamyl nonanoateC14H28O20.670.57 0.49
9 2-Ethylhexyl acetateC10H20O2 0.59 0.63
10 Bornyl acetateC12H20O20.540.120.13 0.4
11Ketones2-CamphanoneC10H16O 0.58 0.18
12AcidsLauric acidC12H24O20.40.510.12
13 Palmitic acidC16H32O2 0.57 0.23
Total 2.879.72.325.222.47
Table 8. Normalized value of indicators and comprehensive healthcare benefits evaluation.
SeasonForest TypesNAICAOCHCIPRCFCHIGrades
SpringPhyllostachys edulis forest0.2370.3590.9950.410.533Level I
Subtropical evergreen broad-leaved forest0.8690.3140.9440.8260.683Level I
Forestless control group0.0390.2590.75200.298Level II
Liquidambar formosana forest0.1280.3750.7770.3520.452Level I
Cunninghamia lanceolata forest0.2130.4450.6360.5530.504Level I
Coniferous and broad-leaved mixed forest0.2010.4930.5380.4550.465Level I
SummerPhyllostachys edulis forest0.4520.75310.5630.736Level I
Subtropical evergreen broad-leaved forest10.6950.99110.891Level I
Forestless control group0.070.6010.39500.324Level II
Liquidambar formosana forest0.2220.8140.6560.4860.620Level I
Cunninghamia lanceolata forest0.2750.8680.5590.6990.678Level I
Coniferous and broad-leaved mixed forest0.27210.4950.5320.660Level I
AutumnPhyllostachys edulis forest0.230.3110.8180.1230.387Level II
Subtropical evergreen broad-leaved forest0.8480.2750.8260.4220.522Level I
Forestless control group0.010.2270.38100.183Level III
Liquidambar formosana forest0.0510.3390.890.1740.413Level II
Cunninghamia lanceolata forest0.1080.3840.8810.2060.441Level II
Coniferous and broad-leaved mixed forest0.1010.4590.9170.1650.465Level I
WinterPhyllostachys edulis forest0.1690.0970.1240.0680.103Level III
Subtropical evergreen broad-leaved forest0.6050.0810.0790.230.175Level III
Forestless control group00000Level V
Liquidambar formosana forest0.1150.1930.5110.0550.232Level II
Cunninghamia lanceolata forest0.1590.2230.6490.1240.304Level II
Coniferous and broad-leaved mixed forest0.1440.2520.6810.0590.303Level II
NAIC—negative air ion concentration; AOC—air oxygen content; HCI—human comfort index; PRC—phytoncide relative content; FCHI—forest comprehensive healthcare index.
Publisher’s Note: MDPI stays neutral with regard to jurisdictional claims in published maps and institutional affiliations.

