Article

Using Isopropanol as a Capping Agent in the Hydrothermal Liquefaction of Kraft Lignin in Near-Critical Water

1
Department of Chemistry and Chemical Engineering, Chalmers University of Technology, SE-412 96 Gothenburg, Sweden
2
Department of Chemistry and Bioscience, Aalborg University, Niels Bohrs Vej 8, 6700 Esbjerg, Denmark
*
Author to whom correspondence should be addressed.
Energies 2021, 14(4), 932; https://doi.org/10.3390/en14040932
Submission received: 25 January 2021 / Revised: 3 February 2021 / Accepted: 6 February 2021 / Published: 10 February 2021
(This article belongs to the Special Issue HTL Biocrude Production, Optimization, and Upgrading)

Abstract

:
In this study, Kraft lignin was depolymerised by hydrothermal liquefaction in near-critical water (290–335 °C, 250 bar) using Na2CO3 as an alkaline catalyst. Isopropanol was used as a co-solvent with the objective of investigating its capping effect and capability of reducing char formation. The resulting product, which was a mixture of an aqueous liquid, containing water-soluble organic compounds, and char, had a lower sulphur content than the Kraft lignin. Two-dimensional nuclear magnetic resonance studies of the organic precipitates of the aqueous phase and the char indicated that the major lignin bonds were broken. The high molar masses of the char and the water-soluble organics, nevertheless, indicate extensive repolymerisation of the organic constituents once they have been depolymerised from the lignin. With increasing temperature, the yield of char increased, although its molar mass decreased. The addition of isopropanol increased the yield of the water-soluble organic products and decreased the yield of the char as well as the molar masses of the products, which is indicative of a capping effect.

1. Introduction

Long term depletion of the world’s fossil resources, coupled with concerns regarding the sustainability of their usage, have mandated research in finding renewable alternatives, and particularly so in the forms of both chemical precursors and fuel additives [1]. Biomass, especially lignocellulosic biomass, is such an alternative that has the huge advantage of not competing directly with food production [2]. Along with cellulose, hemi-cellulose, and extractives, lignocellulosic biomass contains lignin, which is an amorphous polymer. Due to its content of aromatic moieties, lignin is envisioned as being used as a future renewable source of aromatic precursors and fuel additives [3,4,5,6]. Its three-dimensional heterogenous structure is a result of radical polymerisation of the monolignols—p-coumaryl, coniferyl, and sinapyl alcohol. These phenylpropane units are linked to each other with various ether (β-O-4′, α-O-4′, 4-O-5′) and carbon–carbon (5-5′, β-5′, β-β’, β-1′) bonds [7].
Although other types of biorefineries converting lignocellulosic biomass produce lignin, most of the lignin is handled in pulp mills. A total of 70 million tons of lignin are estimated to be dissolved in pulping liquors annually, with Kraft pulping being the dominant process [8]. Lignin recalcitrance increases with this treatment compared to the native lignin present in plants, since the lignin is partly condensed and many of the β-O-4′ bonds are broken [7]. It is, therefore, conventional for Kraft lignin to be burned and thereby produce steam for use in the pulp mill. Improved energy efficiency in such mills makes it feasible to extract parts of the lignin using, for instance, the LignoBoost process [9]. Conservative estimations of the potential for Kraft lignin extraction range between 6 and 9 Mton/yr [10]. Kraft lignin, although condensed, could thus be available in large quantities and thus merits investigation.
Lignin may be liquefied through depolymerisation and either be upgraded by, for example, hydrodeoxygenation to form fuel additives or used as a source of aromatic chemicals [4,11]. Many different approaches have been investigated for lignin depolymerisation, including pyrolysis, hydrogenolysis, oxidation, and various hydrothermal methods [12]. The latter uses water as a solvent and thus, benefits from not requiring the lignin to be dried prior to depolymerisation. Furthermore, the method may be used at different temperatures, enabling the formation of products with varying properties. Working at a lower temperature, i.e., around 200 °C, favours the production of a coal-like substance, whilst increasing it to 300–350 °C shifts the product to a liquid phase. Increasing the temperature even further, to 600–700 °C, on the other hand, favours gaseous products and is notable in that it exceeds the critical temperature of water [13]. Employing the mid-level temperature to produce a liquid product, hydrothermal liquefaction (HTL) has attracted increased attention in recent years [14,15,16,17].
HTL using near-critical water with homogeneous alkaline catalysts has been shown to produce good depolymerisation results, even with technical lignins such as Kraft lignin from softwood isolated with the LignoBoost process [14,18,19]. The major lignin linkages have been shown to be broken by such an HTL process [20]. As the alkaline catalyst loading in HTL increases, the char yields decrease and the conversion of the feed increases [21,22,23]. When near-critical water is used, the dielectric constant is lower than in ambient water: non-polar components can, therefore, be dissolved whilst the dielectric constant remains sufficiently high to dissolve salts as well. Moreover, the higher ionic product of near-critical water means that water dissociates more easily, which favours both acid and base-promoted reactions, such as hydrolysis [13,17,24].
Several reactive fragments are formed during the depolymerisation that are prone to repolymerisation, leading to undesirable solid char and reducing the yield of low-molecular products [25]. A slow heating rate during the reaction increases the amount of char [26]. The reaction of lignin under hydrothermal conditions has also been suggested as being a swift depolymerisation followed by a slower repolymerisation [27,28]. The reactive fragments can be trapped with capping agents that not only reduce the amount of char but also the molar mass of the products. Phenol works well as such an agent, reducing the formation of char and enhancing the production of monomers [6,18,25]. Furthermore, aliphatic alcohols such as methanol (MeOH) and ethanol (EtOH) have also shown capping effects that reduce the char yield [14,29,30,31,32]. Such alcohols lower the critical temperature and pressure of the reaction mixture compared to pure water and may act as hydrogen donors [33,34]. There is, nevertheless, a lack of understanding of the effect of using isopropanol (IPA) as a capping agent for Kraft lignin. The only data available in the literature in this regard are, to the best of the authors’ knowledge, those of Sebhat which indicate capping effects of IPA where char yield was reduced [32]. That study was limited to a mixture of equal amounts of water and IPA at 225 °C, without any alkaline catalyst and with 3 h of reaction time.
The present study aimed to investigate the effect of using IPA as a capping agent in HTL of Kraft lignin at varying temperatures and IPA to lignin ratios. Softwood Kraft lignin, isolated using the LignoBoost process, was therefore depolymerised under subcritical conditions using sodium carbonate as a homogenous catalyst and IPA as a capping agent (with weight ratios vs. lignin at 0, 0.6, 2.7, and 4.9, temperatures between 290 and 335 °C, and a reaction time of 12 min). No heterogeneous catalyst was used. Notably, higher reaction temperatures, shorter reaction times, and lower IPA loading were employed compared to the work of Sebhat [32]. Investigations into structural changes, molar masses, and elemental compositions were made using gel permeation chromatography (GPC), nuclear magnetic resonance spectroscopy (NMR), attenuated total reflectance Fourier transform infrared spectroscopy (ATR-FTIR), gas chromatography–mass spectroscopy (GC–MS), elemental analysis (CHNS), and atomic absorption spectroscopy (AAS).

2. Materials and Methods

2.1. Materials

Softwood Kraft lignin, from a mixture of Picea abies and Pinus sylvestris, isolated using the LignoBoost process at Bäckhammar mill in Sweden, was used as raw material in all experiments. The lignin was depolymerised in deionised water, Na2CO3 (Merck, ≥99.9%), and IPA (VWR Chemicals, ≥99.8%). For separation and analysis, syringol (Aldrich, 99%), diethyl ether (Sigma-Aldrich, ≥99.0%, ≥1 ppm BHT as inhibitor, and VWR Chemicals, ≥99.7% stabilised with BHT), NaCl (Merck, ≥99.5%), LiBr (Sigma-Aldrich, ≥99%), DMSO (Sigma-Aldrich, ≥99.7%), DMSO-d6 (Sigma-Aldrich, 99.5 atom% D, 0.03% (v/v) TMS), and pullulan standards (Varian, PL2090-0100) were used. All chemicals were used as received apart from the 1 M HCl used in acidification, which was diluted in-house (Sharlau, 37%).

2.2. Methods

The batch reactor used in the study was manufactured by SITEC-Sieber Engineering AG (Zürich, Switzerland). The reactor was designed to allow heating and pressurisation of an aqueous pre-charge, not containing the lignin, and then injecting a second charge, containing the lignin, at high pressure with a precision hand pump. This reactor, therefore, enables rapid heating of the lignin instead of loading the entire reaction charge into the reactor and heating it from ambient temperature. When the desired reaction time has elapsed, the reactor system is quickly discharged into an ice-bath. The reactor vessel has a volume of 99 mL and its wetted parts are made of Inconel 625. Below the vessel, there is a heating plate and magnetic stirrer set at 500 rpm. The reactor vessel can be opened by removing the lid to load the pre-charge. The reaction pressure was measured with an accuracy of ±1% using a pressure gauge connected to the reactor top and the reaction temperature was measured with a thermocouple of type K with an accuracy of ±0.5% (class 1). Further details on the reactor are given by Arturi et al. [25].
The reaction mixture was divided into two parts to ensure rapid heating of the lignin and thus avoid charring. The first part, which comprised water and Na2CO3, was loaded into the reactor and pre-heated. The second part contained all the lignin and IPA, as well as the remainder of the water and Na2CO3. This was injected into the heated pre-charge using hand pumps capable of injecting material during operation at high pressure. The pre-charge constituted 60% of the total mass loaded, and the injection charge the remaining 40%.
Both charges were prepared at least 12 h prior to the experiment to ensure proper dispersion and dissolution. In the cases where it was difficult to disperse the lignin properly, the proportions of pre-charge and injection charge were changed to 40% and 60%, respectively, while maintaining the overall composition intended in the reaction mixture. Additionally, an UltraThurrax® (IKA T25; IKA-Werke GmBH & Co. KG., Staufen, Germany) was used in these instances to disperse the injection charge for 30 min at 20,000 rpm, 12 h and 15 min before addition to the reactor.
The pre-charge was loaded into the reactor at ambient temperature and pressure; nitrogen was used to displace air, after which the reactor was sealed and heated to 15 °C above the intended reaction temperature. The lignin-containing injection charge was then pumped in to reach a pressure of 185 bar. This injection lasted 1 min and the subsequent temperature drop was restored after 1.5–2.5 min. The pressure increased during this heating process, and fine-tuning using the hand pumps ensured that the pressure remained at 250 bar. The amount of liquid injected or ejected to regulate the pressure was less than 1 mL. Twelve minutes after the injection had been completed, the reactor was discharged into a cold trap containing 200 mL of water in an ice-bath. Gases were not collected, but the cold trap was, nevertheless, equipped with a condenser. The piping of the reactor system was flushed with nitrogen to displace any lingering products into the product flask.

2.2.1. Experimental Conditions

Two test series were conducted in which the IPA to dry lignin ratio and temperature, respectively, were varied, under the operation conditions and compositions presented in Table 1. Temperature and pressure ranges are presented in Table S1 and Figures S1 and S2 in the Supplementary Materials. Seven reactions were performed, where the one at 2.7 IPA/lignin ratio at 320 °C belonged to both series. The reference run (Ref.) was carried out without lignin. The slight difference in the loaded lignin was caused by the injection aiming at a certain reaction pressure, not at a fixed amount of charge.

2.2.2. Fractionation of Products

The reaction products were divided into three different fractions: char, precipitated solids, and acid-soluble organics (ASO), according to the diagram shown in Figure 1. The latter two are also referred to as the water-soluble organics. Filtration of the reaction product, which was diluted with water from the cold trap, was performed using pre-dried glass filters with a nominal cut-off of 1.0–1.6 µm. The resulting filter cakes were dried at 40 °C for 96 h, thus forming the char fraction. A mild drying procedure was employed to minimise potential reactions in the solids.
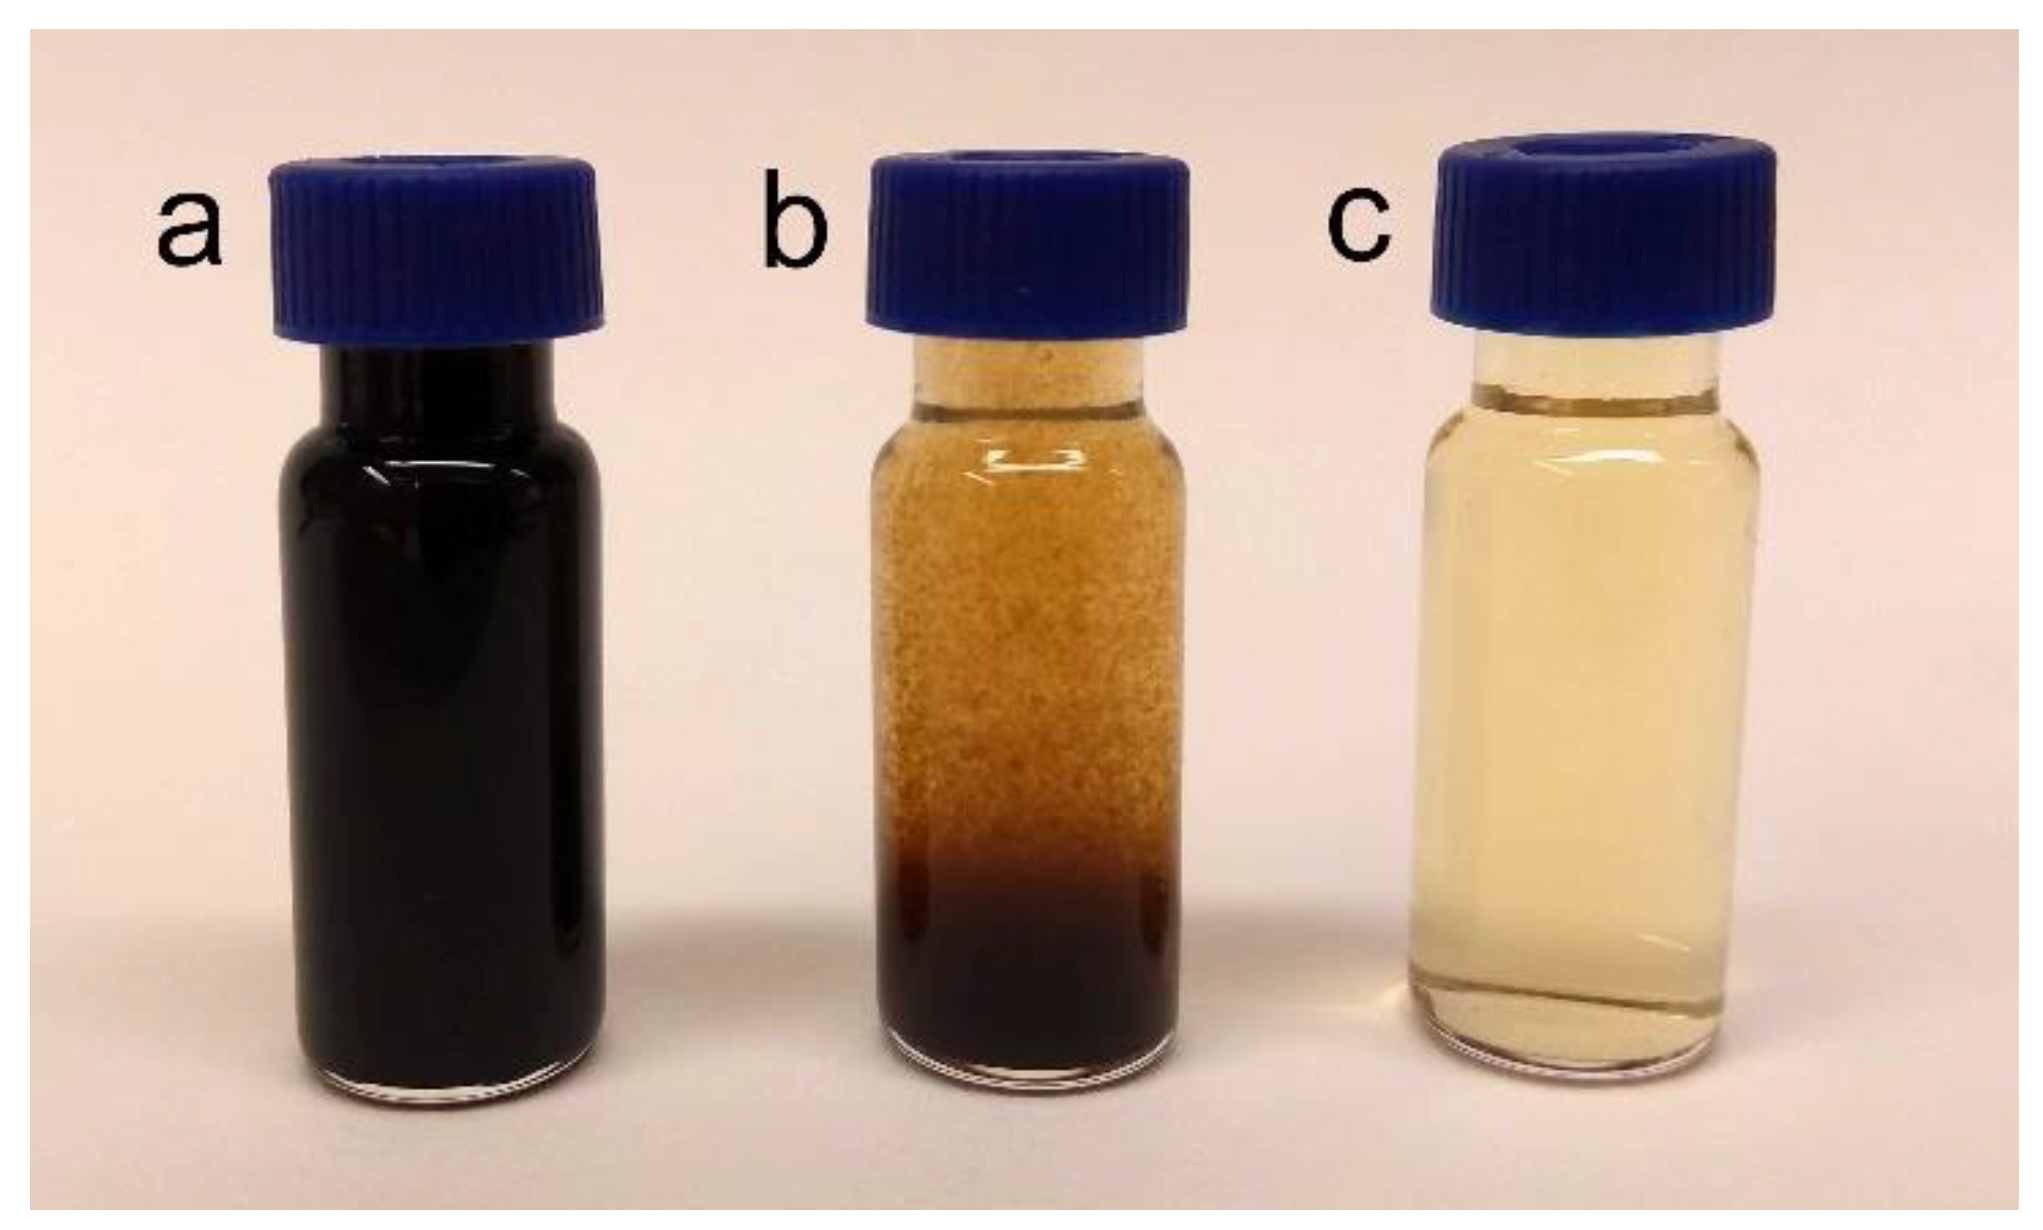
The filtrate was acidified with 1 M HCl to pH 1.5 by means of an auto-titrator (TitroLine 7000, SI Analytics; Xylem Analytics Germany GmBH, Welheim, Germany), thereby releasing the remaining carbonates as CO2 and causing the precipitation of a brown material (see Figure 2), which was subsequently left to settle overnight. The precipitated material was filtered off using a glass filter with a nominal cut-off of 1.0–1.6 µm, washed with 50 mL of water, and then dried in an oven at 40 °C for 120 h, forming the precipitated solids fraction. The filtrate was evaporated by leaving it open to the atmosphere (firstly in a fume hood and then at 40 °C, and later freeze-dried (FreeZone Triad 7400030 freeze drier; Labconco Corporation, Kansas City, MO, USA) when being prepared for ATR-FTIR analysis) to yield the ASO. The wash liquid (coloured light yellow by the washing process) was evaporated in the same manner as the filtrate to recover all ASO. A fraction of the ASO, extractable in diethyl ether (DEE), was isolated for GC–MS analysis.

2.2.3. Analytical Procedures

Low-molecular ASO compounds were analysed using GC–MS (Agilent 7890A; Agilent Technologies Co. Ltd., Shanghai, China, and Agilent 5975C; Agilent Technologies Inc. Wilmington, DE, USA). As an internal standard, 1 mL of 0.001 g/mL syringol solution was added to 10 mL of the clear phase obtained after acidification and settling (vial b in Figure 2). The mixture was extracted with DEE at 1:1 w/w in a single step. Then, 2 mL of DEE phase was filtered with a 0.45 µm syringe filter to a vial and run in GC–MS. Helium was used as the carrier gas, at a flow of 1 mL/min with an injection volume of 1 µl, a split ratio of 19:1, and an injection temperature of 300 °C. The oven programme started at 70 °C, which was held for 2 min; it was followed by a 20 °C/min heating to 275 °C, which was maintained for 10 min. The column was an Agilent HP-5MS (30 m long, with an inner diameter of 250 µm and film thickness of 0.25 µm); the MS source was operated at 230 °C and the quadrupole at 150 °C. Identification of the components was made using the NIST MS Search Programme (Version 2.2) and the library NIST/EPA/NIH Mass Spectral Library (NIST 11).
The components thus identified were quantitated according to the method reported by Nguyen et al. [17], i.e., W i = W I S T A i / A I S T , where W is the mass fraction, A is the chromatographic peak area, IST is the internal standard, and i is the analyte. The internal standard, syringol, and the preservative from the solvent, butylated hydroxytoluene (BHT), were excluded from the yield calculation. Each sample was run in triplicate and the average relative standard deviation was 4.7%.
Molar masses of char, precipitated solids, and ASO were measured using GPC, with a UV detector operating at 280 nm (PL-GPC 50 Plus Integrated GPC system, Polymer Laboratories; Varian Inc., Church Stretton, UK). Two PolarGel-M columns (300 × 7.5 mm) and one guard column PolarGel-M (50 × 7.5 mm) were employed. DMSO with 10 mM LiBr was used as the mobile phase. Calibration was made with pullulan standards (Varian PL2090-0100, Varian Inc., Church Stretton, UK). Ten milligrams of each solid was dissolved in 1 mL of DMSO with 10 mM LiBr. Then, 0.1 mL of this solution was diluted with 4 mL of DMSO with 10 mM LiBr, yielding a concentration of 0.24 mg/mL. The samples were filtered with a 0.2 µm syringe filter to vials and were run in the GPC. The temperature of the system was 50 °C, the flow rate 0.5 mL/min, and each sample was run in duplicate. The results were normalised according to the formula I i , n = ( I i I m i n ) / ( I m a x I m i n ) , where Ii,n is the normalised intensity, Ii is the intensity at point i in the spectrum, and Imin and Imax correspond to the minimum and maximum intensity of the measurement of the sample, respectively. Cirrus GPC Software 3.2 and MATLAB R2019b were used for data analysis, yielding the mass and number average molar mass, MW and MN, as well as the polydispersity ( PD = M W / M N ) . The average relative standard deviations for the MW and MN were 0.29% and 0.62%, respectively.
In order to analyse the functional units of the char, the precipitated solids, and the ASO, ATR-FTIR spectra were recorded using a FT-IR spectrometer (PerkinElmer Frontier FT-IR; PerkinElmer, Inc. Waltham, MA, USA) equipped with an ATR-FTIR unit (GladiATR-FTIR; PIKE Technologies, Madison, WI, USA). Transmittance was measured over the range 4000–400 cm−1 with a resolution of 4 cm−1, using 10 scans per sample. Spectral processing was performed using PerkinElmer Spectrum v. 10.4.3 and MATLAB R2019b. The ASO fraction that had not been oven-dried, such as the char and precipitated solids, was freeze-dried overnight to remove as much water as possible.
Two-dimensional nuclear magnetic resonance spectroscopy (2D-NMR) measurements were made on the char and precipitated solids using an 18.8 T NMR spectrometer (Bruker Avance III HD; Bruker BioSpin GmBH, Rheinstetten, Germany) operating at 25 °C with a 5 mm TXO probe. Thirty-five milligrams of the samples were dissolved in 250 µL DMSO-d6 in glass vials. A small fraction of each sample, however, remained undissolved: this was separated by centrifugation in Eppendorf tubes (13,400 rpm for 5 min) and thus not investigated. Tubes with a diameter of 3 mm were used. Heteronuclear single quantum coherence spectroscopy (HSQC) experiments were run using the pulse programme hsqcedetgpsisp2.3 with a 128 ms acquisition time for 1H and 6.4 ms for 13C. The central solvent peak, DMSO-d6 at 2.50 and 39.52 ppm, was used for calibration of the chemical shifts. 1H-NMR spectra were recorded using on the same magnet as the HSQC experiments using the pulse programme zg30 with a 1.36 s acquisition time. Processing of the spectra was carried out using MNova Vers.10.0.2.
Elemental analyses of the char and precipitated solids were performed using CHNS combustion analysis in pure O2 (Elementar vario MICRO cube; Elementar Analysensysteme GmbH, Langenselbold, Germany), with helium being the carrier gas. Two milligrams of the char and precipitated solids, respectively, pre-dried at 105 °C, were added to tin weighing boats and loaded to the MICRO cube. The contents of carbon, hydrogen, nitrogen, and sulphur were determined, whilst that of oxygen was calculated from the difference. Calibration was made with sulphanilamide; combustion and reduction were conducted at 1150 and 850 °C, respectively. Samples were run in duplicate, with the average relative standard deviation being 0.46% for C, 0.54% for H, 10.8% for S, and 1.6% for O.
The residual contents of salt, NaCl, in both the wash liquid and the filtrate of the acidified reaction products, were measured using atomic absorption spectroscopy (AAS) with a hollow cathode Na-lamp (Thermo Scientific iCE3000; Thermo Fisher Scientific, Cambridge, UK), with a measuring wavelength of 330.3 nm. The samples were diluted 1:10 with water and filtered with a 0.45 µm filter. Each sample was run in triplicate with an average relative standard deviation of 0.89%. Data processing was made with SOLAAR v. 11.02. The amounts of salts were then deducted from the mass of ASO.
The melting points of the char and precipitated solids were investigated using a microscope (Olympus BH-2; Olympus Corporation, Tokyo, Japan) equipped with a heater (Mettler FP82HT Hotstage and Mettler FP90; Mettler-Toledo GmBH, Greifensee, Switzerland); the samples were heated to 375 °C, the maximum temperature of the equipment, at a rate of 20 °C/min.

3. Results and Discussion

The alkaline HTL treatment of the lignin using IPA as a capping agent resulted in a product comprising an aqueous liquid containing dissolved compounds, as well as solid char. The liquid was dark, had a smoky odour, and a relatively high pH of 8.7–9.2 (see Table 1). No solid product was produced in the reference run without lignin. Neither the char nor the precipitated solids melted at temperatures of up to 375 °C. The LignoBoost lignin used in this study, however, melted at 190 °C, thereby indicating that the chemical structures of the char and the precipitated solids differ from that of the lignin. Figure 2 shows the reaction products with and without acid addition and subsequent filtration. The char and precipitated solids were dark powders after drying, whereas the ASO was a yellow to orange film.
Unlike similar experiments with Kraft lignin depolymerisation in sub-critical water, in which phenol was used instead of IPA as a capping agent [14,25], no observable oil phase was produced in this set-up of experimental conditions. This is in line with several other examples using aliphatic alcohols as co-solvents in aqueous depolymerisation of different kinds of lignin: Kraft, soda-anthraquinone (soda-AQ), and enzymatically hydrolysed lignin, which fail to produce biphasic liquid reaction products. With methanol in the system, neither Belkheiri et al., Cheng et al., nor Deepa and Dhepe reported any biphasic liquid product [14,30,35]. Moreover, with ethanol as a co-solvent, there are also examples of reaction products with a single liquid phase [29,31,36,37,38,39]. It is possible that the formation of a second liquid phase is an effect of the capping agent exhibiting limited miscibility in water and a high affinity for the HTL products. There are reports of a second oily phase being obtained when Kraft, organosolv, Protobind 1000 (soda lignin from wheat straw), and enzymatically hydrolysed lignin are depolymerised using co-solvents with limited water miscibility, such as 1-BuOH and phenol [14,19,25,40]. On the other hand, miscibility cannot be the sole explanation, since MeOH and EtOH have also been reported to yield an oil phase when combined with different catalysts: MeOH with Raney Ni and/or acidic zeolites, and EtOH with different Lewis acid catalysts, such as FeCl2, CuCl2, CoCl2, NiCl2, AlCl3, and Sc(OTf)3, but not with acetates [41,42].

3.1. Structural Changes

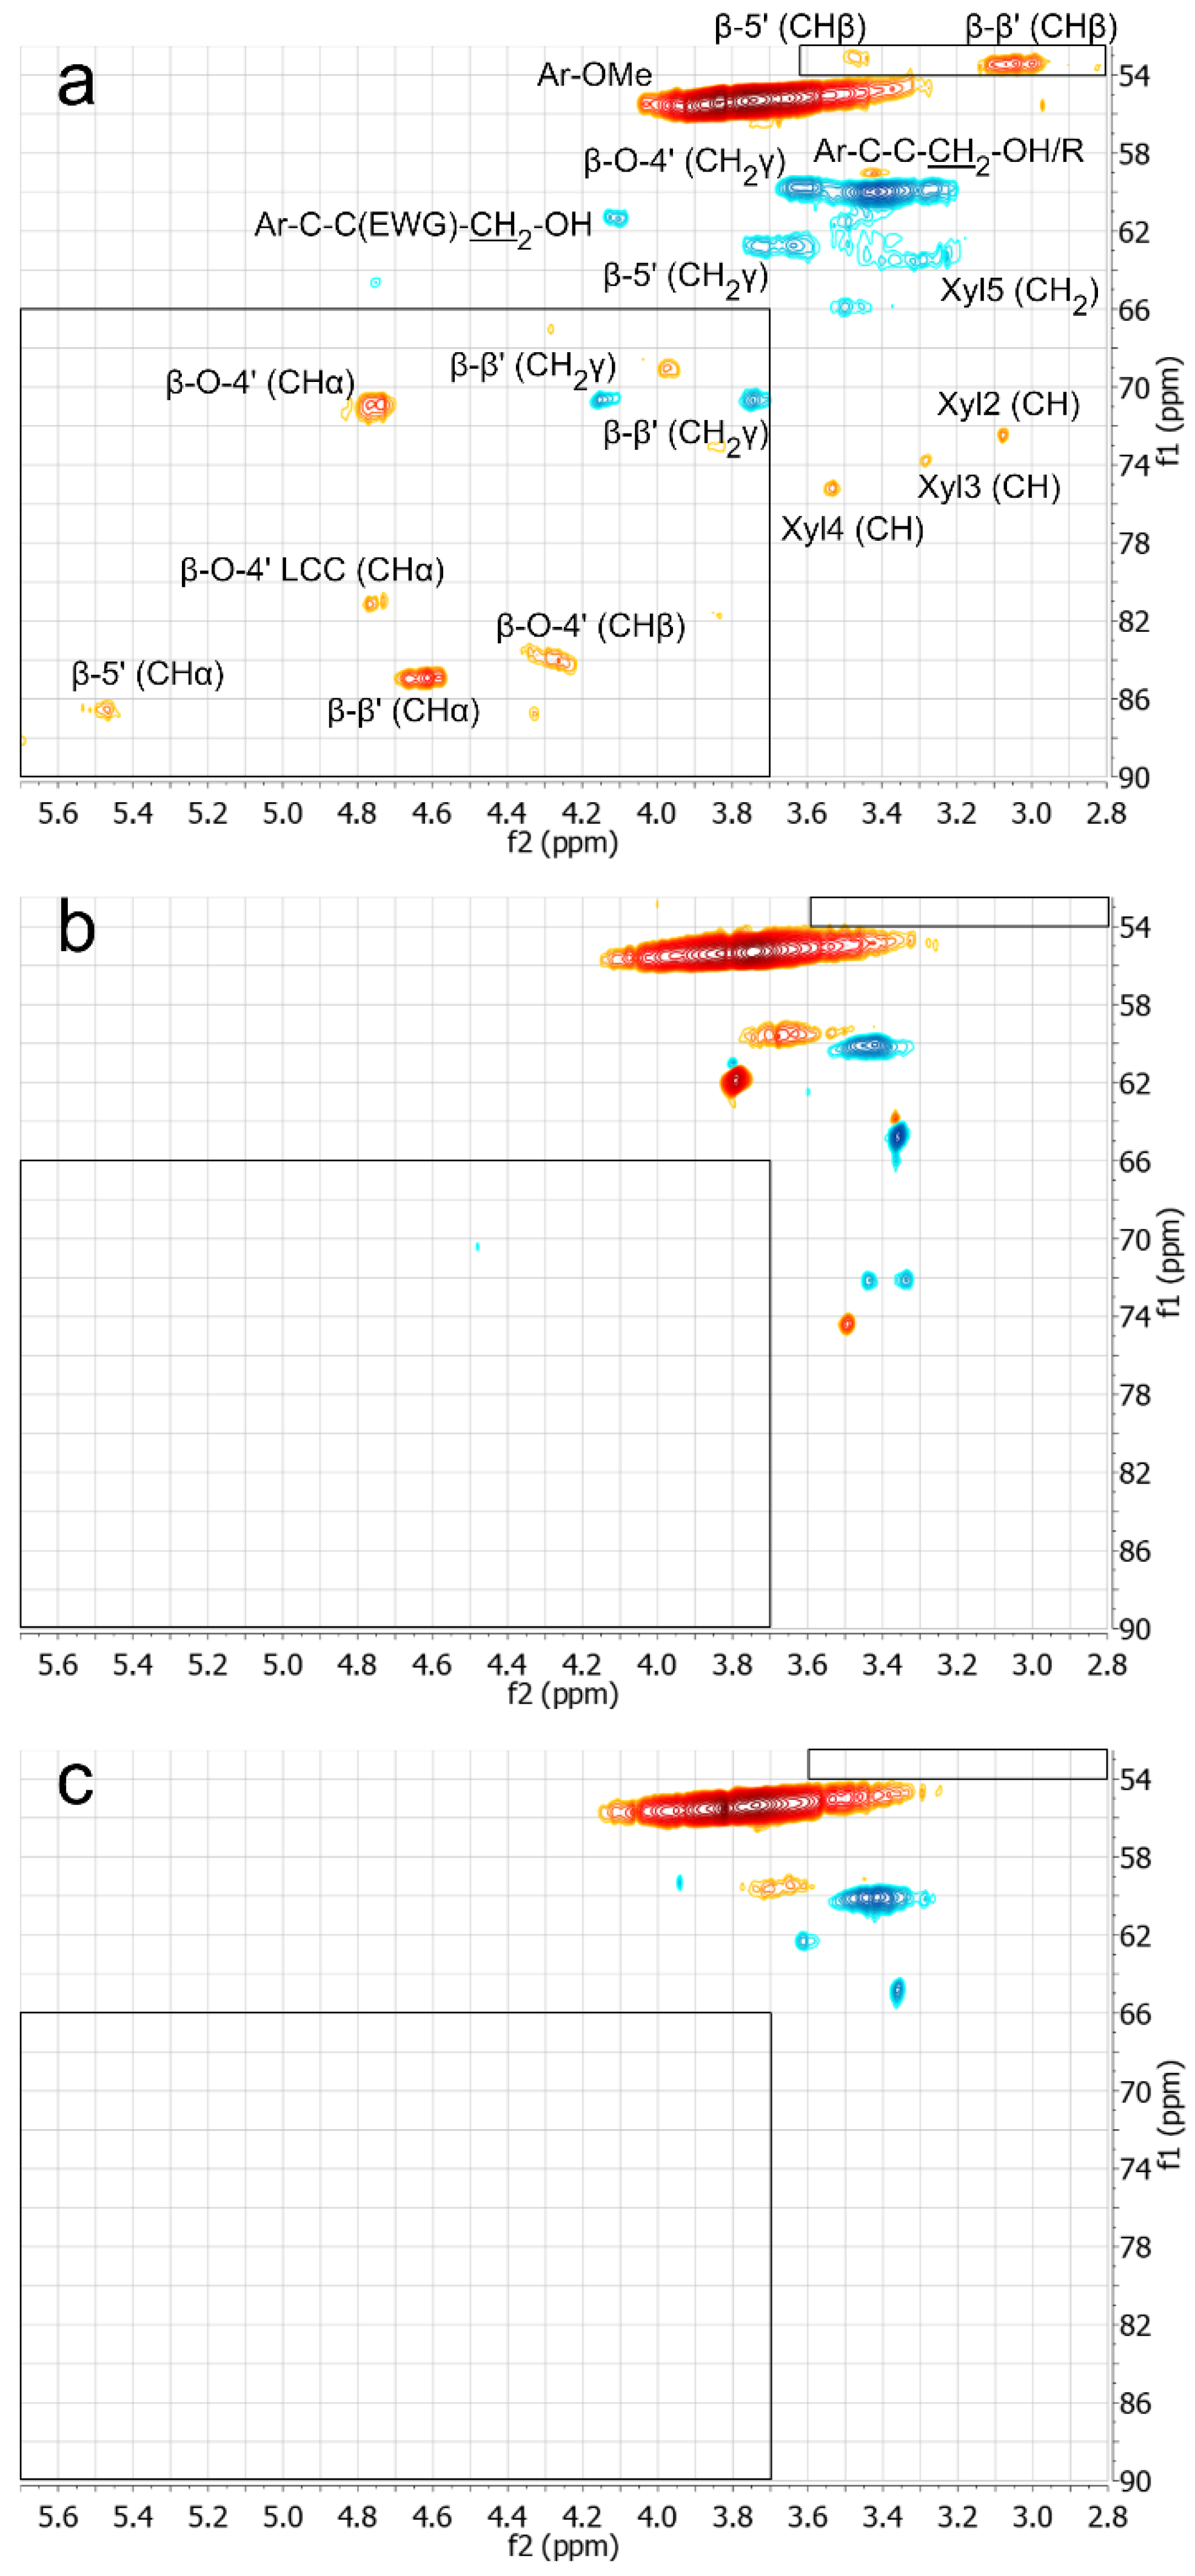
The 2D-NMR (HSQC) measurements were carried out on the lignin, char, and precipitated solids to investigate the structural changes that occur during the HTL. Typical results of these measurements are presented in Figure 3.
The peaks corresponding to the most common inter-unit linkages in Kraft lignin, i.e., β-O-4′, β-5′, and β-β’, as well as other types of bonds between building blocks in lignin, are typically observed within the spectral regions marked with black squares in Figure 3 [20,43]. These peaks, and consequently bonds, are absent in the spectra of char and precipitated solids. Most of the char and precipitated solids are, therefore, lignin-derived structures with the main inter-unit linkages broken, rather than unreacted lignin. The remaining peaks in the spectra of the char and precipitated solids are for example methoxy groups bound to aromatic rings, residual IPA, and methylene moieties bound to hydroxyl groups on aliphatic side chains. Figure S3 in the Supplementary Materials shows the aromatic regions of the spectra in which no major changes were detected.

3.2. Yields

The yields of the various product fractions are summarised in Figure 4 and more extensively in Table S1. The yields are defined as Y i ( % ) = 100   m i / m d r y   l i g , where Yi is the yield of fraction i, mi is the mass of fraction i, and mdry lig is the mass of dry lignin loaded into the reactor.
The yield of char increased with increasing temperature, while the yields of water-soluble organics, i.e., precipitated solids and ASO, decreased (cf. Figure 4a).
Increasing the IPA content in the reaction mixture reduced the yield of char and increased that of water-soluble organics (cf. Figure 4b). Nevertheless, the char yield ranges between 16 and 36 wt % of the lignin loaded in this study, which is well above the results obtained when using phenol as a capping agent in the HTL of Kraft lignin under similar reaction conditions. In such experiments, Arturi et al. reported 1.4–22.4 wt % char yield on the dry lignin loaded [25], and Belkheiri et al. reported 14.1–23.5 wt % [14,18,44]. Moreover, for yields of solid residue, Lee et al. reported between 19 and 60% and Cheng et al. 37 and 54% when depolymerising Kraft and alkaline lignin, respectively, in mixtures of water and EtOH without any alkaline catalyst [29,31]. The results of using IPA as a capping agent thus resemble those of using EtOH rather than phenol in terms of providing a higher char yield.

3.3. Elemental Composition

The elemental composition of the char and precipitated solids is reported in Table 2. The composition of the solid products from the HTL treatment differs somewhat from the original lignin, with the sulphur levels in particular dropping to trace amounts. This reduction in sulphur is similar to that of another HTL experiment using LignoBoost Kraft lignin [17]. The contents of carbon, hydrogen, and oxygen, however, do not change much at the IPA and temperature levels used in the present study (cf. Table 2). Nevertheless, the reduction in oxygen suggests deoxygenation reactions occur, which partly explains why the mass balances in Figure 4 are not fully closed.
The greatest change found is for the char fraction, which displays an increase in the carbon content with increasing temperature. A similar trend of the carbon content in char increasing during lignin depolymerisation with increasing temperature was noted by Nguyen et al. [19]. Furthermore, the precipitated solids had a slightly higher content of oxygen than the char in most cases.

3.4. Molar Masses

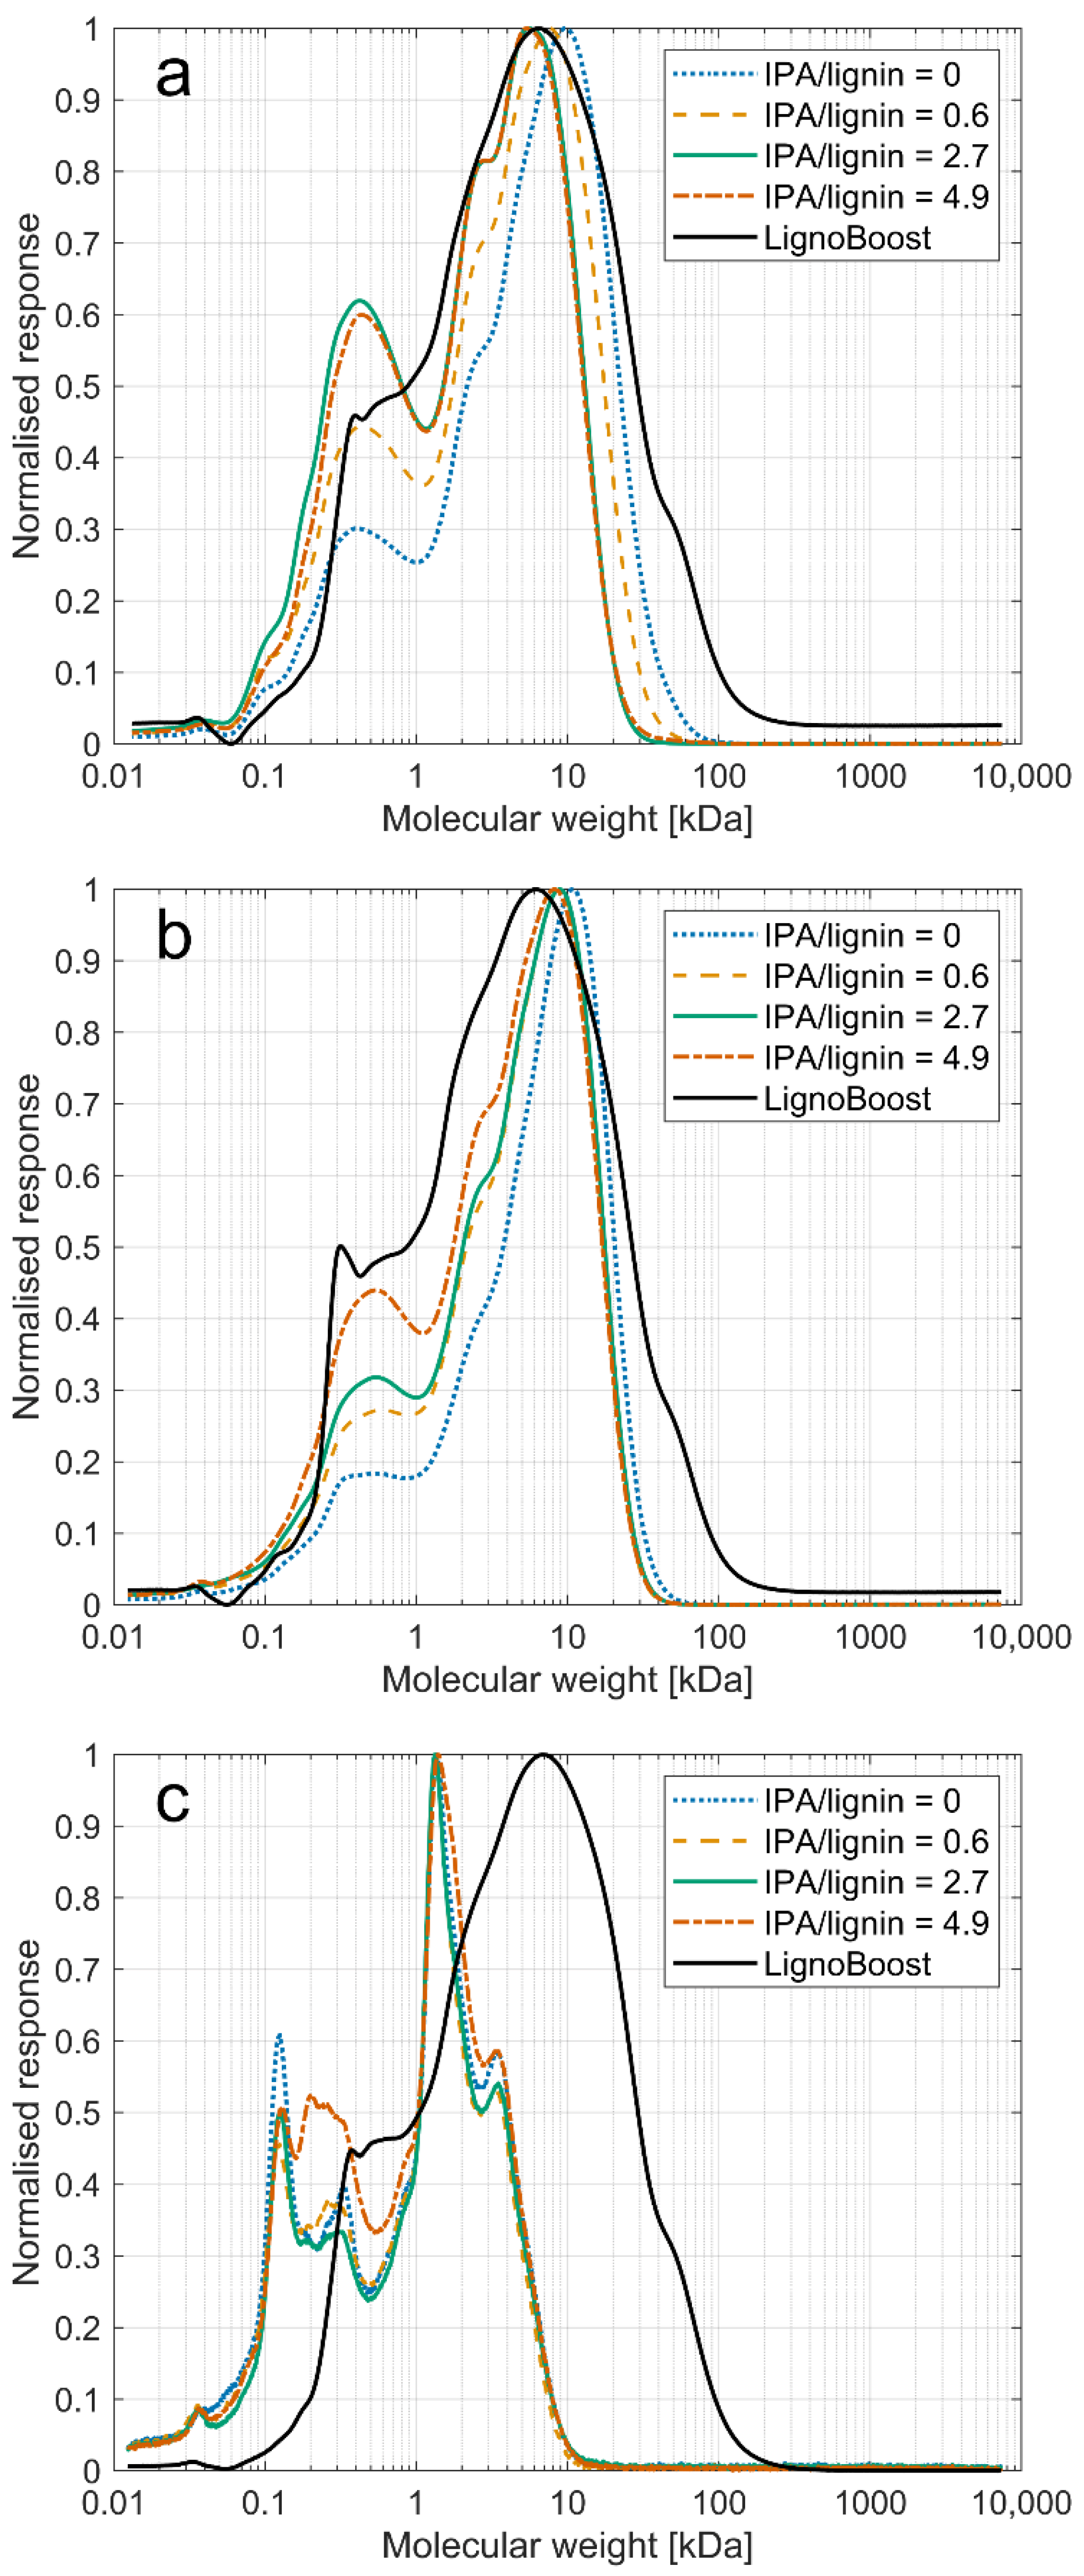
The mass average molar mass (MW) of the products is presented in Table 3 together with the polydispersity (PD). Furthermore, the chromatograms in the IPA series are given in Figure 5, while those of the temperature series are presented in the Supplementary Materials (cf. Figure S4).
The HTL process clearly reduces the molar masses of all the fractions compared to the lignin. Additionally, the MW of the char and the precipitated solids decreases with increasing IPA content: this can be seen in the chromatograms in Figure 5a,b, where the low molar mass peaks to the left increase with the IPA level. Furthermore, the peak positions are shifted to smaller MW. However, the molar masses remain high despite the inter-unit bond cleavage evident from the 2D-NMR: the lignin has thus been depolymerised, but the products have also repolymerised to a large extent. Nevertheless, the addition of IPA clearly decreases the MW compared with the case without the addition of IPA. Additionally, the char yield is reduced. The effect is stronger with higher IPA concentration, thereby indicating that IPA does indeed have a capping effect.
Increasing the temperature reduces the molar mass of the char (cf. Table 3), but the MW increases for the water-soluble compounds. Surprisingly enough, the MW of the precipitated solids are higher than that of the char, despite the former being dissolved in the liquid reactor product prior to the addition of acid. This is further discussed in Section 3.5.
The ASO, which are water-soluble at low pH, were unexpectedly found to contain high molar mass compounds, i.e., dimers and oligomers, seen in the right-hand peak of chromatogram in Figure 5c. The left-hand peak represents monomers with a molar mass around 180 Da. Whilst the MW of ASO increases with increasing temperature, it does not show a clear trend with increasing IPA levels.
Although the polydispersity (PD) decreases compared to the lignin during the HTL process, it remains high for all fractions. Increasing the temperature increases the PD for both the char and the precipitated solids; adding more IPA, however, causes it to decrease for the former and increase for latter. The high PD implies that the products retain their heterogenous molecular sizes despite fractionation into char, precipitated solids, and ASO. Additionally, the solubility of the products is not only a function of molecular mass; structural variations, such as functional groups, affect the solubility as well.

3.5. Functional Groups

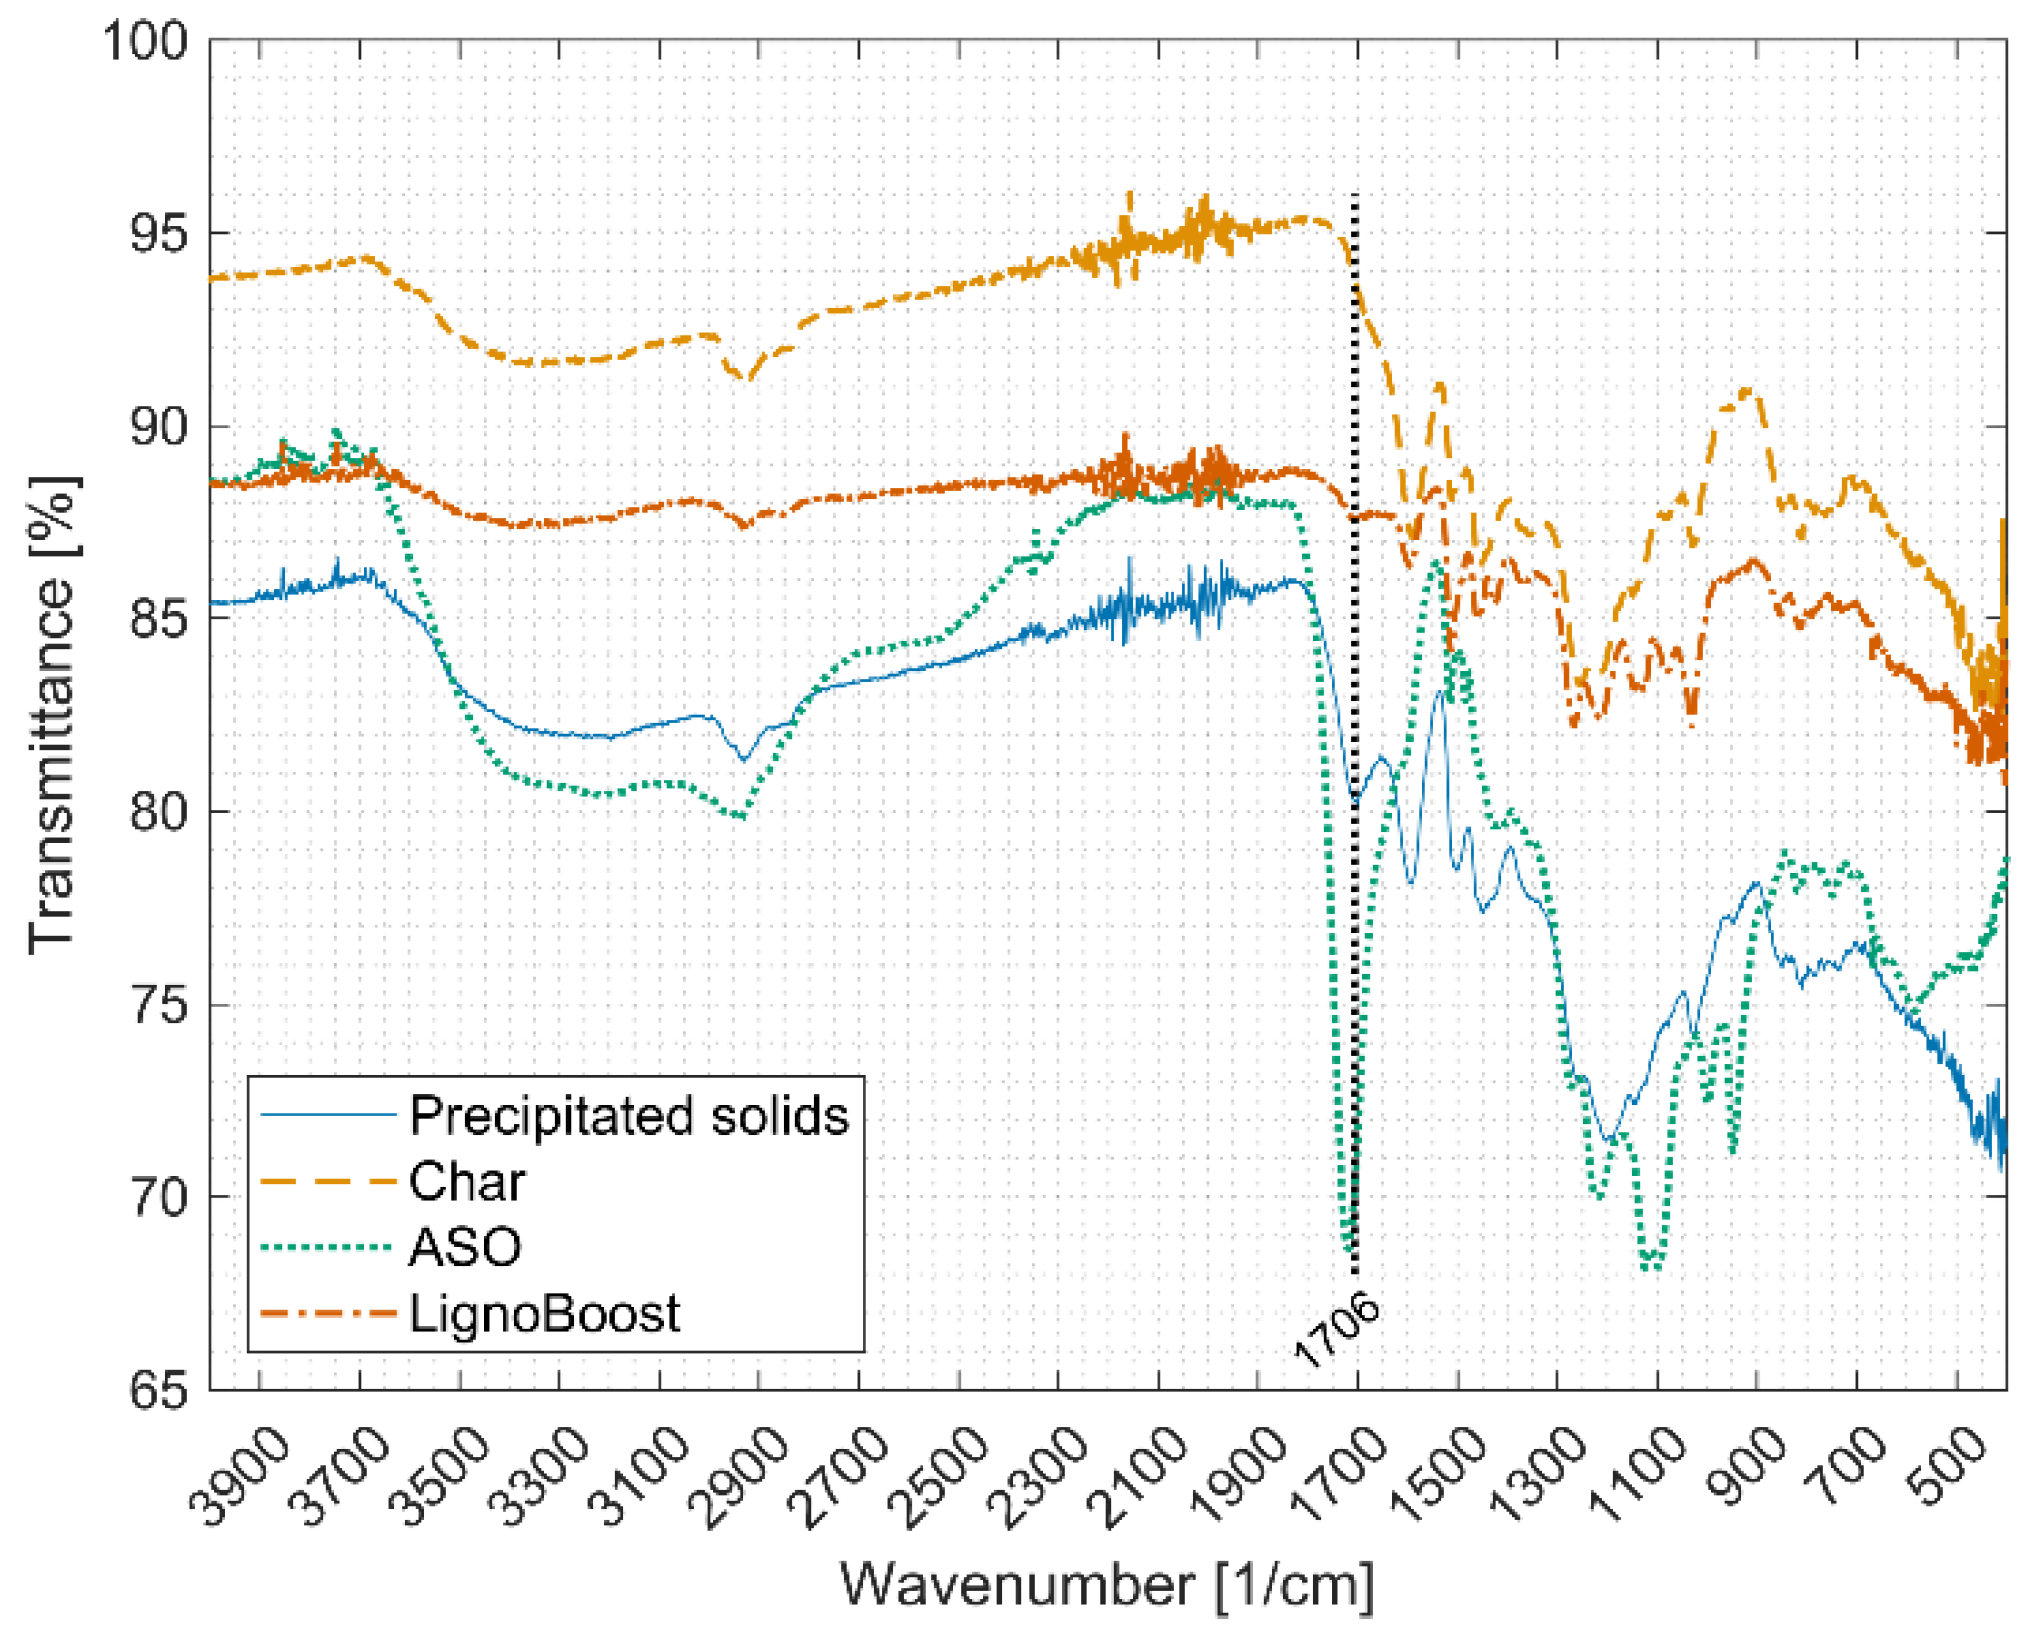
In order to investigate the unexpectedly higher MW of the precipitated solids compared to the MW of the char, the functional groups of the fractions were studied by ATR-FTIR. The precipitated solids display a large peak at 1706 cm−1 (cf. Figure 6), along with the absorption bands of the OH group at 3300–2500 and 1440–1395 cm−1, all typical of carboxylic acid groups. The carboxylic acid content in the precipitated solids was further confirmed with 1H-NMR, showing a broad peak between 12 and 13 ppm typically attributed to the OH proton of the carboxylic acids (cf. Figure S5 in the Supplementary Materials). It is thus likely that the higher oxygen content of precipitated solids compared to char originates, at least partly, from hydroxyl and/or carboxylic acid groups. These functional groups contribute to the enhanced solubility of precipitated solids in the liquid product obtained after the HTL treatment. Considering that the MW of precipitated solids increases with temperature, it is possible that the content of hydroxyl and carboxylic groups increases with temperature.
The ASO fraction also displays signals typical of carboxylic acids. Although there could be some interference from residual water, the content of OH seems to be large in this fraction judging from the broad peak at 3700–3100 cm−1. Despite their surprisingly high MW (cf. Table 3 and Figure 5), the ASO components could, therefore, remain dissolved as a consequence of a high content of polar groups.
No carboxyl peak at 1706 cm−1 is found in the spectrum of the char (precipitated at pH 8.7–9.2). The char and the precipitated solids, therefore, differ in that the latter contains carboxylic functionalities which the former lacks. This would form a part of the explanation as to why precipitated solids are dissolved at high pH, while the char is precipitated at these conditions despite its lower MW. It is thus likely that the high content of O in the char (cf. Table 2) is bound in other functionalities such as aromatic methoxy groups, which is seen in the NMR-spectra in Figure 3.

3.6. Monoaromatics

Guaiacol and alkyl guaiacols were the most common mono-aromatic products identified with GC–MS: this was expected, because the lignin was sourced from softwood (cf. Figure S6 in the Supplementary Materials). Increasing the temperature decreases the amount of guaiacol, as shown in the work of Nguyen et al. and Wahyudiono et al. [19,45], whereas no clear effect of an increased content of IPA could be found.
No phenolic compounds were identified in the reference sample without any lignin, which suggests the aromatics identified originate from the lignin. A small amount of acetone could, however, be detected indicating that part of the IPA reacts during the HTL conditions without lignin.
Quantitation of the compounds identified by GC–MS amounted to around 4 wt % of the dry lignin loaded, which is in line with the results of Arturi et al. who depolymerised lignin under similar conditions in the same reactor but with phenol as the capping agent [25]. However, the content of phenol derivatives here is much lower compared to that study. This indicates that many of the phenolic derivatives in previous works in which phenol was used as a capping agent instead of IPA originated from the added phenol rather than the lignin structure [19,25], a phenomenon previously noted by Saisu et al. [6]. No apparent alkylation by IPA on the phenolic mono-aromatics could be identified by GC–MS, contrasting the results of Saisu et al. and Sato et al. [6,46].

4. Conclusions

Depolymerising LignoBoost Kraft lignin with HTL (290–335 °C, 250 bar, 12 min) using Na2CO3 as a catalyst and IPA as a capping agent resulted in the cleavage of the common inter-unit linkages of lignin, evidenced by NMR measurements, and a reduction in sulphur content. Solid char and an aqueous phase, containing water-soluble organics, were formed but no oil phase. The molecular weight remained high for the char as well as for the water-soluble organics. This implies that the lignin was depolymerised, as indicated by NMR, but also repolymerised to a large extent. The char fraction is thus not unreacted lignin, but a new phase.
Increasing IPA levels reduced the molar mass of both the char and the precipitated solids. Additionally, the char yield decreased while the yield of water-soluble organics increased. IPA, therefore, acts as a capping agent under these reaction conditions. Yet, the observed char-suppressing effect at these reaction conditions is not as good as that observed for other capping agents, such as phenol, which is reported in the literature to lead to larger char reductions at comparable reaction temperatures and times.

Supplementary Materials

The following are available online at https://www.mdpi.com/1996-1073/14/4/932/s1, Table S1: Average temperature and pressure, and their respective ranges, during the reaction., Figure S1: Temperature (left) and pressure (right) profiles in the reactor during injection, reaction, and discharge in the IPA series, Figure S2: Temperature (left) and pressure (right) profiles in the reactor during injection, reaction, and discharge in the temperature series, Figure S3: Aromatic region, δCH 90-155/4.0-9.2ppm, of the heteronuclear single quantum coherence spectroscopy (HSQC) spectra of the LignoBoost lignin (a), char (b) and precipitated solids (c), Figure S4: Gel permeation chromatography (GPC) chromatograms in the temperature series for char (a), precipitated solids (b) and ASO (c), Figure S5: 1H-NMR spectra of the precipitated solids in the temperature series: 335 °C, 320 °C and 290 °C. The weak broad peak between 12 and 13 ppm in each spectrum, marked with a black box, represents the carboxylic acids, Figure S6: Typical gas chromatography (GC) chromatogram of the DEE-extracted ASO. Peak 4 is a mixture of creosol and catechol and therefore not properly resolved, Peak 7 is the internal standard and Peak 9 the solvent preservative.

Author Contributions

Conceptualization, H.T.; funding acquisition, H.T.; investigation, A.A., M.M., R.N., H.L., M.H. and H.T.; methodology, A.A., M.H., M.M., H.L. and H.T.; project administration, H.T.; visualization, A.A.; writing—original draft, A.A.; writing—review and editing, A.A., M.H., H.L., M.M., R.N. and H.T. All authors have read and agreed to the published version of the manuscript.

Funding

This work was funded by the Swedish Energy Agency, grant number 45395-1, which had no other involvement in this study.

Data Availability Statement

Data are contained within the article and supplementary material.

Acknowledgments

Our thanks go to Ulrika Brath for her technical support with the NMR analysis at the Swedish NMR Centre at the University of Gothenburg, Dorte Spangsmark for her analytical contributions to the experiments, and Maureen Sondell for language review.

Conflicts of Interest

The authors declare no conflict of interest.

Abbreviations

AASAtomic absorption spectroscopy
ASOAcid-soluble organics
ATRAttenuated total reflectance
BHTButylated hydroxytoluene
CHNSElemental analysis
DEEDiethyl ether
DMSODimethyl sulfoxide
DMSO-d6Deuterated dimethyl sulfoxide
EtOHEthanol
EWGElectron withdrawing group
FTIRFourier transform infrared spectroscopy
GCGas chromatography
GPCGel permeation chromatography
HSQCHeteronuclear single quantum coherence spectroscopy
HTLHydrothermal liquefaction
IPAIsopropanol
LCCLignin–carbohydrate complex
MeOHMethanol
MN
MS
Number average molar mass
Mass spectrometry
MWMass average molar mass
NMRNuclear magnetic resonance
PDPolydispersity
UVUltraviolet light
XylXylan

References

  1. Ragauskas, A.J.; Williams, C.K.; Davison, B.H.; Britovsek, G.; Cairney, J.; Eckert, C.A.; Frederick, W.J.; Hallett, J.P.; Leak, D.J.; Liotta, C.L.; et al. The path forward for biofuels and biomaterials. Science 2006, 311, 484–489. [Google Scholar] [CrossRef] [Green Version]
  2. Lappalainen, J.; Baudouin, D.; Hornung, U.; Schuler, J.; Melin, K.; Bjelić, S.; Vogel, F.; Konttinen, J.; Joronen, T. Sub- and Supercritical Water Liquefaction of Kraft Lignin and Black Liquor Derived Lignin. Energies 2020, 13, 3309. [Google Scholar] [CrossRef]
  3. Otromke, M.; White, R.J.; Sauer, J. Hydrothermal base catalyzed depolymerization and conversion of technical lignin—An introductory review. Carbon Resour. Convers. 2019, 2, 59–71. [Google Scholar] [CrossRef]
  4. Serrano, L.; Antonio, J.; Cristina, C.; Sancho, G. Lignin Depolymerization to BTXs. Top. Curr. Chem. 2019, 1–28. [Google Scholar] [CrossRef]
  5. Dellon, L.D.; Yanez, A.J.; Li, W.; Mabon, R.; Broadbelt, L.J. Computational Generation of Lignin Libraries from Diverse Biomass Sources. Energy Fuels 2017, 31, 8263–8274. [Google Scholar] [CrossRef]
  6. Saisu, M.; Sato, T.; Watanabe, M.; Adschiri, T.; Arai, K. Conversion of lignin with supercritical water-phenol mixtures. Energy Fuels 2003, 17, 922–928. [Google Scholar] [CrossRef]
  7. Schutyser, W.; Renders, T.; Van Den Bosch, S.; Koelewijn, S.F.; Beckham, G.T.; Sels, B.F. Chemicals from lignin: An interplay of lignocellulose fractionation, depolymerisation, and upgrading. Chem. Soc. Rev. 2018, 47, 852–908. [Google Scholar] [CrossRef]
  8. Lora, J. Industrial Commercial Lignins: Sources, Properties and Applications. In Monomers, Polymers and Composites from Renewable Resources; Belgacem, M.N., Gandini, A., Eds.; Elsevier: Amsterdam, The Netherlands, 2008; pp. 225–241. ISBN 978-0-08-045316-3. [Google Scholar]
  9. Tomani, P. The lignoboost process. Cellul. Chem. Technol. 2010, 44, 53–58. [Google Scholar]
  10. Berlin, A.; Balakshin, M. Industrial Lignins: Analysis, Properties, and Applications. In Bioenergy Research: Advances and Applications; Gupta, V.K., Tuohy, M.G., Kubicek, C.P., Saddler, J., Xu, F., Eds.; Elsevier: Amsterdam, The Netherlands, 2014; pp. 315–336. ISBN 9780444595614. [Google Scholar]
  11. Strassberger, Z.; Tanase, S.; Rothenberg, G. The pros and cons of lignin valorisation in an integrated biorefinery. RSC Adv. 2014, 4, 25310–25318. [Google Scholar] [CrossRef] [Green Version]
  12. Pandey, M.P.; Kim, C.S. Lignin Depolymerization and Conversion: A Review of Thermochemical Methods. Chem. Eng. Technol. 2011, 34, 29–41. [Google Scholar] [CrossRef]
  13. Kruse, A.; Dahmen, N. Water—A magic solvent for biomass conversion. J. Supercrit. Fluids 2015, 96, 36–45. [Google Scholar] [CrossRef]
  14. Belkheiri, T.; Vamling, L.; Nguyen, T.D.H.; Maschietti, M.; Olausson, L.; Andersson, S.-I.; Åmand, L.-E.; Theliander, H. Kraft lignin depolymerization in near-critical water: Effect of changing co-solvent. Cellul. Chem. Technol. 2014, 48, 813–818. [Google Scholar]
  15. Abdelaziz, O.Y.; Li, K.; Tunå, P.; Hulteberg, C.P. Continuous catalytic depolymerisation and conversion of industrial kraft lignin into low-molecular-weight aromatics. Biomass Convers. Biorefinery 2018, 8, 455–470. [Google Scholar] [CrossRef] [Green Version]
  16. Schuler, J.; Hornung, U.; Kruse, A.; Dahmen, N.; Sauer, J. Hydrothermal Liquefaction of Lignin. J. Biomater. Nanobiotechnol. 2017, 8, 96–108. [Google Scholar] [CrossRef] [Green Version]
  17. Nguyen, T.D.H.; Maschietti, M.; Belkheiri, T.; Åmand, L.E.; Theliander, H.; Vamling, L.; Olausson, L.; Andersson, S.I. Catalytic depolymerisation and conversion of Kraft lignin into liquid products using near-critical water. J. Supercrit. Fluids 2014, 86, 67–75. [Google Scholar] [CrossRef] [Green Version]
  18. Belkheiri, T.; Andersson, S.-I.; Mattsson, C.; Olausson, L.; Theliander, H.; Vamling, L. Hydrothermal liquefaction of kraft lignin in sub-critical water: The influence of the sodium and potassium fraction. Biomass Convers. Biorefinery 2018, 8, 585–595. [Google Scholar] [CrossRef] [Green Version]
  19. Nguyen, T.D.H.; Maschietti, M.; Åmand, L.E.; Vamling, L.; Olausson, L.; Andersson, S.I.; Theliander, H. The effect of temperature on the catalytic conversion of Kraft lignin using near-critical water. Bioresour. Technol. 2014, 170, 196–203. [Google Scholar] [CrossRef] [Green Version]
  20. Mattsson, C.; Andersson, S.I.; Belkheiri, T.; Åmand, L.E.; Olausson, L.; Vamling, L.; Theliander, H. Using 2D NMR to characterize the structure of the low and high molecular weight fractions of bio-oil obtained from LignoBoostTM kraft lignin depolymerized in subcritical water. Biomass Bioenergy 2016, 95, 364–377. [Google Scholar] [CrossRef]
  21. Thring, R.W. Alkaline degradation of ALCELL® lignin. Biomass Bioenergy 1994, 7, 125–130. [Google Scholar] [CrossRef]
  22. Karagöz, S.; Bhaskar, T.; Muto, A.; Sakata, Y. Hydrothermal upgrading of biomass: Effect of K2CO3 concentration and biomass/water ratio on products distribution. Bioresour. Technol. 2006, 97, 90–98. [Google Scholar] [CrossRef] [PubMed]
  23. Dunn, K.G.; Hobson, P.A. Hydrothermal liquefaction of lignin. In Sugarcane-Based Biofuels and Bioproducts; O’Hara, I., Mundree, S., Eds.; John Wiley & Sons, Inc.: Hoboken, NJ, USA, 2016; pp. 165–206. ISBN 9781118719923. [Google Scholar]
  24. Chandler, K.; Deng, F.; Dillow, A.K.; Liotta, C.L.; Eckert, C.A. Alkylation Reactions in Near-Critical Water in the Absence of Acid Catalysts. Ind. Eng. Chem. Res. 1997, 36, 5175–5179. [Google Scholar] [CrossRef]
  25. Arturi, K.R.; Strandgaard, M.; Nielsen, R.P.; Søgaard, E.G.; Maschietti, M. Hydrothermal liquefaction of lignin in near-critical water in a new batch reactor: Influence of phenol and temperature. J. Supercrit. Fluids 2017, 123, 28–39. [Google Scholar] [CrossRef]
  26. Akhtar, J.; Amin, N.A.S. A review on process conditions for optimum bio-oil yield in hydrothermal liquefaction of biomass. Renew. Sustain. Energy Rev. 2011, 15, 1615–1624. [Google Scholar] [CrossRef]
  27. Bobleter, O.; Concin, R. Degradation of poplar lignin by hydrothermal treatment. Cellul. Chem. Technol. 1979, 13, 583–593. [Google Scholar]
  28. Zhang, B.; Huang, H.J.; Ramaswamy, S. Reaction kinetics of the hydrothermal treatment of lignin. Appl. Biochem. Biotechnol. 2008, 147, 119–131. [Google Scholar] [CrossRef]
  29. Lee, H.-S.; Jae, J.; Ha, J.-M.; Suh, D.J. Hydro- and solvothermolysis of kraft lignin for maximizing production of monomeric aromatic chemicals. Bioresour. Technol. 2016, 203, 142–149. [Google Scholar] [CrossRef]
  30. Cheng, Y.; Zhou, Z.; Alma, M.H.; Sun, D.; Zhang, W.; Jiang, J. Direct liquefaction of alkali lignin in methanol and water mixture for the production of oligomeric phenols and aromatic ethers. J. Biobased Mater. Bioenergy 2016, 10, 76–80. [Google Scholar] [CrossRef]
  31. Cheng, S.; Wilks, C.; Yuan, Z.; Leitch, M.; Xu, C. Hydrothermal degradation of alkali lignin to bio-phenolic compounds in sub/supercritical ethanol and water-ethanol co-solvent. Polym. Degrad. Stab. 2012, 97, 839–848. [Google Scholar] [CrossRef]
  32. Sebhat, W. Valorisation de la Lignine par Catalyse Hétérogène en Condition Sous-Critique en Milieux Aqueux et eau/alcool. Ph.D. Dissertation, Université de Lyon, Lyon, France, 2016. [Google Scholar]
  33. Wu, Y.; Chen, Y.; Wu, K. Role of co-solvents in biomass conversion reactions using sub/supercritical water. In Near-Critical and Supercritical Water and Their Applications for Biorefineries; Fang, Z., Xu, C., Eds.; Springer: Dordrecht, The Netherlands, 2014; pp. 69–98. [Google Scholar]
  34. Kang, S.; Li, X.; Fan, J.; Chang, J. Hydrothermal conversion of lignin: A review. Renew. Sustain. Energy Rev. 2013, 27, 546–558. [Google Scholar] [CrossRef]
  35. Deepa, A.K.; Dhepe, P.L. Solid acid catalyzed depolymerization of lignin into value added aromatic monomers. RSC Adv. 2014, 4, 12625–12629. [Google Scholar] [CrossRef]
  36. Zakzeski, J.; Jongerius, A.L.; Bruijnincx, P.C.A.; Weckhuysen, B.M. Catalytic lignin valorization process for the production of aromatic chemicals and hydrogen. ChemSusChem 2012, 5, 1602–1609. [Google Scholar] [CrossRef]
  37. Ye, Y.; Fan, J.; Chang, J. Effect of reaction conditions on hydrothermal degradation of cornstalk lignin. J. Anal. Appl. Pyrolysis 2012, 94, 190–195. [Google Scholar] [CrossRef]
  38. Ye, Y.; Zhang, Y.; Fan, J.; Chang, J. Novel method for production of phenolics by combining lignin extraction with lignin depolymerization in aqueous ethanol. Ind. Eng. Chem. Res. 2012, 51, 103–110. [Google Scholar] [CrossRef]
  39. Yuan, Z.S.; Cheng, S.N.; Leitch, M.; Xu, C.B. Hydrolytic degradation of alkaline lignin in hot-compressed water and ethanol. Bioresour. Technol. 2010, 101, 9308–9313. [Google Scholar] [CrossRef]
  40. Yoshikawa, T.; Yagi, T.; Shinohara, S.; Fukunaga, T.; Nakasaka, Y.; Tago, T.; Masuda, T. Production of phenols from lignin via depolymerization and catalytic cracking. Fuel Process. Technol. 2013, 108, 69–75. [Google Scholar] [CrossRef]
  41. Jiang, Y.; Li, Z.; Tang, X.; Sun, Y.; Zeng, X.; Liu, S.; Lin, L. Depolymerization of cellulolytic enzyme lignin for the production of monomeric phenols over Raney Ni and acidic zeolite catalysts. Energy & Fuels 2015, 29, 1662–1668. [Google Scholar] [CrossRef]
  42. Güvenatam, B.; Heeres, E.H.J.; Pidko, E.A.; Hensen, E.J.M. Lewis-acid catalyzed depolymerization of Protobind lignin in supercritical water and ethanol. Catal. Today 2016, 259, 460–466. [Google Scholar] [CrossRef]
  43. Mattsson, C.; Hasani, M.; Dang, B.; Mayzel, M.; Theliander, H. About structural changes of lignin during kraft cooking and the kinetics of delignification. Holzforschung 2017, 71, 545–553. [Google Scholar] [CrossRef]
  44. Belkheiri, T.; Andersson, S.-I.; Mattsson, C.; Olausson, L.; Theliander, H.; Vamling, L. Hydrothermal Liquefaction of Kraft Lignin in Subcritical Water: Influence of Phenol as Capping Agent. Energy Fuels 2018, 32, 5923–5932. [Google Scholar] [CrossRef]
  45. Sasaki, M.; Goto, M. Thermal decomposition of guaiacol in sub- and supercritical water and its kinetic analysis. J. Mater. Cycles Waste Manag. 2011, 13, 68–79. [Google Scholar] [CrossRef]
  46. Sato, T.; Sekiguchi, G.; Adschiri, T.; Arai, K. Ortho-selective alkylation of phenol with 2-propanol without catalyst in supercritical water. Ind. Eng. Chem. Res. 2002, 41, 3064–3070. [Google Scholar] [CrossRef]
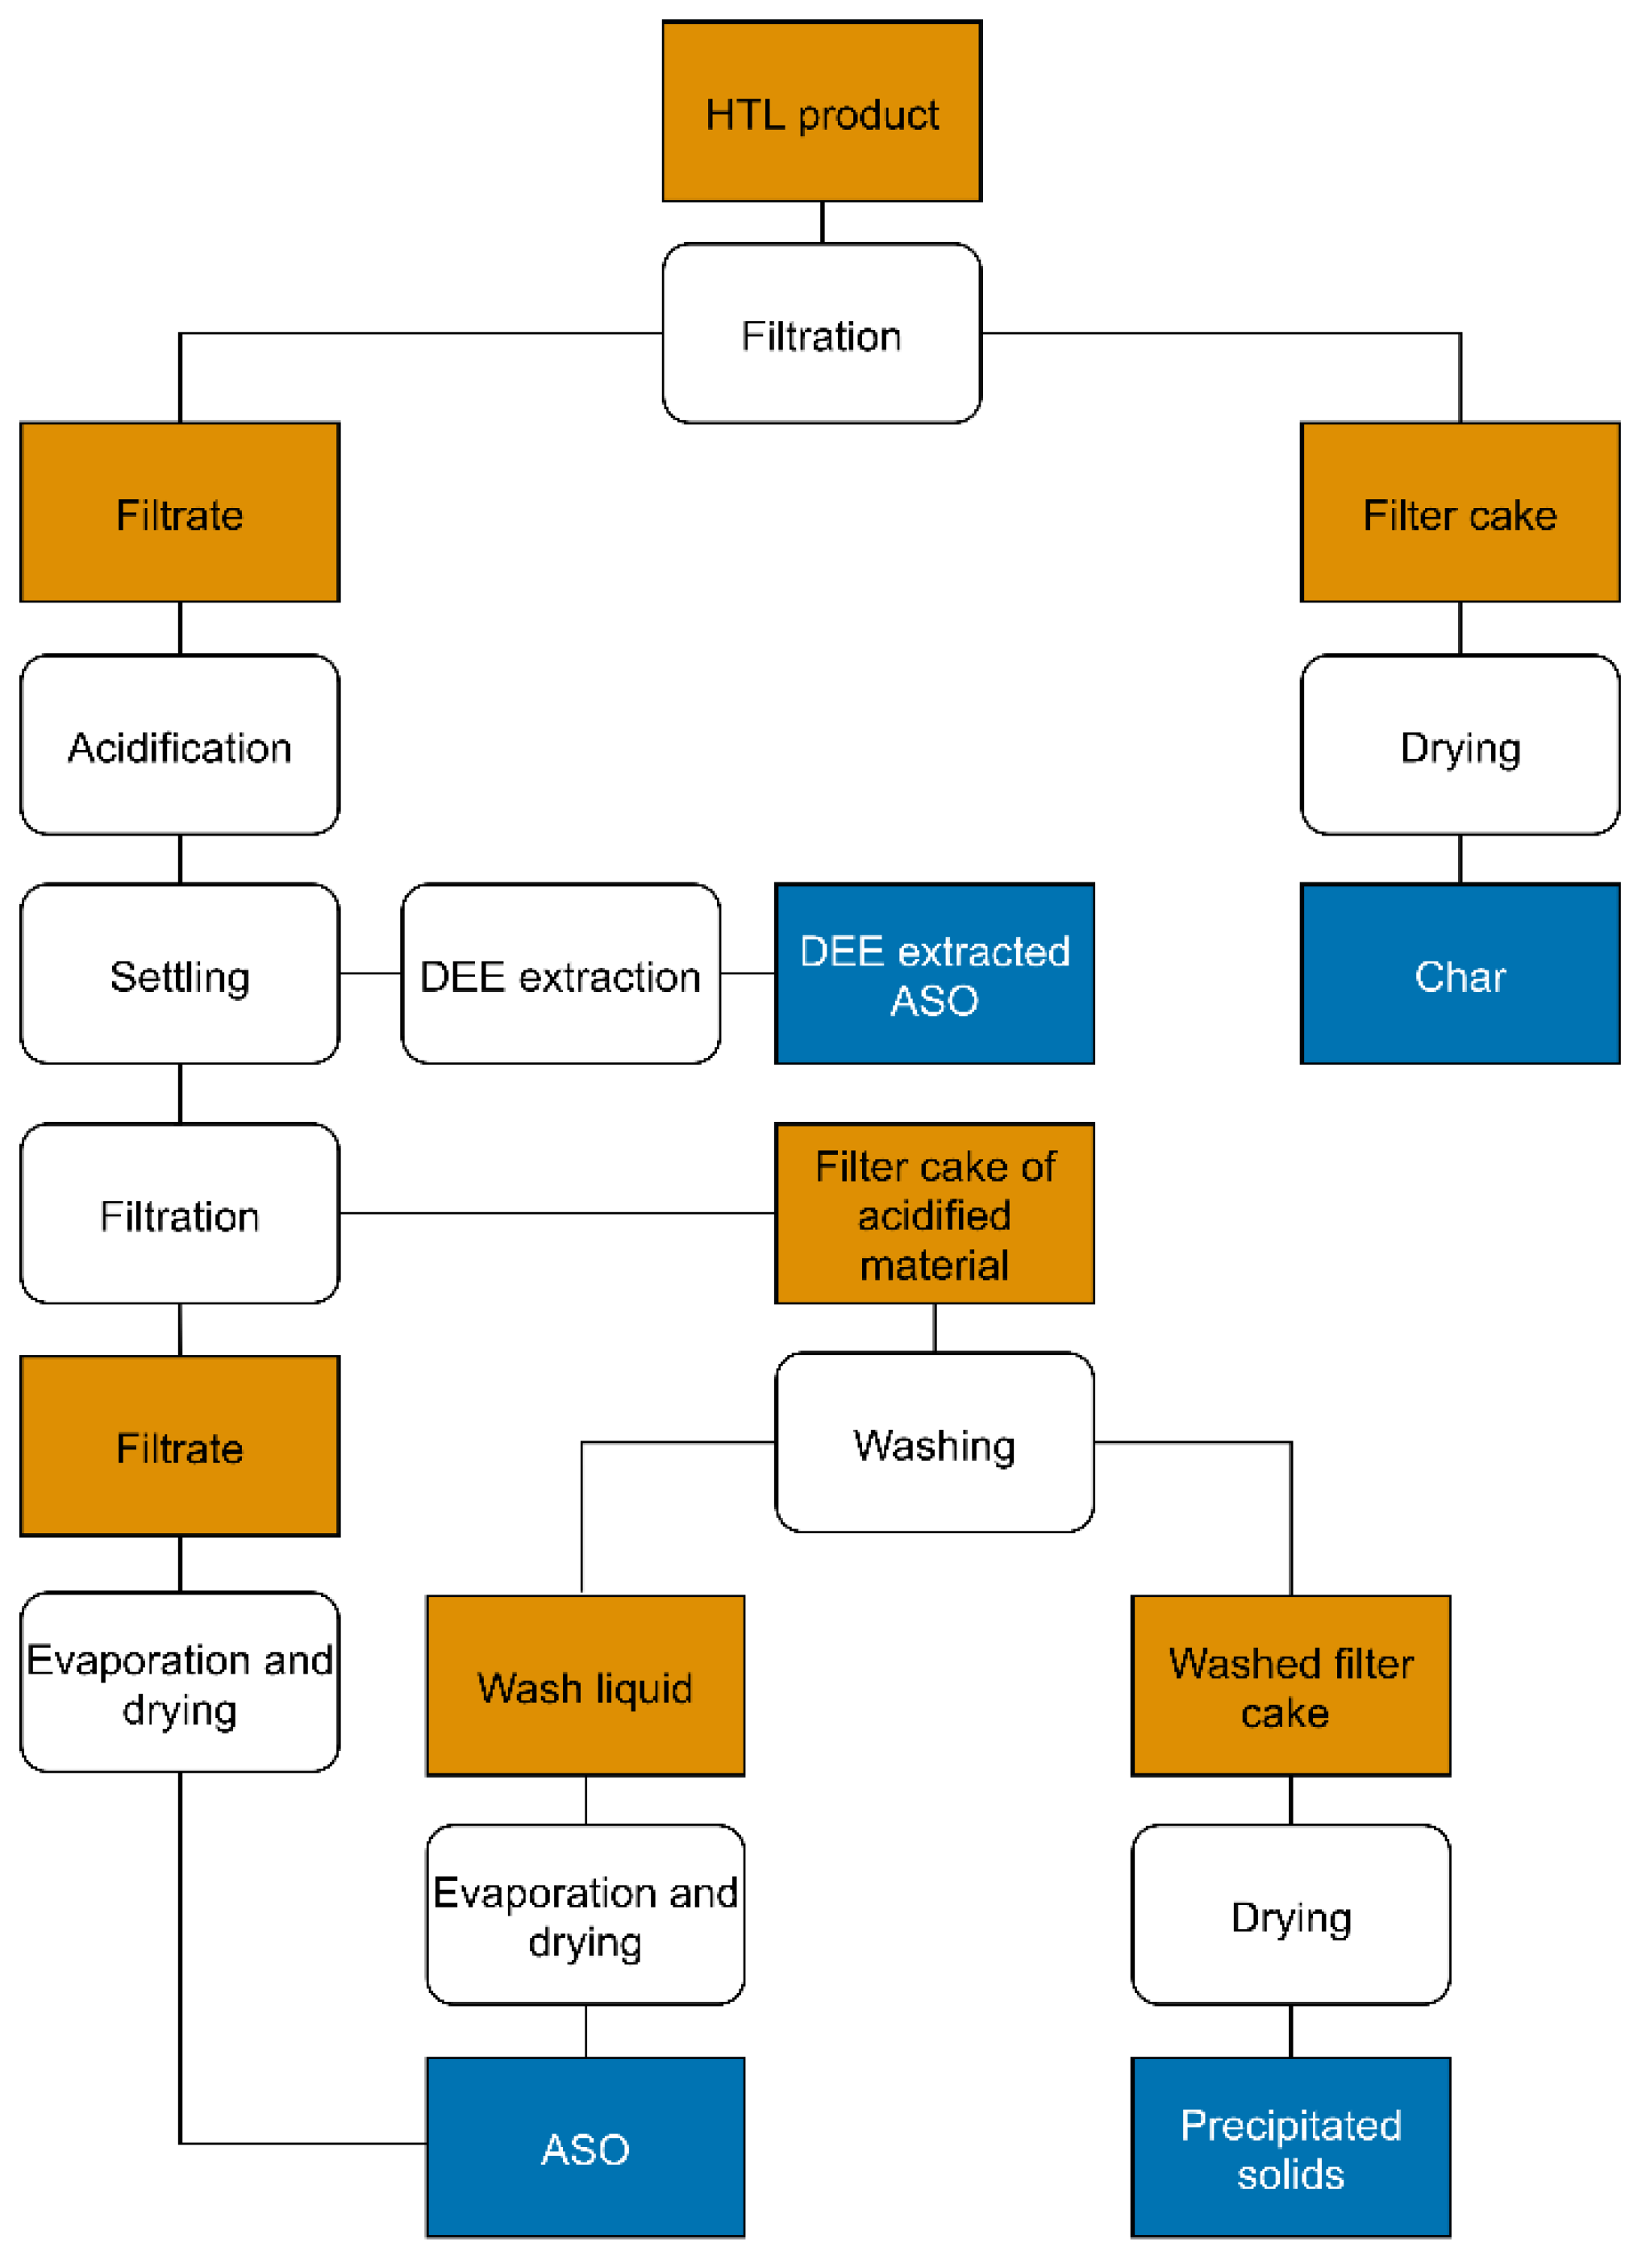
Figure 1. Schematic diagram of the fractionation of the reactor product.
Energies 14 00932 g001
Figure 2. Hydrothermal liquefaction (HTL) product (a), acidified aqueous reaction product with precipitates (b), and filtrate of the acidified aqueous reaction products (c).
Energies 14 00932 g002
Figure 3. Inter-unit aliphatic region δCH 52–90/2.8–5.7ppm of heteronuclear single quantum coherence spectroscopy (HSQC) spectra of the LignoBoost lignin (a), char (b) and precipitated solids (c). Notable inter-unit linkages and carbohydrate connections are marked with black squares [20]. EWG: electron withdrawing group. Xyl: xylan, with the corresponding carbon number. LCC: lignin–carbohydrate complex.
Energies 14 00932 g003
Figure 4. Yields obtained of the three product fractions vs. the dry lignin loaded in each reactor run: temperature series (a) and IPA series (b).
Energies 14 00932 g004
Figure 5. Gel permeation chromatography (GPC) chromatograms in the IPA series: char (a), precipitated solids (b), and ASO (c). These show that, with increasing IPA, the intensity of the low molar mass peak to the left increases for the char and precipitated solids.
Energies 14 00932 g005
Figure 6. Typical attenuated total reflectance Fourier transform infrared spectroscopy (ATR-FTIR) spectra of the precipitated solids, char, ASO, and lignin. It can be noted that the char lacks the carboxyl peak at 1706 cm−1.
Energies 14 00932 g006
Table 1. Experimental conditions and compositions of the reaction mixture. The experiment at 320 °C, 2.7 IPA/lignin was used in both series.
IPA/Dry Lignin [g/g]T [°C]P [bar]Reaction Product pHNa2CO3 [wt %]Water [wt %]IPA [wt %]Lignin (Dry) [wt %]
IPA Series
03202508.71.692.90.05.5
0.63202508.71.688.93.65.9
2.73202509.21.680.712.94.8
4.93202509.01.669.324.24.9
Ref.3202509.21.685.013.40.0
Temperature Series
2.72902508.91.678.014.95.5
2.73202509.21.680.712.94.8
2.73352509.21.680.613.04.8
Table 2. Elemental composition, with standard deviations, of the solids and LignoBoost lignin.
CharPrecipitated Solids
SampleC [wt %]H [wt %]O a [wt %]S [wt %]C [wt %]H [wt %]O a [wt %]S [wt %]
IPA Series
LignoBoost68.0 ± 0.05.7 ± 0.024.4 ± 0.11.97 ± 0.268.0 ± 0.05.7 ± 0.024.4 ± 0.11.97 ± 0.2
072.3 ± 0.14.8 ± 0.022.9 ± 0.1<0.8 b71.3 ± 0.04.8 ± 0.023.9 ± 0.0<0.8 b
0.673.5 ± 0.54.9 ± 0.021.6 ± 0.5<0.8 b70.0 ± 0.14.8 ± 0.025.3 ± 0.1<0.8 b
2.773.8 ± 2.05.1 ± 0.121.1 ± 2.1<0.8 b72.5 ± 0.15.0 ± 0.022.5 ± 0.1<0.8 b
4.970.6 ± 0.05.0 ± 0.024.4 ± 0.1<0.8 b72.9 ± 0.15.2 ± 0.021.9 ± 0.1<0.8 b
Temperature Series
LignoBoost68.0 ± 0.05.7 ± 0.024.4 ± 0.11.97 ± 0.268.0 ± 0.05.7 ± 0.024.4 ± 0.11.97 ± 0.2
290 °C70.1 ± 0.65.1 ± 0.124.9 ± 0.7<0.8 b72.3 ± 0.25.2 ± 0.022.6 ± 0.2<0.8 b
320 °C73.8 ± 2.05.1 ± 0.121.1 ± 2.1<0.8 b72.5 ± 0.15.0 ± 0.022.5 ± 0.1<0.8 b
335 °C76.1 ± 0.15.2 ± 0.018.7 ± 0.0<0.8 b70.9 ± 0.44.8 ± 0.024.3 ± 0.3<0.8 b
a Oxygen is calculated by difference. b Trace amounts below the limit for accurate quantification.
Table 3. Mass average molar mass (MW) and polydispersity (PD), with standard deviations, of the product fractions.
CharPrecipitated SolidsASO
SampleMW [kDa]PDMW [kDa]PDMW [kDa]PD
IPA Series
LignoBoost11.38 ± 0.087.0 ± 0.011.38 ± 0.087.0 ± 0.011.38 ± 0.087.0 ± 0.0
08.21 ± 0.046.4 ± 0.08.34 ± 0.034.7 ± 0.01.66 ± 0.015.3 ± 0.1
0.65.83 ± 0.015.8 ± 0.06.44 ± 0.014.6 ± 0.01.56 ± 0.005.1 ± 0.1
2.74.03 ± 0.015.2 ± 0.06.37 ± 0.034.8 ± 0.01.69 ± 0.025.1 ± 0.0
4.94.14 ± 0.004.9 ± 0.05.65 ± 0.015.0 ± 0.01.58 ± 0.004.8 ± 0.0
Temperature Series
LignoBoost11.38 ±0.087.0 ± 0.011.38 ± 0.087.0 ± 0.011.38 ± 0.087.0 ± 0.0
290 °C4.86 ± 0.004.7 ± 0.05.96 ± 0.004.6 ± 0.01.38 ± 0.004.7 ± 0.1
320 °C4.03 ± 0.015.2 ± 0.06.37 ± 0.034.8 ± 0.01.69 ± 0.025.1 ± 0.0
335 °C3.94 ± 0.015.4 ± 0.06.77 ± 0.015.0 ± 0.01.89 ± 0.004.9 ± 0.0
Publisher’s Note: MDPI stays neutral with regard to jurisdictional claims in published maps and institutional affiliations.