
Fossil vs. Active Geothermal Systems: A Field and Laboratory Method to Disclose the Relationships between Geothermal Fluid Flow and Geological Structures at Depth


Abstract
1. Introduction
2. Methodology
2.1. Active System
2.2. Fossil System
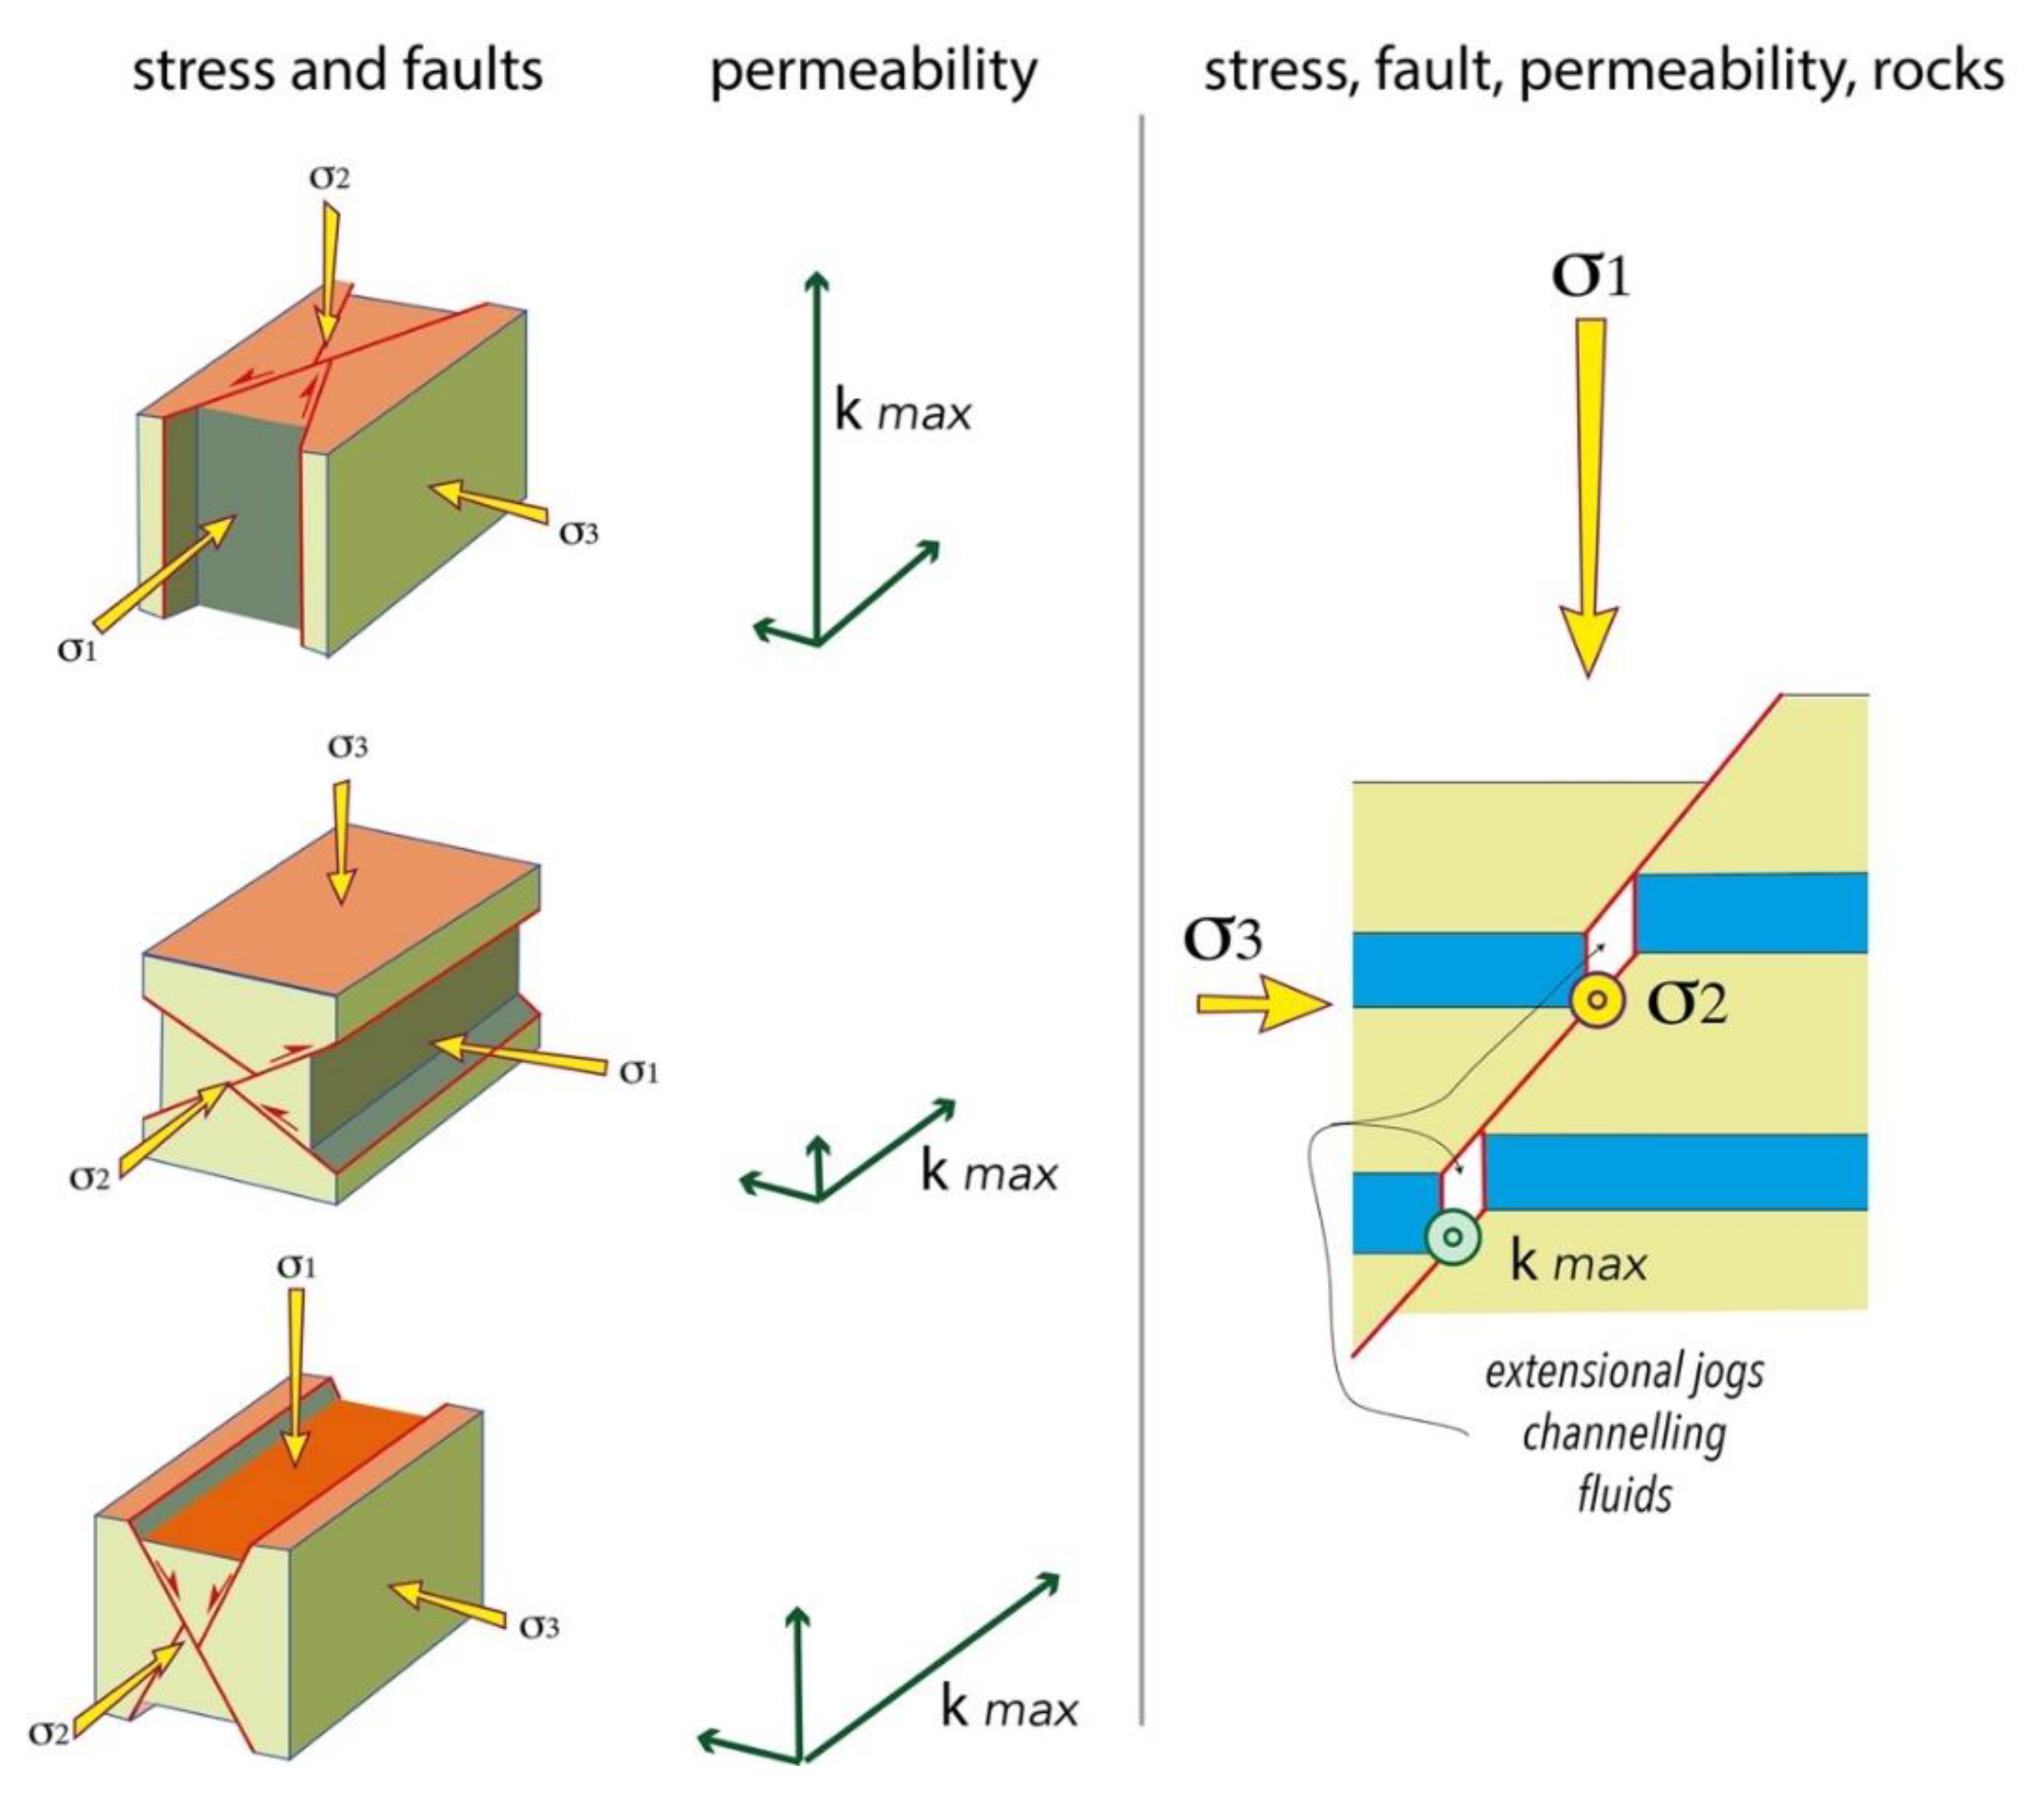
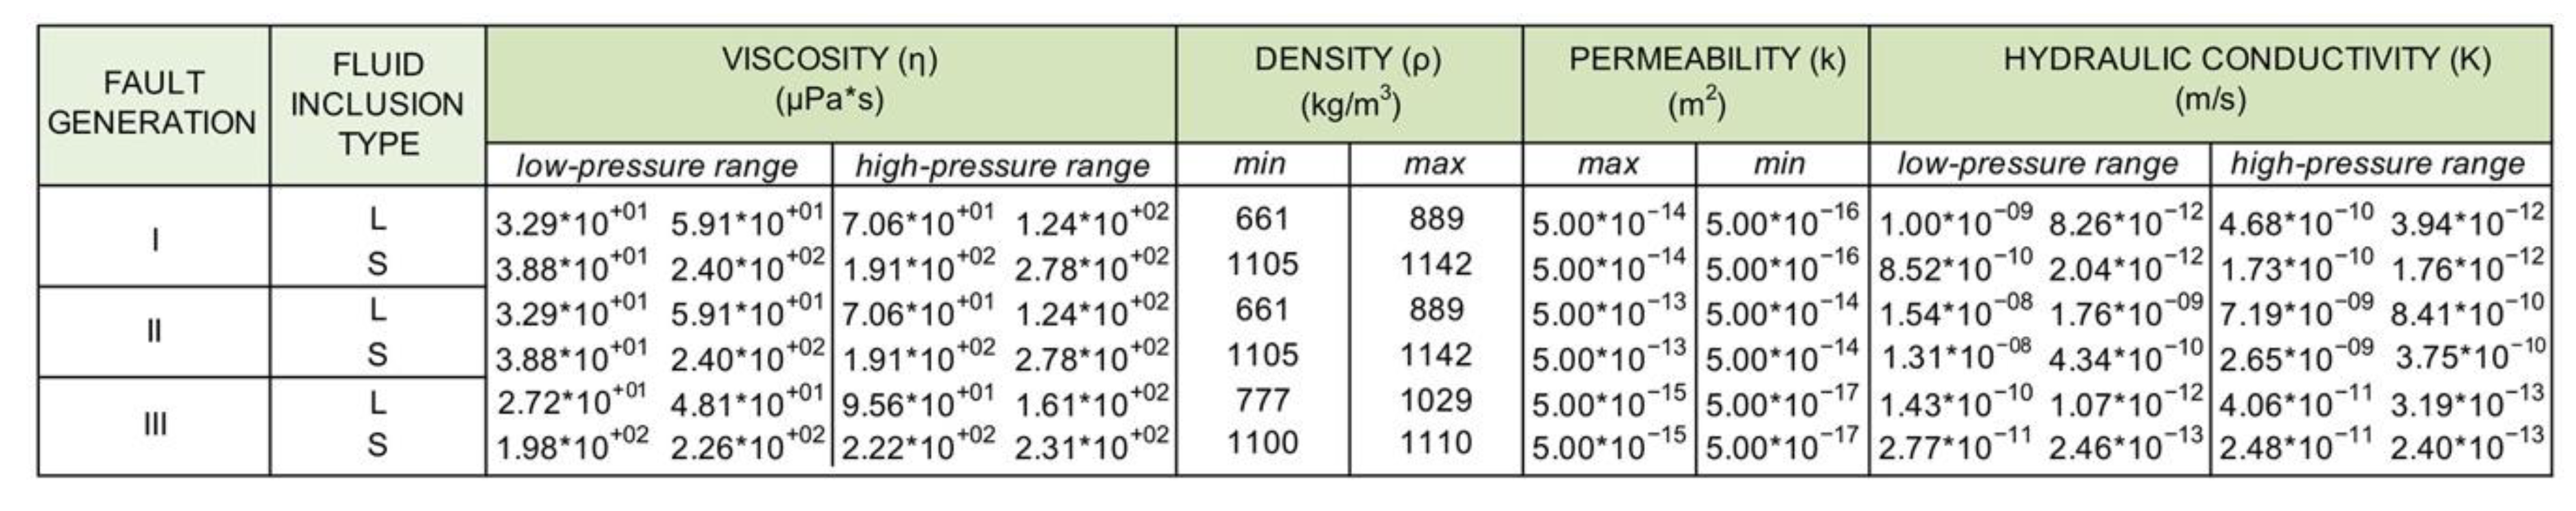
2.2.1. Permeability
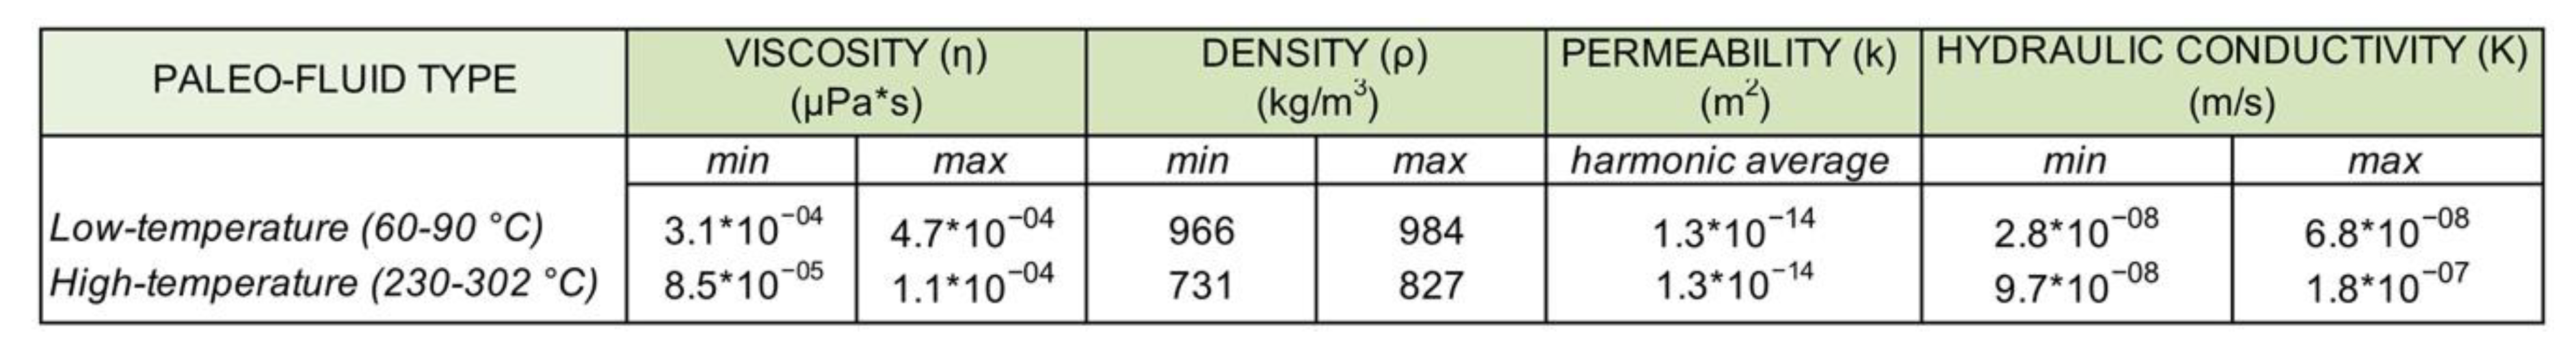
2.2.2. Properties of the Paleo-Fluids
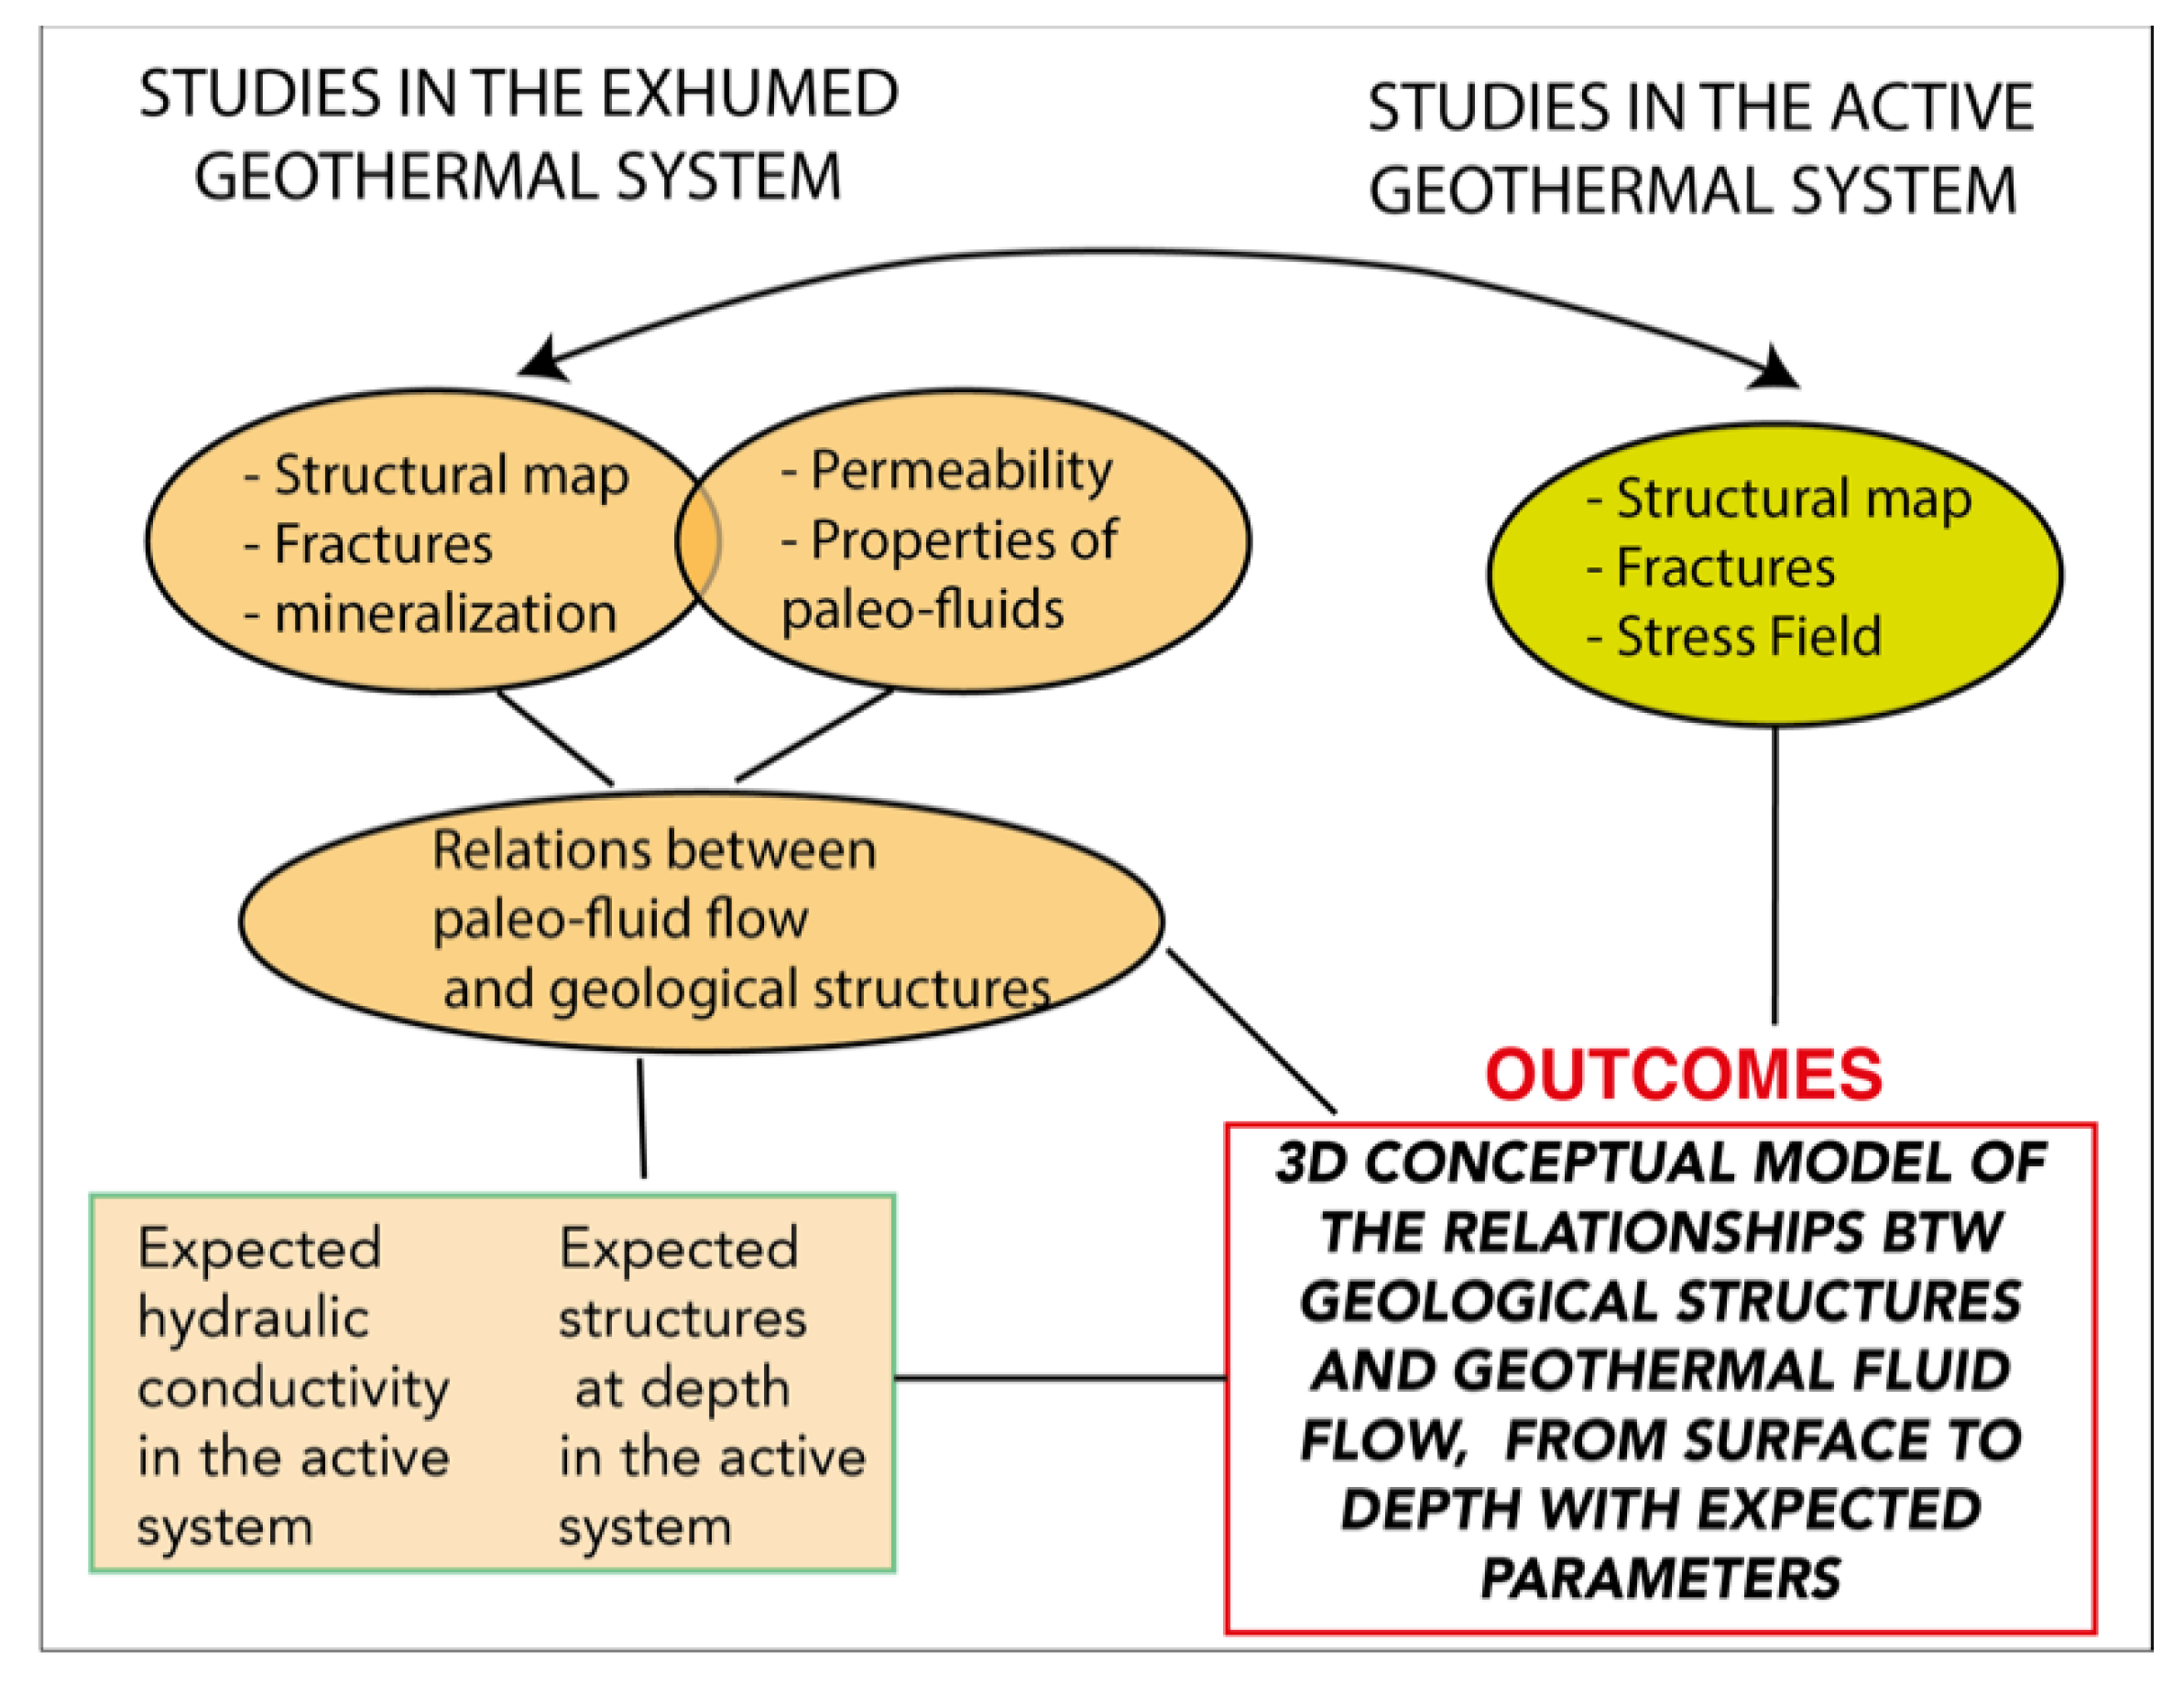
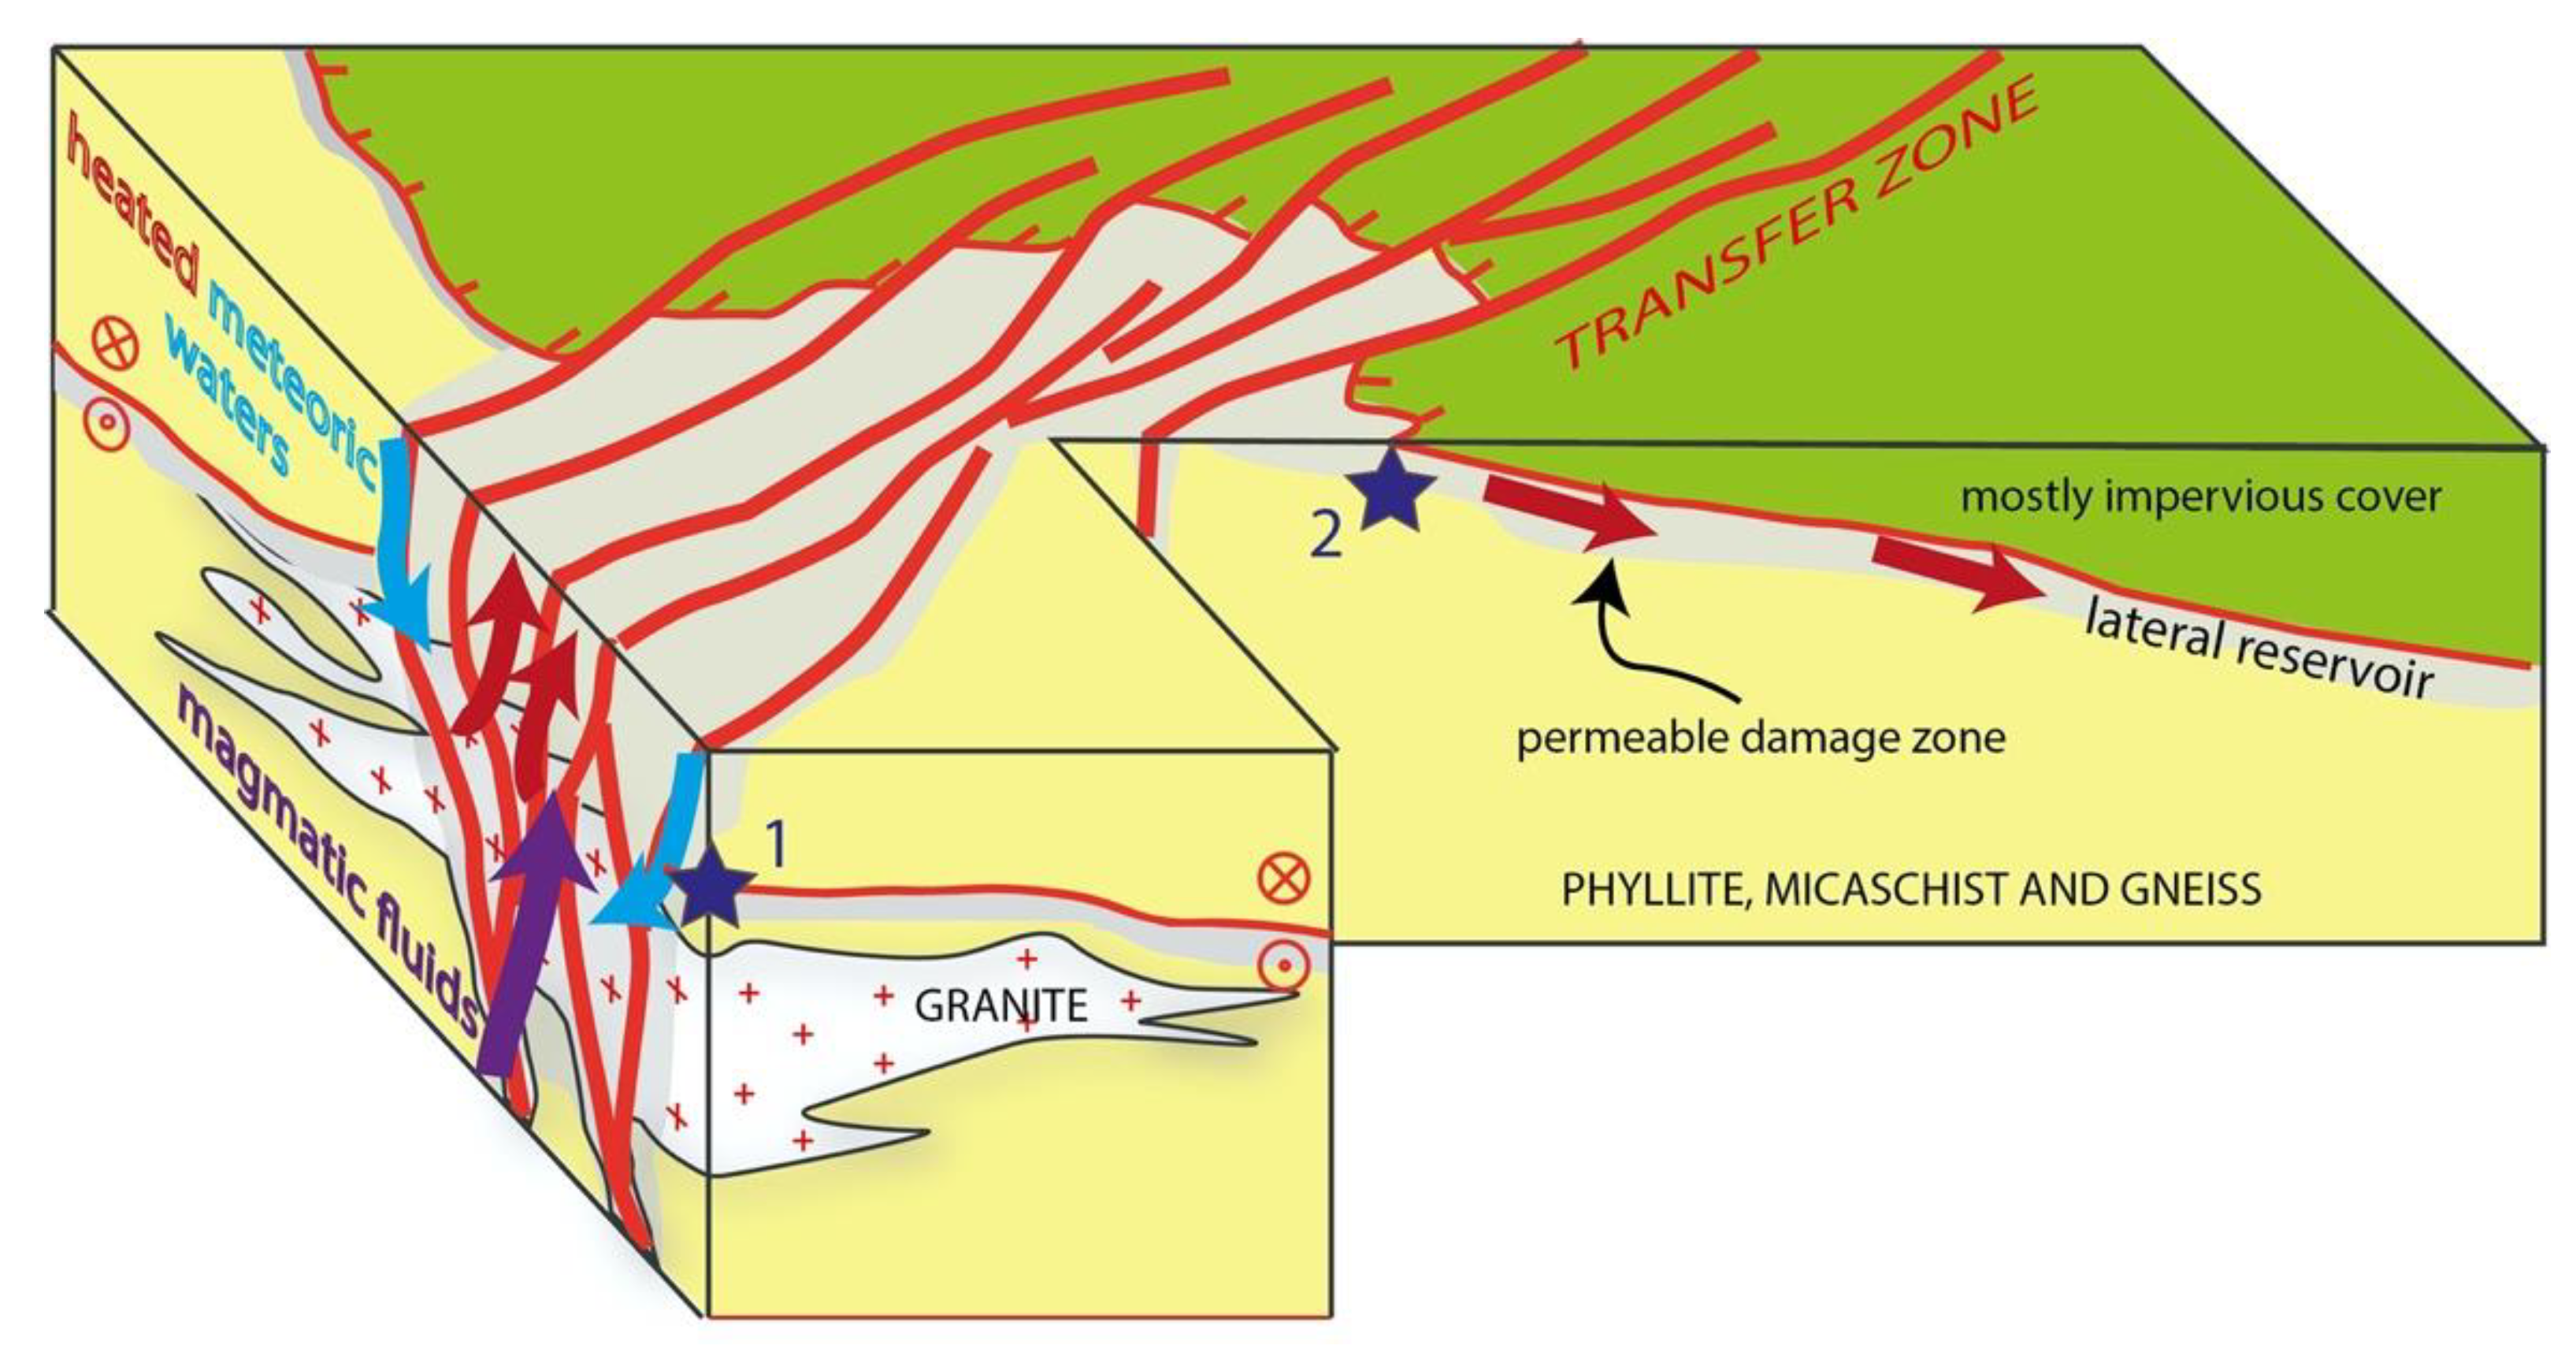
2.2.3. Fossil vs. Active Systems
3. Case Histories
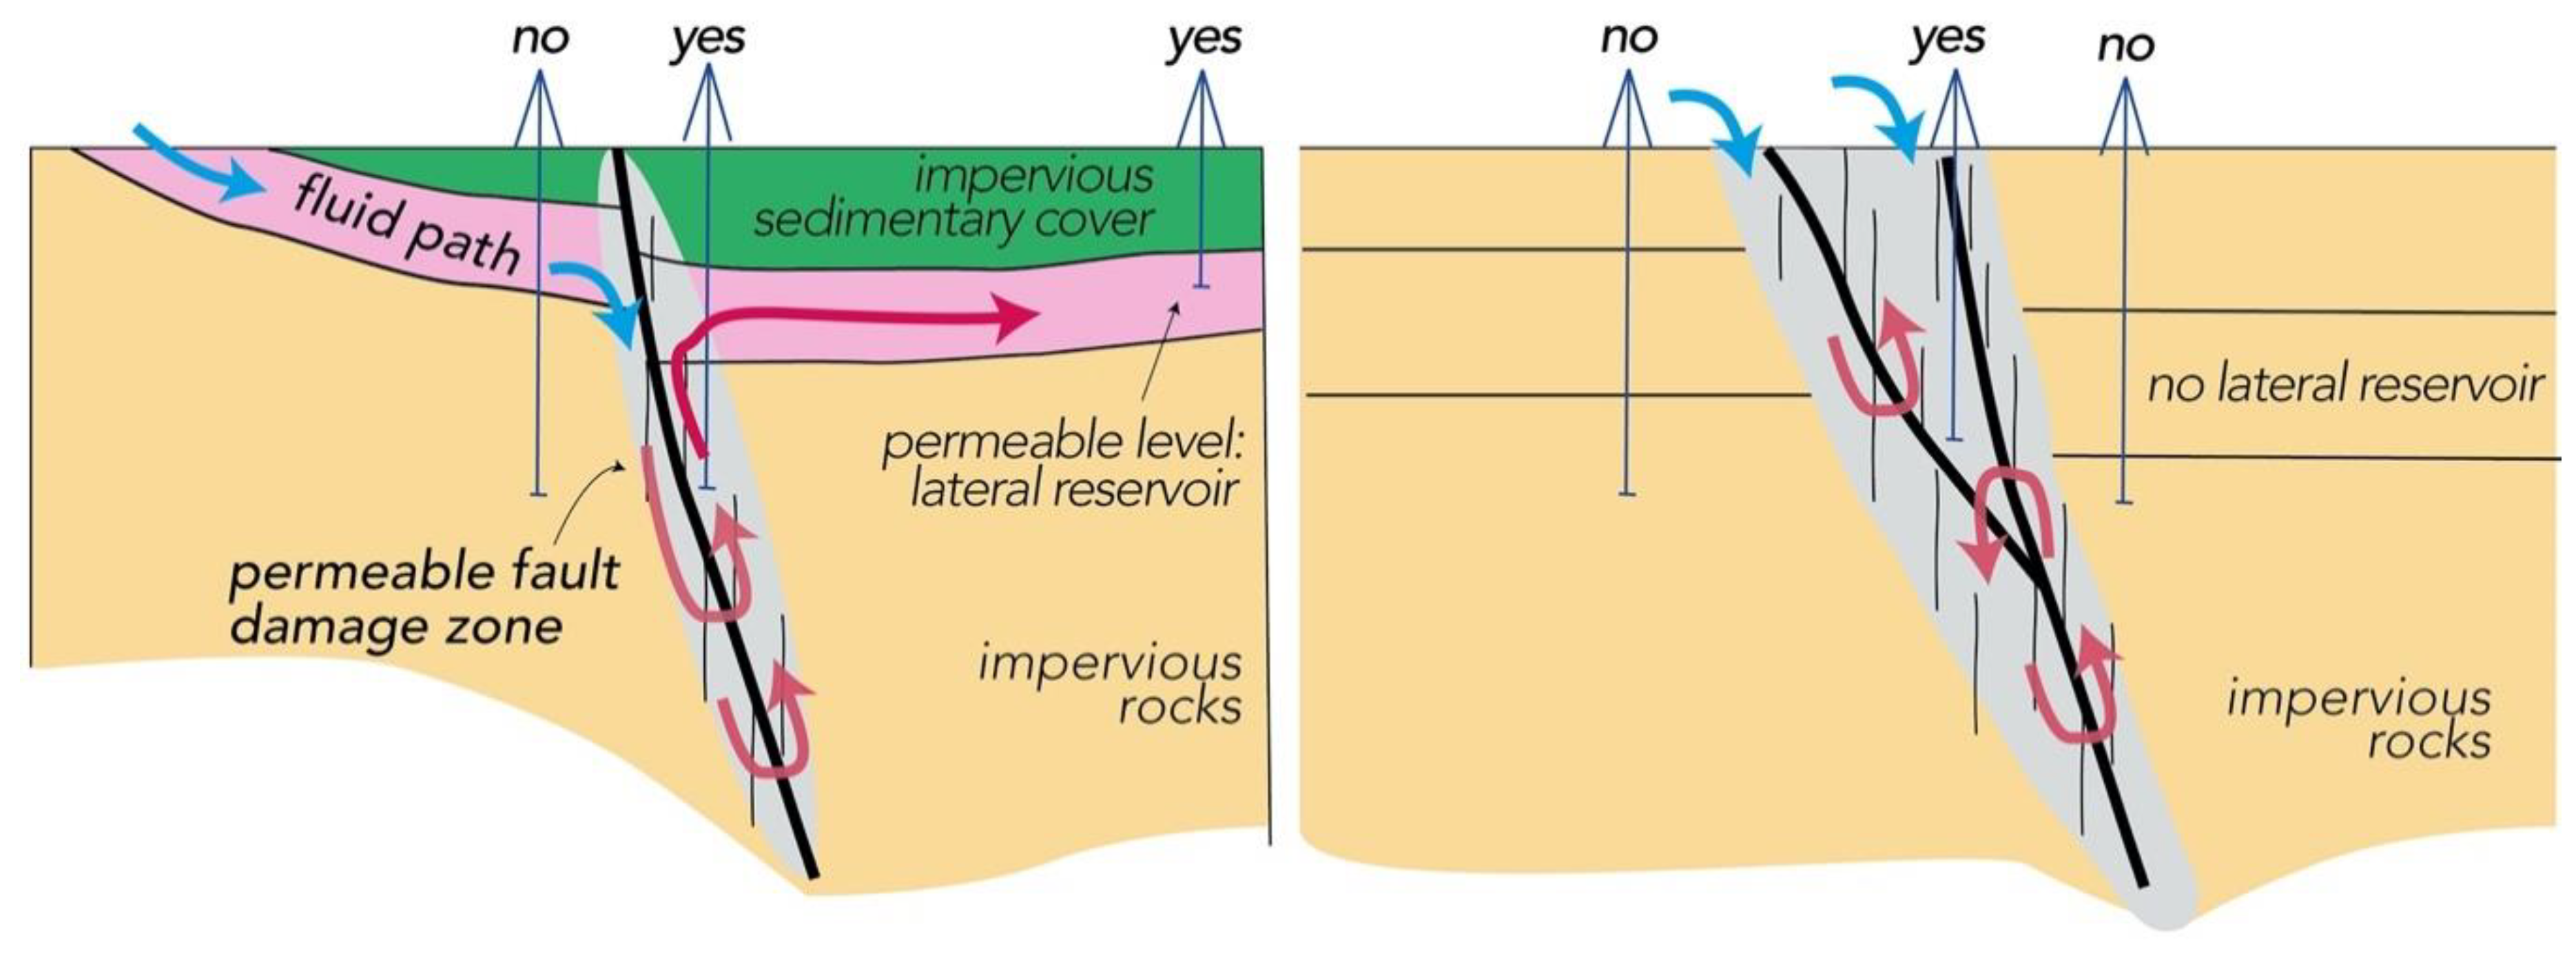
3.1. Occurrence of Lateral Reservoir: Elba and Larderello Geothermal Systems
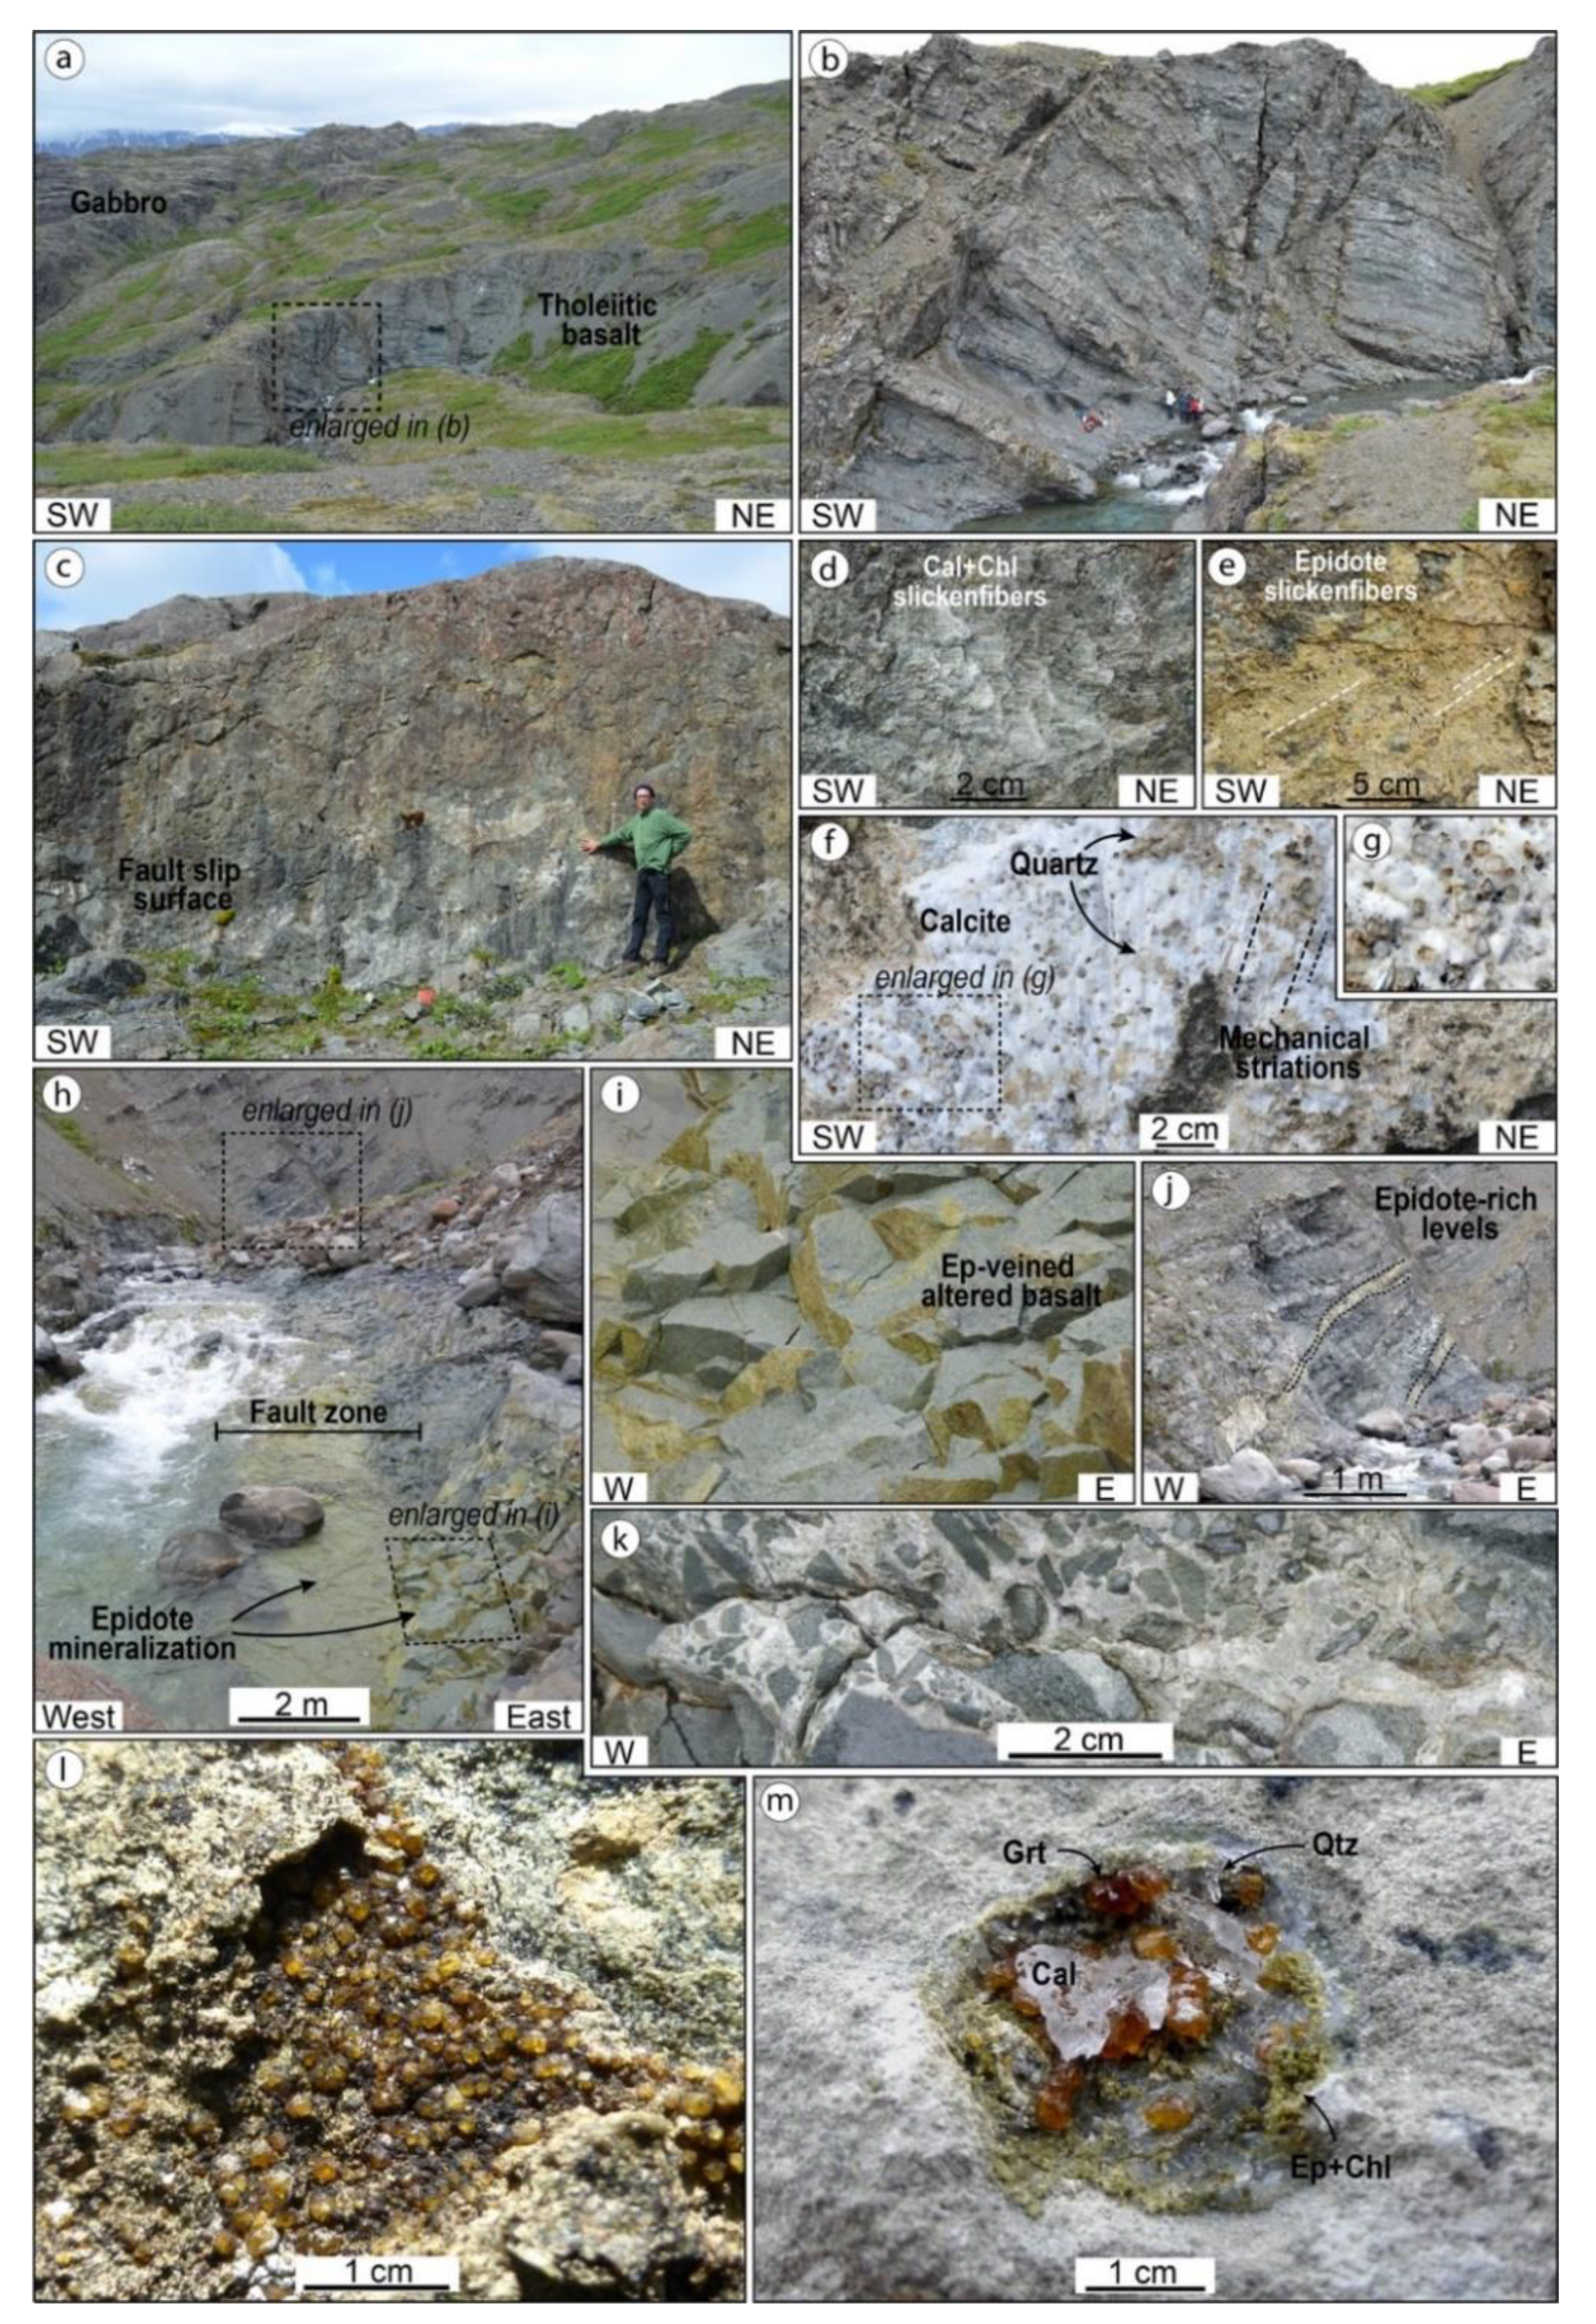
3.1.1. Elba Island
3.1.2. Larderello Geothermal System
3.1.3. Elba Island vs. Larderello
3.2. Absence of Lateral Reservoir: Geitafell and Krafla Geothermal Systems
3.2.1. Geitafell
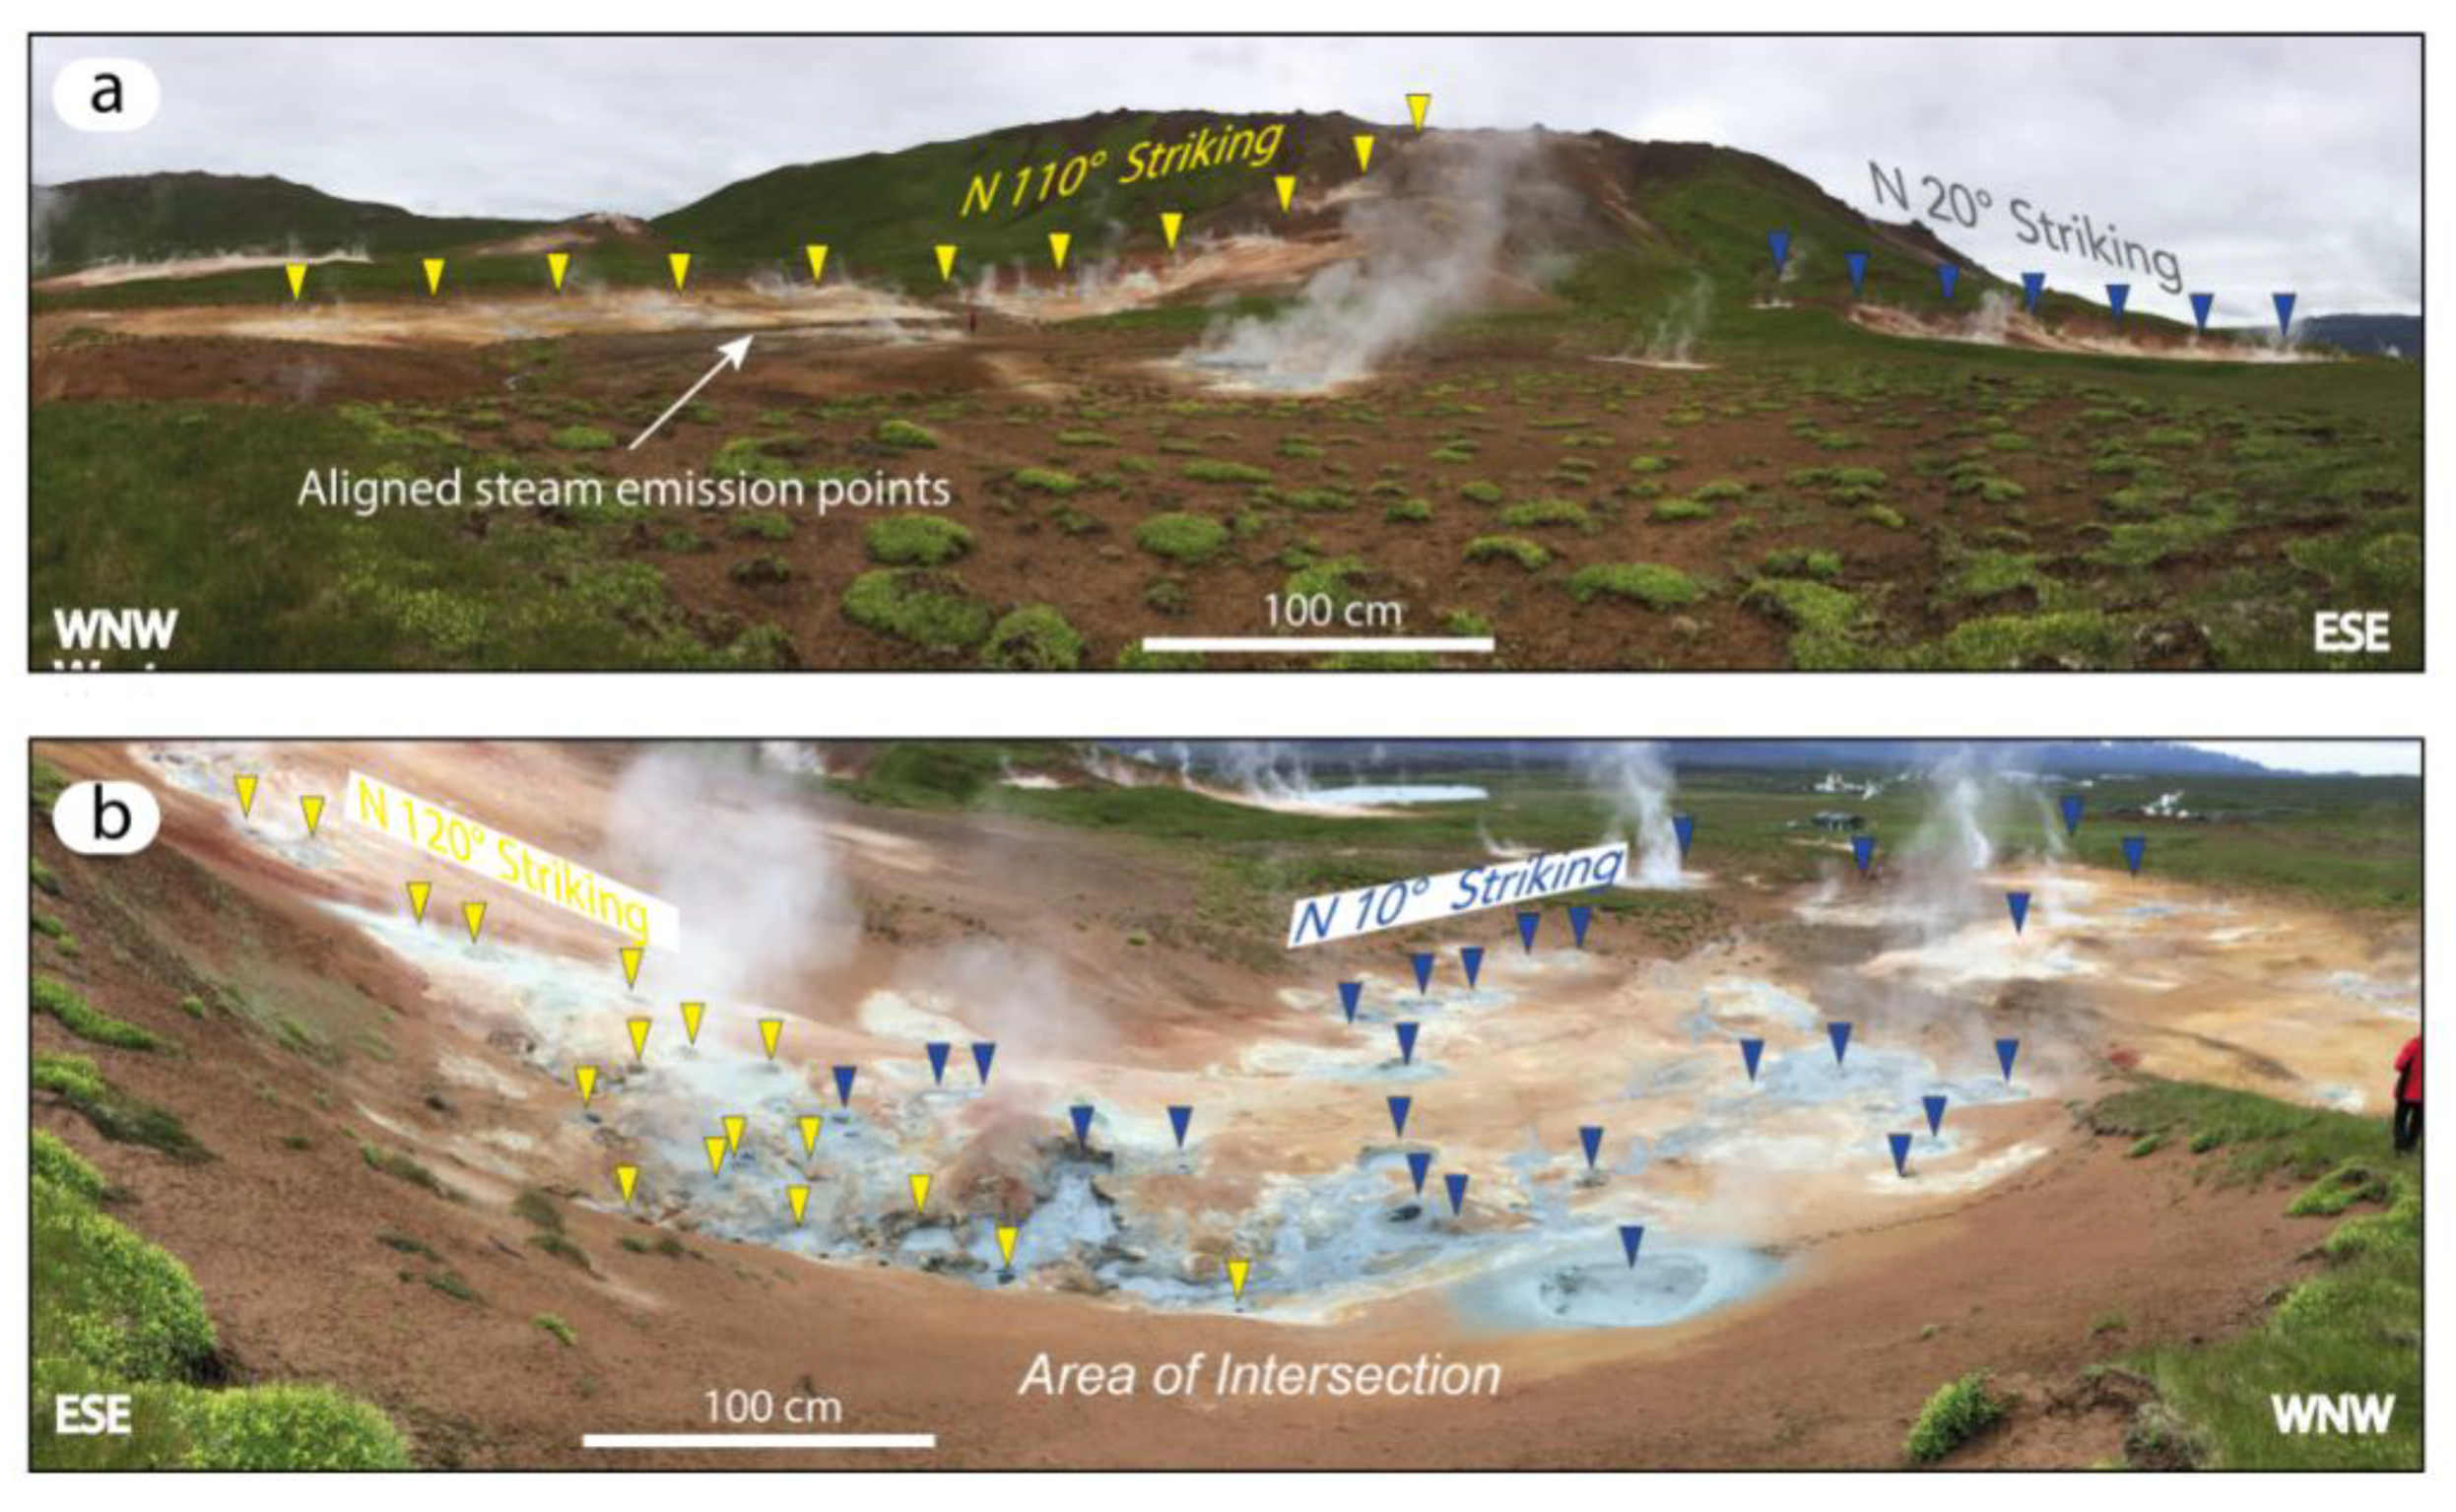
3.2.2. Krafla
3.2.3. Geitafell vs. Krafla
4. Discussion and Conclusions
Author Contributions
Funding
Institutional Review Board Statement
Informed Consent Statement
Acknowledgments
Conflicts of Interest
References
- Hanson, M.C.; Oze, C.; Horton, T.W. Identifying blind geothermal systems with soil CO2 surveys. Appl. Geochem. 2014, 50, 106–114. [Google Scholar] [CrossRef]
- Chiodi, A.; Tassi, F.; Báez, W.; Filipovich, R.; Bustos, E.; Glok-Galli, M.; Suzaño, N.; Ahumada, M.F.; Viramonte, J.G.; Giordano, G.; et al. Preliminary conceptual model of the Cerro Blanco caldera-hosted geothermal system (Southern Puna, Argentina): Inferences from geochemical investigations. J. S. Am. Earth Sci. 2019, 94, 102213. [Google Scholar] [CrossRef]
- Santilano, A.; Donato, A.; Galgaro, A.; Montanari, D.; Menghini, A.; Viezzoli, A.; di Sipio, E.; Destro, E.; Manzella, A. An integrated 3D approach to assess the geothermal heat-exchange potential: The case study of western Sicily (southern Italy). Renew. Energy 2016, 97, 611–624. [Google Scholar] [CrossRef]
- Millett, J.M.; Planke, S.; Kästner, F.; Blischke, A.; Hersir, G.P.; Halldórsdóttir, S.; Flóvenz, Ó.G.; Árnadóttir, S.; Helgadóttir, H.M.; Vakulenko, S.; et al. Sub-surface geology and velocity structure of the Krafla high temperature geothermal field, Iceland: Integrated ditch cuttings, wireline and zero offset vertical seismic profile analysis. J. Volcanol. Geotherm. Res. 2020, 391, 106342. [Google Scholar] [CrossRef]
- Pavez, M.; Schill, E.; Held, S.; Díaz, D.; Kohl, T. Visualizing preferential magmatic and geothermal fluid pathways via electric conductivity at Villarrica Volcano, S-Chile. J. Volcanol. Geotherm. Res. 2020, 400, 106913. [Google Scholar] [CrossRef]
- Rowland, J.V.; Sibson, R.H. Structural controls on hydrothermal flowing a segmented rift system, Taupo Volcanic Zone, New Zealand. Geofluids 2004, 4, 259–283. [Google Scholar] [CrossRef]
- Faulds, J.E.; Coolbaugh, M.F.; Hinz, N.H.; Cashman, P.H.; Kratt, C.; Dering, G.; Edwards, J.; Mayhew, B.; McLachlan, H. Assessment of favorable structural settings of geothermal systems in the Great Basin, western USA. Geotherm. Resour. Counc. Trans. 2011, 35, 777–784. [Google Scholar]
- Olvera-García, E.; Garduño-Monroy, V.H.; Liotta, D.; Brogi, A.; Bermejo-Santoyo, G.; Guevara-Alday, J.A. Neogene-Quaternary normal and transfer faults controlling deep-seated geothermal systems: The case of San Agustín del Maíz (central Trans-Mexican Volcanic Belt, México). Geothermics 2020, 86, 101791. [Google Scholar] [CrossRef]
- Calcagno, P.; Evanno, G.; Trumpy, E.; Gutiérrez-Negrín, L.C.; Macías, J.L.; Carrasco-Núñez, G.; Liotta, D. Preliminary 3-D geological models of Los Humeros and Acoculco geothermal fields (Mexico)—H2020 GEMex Project. Adv. Geosci. 2018, 45, 321–333. [Google Scholar] [CrossRef]
- Békési, E.; Struijk, M.; Bonté, D.; Veldkamp, H.; Limberger, J.; Fokker, P.A.; Vrijlandt, M.; van Wees, J.D. An updated geothermal model of the Dutch subsurface based on inversion of temperature data. Geothermics 2020, 88, 101880. [Google Scholar] [CrossRef]
- Liotta, D.; Ruggieri, G.; Brogi, A.; Fulignati, P.; Dini, A.; Nardini, I. Migration of geothermal fluids in extensional terrains: The ore deposits of the Boccheggiano-Montieri area (southern Tuscany, Italy). Int. J. Earth Sci. 2010, 99, 623. [Google Scholar] [CrossRef]
- Zucchi, M.; Brogi, A.; Liotta, D.; Rimondi, V.; Ruggieri, G.; Montegrossi, G.; Caggianelli, A.; Dini, A. Permeability and hydraulic conductivity of faulted micaschist in the eastern Elba Island exhumed geothermal system (Tyrrhenian sea, Italy): Insights from Cala Stagnone. Geothermics 2017, 70, 125–145. [Google Scholar] [CrossRef]
- Liotta, D.; Brogi, A.; Ruggieri, G.; Rimondi, V.; Zucchi, M.; Helgadóttir, H.M.; Montegrossi, G.; Friðleifsson, G.Ó. Fracture analysis, hydrothermal mineralization and fluid pathways in the Neogene Geitafell central volcano: Insights for the Krafla active geothermal system, Iceland. J. Volcanol. Geotherm. Res. 2020, 391, 23. [Google Scholar] [CrossRef]
- Zucchi, M. Faults controlling geothermal fluid flow in low permeability rock volumes: An example from the exhumed geothermal system of eastern Elba Island (northern Tyrrhenian Sea, Italy). Geothermics 2020, 85, 101765. [Google Scholar] [CrossRef]
- Caine, S.J.; Evans, J.P.; Forster, C.B. Fault zone architecture and permeability structure. Geology 1996, 24, 1025–1028. [Google Scholar] [CrossRef]
- Sibson, R.H. Fluid involvement in normal faulting. J. Geodyn. 2000, 29, 469–499. [Google Scholar] [CrossRef]
- Curewitz, D.; Karson, J.A. Structural setting of hydro-thermal overflow: Fracture permeability maintained by fault propagation and interaction. J. Volcanol. Geotherm. Res. 1997, 79, 149–168. [Google Scholar] [CrossRef]
- Barbier, E. Geothermal energy and current status: An overview. Renew. Sustain. Energy Rev. 2002, 6, 3–65. [Google Scholar] [CrossRef]
- Brogi, A.; Alçiçek, M.C.; Yalçıner, C.C.; Capezzuoli, E.; Liotta, D.; Meccheri, M.; Rimondi, V.; Ruggieri, G.; Gandin, A.; Boschi, C.; et al. Hydrothermal fluids circulation and travertine de-position in an active tectonic setting: Insights from the Kamara geothermal area (western Anatolia, Turkey). Tectonophysics 2016, 680, 211–232. [Google Scholar] [CrossRef]
- Chafetz, H.S.; Folk, R.L. Travertines: Depositional morphology and the bacterially constructed constituents. J. Sedim. Petrol. 1984, 54, 289–316. [Google Scholar]
- Ford, T.D.; Pedley, H.M. A review of travertine deposits of the world. Earth Sci. Rev. 1996, 41, 117–175. [Google Scholar] [CrossRef]
- Hancock, P.L.; Chalmers, R.M.L.; Altunel, E.; Çakır, Z. Travitonics: Using travertines in active fault studies. J. Struct. Geol. 1999, 21, 903–916. [Google Scholar] [CrossRef]
- Capezzuoli, E.; Gandin, A.; Pedley, H.M. Decoding tufa and travertine (freshwater carbonates) in the sedimentary record: The state of the art. Sedimentology 2014, 61, 1–21. [Google Scholar] [CrossRef]
- Brogi, A.; Capezzuoli, E.; Buracchi, E.; Branca, M. Tectonic control on travertine and calcareous tufa deposition in a low-temperature geothermal system (Sarteano, Central Italy). J. Geol. Soc. (Lond.) 2012, 169, 461–476. [Google Scholar] [CrossRef]
- Brogi, A.; Liotta, D.; Capezzuoli, E.; Matera, P.F.; Kele, S.; Soligo, M.; Tuccimei, P.; Ruggieri, G.; Yu, T.L.; Shen, C.C.; et al. Travertine deposits constraining transfer zone neotectonics in geothermal areas: An example from the inner Northern Apennines (Bagno Vignoni-Val d’Orcia area, Italy). Geothermics 2020, 85, 101763. [Google Scholar] [CrossRef]
- Uysal, I.T.; Feng, Y.; Zhao, J.X.; Altunel, E.; Weatherley, D.; Karabacak, V.; Cengiz, O.; Golding, S.D.; Lawrence, M.G.; Collerson, K.D. U-series dating and geochemical tracing of late Quaternary travertine in co-seismic fissures. Earth Planet. Sci. Lett. 2007, 257, 450–462. [Google Scholar] [CrossRef]
- Brogi, A.; Alçiçek, M.C.; Liotta, D.; Capezzuoli, E.; Zucchi, M.; Matera, P.F. Step-over fault zones controlling geothermal fluid-flow and travertine formation (Denizli Basin, Turkey). Geothermics 2021, 89, 101941. [Google Scholar] [CrossRef]
- Angelier, J. Determination of the mean principal directions of stresses for a given fault population. Tectonophysics 1979, 56, 17–26. [Google Scholar] [CrossRef]
- Liotta, D.; Brogi, A. Pliocene-Quaternary fault kinematics in the Larderello geothermal area (Italy): Insights for the interpretation of the present stress field. Geothermics 2020, 83, 101714. [Google Scholar] [CrossRef]
- Faulkner, D.R.; Armitage, P.J. The effect of tectonic environment on permeability development around faults and in the brittle crust. Earth Planet. Sci. Lett. 2013, 375, 71–77. [Google Scholar] [CrossRef]
- Liotta, D.; Brogi, A.; Meccheri, M.; Dini, A.; Bianco, C.; Ruggieri, G. Coexistence of low-angle normal and high-angle strike- to oblique-slip faults during late Miocene mineralization in eastern Elba Island (Italy). Tectonophysics 2015, 660, 25. [Google Scholar] [CrossRef]
- Olvera-García, E.; Bianco, C.; Garduño-Monroy, V.H.; Brogi, A.; Liotta, D.; Wheeler, W.; Gómez-Alvarez, F.; Najera-Blas, S.; Jiménez-Haro, A.; Guevara-Alday, J.A.; et al. Geological map of Las Minas: An example of an exhumed geothermal system (Eastern Trans- Mexican Volcanic Belt). J. Maps 2020, 16, 918–926. [Google Scholar] [CrossRef]
- Gale, J.E. Assessing the permeability characteristics of fractured rock. Geol. Soc. Am. Spec. Pap. 1982, 189, 163–182. [Google Scholar]
- Nicholl, M.J.; Rajaram, H.; Glass, R.J.; Detwiler, R. Saturated flow in a single fracture: Evaluation of the Reynolds equation in measured aperture fields. Water Resour. Res. 1999, 35, 3361–3373. [Google Scholar] [CrossRef]
- Zimmerman, R.W.; Bodvarsson, G.S. Hydraulic conductivity of rock fractures. Transp. Porous Media 1996, 23, 1–30. [Google Scholar] [CrossRef]
- Leung, C.T.O.; Zimmerman, R.W. Estimating the hydraulic conductivity of two dimensional fracture networks using network geometric properties. Transp. Porous Media 2012, 93, 777–797. [Google Scholar] [CrossRef]
- Roedder, E. Fluid inclusions. Rev. Mineral. 1984, 12, 644. [Google Scholar]
- Shepherd, T.J.; Rankin, A.H.; Alderton, D.H.M. A Practical Guide to Fluid Inclusion Studies; Blackie and Son Ltd.: Glasgow, Scotland, 1985; p. 239. [Google Scholar]
- Goldstein, R.H.; Reynolds, T.J. Systematics of Fluid Inclusions in Diagenetic Minerals. SEPM Soc. Sediment. Geol. 1994, 31, 199. [Google Scholar]
- Bodnar, R.J. Introduction to Fluid Inclusions. In Fluid Inclusions: Analysis and Interpretation; Samson, I., Anderson, A., Marshall, D., Eds.; Mineralogical Association of Canada: Quebec City, QC, Canada, 2003; Volume 32, pp. 1–8. [Google Scholar]
- Goldstein, R.H. Petrographic analysis of fluid inclusions. In Fluid Inclusions: Analysis and Interpretation, Short Course; Samson, I., Anderson, A., Marshall, D., Eds.; Mineralogical Association of Canada: Ottawa, ON, Canada, 2003; Volume 32, pp. 9–53. [Google Scholar]
- Hurai, M.; Huraiovà, M.; Slobodnik, M.; Thomas, R. Geofluids: Developments in Microthermometry, Spectroscopy, Thermodynamics, and Stable Isotopes; Elsevier: Amsterdam, The Netherlands, 2015; p. 485. [Google Scholar]
- Bodnar, R. Introduction to Aqueous Fluid Systems. In Fluid Inclusions: Analysis and Interpretatio; Samson, I., Anderson, A., Marshall, D., Eds.; Mineralogical Association of Canada: Quebec City, QC, Canada, 2003; Volume 32, pp. 81–99. [Google Scholar]
- Bakker, R.J. AqSo_NaCl: Computer program to calculate p-T-V-x properties in the H2O-NaCl fluid system applied to fluid inclusion research and pore fluid calculation. Computer Geosciences. Comput. Geosci. 2018, 115, 122–133. [Google Scholar] [CrossRef]
- Driesner, T. The System H2O–NaCl. Part II. Correlations for molar volume, enthalpy, and isobaric heat capacity from 0 to 1000 °C, 1 to 5000 bar, and 0 to 1 XNaCl. Geochim. Cosmochim. Acta 2007, 71, 4902–4919. [Google Scholar] [CrossRef]
- Driesner, T.; Heinrich, C.A. The system H2O–NaCl. Part I. Correlation formulae for phase relations in pressure–temperature-composition space from 0 to 1000 °C, 1 to 5000 bar, and 0 to 1XNaCl. Geochim. Cosmochim. Acta 2007, 71, 4880–4901. [Google Scholar] [CrossRef]
- Dubacq, B.; Bickle, M.J.; Evans, K.A. An activity model for phase equilibria in the H2O-CO2-NaCl system. Geochim. Cosmochim. Acta 2013, 110, 229–252. [Google Scholar] [CrossRef]
- Mao, S.; Duan, Z. The Viscosity of Aqueous Alkali-Chloride Solutions up to 623 K, 1.000 bar, and High Ionic Strength. Int. J. Thermophys. 2009, 30, 1510–1523. [Google Scholar] [CrossRef]
- Gola, G.; Bertini, G.; Bonini, M.; Botteghi, S.; Brogi, A.; de Franco, R.; Dini, A.; Donato, A.; Gianelli, G.; Liotta, D.; et al. Data integration and conceptual modelling of the Larderello geothermal area, Italy. Energy Procedia 2017, 125, 300–309. [Google Scholar] [CrossRef]
- Lelli, M.; Kretzschmar, T.G.; Cabassi, J.; Doveri, M.; Sanchez-Avila, J.I.; Gherardi, F.; Magro, G.; Norelli, F. Fluid geochemistry of the Los Humeros geothermal field (LHGF-Puebla, Mexico): New constraints for the conceptual model. Geothermics 2021, 90, 101983. [Google Scholar] [CrossRef]
- Romagnoli, P.; Arias, A.; Barelli, A.; Cei, M.; Casini, M. An updated numerical model of the Larderello–Travale geothermal system. Italy. Geothermics 2010, 39, 292–313. [Google Scholar] [CrossRef]
- Ratouis, T.M.P.; O’Sullivan, M.J.; O’Sullivan, J.P. A Numerical model of Rotorua Geothermal Field. Geothermics 2016, 60, 105–125. [Google Scholar] [CrossRef]
- Molli, G. Northern Apennine-Corsica orogenic system: An updated overview. Geol. Soc. Lond. Spec. Publ. 2008, 298, 413–442. [Google Scholar] [CrossRef]
- Barchi, M.R. The Neogene-Quaternary Evolution of the Northern Apennines: Crustal Structure, Style of Deformation and Seismicity. J. Virtual Explor. 2010, 36, 220. [Google Scholar] [CrossRef]
- Serri, G.; Innocenti, F.; Manetti, P. Geochemical and petrological evidence of the subduction of delaminated Adriatic continental lithosphere in the genesis of the Neogene–Quaternary magmatism of central Italy. Tectonophysics 1993, 223, 117–147. [Google Scholar] [CrossRef]
- Tanelli, G. Mineralizzazioni metallifere e minerogenesi della Toscana. Mem. Soc. Geol. Ital. 1983, 25, 91–109. [Google Scholar]
- Minissale, A.; Magro, G.; Martinelli, G.; Vaselli, O.; Tassi, G.F. Fluid geochemical transect in the Northern Apennines (central-northern Italy): Fluid genesis and migration and tectonic implications. Tectonophysics 2000, 319, 199–222. [Google Scholar] [CrossRef]
- Dini, A.; Gianelli, G.; Puxeddu, M.; Ruggieri, G. Origin and evolution of Pliocene–Pleistocene granites from the Larderello geothermal field (Tuscan Magmatic Province, Italy). Lithos 2005, 81, 1–31. [Google Scholar] [CrossRef]
- Dini, A.; Westerman, D.S.; Innocenti, F.; Rocchi, S. Magma emplacement in a transfer zone: The Miocene mafic Orano dyke swarm of Elba Island, Tuscany, Italy. Geol. Soc. Lond. Spec. Publ. 2008, 302, 131–148. [Google Scholar] [CrossRef]
- Carmignani, L.; Decandia, F.A.; Fantozzi, P.L.; Lazzarotto, A.; Liotta, D.; Meccheri, M. Tertiary extensional tectonics in Tuscany (northern Apennines, Italy). Tectonophysics 1994, 238, 295–315. [Google Scholar] [CrossRef]
- Decandia, F.A.; Lazzarotto, A.; Liotta, D.; Cernobori, L.; Nicolich, R. The CROP03 traverse: Insights on post-collisional evolution of northern Apennines. Mem. Soc. Geol. Ital. 1998, 52, 427–439. [Google Scholar]
- Pandeli, E.; Gianelli, G.; Puxeddu, M.; Elter, F. The paleozoic basement of the northern Apennines: Stratigraphy, tectono-metamorphic evolution and alpine hydrothermal processes. Mem. Soc. Geol. Ital. 1994, 48, 627–654. [Google Scholar]
- Gagnevin, D.; Daly, J.S.; Horstwood, M.S.A.; Whitehouse, M.J. In-situ zircon U-Pb, oxygen and hafnium isotopic evidence for magma mixing and mantle metasomatism in the Tuscan Magmatic Province. Italy. Earth Planet. Sci. Lett. 2011, 305, 45–56. [Google Scholar] [CrossRef]
- Foley, l.E.; Toksoz, M.N.; Batini, F. Inversion of teleseismic traveltime residuals for velocity structure in the Larderello geothermal field. Italy. Geophys. Res. Lett. 1992, 19, 5–8. [Google Scholar] [CrossRef]
- Viti, C.; Brogi, A.; Liotta, D.; Mugnaioli, E.; Spiess, R.; Dini, A.; Zucchi, M.; Vannuccini, G. Seismic slip recorded in tourmaline fault mirrors from Elba Island (Italy). J. Struct. Geol. 2016, 86, 1–12. [Google Scholar] [CrossRef]
- Zucchi, M. Fractures and Mineralizing Fluid Paths in the Eastern Elba Island Exhumed Geothermal System (Italy). Ph.D. Thesis, University of Bari, Bari BA, Italy, 2017; p. 190. [Google Scholar]
- Dini, A.; Mazzarini, F.; Musumeci, G.; Rocchi, S. Multiple hydro-fracturing by boron-rich fluids in the Late Miocene contact aureole of eastern Elba Island (Tuscany, Italy). Terra Nova 2008, 20, 318–326. [Google Scholar] [CrossRef]
- Orlando, A.; Ruggieri, G.; Chiarantini, L.; Montegrossi, G.; Rimondi, V. Experimental Investigation of Biotite-Rich Schist Reacting with B-Bearing Fluids at Upper Crustal Conditions and Correlated Tourmaline Formation. Minerals 2017, 7, 155. [Google Scholar] [CrossRef]
- Cappetti, G.; Parisi, L.; Ridolfi, A.; Stefani, G. Fifteen Years of Reinjection in the Larderello-Valle Secolo Area: Analysis of the Production Data. In Proceedings of the May 18th Proceedings World Geothermal Congress WGC95, Florence, Italy, 18–31 May 1995; Volume 3, pp. 1797–2000. [Google Scholar]
- Kretz, R. Symbols for rock-forming minerals. Am. Mineral. 1983, 68, 277–279. [Google Scholar]
- Duranti, S.; Palmeri, R.; Pertusati, P.C.; Ricci, C.A. Geological evolution andme- tamorphic petrology of the basal sequence of eastern Elba (complex II). Acta Vulcanol. 1992, 2, 213–229. [Google Scholar]
- Tanelli, G.; Benvenuti, M.; Costagliola, P.; Dini, A.; Lattanzi, P.; Maineri, C.; Macaro, I.; Ruggieri, G. The iron mineral deposits of Elba Island: State of the art. Ofioliti 2001, 26, 239–248. [Google Scholar]
- Deschamps, Y.; Dagallier, G.; MAcaudière, J.; Marignac, C.; Moine, B.; Saupé, F. Le gisement de pyrite-hématite de Valle Giove (Rio Marina, Ile d’Elbe, Italie), Partie Schweiz. Mineral. Petrogr. Mitt. 1983, 63, 301–327. [Google Scholar]
- Batini, F.; Brogi, A.; Lazzarotto, A.; Liotta, D. Geological features of Larderello-Travale and Mt. Amiata geothermal areas (southern Tuscany, Italy). Episodes 2003, 26, 239–244. [Google Scholar] [CrossRef] [PubMed]
- Cameli, G.M.; Dini, I.; Liotta, D. Upper crustal structure of the Larderello geothermal field as a feature of post-collisional extensional tectonics (southern Tuscany, Italy). Tectonophysics 1993, 224, 413–423. [Google Scholar] [CrossRef]
- Della-Vedova, B.; Bellani, S.; Pellis, G.; Squarci, P. Deep Temperatures and Surface Heat Flow Distribution. In Anatomy of An. Orogen: The Apennines and Adjacent Mediterranean Basins; Vai, G.B., Martini, I.P., Eds.; Kluwer Academic Publishers: Amsterdam, The Netherlands, 2001; pp. 65–76. [Google Scholar]
- Magro, G.; Ruggieri, G.; Gianelli, G.; Bellani, S.; Scandiffio, G. Helium isotopes in paleofluids and present-day fluids of the Larderello geothermal field: Constraints on the heat source. J. Geophys. Res. 2003, 108, B1. [Google Scholar] [CrossRef]
- Bertini, G.; Gianelli, G.; Pandeli, E.; Puxeddu, M. Distribution of hydrothermal minerals in the Larderello-Travale and Mt. Amiata geothermal fields (Italy). Geotherm. Res. Counc. Trans. 1985, 9, 261–266. [Google Scholar]
- Saemundsson, K. Outline of the geology of Iceland. Jökull 1979, 29, 7–28. [Google Scholar]
- Tentler, T.; Temperley, S. Magmatic fissures and their systems in Iceland: A tectonomagmatic model. Tectonics 2007, 26, TC5019. [Google Scholar] [CrossRef]
- Arnórsson, S.; Axelsson, G.; Sremundsson, K. Geothermal systems in Iceland. Jökull 2008, 58, 269–305. [Google Scholar]
- Burchardt, S.; Guðmundsson, Á. The Infrastructure of Geitafell Volcano, Southeast Iceland. In Studies in Volcanology: The Legacy of George Walker; Geological Society of London: London, UK, 2009; Volume 2, pp. 349–370. [Google Scholar]
- Wolfe, C.J.; Bjarnason, I.T.; Van Decar, J.C.; Solomon, S.C. Seismic structure of the Iceland mantle plume. Nature 1997, 385, 245–247. [Google Scholar] [CrossRef]
- Einarsson, P. Structure and evolution of the Iceland hotspot. Dtsch. Geophys. Ges. Mitt. 2001, 1, 11–14. [Google Scholar]
- Bjarnason, I.T. An Iceland hotspot saga. Jökull 2008, 58, 3–16. [Google Scholar]
- Liotta, D.; Brogi, A.; Árnadóttir, S.; Ágústsson, K.; Thorsteinsdóttir, U. Field evidence of the interplay between rift and transform structures in the Krafla geothermal area, N-Iceland. Geothermics 2021, 91, 102039. [Google Scholar] [CrossRef]
- Jakobsdóttir, S. Seismicity in Iceland: 1994. Jökull 2008, 56, 75–100. [Google Scholar]
- Angelier, J.; Bergerat, F.; Stefansson, R.; Bellou, M. Seismotectonics of a newly formed transform zone near a hotspot: Earthquake mechanisms and regional stress in the South Iceland Seismic Zone. Tectonophysics 2008, 447, 95–116. [Google Scholar] [CrossRef]
- Einarsson, P. Earthquakes and present-day tectonism in Iceland. Tectonophysics 1991, 189, 261–279. [Google Scholar] [CrossRef]
- Mortensen, A.K.; Grönvold, K.; Gudmunsson, Á.; Steingrímsson, B.; Egilson, T. Quenched Silicic Glass from Well KJ-39 in Krafla, North-Eastern Iceland. In Proceedings of the World Geothermal Congress 2010, Bali, Indonesia, 25–29 April 2010; pp. 1–6. [Google Scholar]
- Grant, J.V.; Kattenhorn, S.A. Evolution of vertical faults at an extensional plate boundary, southwest Iceland. J. Struct. Geol. 2004, 26, 537–557. [Google Scholar] [CrossRef]
- Tentler, T.; Mazzoli, S. Architecture of normal faults in the rift zone of central north Iceland. J. Struct. Geol. 2005, 27, 1721–1739. [Google Scholar] [CrossRef]
- Guðmundsson, Á. Ocean-ridge discontinuities in Iceland. Geol. Soc. Lond. 1995, 152, 1011–1015. [Google Scholar] [CrossRef]
- Friðleifsson, G.Ó. Mineralogical evolution of a hydrothermal system. Geotherm. Resour. Counc. Trans. 1983, 7, 147–152. [Google Scholar]
- Thordarson, T.; Larsen, G. Volcanism in Iceland in historical time: Volcano types, eruption styles and eruptive history. J. Geodyn. 2007, 43, 118–152. [Google Scholar] [CrossRef]
- Pope, E.C.; Bird, D.K.; Arnórsson, S. Stable isotopes of hydrothermal minerals as tracers for geothermal fluids in Iceland. Geothermics 2014, 49, 99–110. [Google Scholar] [CrossRef]
- Fisher, A.T. Permeability within basaltic oceanic crust. Rev. Geophys. 1998, 36, 143–182. [Google Scholar] [CrossRef]
- Arnórsson, S. Geothermal systems in Iceland: Structure and conceptual models—I. High-temperature areas. Geothermics 1995, 24, 561–602. [Google Scholar] [CrossRef]
- Axelsson, G.; Egilson, T.; Gylfadóttir, S.S. Modelling of temperature conditions near the bottom of well IDDP-1 in Krafla, Northeast Iceland. Geothermics 2014, 49, 49–57. [Google Scholar] [CrossRef]
- Lamur, A.; Kendrick, J.E.; Eggertsson, G.H.; Wall, R.J.; Ashworth, J.D.; Lavallée, Y. The permeability of fractured rocks in pressurised volcanic and geothermal systems. Sci. Rep. 2017, 7, 6173. [Google Scholar] [CrossRef] [PubMed]
- Mortensen, A.K.; Guðmundsson, A.; Steingrímsson, B.; Sigmundsson, F.; Axelsson, G.; Ármannsson, H.; Björnsson, H.; Ágústsson, K.; Sæmundsson, K.; Ólafsson, M.; et al. The Krafla geothermal system: Research summary and conceptual model revision. 2015. Available online: http://gogn.lv.is/files/2015/2015-098.pdf (accessed on 9 February 2021).
- Jóhannesson, H.; Saemundsson, K. Geological Map of Iceland. In Tectonics; Icelandic Institute of Natural History: Garðabær, Iceland, 1998. [Google Scholar]
- Hjartardóttir, Á.R.; Einarsson, P.; Bramham, E.; Wright, T.J. The Krafla fissure swarm, Iceland, and its formation by rifting events. Bull. Volcanol. 2012, 74, 2139–2153. [Google Scholar] [CrossRef]
- Einarsson, P. S-wave shadows in the Krafla caldera in NE-Iceland, evidence for a magma chamber in the crust. Bull. Volcanol. 1978, 41, 187–195. [Google Scholar] [CrossRef]
- Ágústsson, K.; Flóvens, Ó.G.; Guðmundsson, Á.; Árnadóttir, Á. Induced Seismicity in the Krafla High Temperature Field. GRC Trans. 2012, 36, 975–980. [Google Scholar]
- Ágústsson, K.; Blanck, H. Seismic Monitoring in Krafla, Námafjall and Theistareykir ), Open Report ÍSOR-2020/003. 2020. Available online: http://gogn.lv.is/files/2020/2020-003.pdf (accessed on 9 February 2021).
- Tibaldi, A.; Bonali, F.L.; Einarsson, P.; Hjartardóttir, Á.R.; Mariotto, F.A.P. Partitioning of Holocene kinematics and interaction between the Theistareykir Fissure Swarm and the Húsavík-Flatey Fault, North Iceland. J. Struct. Geol. 2016, 83, 134–155. [Google Scholar] [CrossRef]
- Khodayar, M.; Björnsson, S.; Kristinsson, S.G.; Karlsdóttir, R.; Ólafsson, M.; Víkingsson, S. Tectonic Control of the Theistareykir Geothermal Field by Rift and Transform Zones in North Iceland: A Multidisciplinary Approach. J. Geol. 2018, 8, 543–584. [Google Scholar] [CrossRef][Green Version]
- Bonali, F.L.; Tibaldi, A.; Pasquaré Mariotto, F.; Saviano, D.; Meloni, A.; Sajovitz, P. Geometry, oblique kinematics and extensional strain variation along a diverging plate boundary: The example of the northern Theistareykir Fissure Swarm, NE Iceland. Tectonophysics 2019, 756, 57–72. [Google Scholar] [CrossRef]
- Aydin, A. Fractures, faults, and hydrocarbon entrapment, migration and flow. Mar. Pet. Geol. 2000, 17, 797–814. [Google Scholar] [CrossRef]
- Agosta, F.; Alessandroni, M.; Tondi, E.; Aydin, A. Oblique-slip normal faulting along the northern edge of the Majella anticline: Inferences on hydrocarbon migration and accumulation. J. Struct. Geol. 2009, 31, 1317–1333. [Google Scholar] [CrossRef]
- Iadanza, A.; Sampalmieri, G.; Cipollari, P. Deep-seated hydrocarbons in the seep “Brecciated Limestones” of the Maiella area (Adriatic foreland basin): Evaporitic sealing and oil re-mobilization effects linked to the drawdown of the Messinian Salinity Crisis. Mar. Pet. Geol. 2015, 66, 177–191. [Google Scholar] [CrossRef]
- Brogi, A.; Fulignati, P. Tectonic control on hydrothermal circulation and fluid evolution in the Pietratonda-Poggio Peloso (southern Tuscany, Italy) carbonate-hosted Sb-mineralization. Ore Geol. Rev. 2012, 44, 158–171. [Google Scholar] [CrossRef]
- Capezzuoli, E.; Ruggieri, G.; Rimondi, V.; Brogi, A.; Liotta, D.; Alçiçek, M.C.; Alçiçek, H.; Bülbül, A.; Gandin, A.; Meccheri, M.; et al. Calcite veining and feeding conduits in a hydrothermal system: Insights from a natural section across the Pleistocene Gölemezli travertine depositional system (western Anatolia, Turkey). Sediment. Geol. 2018, 364, 180–203. [Google Scholar] [CrossRef]
- Oliver, N.; Bons, P. Mechanisms of fluid flow and fluid-rock interaction in fossil metamorphic hydrothermal systems inferred from vein-wallrock patterns, geometry and microstructure. Geofluids 2001, 1, 137–162. [Google Scholar] [CrossRef]
- Bons, P.D.; Elburg, M.A.; Gomez-Rivas, E. A review of the formation of tectonic veins and their microstructures. J. Struct. Geol. 2012, 43, 33–62. [Google Scholar] [CrossRef]
- Gaweda, A.; Muller, A.; Stein, H.; Kadziolko-Gawel, M.; Mikulski, S. Age and origin of the tourmaline-rich hydraulic breccias in the Tatra Granite, Western Carpathians. J. Geosci. 2013, 58, 133–148. [Google Scholar] [CrossRef]
- Waldhauser, F.; Schaff, D.P.; Diehl, T.; Engdahl, E.R. Splay faults imaged by fluid- driven aftershocks of the 2004 Mw 9.2 Sumatra-Andaman earthquake. Geology 2012, 40, 243–246. [Google Scholar] [CrossRef]


Publisher’s Note: MDPI stays neutral with regard to jurisdictional claims in published maps and institutional affiliations. |
© 2021 by the authors. Licensee MDPI, Basel, Switzerland. This article is an open access article distributed under the terms and conditions of the Creative Commons Attribution (CC BY) license (http://creativecommons.org/licenses/by/4.0/).
Share and Cite
Liotta, D.; Brogi, A.; Ruggieri, G.; Zucchi, M. Fossil vs. Active Geothermal Systems: A Field and Laboratory Method to Disclose the Relationships between Geothermal Fluid Flow and Geological Structures at Depth. Energies 2021, 14, 933. https://doi.org/10.3390/en14040933
Liotta D, Brogi A, Ruggieri G, Zucchi M. Fossil vs. Active Geothermal Systems: A Field and Laboratory Method to Disclose the Relationships between Geothermal Fluid Flow and Geological Structures at Depth. Energies. 2021; 14(4):933. https://doi.org/10.3390/en14040933
Chicago/Turabian StyleLiotta, Domenico, Andrea Brogi, Giovanni Ruggieri, and Martina Zucchi. 2021. "Fossil vs. Active Geothermal Systems: A Field and Laboratory Method to Disclose the Relationships between Geothermal Fluid Flow and Geological Structures at Depth" Energies 14, no. 4: 933. https://doi.org/10.3390/en14040933
APA StyleLiotta, D., Brogi, A., Ruggieri, G., & Zucchi, M. (2021). Fossil vs. Active Geothermal Systems: A Field and Laboratory Method to Disclose the Relationships between Geothermal Fluid Flow and Geological Structures at Depth. Energies, 14(4), 933. https://doi.org/10.3390/en14040933