Abstract
Hydrothermal liquefaction (HTL) is an effective technology for bio-crude production. To date, various co-liquefaction studies were performed with contrasted (different composition) biomasses in subcritical water. Therefore, the present study investigated co-hydrothermal liquefaction of similar kinds of lignocellulosic biomasses (wheat straw, eucalyptus, and pinewood) in supercritical water under equal ratios at 400 °C with catalytic medium (K2CO3). The lower bio-crude and higher solid yields were obtained in co-liquefaction experiments, as compared to liquefaction of individual feedstocks. On the other hand, higher carbon recovery and higher HHVs were noticed in co-liquefaction-derived bio-crudes. Gas chromatography with mass spectrometry (GC-MS) results showed that organic compounds were detected in all bio-crudes in the order of phenol derivatives > ketones/aldehydes > aromatics > carboxylic acids/esters. The aqueous phase from all samples contained higher TOC in the range of 19 to 33 g/L, with alkaline pH. In short, the co-liquefaction slightly improved the bio-crude quality with a significant reduction in bio-crude energy recovery. This reflects that co-liquefaction of lignocellulosic feedstock is not favorable for enhancing bio-crude yield and improving the overall process economics of HTL.
1. Introduction
The finite fossil fuel reserves have pushed the world towards the exploration of new alternatives to meet the rising energy demand [1]. Nowadays, renewable transportation fuel can be a suitable option to reduce the dependence on fossil crude [2]. Vehicle-based electrification could be one of the alternatives, however, it requires advanced fuel distribution infrastructure and it is mostly compatible with short-distance urban transportation. Long-distance transportation such as heavy trucking, marine, rail, and aviation cannot be electrified and therefore has a strong dependency on the liquid biofuels that are fairly compatible with diesel, bunker, and jet fuel engines [3]. The liquid bio-crude is obtained from two main thermochemical technologies, pyrolysis and hydrothermal liquefaction (HTL). Pyrolysis works at higher temperatures compared to HTL and exhibits poor stability in bio-crude due to a higher amount of oxygen contents [4]. On the other hand, HTL is an effective conversion technology of any type of biomass under moderate temperatures (270 to 400 °C) and high pressures (20 to 35 MPa) [5].
Lignocellulosic biomass, especially woody material, has been used as a heating source over the centuries. However, the annual consumption of woody biomass for the production of biofuel is 200 billion metric tons worldwide [6]. Carbon neutrality, easy accessibility, and reasonable calorific values (16 to 18 MJ/kg) promote the utilization of lignocellulosic feedstocks in the bioenergy sector. HTL utilizes the sub and supercritical water ranges, that make water a nonpolar solvent, allowing rapid depolymerization of hydrophobic organic fragments under higher pressures [7]. Over the years, various lignocellulosic materials have been tested in the HTL and resulted in almost more than one-third of bio-crude yield out of the total injected organic loading [8,9,10]. Mathanker et al. treated corn stover in an autoclave at different temperatures (250, 300, 350, and 375 °C), under different retention times (0, 15, 30, and 60 min). The maximum heavy oil yield of 29% was obtained at 300 °C, whereas the highest amount of solids 30% was produced at 350 °C [11]. Tungal et al. liquefied pine wood at 200 to 275 °C in the presence of different catalysts Ni(NO3)2, Ca(NO3)2, Co(NO3)2, and Fe(NO3)3. The catalyst Ni(NO3)2, produced the highest bio-crude yield 55% at 275 °C with a partial pressure of 1.3 MPa [12]. Jensen et al. treated aspen wood in a continuous pilot-scale HTL plant in supercritical conditions (400 °C) with catalyst NH3 and NaOH [13]. The highest bio-crude yield 43% was obtained by NaOH. The ammonia polluted the bio-crude with a higher nitrogen content of 2.7%, and further NH3 gave higher coke formation. Li et al. pretreated eucalyptus woodchips with NaOH solution, followed by the liquefaction with hydrogen donor (tetralin) at temperatures 220 to 330 °C. Scanning electron microscopy (SEM) showed that pretreatment loosened the fiber structure of hemicellulose and lignin. The mixture of (water + tetralin) showed a higher conversion rate in terms of heavy bio-crude yield under the tested temperature [14]. Wu et al. processed eucalyptus with different catalysts (NaOH, KOH, and Pd/C), at 260 and 300 °C. The sufficient bio-crude yields of 61.2% and 57.7% were obtained by using NaOH and KOH respectively [15]. Similarly, Seehar et al. reported the huge potential of wheat straw for HTL (887 million tons worldwide annually), and subsequently treated wheat straw at 350 and 400 °C with and without catalyst (K2CO3). The results showed higher bio-crude yields (32.34 wt.%)) at 350 °C with negligible effects on the elemental composition of the bio-crude [16].
Throughout the emergence of HTL, researchers have also used mixed biomass for bio-crude production. For example, Brilman et al. performed co-liquefaction of three different types of biomass (pinewood, microalgae, and extracted sugar beet pulp) at 250 and 350 °C. The highest bio-crude yield was observed from microalgae with 38–44%, and a significant reduction in bio-crude yield was observed in binary (15%) and ternary mixtures (40%) than in the individual feedstocks [17]. Biller et al. applied pretreatment of sewage sludge with filter cakes of lignocellulosic biomass and then performed their co-liquefaction in the subcritical range. It was observed that only an 8% increase in energy recovery was observed by combining sewage sludge with lignocellulosic biomass. Further mixing of sewage sludge with lignocellulosics could avoid the addition of an alkali catalyst [18].
Li et al. co-processed sewage sludge with rice straw and wood sawdust, and reported a significant improvement in bio-crude yield. The bio-crude yield increased from 22% to 32% with a reasonable synergistic effect at a ratio of 1:1 [19]. Most recently, Shah et al. investigated the pumpability of the swine manure (SM) with sewage sludge (SS) and subsequently co-treated both feedstocks at different ratios (SM/SS, 0:100, 100:0, 50:50, 80:20, and 20:80). It was reported that the addition of sewage sludge left a positive impact on both bio-crude yield and quality via co-liquefaction [20]. Apart from these studies, there are various other publications related to co-liquefaction of different feedstocks which stated both positive and negative effects on bio-crude energy recovery depending upon their feedstock composition [21,22,23,24,25,26].
All aforementioned studies discussed the co-liquefaction of the different types of biomass, for example, sewage sludge/swine manure with lignocellulosic biomass. However, no such study is available in the present literature, which discusses the synergistic or antagonistic effects from the co-liquefaction of similar types of lignocellulosic biomasses. In this respect, co-liquefaction of wheat straw, eucalyptus, and pinewood has been investigated with the catalyst (K2CO3) in supercritical water to investigate its effects on bio-crude properties. These laboratory oriented experimental results aim to provide fundamental information about the implications of co-liquefaction of lignocellulosic feedstocks, before being implemented on pilot-scale HTL.
2. Materials and Methods
2.1. Feedstock Characterization
The samples of wheat straw (WS), eucalyptus (EU), and pinewood (PW) were collected from different locations in the vicinity of Aalborg, Denmark. The chemical composition of the feedstocks was adapted from Jensen et al. [27] as given in Table 1. The moisture content was measured by using a moisture analyzer (Kern, MLS) at 120 °C. The ash content was determined experimentally by heating the samples in the muffle furnace at 775 °C for 4 h, and the residue was taken as the ash content. The elemental composition of the feedstocks was determined by an elemental analyzer (Perkin Elmer, Buckinghamshire, UK, 2400 Series II CHNS/O), operated in CHN mode. The sulfur values in the feedstocks were neglected in accordance with previous studies which reported very minute values (0.03 and 0.019 wt.%) for the sulfur in wheat straw and eucalyptus [16,28]. The HHVs of WS, EU, and PW were experimentally determined by C2000 basic Calorimeter (IKA, Staufen, Germany). For the mixed samples, the elemental values were calculated theoretically by their mixing ratios (1:1), as given in Table 2.

Table 1.
Chemical composition of the feedstocks, adapted from Jensen et al. [27].

Table 2.
Elemental analysis of the feedstocks.
2.2. HTL Experiments
In the beginning, individual feedstocks of WS, EU, and PW were separately processed, followed by the co-liquefaction experiments with equal ratios for WS + EU, EU + PW, PW + WS, and WS + EU + PW. A total of 7-g slurry was prepared corresponding to the 20% dry matter. The catalyst (K2CO3) was used as 2% of the total weight of the slurry. The slurry was loaded and reactors were closely sealed and pre-pressured to 1 MPa of nitrogen. Subsequently, reactors were immersed into the preheated fluidized sand bath at 400 °C for 15 min, the retention time was selected from the experience of previous studies at different feedstock [16,28,29]. During the entire reaction time, the temperature and pressure were carefully monitored. It was observed that the highest pressure of 30 to 32 MPa was recorded from all the experiments at constant temperatures of 400 °C. At the end of the reaction, the reactors were taken out and quenched in the cold water for rapid cooling. All the HTL experiments were carried out in a set of duplicates to maintain the accuracy of the product yield.
The products were extracted in a definite order; firstly, the gas phase was vented off. Then reactors were opened and the aqueous phase was collected by inverting the reactor, and the remaining product was collected by washing the reactor with acetone. The solid phase was recovered by vacuum filtration by using filter paper of (pore size 5–13 μm). The acetone was evaporated from the bio-crude phase by rotary evaporation method at 60 °C with 56 KPa. To extract the sticky bio-crude, the flask was rinsed with Diethyl ether (DEE). In the last step, DEE was evaporated at 40 °C, and the weight of the bio-crude phase was taken to report the bio-crude yield. The overall methodology involved in HTL experiments is illustrated in Figure 1.
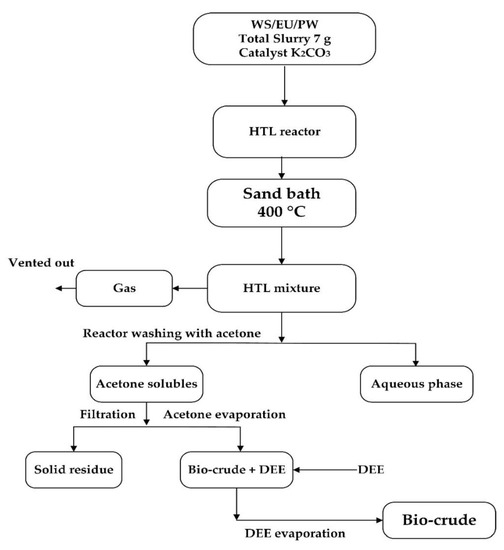
Figure 1.
Schematic diagram of hydrothermal liquefaction (HTL) experiments.
2.3. Product Characterization
The elemental composition of bio-crude and solid samples was analyzed by (Perkin Elmer, 2400 Series II CHNS/O), operated in CHN mode. The organic compounds in the bio-crude were detected by using a GC-MS system: a Gas Chromatograph (Thermo Scientific, Waltham, MA, USA, Trace 1300) coupled with a Mass Spectrometer (ISQ, QD). The GC oven was equipped with a capillary column (HP-5MS, Agilent Technologies, Santa Clara, CA, USA, length: 30 m, I.D.: 0.25 mm, film thickness: 0.25 mm), whose temperature was raised to 300 °C (10 K min−1). The MS ion source was kept at a constant temperature of 300 °C. The samples were diluted in DEE and filtered using syringe filters (0.45 μm) before being injected into the GC-MS inlet.
The concentration of total organic carbon (TOC) and total Nitrogen (TN) in the aqueous phase was determined by using reagent vials (LCK: 386, 138 respectively) and a spectrophotometer unit (Hach & Lange, Loveland, CO, USA, DE3900). The pH of the aqueous phase was determined by a pH meter. The HHVs were calculated by using Channiwala and Parikh correlation [30], as given in Equation (5). Here, all the product analyses were done in duplicates or triplicates and their mean values were reported. The product yield was reported on a dried-ash-free (daf) basis. Whereas, energy recovery of the bio-crude (ER) and carbon recovery (CR) in the HTL products were calculated by using the following equations.
HHV(MJ/kg) = (0.3491)C + (1.1783)H − (0.1034)O − (0.015)N
3. Results
3.1. Product Yield
Seven experiments were carried out three from individual feedstocks (WS, EU, PW), and four on mixed feedstocks with equal ratios (WS + EU, EU + PW, PW + WS, and WS + EU + PW). The overall bio-crude yield was noticed from all the experiments in the range of 16% to 29%. During the HTL, the supercritical range decreases the dielectric constant and improves the compressibility of water, which allows water to penetrate more efficiently inside the matrix of the biomass and achieves a higher rate of hydrolysis of hydrophobic components, which are normally insoluble in water at ambient temperature.
A major portion of lignocellulosic biomass is composed of hemicellulose and cellulose (long-chain polymeric units of glucose), which require a temperature of 300 to 375 °C for complete degradation, Whereas lignin has the highest thermal stability due to cross-linked polyaromatic units, which can be liquefied at wide range temperatures [31]. Earlier Herng et al. liquefied palm wood containing 18% to 27% lignin at 330, 360, and 390 °C, and experienced the highest bio-crude yield (37%) in the supercritical range of 390 °C [32].
The higher bio-crude yields were obtained from individual feedstocks as compared to mixed samples at 400 °C. The highest bio-crude yield was found in the order of EU > PW > WS (22% to 28%). Whereas, for co-liquefaction experiments, no proper trend was observed due to slightly larger error bars. Nonetheless, in co-liquefaction experiments, the bio-crude yield was fairly lower than the individual ones in the range of 15% to 21%, as given in Figure 2.
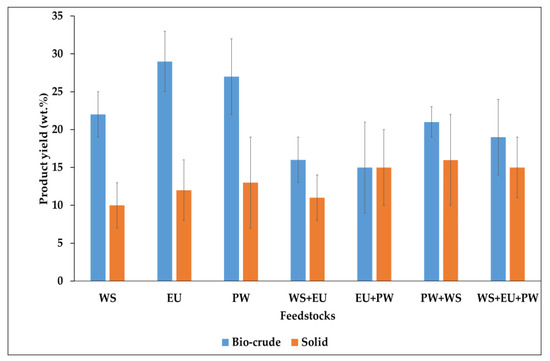
Figure 2.
HTL product yield with different feedstocks.
The lower bio-crude yields in the co-liquefaction experiments were obtained due to the antagonistic effect of feedstocks over each other. In co-liquefaction, several aspects can influence, like the composition of the feedstock, amount of ash, nitrogen content, etc. Previous studies reported the synergistic effect over bio-crude yield when contrasted materials were co-liquefied (a high protein contained or high ash containing biomass with lignocellulosic biomass) [18,19]. This heterogeneity in co-liquefaction induces beneficial effects on bio-crude properties due to catalytic effects of ash components over lignocellulosic biomass, or higher nitrogen (ammonia) develops an alkaline environment for speedy hydrolysis of carbohydrates.
Here in our case, no such scenario was possible because of the uniform composition of lignocellulosic feedstock. It could be presumed that the similar components of feedstocks; cellulose, hemicellulose, and lignin intermingled with each other, and resulted in higher repolymerization and cracking reactions by converting a major amount of organic matter into solid and gas phases, which ultimately decreased the bio-crude yield. The overall experimental solid yield in all samples was in the range of 10% to 16%.
3.2. Elemental Analysis of Bio-Crude
The elemental composition of bio-crudes is provided in Table 3. The elemental composition of the bio-crudes was affected by co-liquefaction. The higher carbon content (78% to 83%) was observed in mixed samples bio-crude than the individual ones. Hydrogen varied from 7–8%, the nitrogen contributed 0.7% to 1.6%. Lower oxygen was noticed in mixed samples (7% to 14%), comparatively lower than the individual ones. Despite the lower bio-crude yields from mixed samples, higher carbon and lower oxygen contents were detected. This may be due to the higher degree of deoxygenation in mixed samples via co-liquefaction, which resulted in higher values of HHVs (37 to 39 MJ/kg).

Table 3.
Elemental analysis of the bio-crudes.
Being an energy recovery of the bio-crude is the function of bio-crude yield, the overall energy recovery of bio-crude was calculated in the range of 30% to 57%. The H/C and O/C ratios were also calculated. The higher H/C ratios for bio-crude (1.2–1.3) and the lower O/C ratios are quite preferred for the bio-crude stability and lower viscosity. This representing that HTL shifted higher amounts of organic matter containing hydrocarbon towards the bio-crude phase by deoxygenation of organic matter via dehydration and decarboxylation reactions in the form of water and carbon dioxide, as demonstrated in the Van krevelen diagram in Figure 3. For comparison, the petroleum crude values are provided, as HHVs of bio-crude are still fairly lower than the petroleum crude (42 MJ/kg), which implies that bio-crude needs to be upgraded by hydrotreatment process to stand in the category of petroleum crudes.
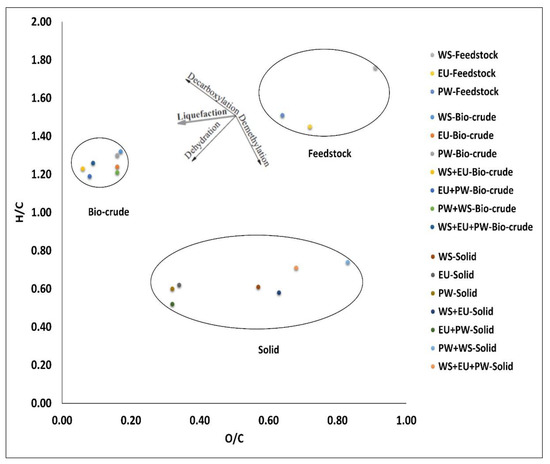
Figure 3.
Energy ratios via Van Krevelen diagram.
3.3. Elemental Analysis of Solid Residue
Table 4 shows that considerable values for the carbon were detected in the solid residue 44% to 66%, with a higher amount of oxygen 30% to 52%. This carbon with a higher concentration of oxygen was transferred to the solid phase from the polyaromatic units of lignin, or a higher degree of repolymerization of carbohydrates components especially cellulose in the supercritical range above 374 °C. The overall HHVs for the solids were calculated in the range of 11 to 29 MJ/kg with reasonable energy recovery values. This depicts a positive aspect of the solid phase that can also be utilized as a heating source.

Table 4.
Elemental analysis of solid residue.
3.4. Organic Compound Composition of Bio-Crude
The organic compounds in the bio-crude were detected by the GC-MS system. The compounds were grouped in the different categories based on their functional group as N-containing, ketones/aldehydes, alcohols/ethers, aromatics, phenol derivatives, etc., as demonstrated in Figure 4. The co-liquefaction has not significantly impacted the distribution of the organic compounds. The major compounds were detected in the order of Phenol derivatives > ketones/aldehydes > aromatics > carboxylic acids/esters etc. The phenol derivatives compounds were found to be slightly higher in the co-liquefaction-derived bio-crude than the individual ones. This might be due to a higher degree of hydrolysis of lignin compounds in co-liquefaction samples, which caused aromaticity and via cyclization and repolymerization.
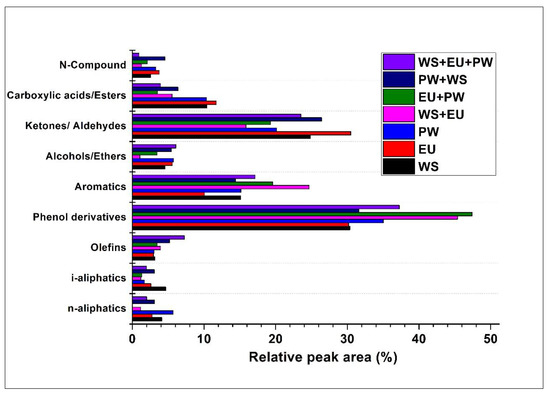
Figure 4.
Compound composition of bio-crude.
During the HTL process, the cellulose, hemicellulose, and lignin components were subjected to several reactions, like hydrolysis, depolymerization, C-C cleavage, dehydration, decarboxylation, aldol condensation reactions, etc. The overall reaction mechanism of the formation of the compounds is based on how much organic matter is dissolved as water-soluble compounds that ultimately participate in the production of the bio-crude.
The decomposition of the cellulose and hemicellulose gives especially water-soluble (WS) organic compounds such as hydroxymethylfurfural, ketones, aldehydes, etc. Although some of these components are unstable and contributing to the formation of the water-insoluble (WI) organic compounds in the form of bio-crude or char via condensation reactions.
On the other hand, lignin decomposition of polymeric monomers of aromatic rings produces numerous compounds and oligomers, which often condense and form the water-insoluble (WI) compounds, mainly char. However, the elimination of free radicals can contribute to the gases as well as in hydro-char [33]. For a better understanding, a proposed reaction pathway for the decomposition of cellulose, hemicellulose, and lignin is given in Figure 5.
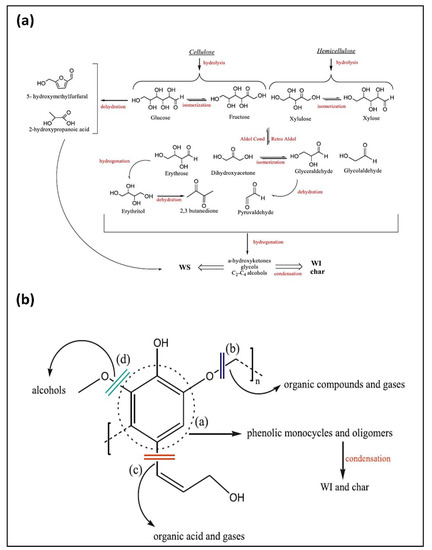
Figure 5.
Decomposition of, (a) cellulose and hemicellulose, (b) lignin, adapted from [33].
In all the bio-crudes, the phenol derivatives and aromatics were generated from the hydrolysis, cleavage of carbonyl bond, and subsequent cyclization reaction of lignin fragments [34]. It could be suspected that some cyclic compounds containing double bonds in the ring structure might also be produced by the repolymerization of the lighter carbohydrates components. The destruction of cellulose hemicellulose through dehydration and aldol condensation produces ketones, aldehydes acetic acid, and other organic acids [35]. Low percentage, ~3% of the N-containing compounds like 9-Octadecenamide, (Z)- and 4-(2,5-Dihydro-3-methoxyphenyl) butylamine, were detected, that possibly derived from the acylation reaction between the acids and amines. These amines might breakdown from carbohydrate-containing amine groups like glycosylamine and adenosine, via deamination reaction, and subsequently react with acids to form amides [36]. The hydrocarbons (olefins and aliphatics) were formed by dehydration of alcohols or decarboxylation of acids. The complete information of all detected compounds with their peak area is provided in Tables S1 and S2 in the supplementary material.
The GC-MS results show that bio-crude contained a significant percentage of oxygenates in the form of phenols, acids, ketones, etc. which can be eliminated by adopting hydrotreatment to meet the standards of drop-in fuel.
3.5. Carbon Recovery in the HTL Products
The carbon recovery was also calculated by using the formula mentioned in Equation (3). In bio-crude and solid samples, the carbon recovery was calculated by the elemental values, whereas the TOC measurements (19 to 33 g/L) were used for carbon recovery in the aqueous phase (Table 5). For gases, the CR was calculated by difference. In all samples, more than 50% of the carbon was lost in the form of aqueous and gas phases (Figure 6). The bio-crudes from (WS, EU, and PW) showed higher carbon recovery, maximum at 45% in EU bio-crude, particularly due to higher bio-crude yield. In the solid phase, carbon contributed 10% to 20%. It was found that gas contributed a major part, which implies that the liberation of carbon in gaseous form could be the reason for the lower bio-crude yields via a higher degree of deoxygenation reaction at 400 °C temperature.

Table 5.
Characterization of the aqueous phase.
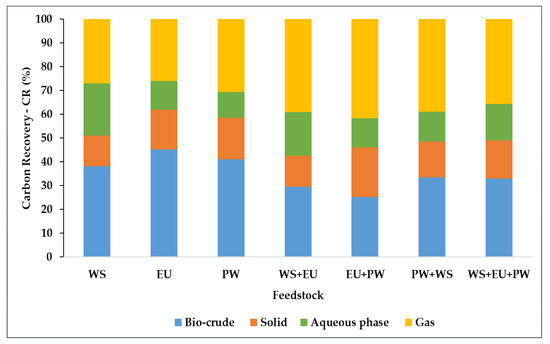
Figure 6.
Carbon recovery in HTL products.
The aqueous phase has a substantial amount of carbon 10% to 22%, which resulted due to the solubilization of the nonpolar organic fragments of biomass at the supercritical range. This will create a necessity to treat the aqueous phase at a certain level to turn into non-hazardous before being discharged into the natural water bodies. On a larger scale, this aqueous phase treatment could undermine the sustainability and effectiveness of HTL. Therefore, nowadays a modern technique of recirculation of the aqueous phase is being applied to recover this lost carbon from the aqueous phase at both laboratory [16,36,37] and pilot-scale [24,38,39]. Previous studies proved that the recirculation water phase from the lignocellulosic feedstock could save the freshwater consumption and produce higher bio-crude yield with a negligible effect on elemental values [8,40]. The total nitrogen in the aqueous phase was significantly lower in the range of (0.29 to 0.58 g/L), which was probably due to the breakdown of nitrogen from carbohydrates into ammonia (NH3). Recently, Seehar et al. also noticed a low concentration of the TN in the aqueous phase after the liquefaction of the eucalyptus wood at 400° [28]. The pH values were measured to be alkaline, which is attributed to the solubilization of salt-carbonates by the addition of the alkali catalyst.
4. Conclusions
The present study investigated catalytic co-liquefaction of the lignocellulosic biomass (wheat straw, eucalyptus, and pinewood) at 400 °C at a laboratory scale. The results showed the antagonistic effect of co-liquefaction over bio-crude yield and energy recovery. However, the maximum bio-crude yield of ~29% was observed from eucalyptus alone. Conversely, higher HHVs were noticed in co-liquefaction-derived bio-crude. GC-MS results showed that bio-crude was composed of organic compounds in the order of phenolic derivatives > ketones/aldehydes > aromatics > carboxylic acids/esters etc. The aqueous phase from all samples contained TOC in the range of 19 to 33 g/L, with alkaline pH. Briefly, the co-liquefaction of lignocellulosic feedstock is not favorable for enhancing bio-crude energy recovery and the overall process economics of HTL.
Supplementary Materials
The following are available online at https://www.mdpi.com/1996-1073/14/6/1708/s1, Table S1: Peak area of organic compounds, Table S2: Organic compounds into different categories.
Author Contributions
K.S.: (Idea of the co-liquefaction, Experiments, analysis and result interpretation and review). A.A.S.: (Designing and writing the overall manuscript, data interpretation, and review), S.S.T.: (Experiments, analysis, and review), T.H.S.: (Literature survey, and GCMS part, and review). T.H.P.: (Provision of laboratory resources, and review). L.A.R.: (Provision of laboratory resources, and review). All authors have read and agreed to the published version of the manuscript.
Funding
This work is funded by European Union Commission, 4REFINERY Project, under Grant No: 727531.
Institutional Review Board Statement
Ethical review and approval were waived for this study, as this study is not associated with socio-cultural or any subjects covering human and animal rights issues.
Informed Consent Statement
Not applicable for studies not involving humans.
Data Availability Statement
Not applicable.
Conflicts of Interest
The authors declare no conflict of interest. The funding agency had no role in the design of the study, writing manuscript, and in the decision to publish results.
References
- Kumar, M.; Oyedun, A.O.; Kumar, A. A review on the current status of various hydrothermal technologies on biomass feedstock. Renew. Sustain. Energy Rev. 2018, 81, 1742–1770. [Google Scholar] [CrossRef]
- Akhtar, J.; Amin, N.A.S. A review on process conditions for optimum bio-oil yield in hydrothermal liquefaction of biomass. Renew. Sustain. Energy Rev. 2011, 15, 1615–1624. [Google Scholar] [CrossRef]
- Dimitriadis, A.; Bezergianni, S. Hydrothermal liquefaction of various biomass and waste feedstocks for biocrude production: A state of the art review. Renew. Sustain. Energy Rev. 2017, 68, 113–125. [Google Scholar] [CrossRef]
- Gollakota, A.R.K.; Kishore, N.; Gu, S. A review on hydrothermal liquefaction of biomass. Renew. Sustain. Energy Rev. 2018, 98, 515–517. [Google Scholar] [CrossRef]
- Castello, D.; Pedersen, T.H.; Rosendahl, L.A. Continuous hydrothermal liquefaction of biomass: A critical review. Energies 2018, 11, 3165. [Google Scholar] [CrossRef]
- Seehar, T.H.; Toor, S.S.; Shah, A.A.; Nielsen, A.H.; Pedersen, T.H.; Rosendahl, L. Catalytic hydrothermal liquefaction of contaminated construction wood waste for biocrude production and investigation of fate of heavy metals. Fuel Process Technol. 2021, 212, 106621. [Google Scholar] [CrossRef]
- Toor, S.S.; Rosendahl, L.; Rudolf, A. Hydrothermal liquefaction of biomass: A review of subcritical water technologies. Energy 2011, 36, 2328–2342. [Google Scholar] [CrossRef]
- Zhu, Z.; Rosendahl, L.; Toor, S.S.; Yu, D.; Chen, G. Hydrothermal liquefaction of barley straw to bio-crude oil: Effects of reaction temperature and aqueous phase recirculation. Appl. Energy 2015, 137, 183–192. [Google Scholar] [CrossRef]
- Sintamarean, I.M.; Grigoras, I.F.; Jensen, C.U.; Toor, S.S.; Pedersen, T.H.; Rosendahl, L.A. Two-stage alkaline hydrothermal liquefaction of wood to biocrude in a continuous bench-scale system. Biomass Convers. Biorefin. 2017, 7, 425–435. [Google Scholar] [CrossRef]
- Pedersen, T.H.; Hansen, N.H.; Pérez, O.M.; Cabezas, D.E.V.; Rosendahl, L.A. Renewable hydrocarbon fuels from hydrothermal liquefaction: A techno-economic analysis. Biofuels Bioprod. Biorefin. 2018, 12, 213–223. [Google Scholar] [CrossRef]
- Mathanker, A.; Pudasainee, D.; Kumar, A.; Gupta, R. Hydrothermal liquefaction of lignocellulosic biomass feedstock to produce biofuels: Parametric study and products characterization. Fuel 2020, 271, 117534. [Google Scholar] [CrossRef]
- Tungal, R.; Shende, R.V. Hydrothermal liquefaction of pinewood (Pinus ponderosa) for H2, biocrude and bio-oil generation. Appl. Energy 2014, 134, 401–412. [Google Scholar] [CrossRef]
- Jensen, C.U.; Rosendahl, L.A.; Olofsson, G. Impact of nitrogenous alkaline agent on continuous HTL of lignocellulosic biomass and biocrude upgrading. Fuel Process. Technol. 2017, 159, 376–385. [Google Scholar] [CrossRef]
- Li, Z.; Hong, Y.; Cao, J.; Huang, Z.; Huang, K.; Gong, H.; Li, Y. Effects of Mild Alkali Pretreatment and Hydrogen-Donating Solvent on Hydrothermal Liquefaction of Eucalyptus Woodchips. Energy Fuels 2015, 29, 7335–7342. [Google Scholar] [CrossRef]
- Wu, X.F.; Zhang, J.J.; Huang, Y.H.; Li, M.F.; Bian, J.; Peng, F. Comparative investigation on bio-oil production from eucalyptus via liquefaction in subcritical water and supercritical ethanol. Ind. Crop. Prod. 2019, 140, 111695. [Google Scholar] [CrossRef]
- Seehar, T.H.; Toor, S.S.; Shah, A.A.; Pedersen, T.H.; Rosendahl, L.A. Biocrude Production from Wheat Straw at Sub and Supercritical Hydrothermal Liquefaction. Energies 2020, 13, 3114. [Google Scholar] [CrossRef]
- Brilman, D.W.F.; Drabik, N.; Wądrzyk, M. Hydrothermal co-liquefaction of microalgae, wood, and sugar beet pulp. Biomass Convers. Bioref. 2017, 7, 445–454. [Google Scholar] [CrossRef]
- Biller, P.; Johannsen, I.; Passos, J.S.D.; Ottosen, L.D.M. Primary sewage sludge filtration using biomass filter aids and subsequent hydrothermal co-liquefaction. Water Res. 2018, 130, 58–68. [Google Scholar] [CrossRef]
- Leng, L.; Li, J.; Yuan, X.; Li, J.; Han, P.; Hong, Y.; Zhou, W. Beneficial synergistic effect on bio-oil production from co-liquefaction of sewage sludge and lignocellulosic biomass. Bioresour. Technol. 2018, 251, 49–56. [Google Scholar] [CrossRef]
- Shah, A.A.; Toor, S.S.; Seehar, T.H.; Sadetmahaleh, K.K.; Pedersen, T.H.; Nielsen, A.H.; Rosendahl, L.A. Bio-crude production through co-hydrothermal processing of swine manure with sewage sludge to enhance pumpability. Fuel 2021, 288, 119407. [Google Scholar] [CrossRef]
- Xu, D.; Wang, Y.; Lin, G.; Guo, S.; Wang, S.; Wu, Z. Co-hydrothermal liquefaction of microalgae and sewage sludge in subcritical water: Ash effects on bio-oil production. Renew Energy 2019, 138, 1143–1151. [Google Scholar] [CrossRef]
- Chen, W.T.; Zhang, Y.; Zhang, J.; Schideman, L.; Yu, G.; Zhang, P.; Minarick, M. Co-liquefaction of swine manure and mixed-culture algal biomass from a wastewater treatment system to produce bio-crude oil. Appl. Energy 2014, 128, 209–216. [Google Scholar] [CrossRef]
- Mishra, S.; Mohanty, K. Co-HTL of domestic sewage sludge and wastewater treatment derived microalgal biomass—An integrated biorefinery approach for sustainable biocrude production. Energy Convers. Manag. 2020, 204, 112312. [Google Scholar] [CrossRef]
- Pedersen, T.H.; Grigoras, I.F.; Hoffmann, J.; Toor, S.S.; Daraban, I.M.; Jensen, C.U.; Iversen, S.B.; Madsen, R.B.; Glasius, M.; Arturi, K.R.; et al. Continuous hydrothermal co-liquefaction of aspen wood and glycerol with water phase recirculation. Appl. Energy 2016, 162, 1034–1041. [Google Scholar] [CrossRef]
- Xiu, S.; Shahbazi, A.; Wallace, C.W.; Wang, L.; Cheng, D. Enhanced bio-oil production from swine manure co-liquefaction with crude glycerol. Energy Convers. Manag. 2011, 52, 1004–1009. [Google Scholar] [CrossRef]
- Sintamarean, I.M.; Pedersen, T.H.; Zhao, X.; Kruse, A.; Rosendahl, L.A. Application of Algae as Cosubstrate to Enhance the Processability of Willow Wood for Continuous Hydrothermal Liquefaction. Ind. Eng. Chem. Res. 2017, 56, 4562–4571. [Google Scholar] [CrossRef]
- Jensen, C.U.; Guerrero, J.K.R.; Karatzos, S.; Olofsson, G.; Iversen, S.B. Fundamentals of HydrofactionTM: Renewable crude oil from woody biomass. Biomass Convers. Biorefin. 2017, 7, 495–509. [Google Scholar] [CrossRef]
- Seehar, T.H.; Toor, S.S.; Sharma, K.; Nielsen, A.H.; Pedersen, T.; Rosendahl, L.A. Influence of Process Conditions on Hydrothermal Liquefaction of Eucalyptus Biomass for Biocrude Production and Investigation of the Inorganics Distribution. Sustain. Energy Fuels 2021, 5, 1477–1487. [Google Scholar] [CrossRef]
- Conti, F.; Toor, S.S.; Pedersen, T.H.; Nielsen, A.H.; Rosendahl, L.A. Biocrude production and nutrients recovery through hydrothermal liquefaction of wastewater irrigated willow. Biomass Bioenergy 2018, 11, 824–831. [Google Scholar] [CrossRef]
- Channiwala, S.A.; Parikh, P.P. A unified correlation for estimating HHV of solid, liquid and gaseous fuels. Fuel 2002, 81, 1051–1063. [Google Scholar] [CrossRef]
- Brebu, M.; Vasile, C. Thermal degradation of lignin—A review. Cellul. Chem. Technol. 2010, 44, 353–363. [Google Scholar]
- Herng, Y.; Yusup, S.; Quitain, A.T.; Uemura, Y. Bio-oil production from oil palm biomass via subcritical and supercritical hydrothermal liquefaction. J. Supercrit. Fluids 2014, 95, 407–412. [Google Scholar]
- Scarsella, M.; Caprariis, B.D.; Damizia, M.; De Filippis, P. Heterogeneous catalysts for hydrothermal liquefaction of lignocellulosic biomass: A review. Biomass Bioenerg. 2020, 140, 105662. [Google Scholar] [CrossRef]
- Zhu, Z.; Toor, S.S.; Rosendahl, L.; Chen, G. Analysis of product distribution and characteristics in hydrothermal liquefaction of barley straw in subcritical and supercritical water. Environ. Prog. Sustain. Energy 2014, 33, 737–743. [Google Scholar] [CrossRef]
- Peterson, A.A.; Vogel, F.; Lachance, R.P.; Fröling, M.; Antal, M.J.; Tester, J.W. Thermochemical biofuel production in hydrothermal media: A review of sub- and supercritical water technologies. Energy Environ. Sci. 2008, 1, 32–65. [Google Scholar] [CrossRef]
- Shah, A.A.; Toor, S.S.; Conti, F.; Nielsen, A.H.; Rosendahl, L.A. Hydrothermal liquefaction of high ash containing sewage sludge at sub and supercritical conditions. Biomass Bioenergy 2020, 135, 105504. [Google Scholar] [CrossRef]
- Shah, A.A.; Toor, S.S.; Seehar, T.H.; Nielsen, R.S.; Nielsen, A.H.; Pedersen, T.H.; Rosendahl, L.A. Bio-Crude Production through Aqueous Phase Recycling of Hydrothermal Liquefaction of Sewage Sludge. Energies 2020, 13, 493. [Google Scholar] [CrossRef]
- Yang, J.; He (Sophia), Q.; Yang, L. A review on hydrothermal co-liquefaction of biomass. Appl. Energy 2019, 250, 926–945. [Google Scholar] [CrossRef]
- Biller, P.; Madsen, R.B.; Klemmer, M.; Becker, J.; Iversen, B.B.; Glasius, M. Effect of hydrothermal liquefaction aqueous phase recycling on bio-crude yields and composition. Bioresour. Technol. 2016, 220, 190–199. [Google Scholar] [CrossRef]
- Li, C.; Yang, X.; Zhang, Z.; Zhou, D.; Zhang, L.; Zhang, S.; Chen, J. Hydrothermal liquefaction of desert shrub salix psammophila to high value-added chemicals and hydrochar with recycled processing water. Bioresour. Technol. 2013, 8, 2981–2997. [Google Scholar] [CrossRef]
Publisher’s Note: MDPI stays neutral with regard to jurisdictional claims in published maps and institutional affiliations. |
© 2021 by the authors. Licensee MDPI, Basel, Switzerland. This article is an open access article distributed under the terms and conditions of the Creative Commons Attribution (CC BY) license (http://creativecommons.org/licenses/by/4.0/).