Article

Sensitivity of the Evapotranspiration Deficit Index to Its Parameters and Different Temporal Scales

by
Frank Joseph Wambura
Department of Urban and Regional Planning, Ardhi University, P.O. Box 35176, Dar es Salaam, Tanzania
Hydrology 2021, 8(1), 26; https://doi.org/10.3390/hydrology8010026
Submission received: 6 January 2021 / Revised: 22 January 2021 / Accepted: 26 January 2021 / Published: 2 February 2021
(This article belongs to the Special Issue Advances in Evaporation and Evaporative Demand)

Abstract

:
Sound estimates of drought characteristics are very important for planning intervention measures in drought-prone areas. Due to data scarcity, many studies are increasingly using less data-intensive approaches, such as the evapotranspiration deficit index (ETDI), in estimations of agricultural droughts. However, little is known about the sensitivity of this specific ETDI formula to its parameters, and to data at different temporal scales. In this study, a general ETDI formula, homologous to the specific ETDI formula, was introduced and used to test the sensitivity of the ETDI to its parameters and to data at different temporal scales. The tests used time series of remotely sensed evapotranspiration data in the Ruvu River basin in Tanzania. The parameter sensitivity tests revealed that ETDI is sensitive to its parameters, and different parameter combinations resulted in different drought characteristics. The temporal scale sensitivity test showed that drought characteristics, such as the number of drought events and the total drought durations, decreased as the temporal scale increased. Thus, an inappropriate temporal scale may lead to the misrepresentation of drought characteristics. To reduce uncertainty and increase the accuracy of ETDI-based agricultural drought characteristics, ETDI requires parameter calibration and the use of data with small temporal scales, respectively. These findings are useful for improving estimations of ETDI-based agricultural droughts.

1. Introduction

Drought is an environmental disaster that brings severe social, economic, and environmental impacts around the world. Thus, drought is usually categorized into four main operation-based types, namely, meteorological drought, hydrological drought, agricultural drought, and socio-economic drought [1,2,3,4,5]. Since drought is often caused by a decrease of precipitation below the normal amount, agricultural productivity is usually the most affected due to its direct dependence on water resources, especially soil moisture. Drought begins when the soil moisture available to plants drops to a level that adversely affects the crop yield and, consequently, agricultural production [6,7]. The decline of agricultural production indirectly causes critical issues such as food insecurity, which may eventually lead to socio-economic consequences. For this reason, understanding agricultural drought is vital for planning mitigation and adaptation measures in areas susceptible to drought.
Several indices have been developed to estimate agricultural drought using various water balance parameters. Most of these indices use precipitation, temperature, actual evapotranspiration (ET), and potential evapotranspiration (PET) data, and crop characteristics, crop management practices, etc. [8,9,10,11]. One of the prominent drought indices is the evapotranspiration deficit index (ETDI) [12]. The ETDI uses ET and PET data for estimating short-term agricultural drought [12]. ETDI can be scaled between −2 and +2 to compare with the standardized precipitation index [13,14,15,16,17], or between −4 and +4 to compare with the Palmer drought severity index [18]. Details about other drought indices are found in the studies by Sivakumar, et al. [19] and Zargar, et al. [20].
ETDI has been widely used to estimate drought in many parts of the world. Narasimhan and Srinivasan [12] used ETDI for monitoring the agricultural drought of six watersheds located in major river basins across Texas, United States. Trambauer, et al. [17] used ETDI to analyze hydrological drought in the Limpopo River basin, southern Africa. Esfahanian, et al. [21] used ETDI and other drought indices to develop a comprehensive drought index in the Saginaw watershed in Michigan, United States. Bayissa, et al. [2] used ETDI in comparisons of drought indices in the Upper Blue Nile Basin, Ethiopia. Wambura and Dietrich [22] used ETDI to analyze spatio-temporal drought in the Kilombero catchment, Tanzania. In all these studies, ETDI was computed using the specific ETDI formula. Thus, the sensitivity of ETDI to its parameters and to data at different temporal scales is hardly known.
Therefore, the objective of this study was to investigate the sensitivity of ETDI (1) to its parameters, and (2) to data at different temporal scales. First, a general ETDI formula homologous to the specific ETDI formula was introduced. Then the general ETDI formula was used to test the sensitivity of ETDI to its different parameter combinations. Finally, the sensitivity of ETDI to remotely sensed ET and PET data at different temporal scales (i.e., 8-day, 16-day, and 1-month) was also tested under a constant parameter combination.

2. Materials and Methods

2.1. Case Study

The study area was the Ruvu River basin located between 6°18′ S–7°46′ S and 37°15′ E–38°58′ E in eastern Tanzania (Figure 1). Its headwaters originate on the eastern slopes of the Uluguru Mountains and descend northeast towards the coast in a swampy estuary at the Indian Ocean. The basin area is approximately 17,693 km², and its elevation ranges between 4 and 2636 m above sea level (Figure 1) [23].
The average air temperature in the basin is between 18 °C in August and 32 °C in February, whereas the mean annual rainfall ranges from 800 mm to 2000 mm [24]. This region of coastal Tanzania is also known to have frequent and intense drought episodes [25]. Thus, the river basin has a very dynamic weather system. The Ruvu River basin was selected because of these dynamic weather systems, which are often very sensitive to even small changes in the western Indian Ocean sea surface temperature.

2.2. Main Datasets Used

Due to data scarcity in this region, ET and PET data used in this study were obtained from the Moderate Resolution Imaging Spectroradiometer (MODIS) imagery program [26]. The remotely sensed ET and PET products from the MODIS program were MOD16A2-v5 (from now on MODIS ET), and were available at a spatial resolution of 1 km and temporal resolution of 8 days and 1 month. The first dataset consisting of 690 images of 8-day MODIS ET covering the Ruvu River basin was downloaded from the MODIS repository (http://files.ntsg.umt.edu/data/NTSG_Products/, accessed on 15 October 2017). Another dataset consisting of 180 images of 1 month MODIS ET covering the river basin was also downloaded from the same repository (accessed on 10 July 2019). The two MODIS ET datasets spanned between the years 2000 and 2014.
Each of the twelve points (P1 to P12) spatially distributed in the Ruvu River basin (Figure 1) was used to extract two pairs of time series from the MODIS ET datasets. First, the twelve points extracted ET and PET time series from the 8-day MODIS ET dataset. Then the 8-day time series of ET and PET were aggregated to form a 16-day time series. The conversion to a 16-day timestep was necessary because MODIS ET products are only available at 8-day and 1-month timesteps. Finally, the twelve points were also used to extract monthly ET and PET time series from the monthly MODIS ET dataset. For illustration purposes, Figure 2a–c shows the 8-day, 16-day, and monthly ET and PET at point P1.

2.3. Evapotranspiration Deficit Index Approach

The ETDI approach involves three steps, first, the estimation of water stress (WS), then, the estimation of the water stress anomaly (WSA), and finally, the estimation of ETDI. The estimation of WS at a point uses Equation (1) [2,12].
W S i , j   =   P E T i , j     E T i , j P E T i , j
where i represents a period (e.g., month i ) in a given year, j . The years range between 2000 and 2014 with a timestep of one year. WS ranges from 0 (ET is the same as PET) to 1 (no ET).
The estimation of WSA at a point uses Equation (2) [12]. Equation (2) removes the seasonality inherent in the time series of WS.
W S A i , j   =   m e d   W S i     W S i , j m e d   W S i     m i n   W S i   i f   W S i , j     m e d   W S i m e d   W S i     W S i , j m a x   W S i     m e d   W S i   i f   W S i , j   >   m e d   W S i
where m i n   W S , m e d   W S , and m a x   W S are long-term minimum, median, and maximum WS values at time i from all years in the time series. WSA ranges from −1 to +1 indicating extremely dry to extremely wet conditions, respectively.
The estimation of ETDI at a point uses a cumulating procedure similar to that of the soil moisture deficit index [12]. In analogy to the original formulation of the soil moisture deficit index, the change in ETDI is equal to the difference between two consecutive ETDIs (Equation (3)) [12].
E T D I t   =   E T D I t     E T D I t 1
where E T D I   represents a change in ETDI. The subscripts   t and t 1 represent consecutive periods (e.g., month t and month t 1 , respectively) continuously ranging from the beginning to the end of the record.
On the basis of the contribution of the previous drought severity, the change of the current ETDI depends on a weighted contribution of the previous ETDI, and the full contribution of the current WSA (Equation (4)) [12].
E T D I t   =   c   E T D I t 1   +   W S A t 50
where c controls the contribution of the previous ETDI. In Equation (4), Narasimhan and Srinivasan [12] scaled WSA between −100 and +100 (percentages). Thus, the value of 50 in this equation reduces WSA from ± 100 to ± 2 , so that the ETDI of consecutive extreme drought events lies between −4 and +4.
By combining Equations (3) and (4), Narasimhan and Srinivasan [12] created the specific ETDI formula which states that the current ETDI is the sum of half of the previous ETDI and the current WSA (Equations (A1) and (A2) in Appendix A). The specific ETDI formula is a linear equation, and the coefficient of WSA was assumed to be one. Moreover, a residual term was also not addressed by the specific ETDI formula (Equations (A1) and (A2) in Appendix A).
From Equation (4) it is apparent that the importance of the previous ETDI or drought memory with respect to WSA cannot always be the same at different land cover types or climatic regions [27,28,29,30]. Therefore, this study modified Equation (4) to include a coefficient β to the WSA term, in order to facilitate the calibration of both drought memory and WSA at different places (Equation (5)). With regard to Equation (2), here WSA was considered to range between −1 and +1, so that the ETDI of consecutive extreme drought events does not exceed −2 and +2 [2,17]. In addition, a residual term, γ , was introduced because Equation (4) resembles a linear equation (Equation (5)).
E T D I t   =   c   E T D I t 1   +   β   W S A t   +   γ
By combining Equations (3) and (5), this study obtained the ETDI formula that incorporates weighted contributions of both the previous ETDI and the current WSA (Equation (6)).
E T D I t   =   1 + c   E T D I t 1   +   β   W S A t   +   γ
The general ETDI formula (Equation (7)) was obtained by replacing 1 + c in Equation (6) with an α . The general ETDI formula has three variables and three unknown coefficients, including the constant term. The general ETDI formula is homologous to the specific ETDI formula. Therefore, the specific ETDI formula (Equation (A2) in Appendix A) is a special case of the general ETDI formula (Equation (7)).
E T D I t   =   α   E T D I t 1   +   β   W S A t   +   γ
where α modulates the long-term memory of ETDI.
At an extremely dry boundary condition, consecutive dry periods have W S A t equal to −1, and E T D I t and E T D I t 1 equal to −2. Likewise, at an extremely wet boundary condition, consecutive wet periods have W S A t equal to +1, and E T D I t and E T D I t 1 equal to +2. By substituting these two boundary conditions in Equation (7), the γ -parameter becomes 0. Therefore, the general ETDI formula (Equation (7)) becomes Equation (8).
E T D I t   =   α   E T D I t 1   +   β   W S A t
Again, by substituting either of the two boundary conditions (i.e., extremely dry or extremely wet), Equation (8) turns into a parameter equation that governs the relationship between α and β parameters (Equation (9)). Figure 3 shows the straight line of Equation (9).
β   =     2 α   +   2
Equation (9) indicates the presence of a large number of parameter combinations along the straight line. Table 1 shows the ranges of those parameter combinations at consecutive extremely dry and wet boundary conditions. Thus, for values of ETDI in Equation (8) to span between −2 and +2, values of α should range between 0 and 1, and values of β should range between 0 and 2 (Equation (9), Figure 3, Table 1). Therefore, the estimation of the ETDI time series at a point should use Equation (8), where parameters are governed by Equation (9), and at an initial condition, ETDI equals zero. In this study, an ETDI time series derived using α , β -parameters is hereafter referred to as an E T D I α ,     β time series or curve.

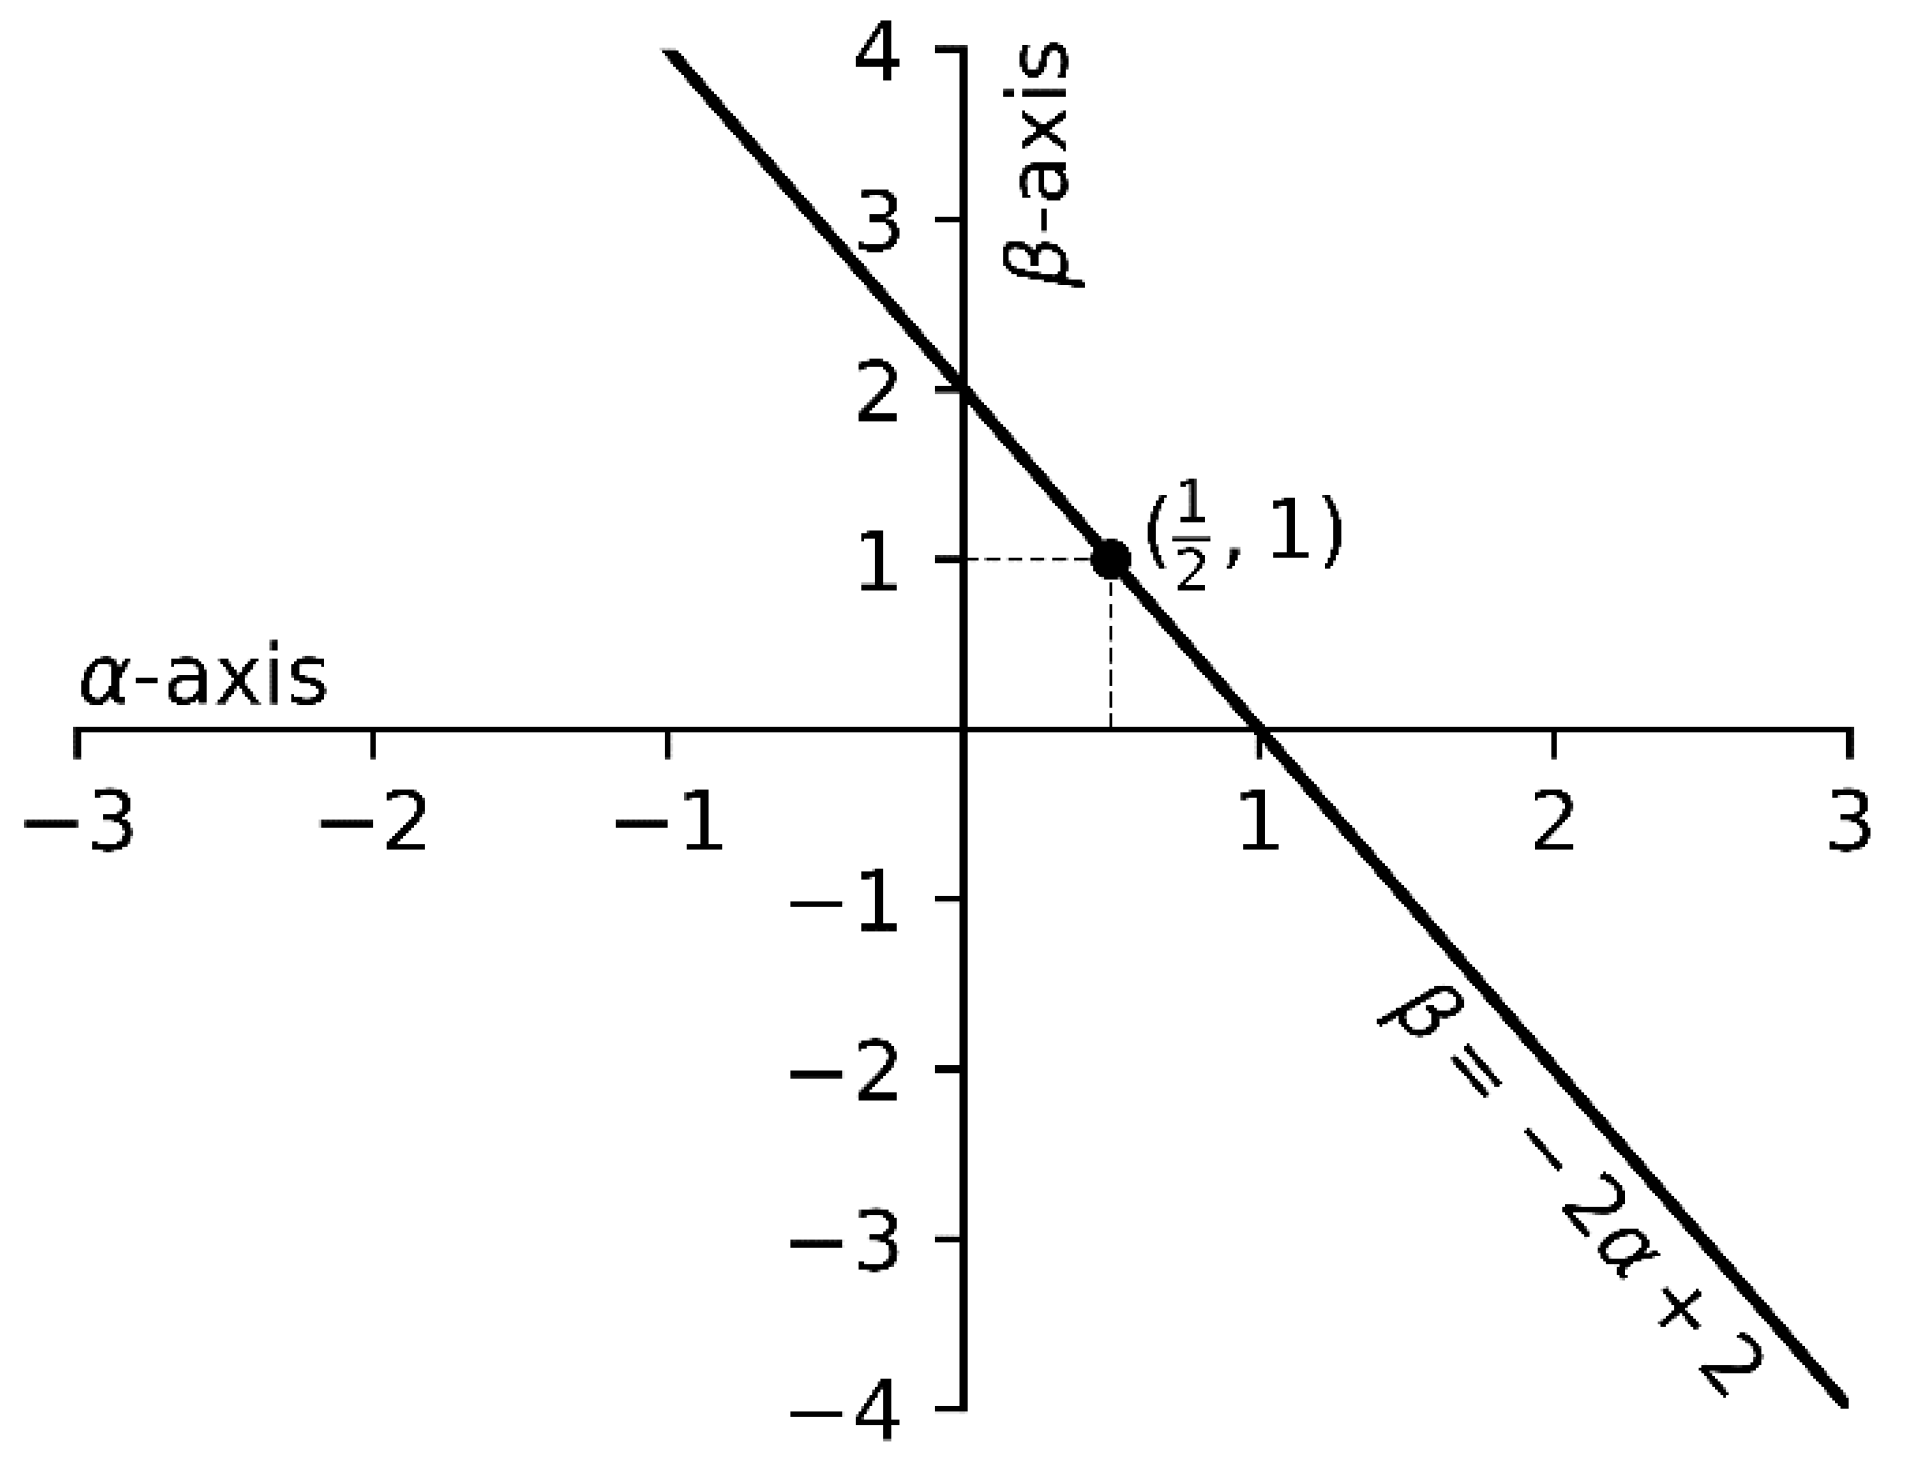
2.3.1. Parameter Sensitivity Test

The parameter sensitivity test used 8-day ET and PET data at point P1 in the Ruvu River basin (Figure 1 and Figure 2). Prior to the parameter sensitivity test, Equations (1) and (2) were used to estimate WS and WSA, respectively. Since the parameter sensitivity test intended to investigate how ETDI values from Equation (8) change relative to various α and β parameter combinations, a sample of eleven α -parameters from 0.0 to 1.0 at an interval of 0.1 was selected and used to obtain corresponding β values using Equation (9). Then by using Equation (8), WSA values at point P1 were used to generate an ETDI curve for each parameter combination.
ETDI curves for all parameter combinations at point P1 were finally used in a correlation analysis in order to investigate parameter combinations that have more or less similar ETDI curves. Estimations of drought events and total drought durations from ETDI curves at point P1 were also conducted in order to compare ETDI curves of different parameter combinations in terms of drought characteristics. A drought event was identified by the start and the end of a drought. The start of a drought event was the time when the ETDI was less or equal to −1.00 for at least eight consecutive, 8-day periods (approx. 2 months) [31]. The end of a drought event was the time when the ETDI returns to zero [32]. Total drought durations were the sum of all periods from all drought events in a time series.

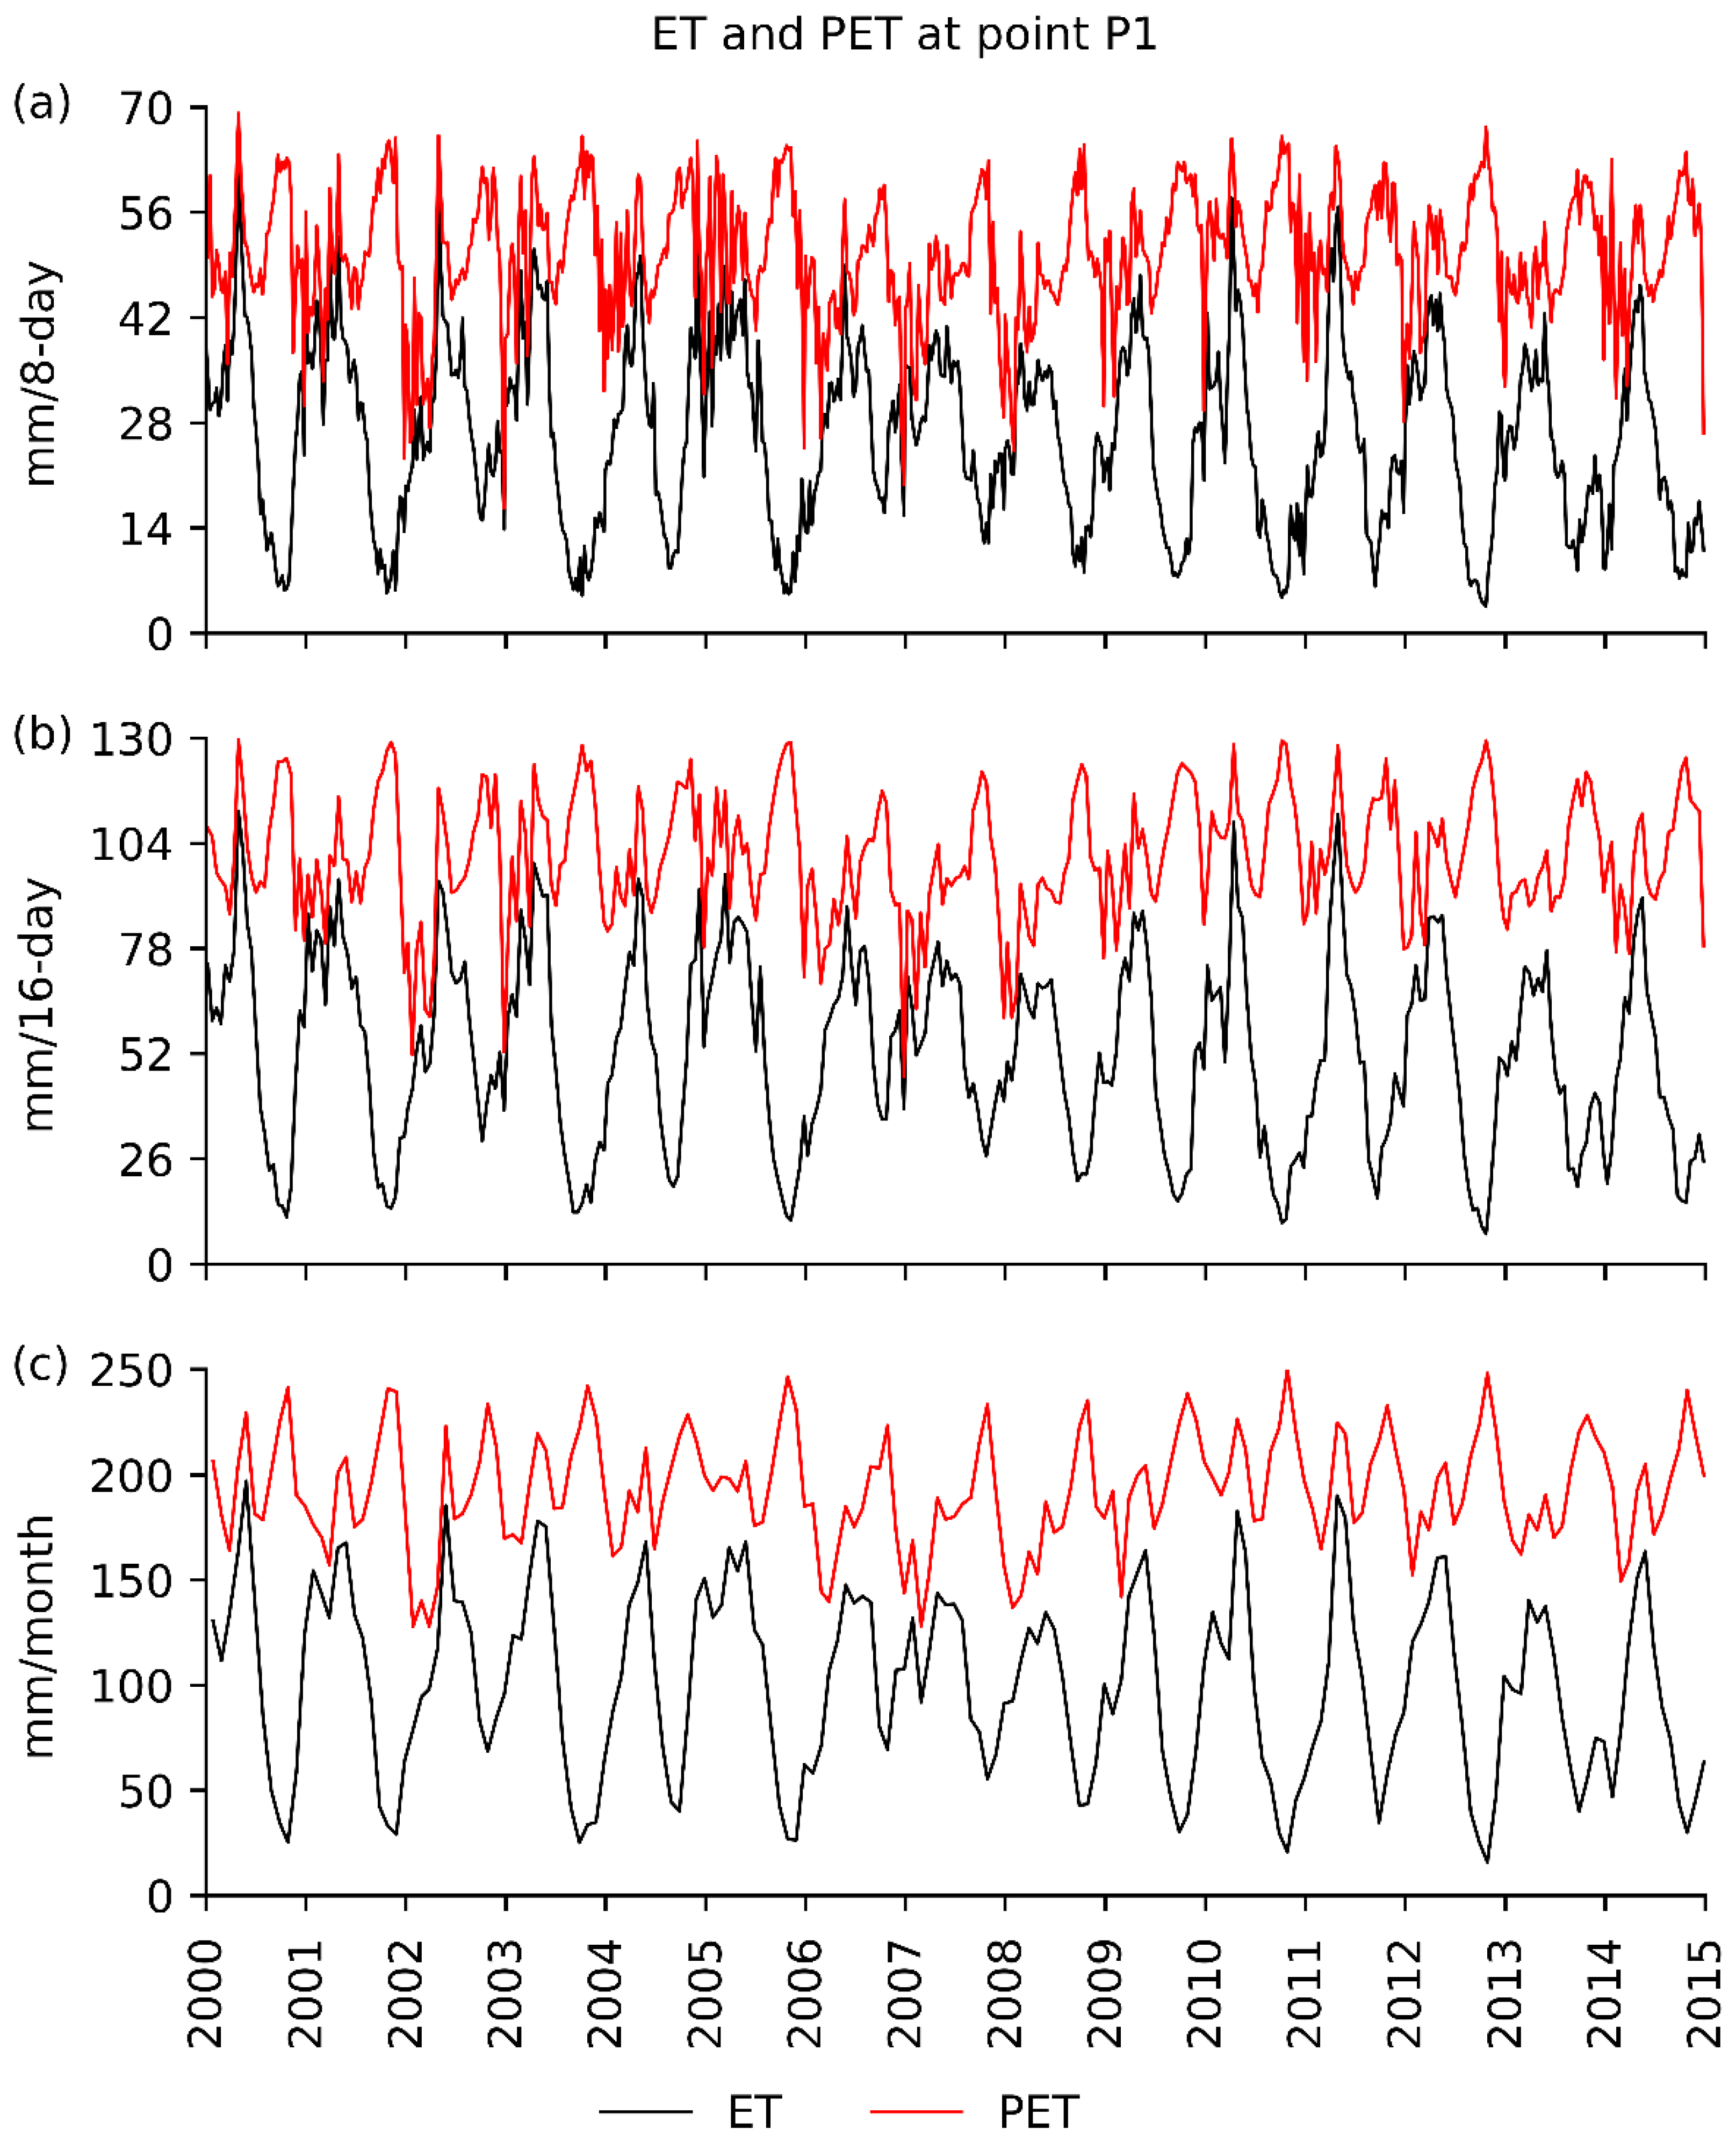
2.3.2. Temporal Scale Sensitivity Test

The sensitivity of the ETDI to data at different temporal scales used 8-day, 16-day, 1-month ET, and PET data at all twelve points in the Ruvu River basin (Figure 1). Equations (1) and (2) were used to estimate WSs and WSAs at the points, respectively. Prior to the temporal scale sensitivity test, values of α and β equal to 0.5 and 1, respectively, were selected as the appropriate constant parameter combination, because they are in the middle of both parameter ranges. Moreover, this parameter combination is also commonly used in estimations of ETDI [2,12]. By using the constant parameter combination in Equation (8), the sensitivity of the ETDI to the three different temporal scales was investigated by estimating ETDI curves of 8-day, 16-day, and 1-month timesteps at each of the twelve points (P1 to P12) in the river basin.
Then drought events and total drought durations at each point were computed in order to compare ETDI curves at different temporal scales in terms of drought characteristics. Here, drought events for 8-day, 16-day, and 1-month timesteps had at least eight consecutive 8-day periods, four consecutive 16-day periods, and two consecutive months, respectively.

3. Results and Discussion

3.1. Parameter Sensitivity

In the parameter sensitivity test, eleven parameter combinations resulted in eleven E T D I α , β time series. For illustration purposes, Figure 4 shows only five of the eleven E T D I α , β time series. The E T D I 0.0 , 2.0 curve was the widest in both dry (negative ETDI) and wet (positive ETDI) axes. The peaks of E T D I 0.1 , 1.8 and E T D I 0.5 , 1.0 curves were smaller than those of the E T D I 0.0 , 2.0 curve. However, these three curves had similar patterns. On the other hand, the E T D I 0.9 , 0.2 curve was very different from other curves due to its shorter and smoother peaks (Figure 4). This is because the β -parameter of the curve was very small ( β   =   0.2 ), therefore, it diminished the influence of W S A t (Equation (8)).
Unlike the curves of other parameter combinations, the E T D I 1.0 , 0.0 time series had zero values throughout the record length, thus coinciding with the time axis (Figure 4). Zero values occurred because W S A t was nullified by the β -parameter, which was equal to 0.0, thus the E T D I 1.0 , 0.0 time series depended only on E T D I t 1 , which was initially assumed to be zero. In that case the E T D I 1.0 , 0.0 time series was excluded in both correlation analysis and drought characterization.
The E T D I 0.0 , 2.0 curve correlated highly with the E T D I 0.1 , 1.8 curve (Figure 5), they both show the highest number of drought events, and the lowest duration per event (4 months per event, Table 2). This means that the small α -parameters of these two curves reduced the influence of E T D I t 1 , while large β -parameters allowed the dominance of W S A t (Equation (8)). This is inversely demonstrated by the E T D I 0.9 , 0.2 curve which had the lowest number of drought events and the highest duration per event (10 months per event, Table 2). Here, a large α-parameter allowed the dominance of E T D I t 1 , but the small β -parameter had already smoothened peaks of W S A t (Equation (8)), thus causing wide, but few, peaks (cf. Figure 4).
In addition, the E T D I 0.9 , 0.2 and E T D I 0.8 , 0.4 curves highly correlated (Figure 5), but they had a substantially different number of drought events and total drought durations (Table 2). A high correlation between the two curves was due to the similarity of their patterns, which were not affected by minor parameter differences. However, the differences in drought characteristics were mainly due to the β -parameter, because it substantially reduced the W S A t of the E T D I 0.9 , 0.2 curve more than that of the E T D I 0.8 , 0.4 curve. The E T D I 0.4 , 1.2 , and E T D I 0.6 , 0.8 curves also highly correlated with the E T D I 0.5 , 1.0 curve, and had an equal number of drought events (Figure 5, Table 2); this is because the influence of their ETDI t 1 and WSA t were reduced to almost half by α-parameters, and were almost fully allowed by β -parameters (Equation (8)), respectively.
Generally, as the α , β -parameters deviated from the midpoint 0.5 , 1.0 towards the endpoint 0.0 , 2.0 , E T D I t depended mostly on W S A t , while E T D I t 1 became substantially diminished (Equation (8)). However, when α , β -parameters equaled 0.0 , 2.0 , the E T D I 0.0 , 2.0 curve did not substantially differ from the ETDI curve of the mid-point. That is why the correlation coefficient between the E T D I 0.0 , 2.0 curve and the ETDI curve of the mid-point was still very high (94%, Figure 5), and drought durations per event had minor differences (Table 2). As α , β -parameters approached 0.9 , 0.2 , the E T D I 0.9 ,     0.2 curve deviated substantially from the ETDI curve of the mid-point. That is why their correlation coefficient was very small, (66%, Figure 5) and drought durations per event differed by 5 months (Table 2). This deviation was caused by diminishing WSA t due to a declining β -parameter (Equation (8)). Thus the β -parameter is more influential than the α-parameter because it controls strong signals from W S A t , whereas the latter modulates the long-term memory of E T D I t 1 .
Therefore, an arbitrary choice of parameter combination has drastic effects on drought characteristics. As a result, information about drought frequency, severity, and intensity can be misrepresented, leading to inappropriate intervention measures for mitigation or adaptation to drought. This uncertainty in the selection of an optimal parameter combination is enormous, because the range between the endpoints (see Figure 3) can be sub-divided into many parameter combinations depending on the required level of accuracy, i.e., decimal places. Despite its wide application, the mid-point is still not a universal parameter combination, because the contributions of E T D I t 1 and W S A t might vary from place to place. On the other hand, the endpoints, i.e., 0.0 , 2.0 and 1.0 , 0.0 are also not realistic because they neglect the contributions of E T D I t 1 and W S A t , respectively.
Like coefficients of the Palmer drought severity index, parameters of the ETDI might also be derived from local crop characteristics or land cover types in an area [19,33,34]. Apart from this, comparisons of ETDIs with other drought information could also be used to locally calibrate ETDI parameters [18]. This would involve testing of different parameter combinations to identify a pair that gives a satisfactory match between the time series of the ETDI and other drought indices, or between durations of the ETDI and historically severe drought events in an area. Locally calibrated ETDIs from different areas can be compared as long as they are scaled using the same range [35,36].

3.2. Temporal Scale Sensitivity

For illustration purposes, only ETDI curves of points P1 to P6 are graphically presented (Figure 6 and Figure 7), the rest of the points are summarized in Table 3. The 8-day, 16-day, and 1-month temporal scales caused substantially different ETDI curves at the points in the Ruvu River basin.
Figure 6 and Figure 7 show that 8-day ETDI curves were the widest in both dry (negative ETDI) and wet (positive ETDI) axes. Thus, 16-day ETDI curves were enclosed by 8-day ETDI curves throughout the time series. Similarly, monthly ETDI curves were also enclosed by both 8-day ETDI and 16-day ETDI curves. These ETDI curves showed that the effects of the aggregation of ET and PET from small to large temporal scales were propagated to ETDI values (cf. Figure 2, Figure 6, and Figure 7).
Table 3 shows that at all twelve points in the river basin, the number of drought events decreased as the size of the temporal scale increased. The difference in the number of drought events between consecutive temporal scales was mainly between 1 and 2, except at points P4 and P11, where the differences between 16-day and 1-month temporal scales were relatively large (about 5 drought events). The large differences in the number of drought events at these two points could be attributed to local effects, because they are both found in the northern part of the river basin (cf. Figure 1).
Although differences between the numbers of drought events at many points in the river basin were not large, their corresponding total drought durations differed by many months (Table 3). The total drought durations of 8-day ETDI curves were almost twice and thrice those of 16-day ETDI curves and monthly ETDI curves, respectively. Thus, total drought durations also decreased as the temporal scale increased. Moreover, almost all points in the river basin had durations per event ranging from 5 months for 8-day ETDI curves, to 2 months for monthly ETDI curves (Table 3).
Since different numbers of drought events and drought durations usually lead to different drought severities and drought intensities [8,25,31], therefore, different temporal scales of ET and PET data lead to different ETDIs, and consequently different drought characteristics. By using the standardized precipitation index and effective drought index, Jain, et al. [37] also found that drought characteristics vary greatly with different temporal scales. Moreover, Ntale and Gan [27] argued that there are no objective rules for selecting an appropriate temporal scale. However, the largest number of drought events being captured by the 8-day temporal scale in this study (Table 3) indicates that small temporal scales can be useful because a region suffering from drought can return to a normal condition with only a few days’ rainfall [27,38].

4. Conclusions

This study used the general ETDI formula to test the sensitivity of the ETDI to its parameters and to data at different temporal scales. Data used were the MODIS ET time series for twelve points spatially distributed in the Ruvu River basin, Tanzania. The parameter sensitivity test revealed that ETDI is less sensitive when the α , β -parameters range from 0.1 , 1.8 to 0.5 , 1.0 inclusive, and more sensitive when they approach 0.9 , 0.2 . Since the ETDI is sensitive to different parameter combinations, the selection of an optimal parameter combination might rely on information from specific locations. Moreover, an optimal parameter combination can also be obtained when ETDI is calibrated against other drought indices or durations of historically severe drought events. The temporal scale sensitivity test at the twelve points in the river basin showed that the number of drought events, the total drought durations, and durations per event decreases as the temporal scale increases. Therefore, small temporal scale ET data are highly recommended in order to increase the accuracy of ETDI-based drought characteristics.

Funding

This research received no external funding.

Acknowledgments

The author would like to thank the maintainer of the NTSG repository for freely providing MODIS ET datasets. Thanks to Festo Silungwe from the Sokoine University of Agriculture (Tanzania) for proofreading the manuscript.

Conflicts of Interest

The author declares no conflict of interest.

Appendix A

The specific evapotranspiration deficit index (ETDI) formula derived by Narasimhan and Srinivasan [12] is given by Equation (A1) below.
E T D I t   =   1 + c   E T D I t 1   +   W S A t
where a subscript, t , represents a continuous timestep. c controls the amount of   E T D I t 1 that contributes to E T D I t . W S A t is scaled between −1 and +1.
At a boundary condition (i.e., extremely dry condition), W S A t equals −1, and E T D I t and   E T D I t 1 equal −2. By substituting WSA and ETDI values in Equation (A1), c becomes equal to −0.5. Therefore, the final specific ETDI formula is shown in Equation (A2).
E T D I t   =   0.5   E T D I t 1   +   W S A t
The endpoints of the ETDI range, i.e., −2 and +2 indicate extremely dry and wet conditions, respectively.

References

  1. Ziolkowska, J. Socio-Economic Implications of Drought in the Agricultural Sector and the State Economy. Economies 2016, 4, 19. [Google Scholar] [CrossRef]
  2. Bayissa, Y.; Maskey, S.; Tadesse, T.; van Andel, S.; Moges, S.; van Griensven, A.; Solomatine, D. Comparison of the Performance of Six Drought Indices in Characterizing Historical Drought for the Upper Blue Nile Basin, Ethiopia. Geosciences 2018, 8, 81. [Google Scholar] [CrossRef] [Green Version]
  3. Kim, T.-W.; Jehanzaib, M. Drought Risk Analysis, Forecasting and Assessment under Climate Change. Water 2020, 12, 1862. [Google Scholar] [CrossRef]
  4. Liu, S.; Shi, H.; Niu, J.; Chen, J.; Kuang, X. Assessing Future Socioeconomic Drought Events under a Changing Climate over the Pearl River Basin in South China. J. Hydrol. Reg. Stud. 2020, 30, 100700. [Google Scholar] [CrossRef]
  5. Peng, J.; Dadson, S.; Hirpa, F.; Dyer, E.; Lees, T.; Miralles, D.G.; Vicente-Serrano, S.M.; Funk, C. A Pan-African High-Resolution Drought Index Dataset. Earth Syst. Sci. Data 2020, 12, 753–769. [Google Scholar] [CrossRef] [Green Version]
  6. Martínez-Fernández, J.; González-Zamora, A.; Sánchez, N.; Gumuzzio, A.; Herrero-Jiménez, C.M. Satellite Soil Moisture for Agricultural Drought Monitoring: Assessment of the SMOS Derived Soil Water Deficit Index. Remote Sens. Environ. 2016, 177, 277–286. [Google Scholar] [CrossRef]
  7. Das, P.K.; Das, R.; Das, D.K.; Midya, S.K.; Bandyopadhyay, S.; Raj, U. Quantification of Agricultural Drought over Indian Region: A Multivariate Phenology-Based Approach. Nat. Hazards 2020, 101, 255–274. [Google Scholar] [CrossRef]
  8. Hao, Z.; Singh, V.P. Drought Characterization from a Multivariate Perspective: A Review. J. Hydrol. 2015, 527, 668–678. [Google Scholar] [CrossRef]
  9. Touma, D.; Ashfaq, M.; Nayak, M.A.; Kao, S.-C.; Diffenbaugh, N.S. A Multi-Model and Multi-Index Evaluation of Drought Characteristics in the 21st Century. J. Hydrol. 2015, 526, 196–207. [Google Scholar] [CrossRef] [Green Version]
  10. Martínez-Fernández, J.; González-Zamora, A.; Sánchez, N.; Gumuzzio, A. A Soil Water Based Index as a Suitable Agricultural Drought Indicator. J. Hydrol. 2015, 522, 265–273. [Google Scholar] [CrossRef]
  11. Yang, H.; Wang, H.; Fu, G.; Yan, H.; Zhao, P.; Ma, M. A Modified Soil Water Deficit Index (MSWDI) for Agricultural Drought Monitoring: Case Study of Songnen Plain, China. Agric. Water Manag. 2017, 194, 125–138. [Google Scholar] [CrossRef]
  12. Narasimhan, B.; Srinivasan, R. Development and Evaluation of Soil Moisture Deficit Index (SMDI) and Evapotranspiration Deficit Index (ETDI) for Agricultural Drought Monitoring. Agric. For. Meteorol. 2005, 133, 69–88. [Google Scholar] [CrossRef]
  13. Šebenik, U.; Brilly, M.; Šraj, M. Drought Analysis Using the Standardized Precipitation Index (SPI). Acta Geogr. Slov. 2017, 57. [Google Scholar] [CrossRef] [Green Version]
  14. Shah, R.; Bharadiya, N.; Manekar, V. Drought Index Computation Using Standardized Precipitation Index (SPI) Method for Surat District, Gujarat. Aquat. Procedia 2015, 4, 1243–1249. [Google Scholar] [CrossRef]
  15. Pramudya, Y.; Onishi, T. Assessment of the Standardized Precipitation Index (SPI) in Tegal City, Central Java, Indonesia. IOP Conf. Ser. Earth Environ. Sci. 2018, 129, 012019. [Google Scholar] [CrossRef]
  16. Li, J.Z.; Wang, Y.X.; Li, S.F.; Hu, R. A Nonstationary Standardized Precipitation Index Incorporating Climate Indices as Covariates. J. Geophys. Res. Atmos. 2015, 120, 12082–12095. [Google Scholar] [CrossRef] [Green Version]
  17. Trambauer, P.; Maskey, S.; Werner, M.; Pappenberger, F.; van Beek, L.P.H.; Uhlenbrook, S. Identification and Simulation of Space–Time Variability of Past Hydrological Drought Events in the Limpopo River Basin, Southern Africa. Hydrol. Earth Syst. Sci. 2014, 18, 2925–2942. [Google Scholar] [CrossRef] [Green Version]
  18. Jacobi, J.; Perrone, D.; Duncan, L.L.; Hornberger, G. A Tool for Calculating the Palmer Drought Indices. Water Resour. Res. 2013, 49, 6086–6089. [Google Scholar] [CrossRef]
  19. Sivakumar, M.V.K.; Motha, R.P.; Wilhite, D.A.; Wood, D.A. Agricultural Drought Indices. In Proceedings of the WMO/UNISDR Expert Group Meeting on Agricultural Drought Indices (AGM-11, WAOB-2011), Murcia, Spain, 2–4 June 2010; WMO/TD No. 1572. World Meteorological Organization: Geneva, Switzerland, 2011. [Google Scholar]
  20. Zargar, A.; Sadiq, R.; Naser, B.; Khan, F.I. A Review of Drought Indices. Environ. Rev. 2011, 19, 333–349. [Google Scholar] [CrossRef]
  21. Esfahanian, E.; Nejadhashemi, A.P.; Abouali, M.; Adhikari, U.; Zhang, Z.; Daneshvar, F.; Herman, M.R. Development and Evaluation of a Comprehensive Drought Index. J. Environ. Manag. 2017, 185, 31–43. [Google Scholar] [CrossRef] [Green Version]
  22. Wambura, F.J.; Dietrich, O. Analysis of Agricultural Drought Using Remotely Sensed Evapotranspiration in a Data-Scarce Catchment. Water 2020, 12, 998. [Google Scholar] [CrossRef] [Green Version]
  23. Jarvis, A.; Reuter, H.I.; Nelson, A.; Guevara, E. Hole-Filled SRTM for the Globe Version 4. 2008. Available online: http://srtm.csi.cgiar.org (accessed on 28 October 2017).
  24. Kashaigili, J.J. Rapid Environmental Flow Assessment for the Ruvu River, A Consultancy Report submitted to iWASH. 2011. Available online: http://www.suaire.sua.ac.tz/bitstream/handle/123456789/1481/Kashaigili17.pdf (accessed on 28 October 2017).
  25. Hassan, I.H.; Mdemu, M.V.; Shemdoe, R.S.; Stordal, F. Drought Pattern along the Coastal Forest Zone of Tanzania. Atmos. Clim. Sci. 2014, 4, 369–384. [Google Scholar] [CrossRef] [Green Version]
  26. Mu, Q.; Zhao, M.; Running, S.W. Improvements to a MODIS Global Terrestrial Evapotranspiration Algorithm. Remote Sens. Environ. 2011, 115, 1781–1800. [Google Scholar] [CrossRef]
  27. Ntale, H.K.; Gan, T.Y. Drought Indices and Their Application to East Africa. Int. J. Climatol. 2003, 23, 1335–1357. [Google Scholar] [CrossRef]
  28. Sharafati, A.; Nabaei, S.; Shahid, S. Spatial Assessment of Meteorological Drought Features over Different Climate Regions in Iran. Int. J. Climatol. 2020, 40, 1864–1884. [Google Scholar] [CrossRef]
  29. Pei, Z.; Fang, S.; Wang, L.; Yang, W. Comparative Analysis of Drought Indicated by the SPI and SPEI at Various Timescales in Inner Mongolia, China. Water 2020, 12, 1925. [Google Scholar] [CrossRef]
  30. Raible, C.C.; Bärenbold, O.; Gómez-Navarro, J.J. Drought Indices Revisited—Improving and Testing of Drought Indices in a Simulation of the Last Two Millennia for Europe. Tellus A Dyn. Meteorol. Oceanogr. 2017, 69, 1287492. [Google Scholar] [CrossRef] [Green Version]
  31. Brito, S.S.B.; Cunha, A.P.M.A.; Cunningham, C.C.; Alvalá, R.C.; Marengo, J.A.; Carvalho, M.A. Frequency, Duration and Severity of Drought in the Semiarid Northeast Brazil Region. Int. J. Climatol. 2018, 38, 517–529. [Google Scholar] [CrossRef]
  32. Spinoni, J.; Naumann, G.; Vogt, J.; Barbosa, P. European Drought Climatologies and Trends Based on a Multi-Indicator Approach. Glob. Planet. Chang. 2015, 127, 50–57. [Google Scholar] [CrossRef]
  33. Karl, T.R. The Sensitivity of the Palmer Drought Severity Index and Palmer’s Z-Index to Their Calibration Coefficients Including Potential Evapotranspiration. J. Clim. Appl. Meteorol. 1986, 25, 77–86. [Google Scholar] [CrossRef] [Green Version]
  34. Palmer, W.C. Meteorological Drought. In Research Paper No. 45; US Department of Commerce Weather Bureau: Washington, DC, USA, 1965; Volume 30. [Google Scholar]
  35. Ogunrinde, A.T.; Oguntunde, P.G.; Olasehinde, D.A.; Fasinmirin, J.T.; Akinwumiju, A.S. Drought Spatiotemporal Characterization Using Self-Calibrating Palmer Drought Severity Index in the Northern Region of Nigeria. Results Eng. 2020, 5, 100088. [Google Scholar] [CrossRef]
  36. Wells, N.; Goddard, S.; Hayes, M.J. A Self-Calibrating Palmer Drought Severity Index. J. Clim. 2004, 17, 2335–2351. [Google Scholar] [CrossRef]
  37. Jain, V.K.; Pandey, R.P.; Jain, M.K.; Byun, H.-R. Comparison of Drought Indices for Appraisal of Drought Characteristics in the Ken River Basin. Weather Clim. Extrem. 2015, 8, 1–11. [Google Scholar] [CrossRef] [Green Version]
  38. Byun, H.-R.; Wilhite, D.A. Objective Quantification of Drought Severity and Duration. J. Clim. 1999, 12, 2747–2756. [Google Scholar] [CrossRef]
Figure 1. The Ruvu River basin showing elevation [23] and the points (P1 to P12) used to extract the time series of evapotranspiration and potential evapotranspiration from remote sensing images.
Hydrology 08 00026 g001
Figure 2. Typical Moderate Resolution Imaging Spectroradiometer (MODIS) evapotranspiration (ET) and potential evapotranspiration (PET) time series at (a) 8-day, (b) 16-day, and (c) 1-month temporal scales [26] at point P1 in the Ruvu River basin.
Hydrology 08 00026 g002
Figure 3. Straight line representing extremely dry and wet conditions using α and β parameters as coefficients of the previous evapotranspiration deficit index and the current water stress anomaly, respectively.
Hydrology 08 00026 g003
Figure 4. The 8-day evapotranspiration deficit index (ETDI) for five different (α,β)-parameter combinations at point P1 in the Ruvu River basin.
Hydrology 08 00026 g004
Figure 5. Pearson correlation coefficients between evapotranspiration deficit indices (ETDIs) at point P1 for various (α, β)-parameter combinations.
Hydrology 08 00026 g005
Figure 6. Evapotranspiration deficit index (ETDI) at 8-day, 16-day, and 1-month temporal scales at points P1 to P3 in the Ruvu River basin.
Hydrology 08 00026 g006
Figure 7. Evapotranspiration deficit index (ETDI) at 8-day, 16-day, and 1-month temporal scales at points P4 to P6 in the Ruvu River basin.
Hydrology 08 00026 g007
Table 1. Evapotranspiration deficit index (ETDI) of a point in time (t) at consecutive extremely dry and wet boundary conditions for three different ranges of (α,β)-parameter combinations. WSA represents water stress anomaly.
ExtremeETDIt−1WSAtETDIt at (α < 0, β > 2)ETDIt at (0 ≤ α ≤ 1, 2 ≥ β ≥ 0)ETDIt at (α > 1, β < 0)
Dry–Dry−2−1−2−2−2
Wet–Wet+2+1+2+2+2
Dry–Wet−2+1>+2−2 to +2<−2
Wet–Dry+2−1<−2−2 to +2>+2
Table 2. Drought events, total drought durations, and duration per event at point P1 for various (α,β)-parameter combinations.
ParameterEventsTotal Duration (Month)Duration per Event (Month)
ETDI(0.0,2.0)11424
ETDI(0.1,1.8)10384
ETDI(0.2,1.6)8395
ETDI(0.3,1.4)8415
ETDI(0.4,1.2)10475
ETDI(0.5,1.0)10515
ETDI(0.6,0.8)10515
ETDI(0.7,0.6)9506
ETDI(0.8,0.4)9546
ETDI(0.9,0.2)44010
Table 3. Drought events, total drought durations, and duration per event at points P1 to P12 at 8-day, 16-day, and 1-month temporal scales in the Ruvu River basin.
PointTime SeriesEventsTotal Duration (Months)Duration per Event (Months)
P18-day10515
16-day9293
1-month8172
P28-day7335
16-day5163
1-month592
P38-day10596
16-day9313
1-month8162
P48-day7517
16-day7314
1-month2157
P58-day9465
16-day10293
1-month9152
P68-day11545
16-day11293
1-month8122
P78-day11595
16-day9303
1-month7132
P88-day9597
16-day7304
1-month6153
P98-day8638
16-day8304
1-month5143
P108-day9546
16-day7264
1-month8142
P118-day14524
16-day12303
1-month7172
P128-day15544
16-day11323
1-month9172
Publisher’s Note: MDPI stays neutral with regard to jurisdictional claims in published maps and institutional affiliations.

