1. Introduction
Tafel slope analysis has become increasingly popular in this era of solar fuels research and photoelectrochemistry [
1,
2,
3,
4,
5,
6]. This study addresses the possibility of constructing Tafel plots for homogeneous catalytic multielectron redox processes and the usefulness of this approach. The model homogeneous reaction we have chosen for this study is the oxidation of water in Equation (1).
Equation (1) is very unfavorable thermodynamically and requires an external source of energy such as electricity or light (e.g., solar). The overall reaction of water splitting, Equation (3), includes two half-reactions, water oxidation and reduction, Equations (1) and (2), respectively, which proceed in spatially separated sites:
The reverse reaction in Equation (3) takes place in fuel cells to directly convert chemical energy into electricity.
In electrochemistry, the potential applied between the cathode and anode and the current is measured. Commonly, the empirically formulated Tafel relation in Equation (4) is used to compare the electrocatalytic activities:
where η = E − E
0 is the difference between the electrode and standard potentials,
i is the current density, and b is the Tafel slope.
The utility of Tafel slopes from a microkinetic analysis of aqueous electrocatalysis for energy conversion has been reported [
1,
2]. However, numerous simplifications and assumptions in the derivation of Equation (4) leads to an incomplete description of the actual surface kinetics and makes the applicability of Tafel analysis questionable [
2,
3,
7,
8]. In many cases, homogeneous systems are simpler and easier experimentally for understanding the reaction mechanism. Therefore, we developed a protocol to construct Tafel-like plots for homogeneous reactions and studied the usefulness of such plots to better understand the reaction mechanism. In addition, while extensive mechanistic analyses of molecular redox systems have been conducted previously, many aspects still need to be precisely addressed [
9]. Generally speaking, the Tafel-like plot is one among multiple approaches that link the kinetic and thermodynamic properties of such a catalytic system.
Both half reactions, Equations (1) and (2), are complex multielectron processes catalyzed by transition metal complexes. Each one is routinely studied individually [
6,
10,
11,
12]. Stable homogeneous molecular catalysts are ideally suited for studies of the reaction mechanism and the relationship between reaction kinetics and thermodynamics. Indeed, previous studies on redox and chemical catalysts in different catalytic systems have already provided theoretical tools for mechanistic analyses [
9]. More recently, Costentin and Savéant thoroughly analyzed the applicability of the Tafel equation to the homogeneous molecular catalysis of
electrochemical CO
2 and O
2 reduction [
13]. In this work, we describe a protocol for deriving a Tafel-like plot based on theoretical and experimental grounds to relate the reaction rate with the solution electrochemical potential for homogeneous water oxidation by [Ru(bpy)
3]
3+, catalyzed by the stable molecular tetraruthenium polyoxometalate [Ru
4O
4(OH)
2(H
2O)
4(γ-SiW
10O
36)
2]
10−,
Ru4POM. This POM was the first fully inorganic (carbon-free), thus oxidatively robust, water oxidation catalyst (WOC), which is also hydrolytically stable over a wide pH range (pH 1–9) [
14,
15]. Detailed electrochemical studies of this complex showed that the rates of electron exchange between an electrode and the complex is sluggish under typical catalytic turnover conditions [
14,
16]. As a result, neither the Tafel plot nor the exchange current density,
i0, can be measured experimentally. At the same time, the catalyst shows excellent activity in homogeneous aqueous solutions when stoichiometric oxidants such as Ce(IV) or [Ru(bpy)
3]
3+ are used. The question was posed as to whether data collected in homogeneous multielectron processes can be used to obtain a Tafel-like plot. This study addresses that question and aims to focus on the adaptation of an analog of traditional Tafel plots to the four-electron water oxidation process specific to homogeneous species.
2. Results and Discussion
2.1. Theoretical Considerations
Here, we assume that water oxidation in homogeneous conditions proceeds through four fast Nernstian reversible electron transfer steps followed by the irreversible O
2 formation step, Equations (5–8), where C0 is the resting oxidation state of the catalyst, C, and C1–C4 are the one- to four-electron oxidized forms of the catalyst.
If the equilibria are fast, then an applied and electrochemical solution potential, E, is linked via the Nernst equation, Equation (10):
where R is the universal gas constant, T is the temperature, and F is the Faraday constant. The concentration of the catalyst in oxidation state i = 0 − 4 is described by a distribution function, Equation (11):
where [Ct] = total concentration of the catalyst.
If a stoichiometric oxidant is used as a sacrificial electron acceptor, the Nernst law gives the applied potential equal to the solution potential. Here, we consider the case when [Ru(bpy)
3]
3+, Ru3, is an oxidant (Ru2 represents [Ru(bpy)
3]
2+). The electrochemical solution potential, E, created by this oxidant is:
where E′
0 = 1.26 V (SHE) is the standard reduction potential of the Ru3/Ru2 couple, and [Ru3]o and [Ru2]o are the initial concentrations of Ru3 and Ru2, respectively.
If the rate limiting step is Equation (9), then the reaction rate (current) is:
and the apparent turnover frequency (TOF
app) with respect to Ru3 consumption is:
Here, k
o is the rate constant for the oxidation of water. The value of the distribution factor, α
4 is time-dependent and can be determined from Equations (10) and (11), and TOF
app is a kinetic parameter. The full equation linking TOF
app and apparent potential is complex, but can be simplified if k
o is known and [Ru2]o = 0, Equation (15):
At high applied potentials, [C4] ≈ [Ct] and TOF
app reaches a plateau with the value 4k
o. This value is the maximum turnover frequency (TOF) achievable by a given catalyst. This is an intrinsic property of a catalyst and its associated turnover activity. However, TOF
0 of a certain catalytic system can be achieved at different potentials, E
TOF. As a result, the catalytic activity of two systems cannot be compared by a single number such as TOF
0. Two parameters, TOF
0 and E
TOF, are required to describe the catalytic activity. The slope of the Tafel-like plot at moderate potentials is a complex dependence of the catalyst reduction potentials and the Ru3 concentration. In our homogeneous catalytic system, Ru3 is used as a stoichiometric electron acceptor. Ru3 can also be generated in situ in a photoinduced reaction of Ru2 with persulfate, S
2O
82−, or electrochemically.
2.2. Homogeneous Electrochemical Reactions in the Presense of an Electron Transfer Catalyst
As the electron transfer from Ru4POM to the electrode is slow, we attempted to accelerate the overall reaction with the addition of an electron transfer catalyst.
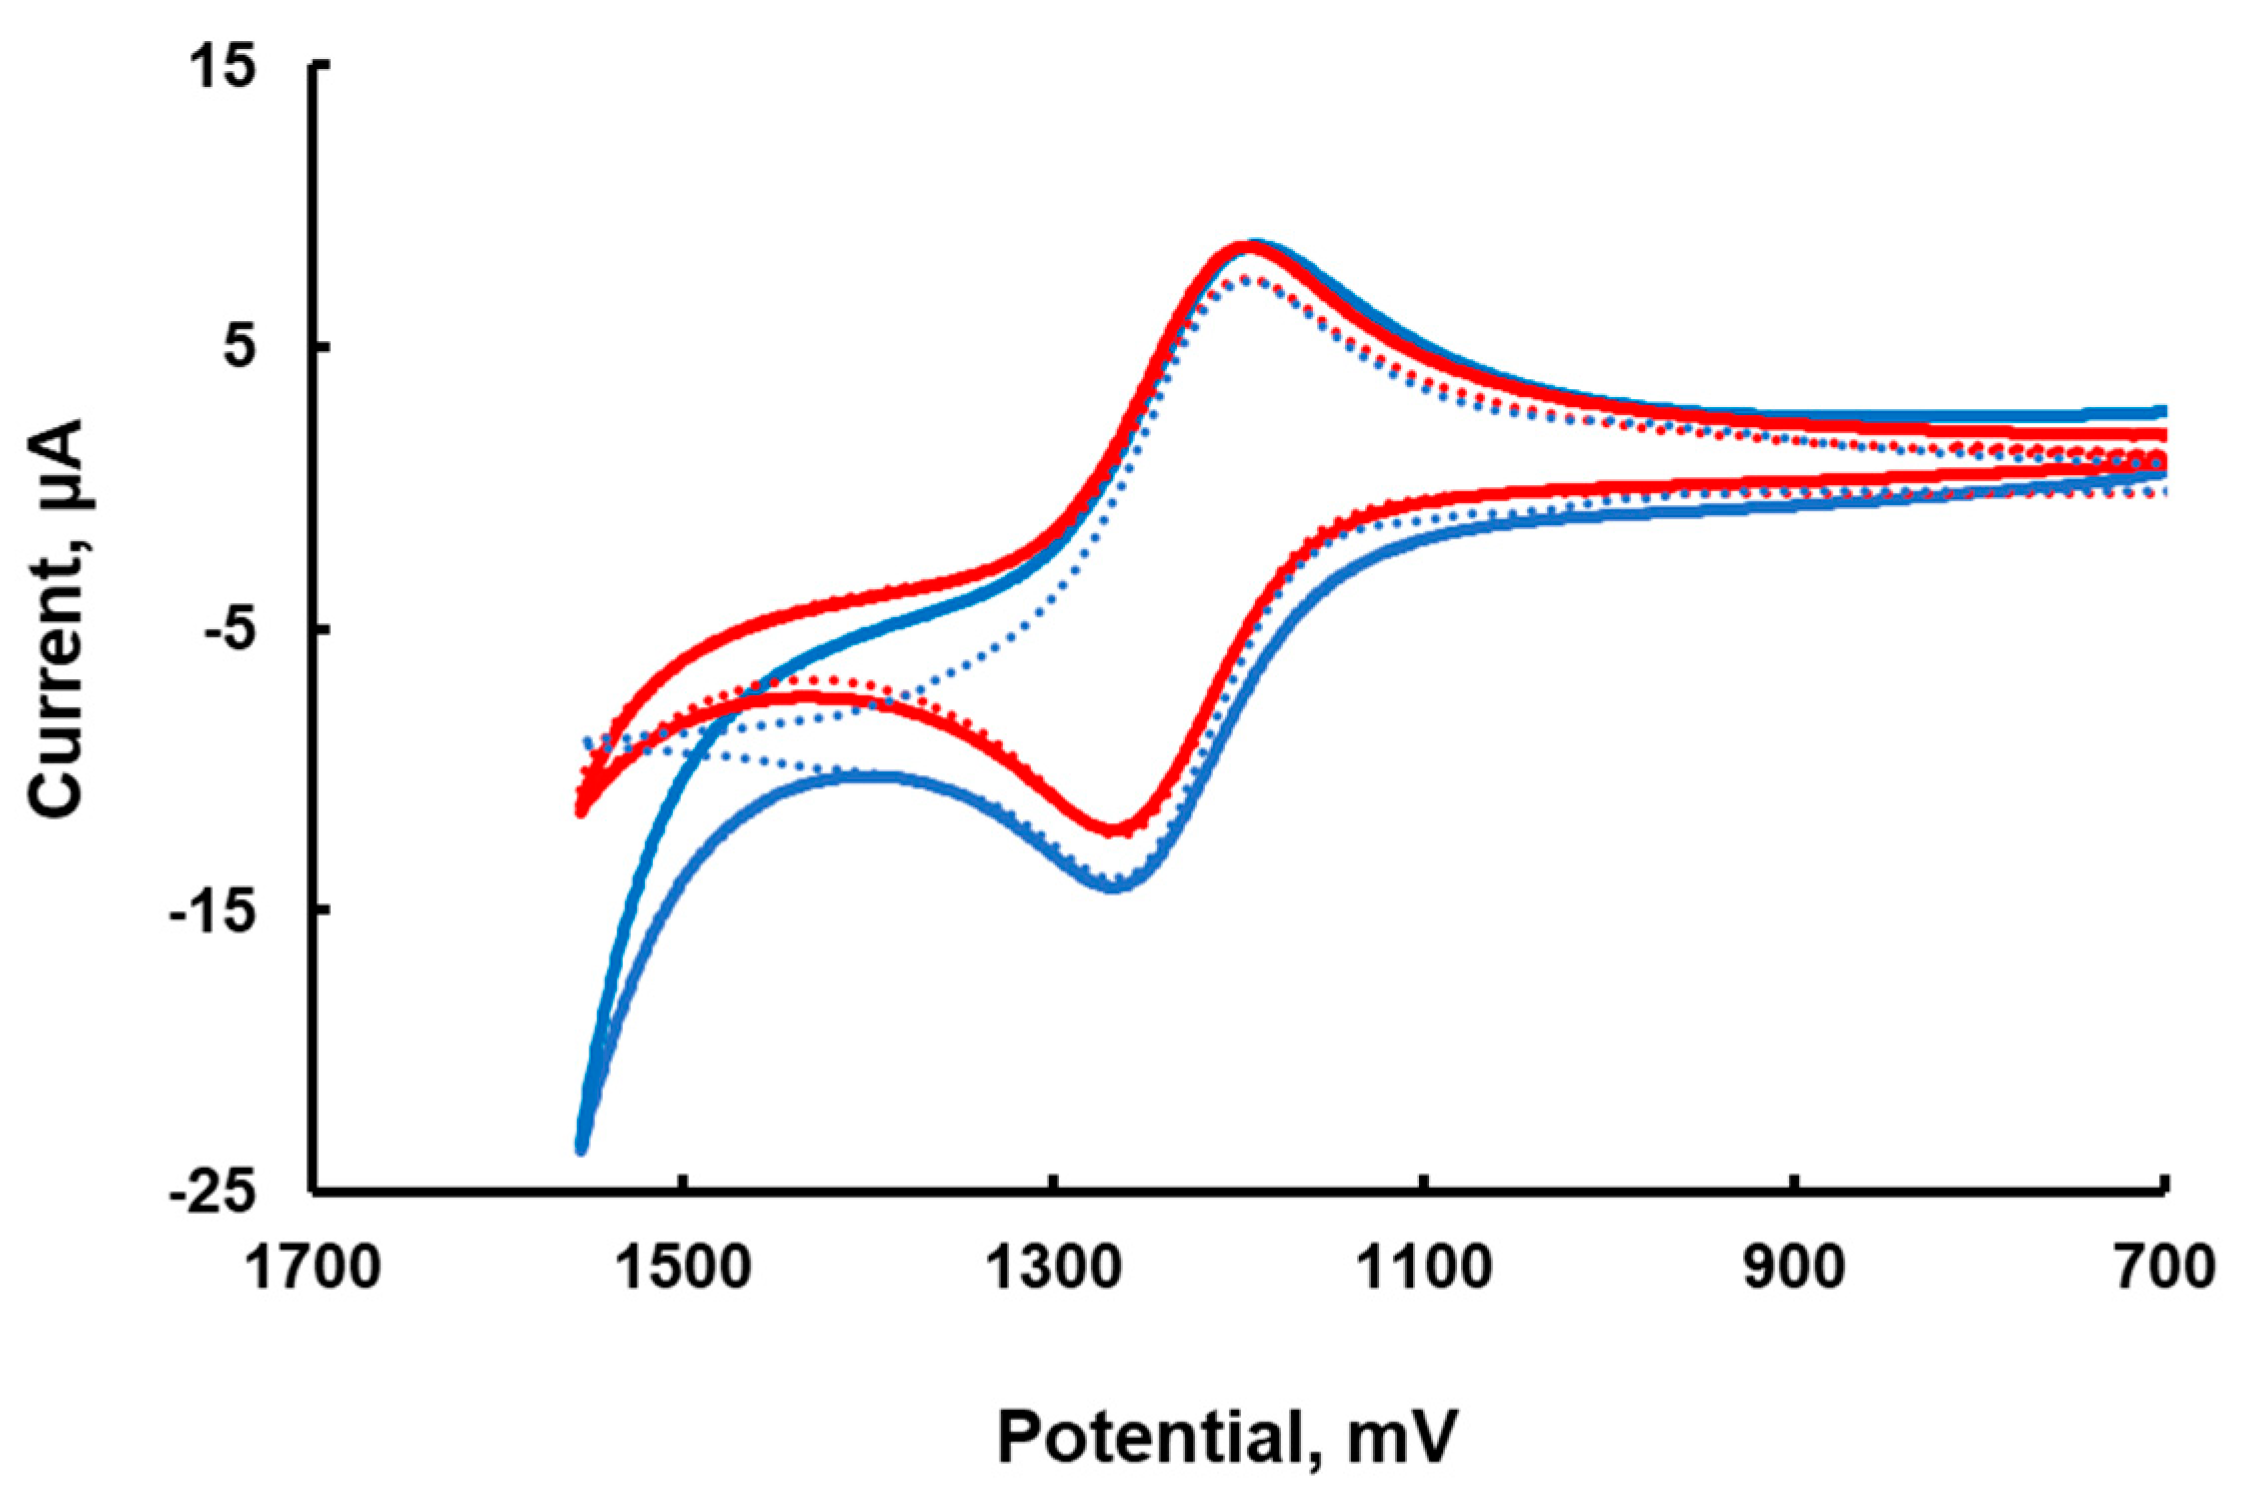
The stability of Ru3 is well documented to increase at lower pH. Therefore, the cyclic voltammetry (CV) was recorded at a slightly lower pH of 7.2. The CV of Ru3/Ru2 has an almost ideal shape with an anodic-cathodic peak separation of 69 mV and a ratio of anodic and cathodic current close to 1; E
1/2 = 1.26 V (versus SHE) in 80 mM sodium phosphate buffer at pH 7.2. The addition of 15 μM of
Ru4POM to 1.0 mM Ru2 results in a slight increase in anodic current (
Figure 1), indicating that the reaction between Ru3 and
Ru4POM takes place. At higher concentration,
Ru4POM forms an insoluble adduct with Ru2, which does not allow CV measurements over a broad range of catalyst concentrations. A foot of the wave analysis cannot be applied, as no catalytic current is seen in this system [
17]. The CV simulation with the SIM4YOU software package using the heterogeneous electron transfer reaction rate constant 0.065 cm s
−1 (measured in 0.1 M H
2SO
4) [
18] for Ru3 and a glassy carbon electrode (surface area is 0.0668 cm
2) is in good agreement with the experiment under the assumption of irreversible oxidation of Ru3 at the electrode at a potential of 1840 mV vs. SHE (
Figure 1). The simulation results in the presence of
Ru4POM is also in reasonable agreement with the experiment when the reaction mechanism and rate constants described below are applied. Clearly, simple cyclic voltammograms do not provide much information on
Ru4POM redox potentials.
2.3. Linear Sweep Voltammetry
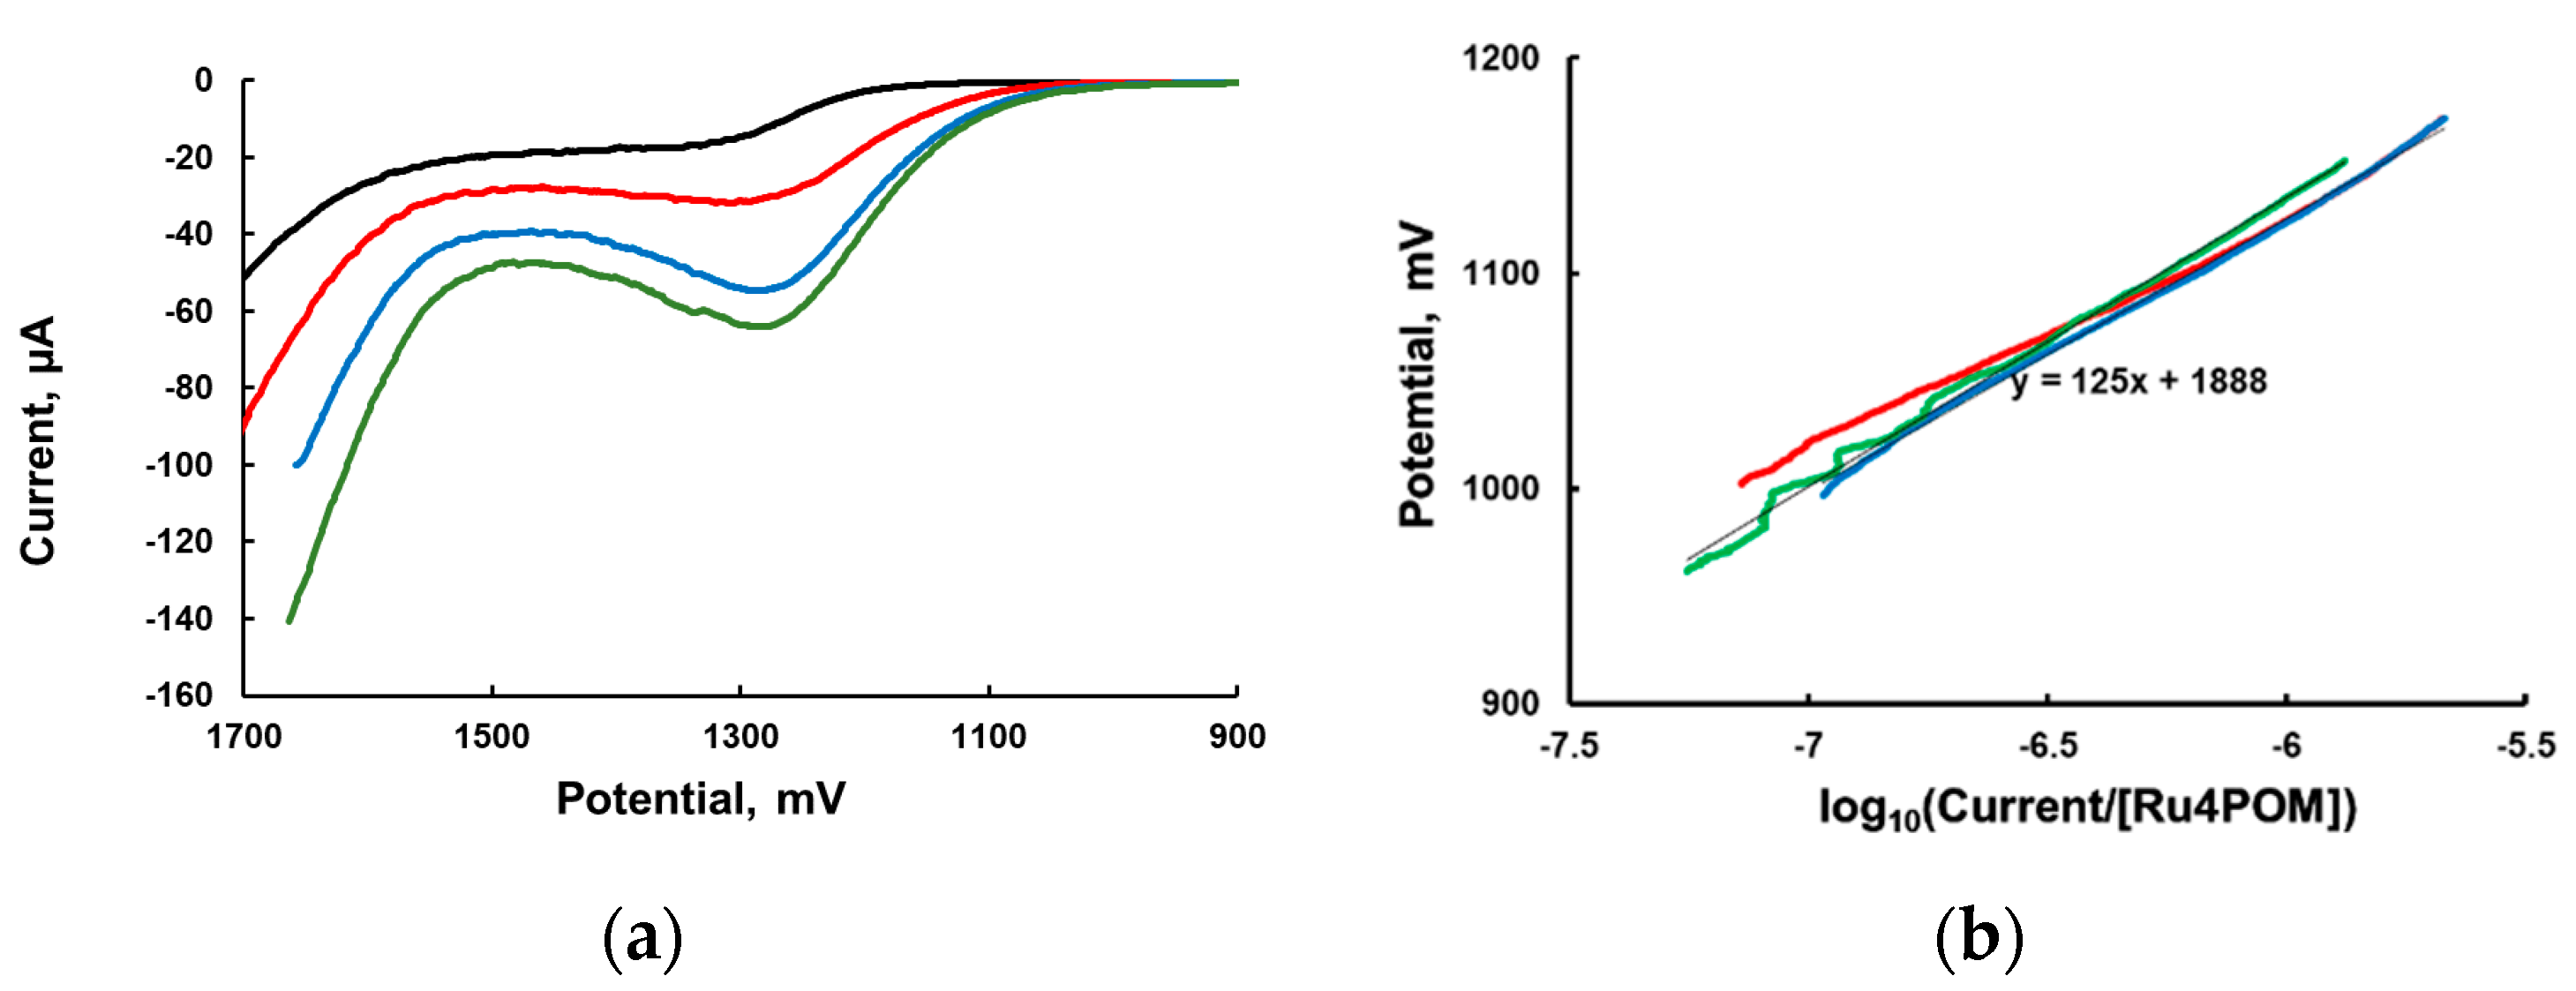
Linear sweep voltammetry (LSV) at very low scan rate with vigorous stirring of the solution is commonly used to obtain the dependence of the potential as a function of the logarithm of the current (Tafel equation). The experimental LSV curves are shown in
Figure 2a. We then plotted the applied potential (in the range 900–1200 mV) as a function of the current normalized per concentration of added [
Ru4POM] (an analog of TOF) in
Figure 2b.
The “Tafel slope” in the range of potentials between 900 and 1200 mV is ~120 mV/decade (
Figure 2) for three different
Ru4POM concentrations. Based on the formal interpretation of the Tafel equation, this slope is consistent with α = 0.5 and a one-electron process. However, as the theory of such measurements is not yet developed for a homogeneous WOC system, the meaning of this slope value is unclear.
2.4. Tafel Plot from Kinetic Curves in Homogeneous Systems
The kinetics of water oxidation by Ru3 can be followed either by measuring oxygen formation or by the consumption/formation of Ru3/Ru2. The consumption of Ru3 can be followed by a decrease in absorbance at 670–680 nm (ε = 420 M
−1cm
−1) [
14]. The reaction is fast and requires a stopped-flow instrument to collect high-quality kinetics data. The experimental details were described in our previous publications [
14,
19]. Both Ru2 and
Ru4POM slightly absorb light at 680 nm, which must and can be taken into account for quantitative analysis of raw experimental data. Here for simplicity, a kinetic curve of [Ru3] consumption versus time is the decrease in absorbance at 680 nm. At a given time
t, the reaction rate can be approximated as d[Ru3]/dt ≈ ([Ru3]
(t − Δt) − [Ru3]
t + Δt))/2Δt and TOF
ap = (d[Ru3]/dt)/[Ct] can be quantified ([Ct] is the total concentration of
Ru4POM). We make the reasonable assumption, based on our earlier studies, that the reaction mechanism is Equations (5)–(9). If reversible reactions are in equilibrium and [Ct] << [Ru3], then the electrochemical solution potential at time
t can be calculated from the Nernst equation E = E′
0 + 0.059 × log
10(([Ru3]
t/([Ru3]
0 − [Ru3]
t)), where E′
0 = 1.26 V is the standard reduction potential of the [Ru3]/[Ru2] couple, and [Ru3]
0 is the initial concentration of Ru3. As Ru3/Ru2 and
Ru4POM have large and opposite charges, their reduction potentials and the rates of their intermolecular reactions are ionic-strength-dependent. In order to keep pH constant, the use of buffered solutions is required. However, even low concentrations of sodium phosphate buffer (e.g., 25 mM) create a high ionic strength (µ ~ 75 mM). Therefore, in this work, we use the experimentally determined value of the reduction potential for the Ru2/Ru3 couple as the reference point in all calculations (e.g., 1.06 V versus 3.0 M NaCl Ag/AgCl reference electrode). We define TOF as (d[Ru3]/dt)/[Ct]. This procedure converts a single kinetic curve to the dependence of TOF on applied potentials.
The self-decomposition of Ru3 is relatively slow at pH 7.0–8.0, and the O2 yield approaches 80% of the theoretical value at [Ru4POM] > 5 µM. Therefore, the kinetics of [Ru(bpy)3]3+ consumption can be considered as the kinetics of water oxidation. The beginning of kinetic curves (up to 15% conversion) has the highest Ru3/Ru2 ratio, which quickly changes with time and makes the rate measurements problematic.
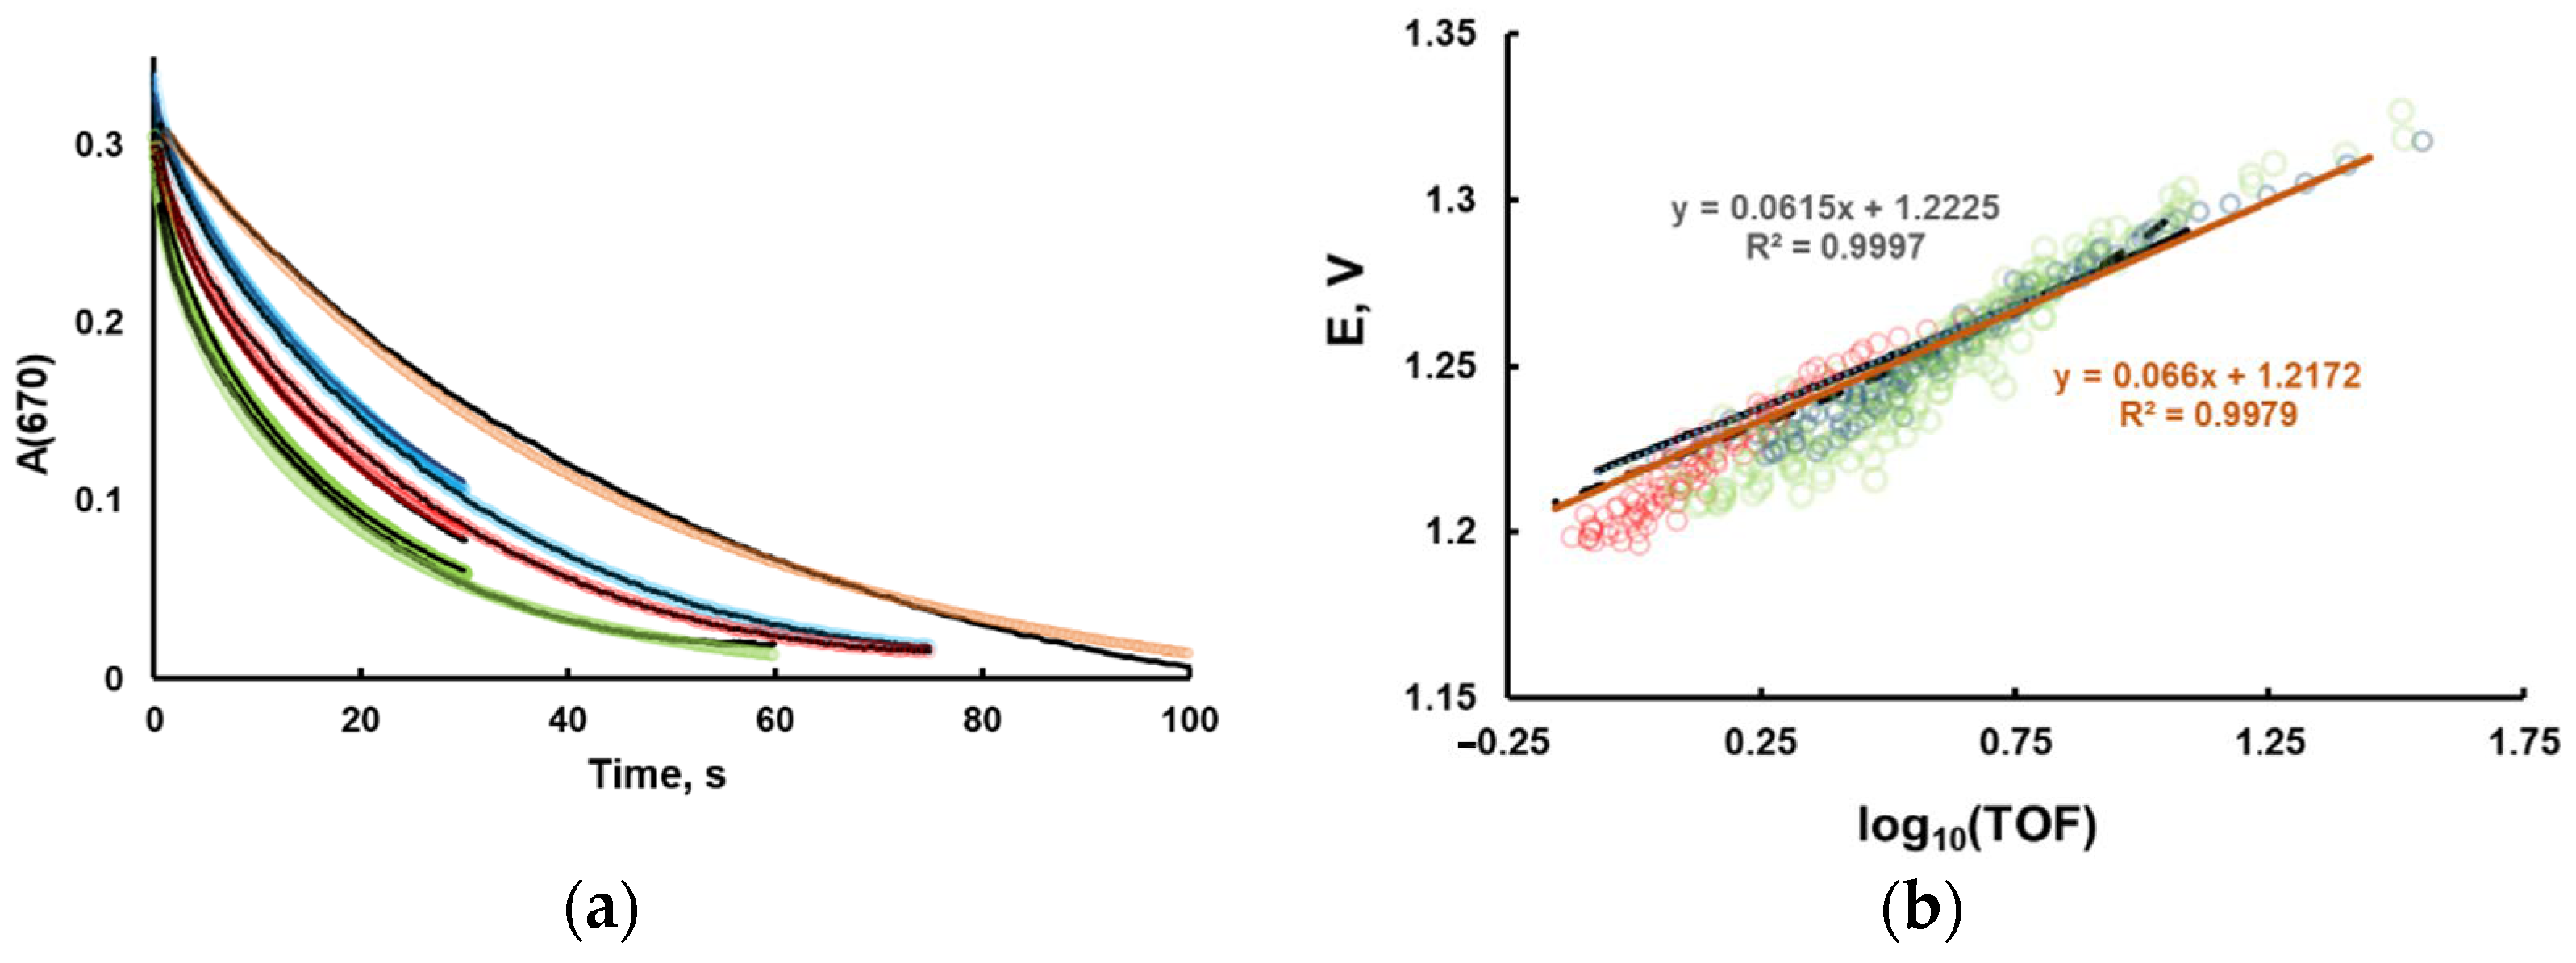
The typical kinetic curves and the corresponding Tafel-like plots are shown on
Figure 3. The initial rates are commonly used to study the reaction kinetics. In this work, we did not use this approach, due to two major problems. First, if Ru2 is not added in the reaction mixture, the rate quickly changes at very low conversions, creating uncertainty in the definition of the initial rate. Secondly, in the early stage, small experimental uncertainties in Ru2 concentration will lead to significant errors in [Ru3]/[Ru2] ratio.
The experimental log10(TOF) dependence on the electrochemical solution potential is weakly dependent on catalyst concentration and is not linear. In order to interpret the data, we build a kinetic model of homogeneous processes, performed the fitting of kinetics curves, and then simulated the Tafel plot. It appeared that the simulated Tafel plots are weakly dependent on parameters obtained from fitting. Therefore, we had to narrow the ranges of variable parameters using additional sets of experimental data. In this respect, differential pulse voltammetry could be helpful to estimate the oxidation potentials of Ru4POM.
2.5. Differential Pulse Voltammetry
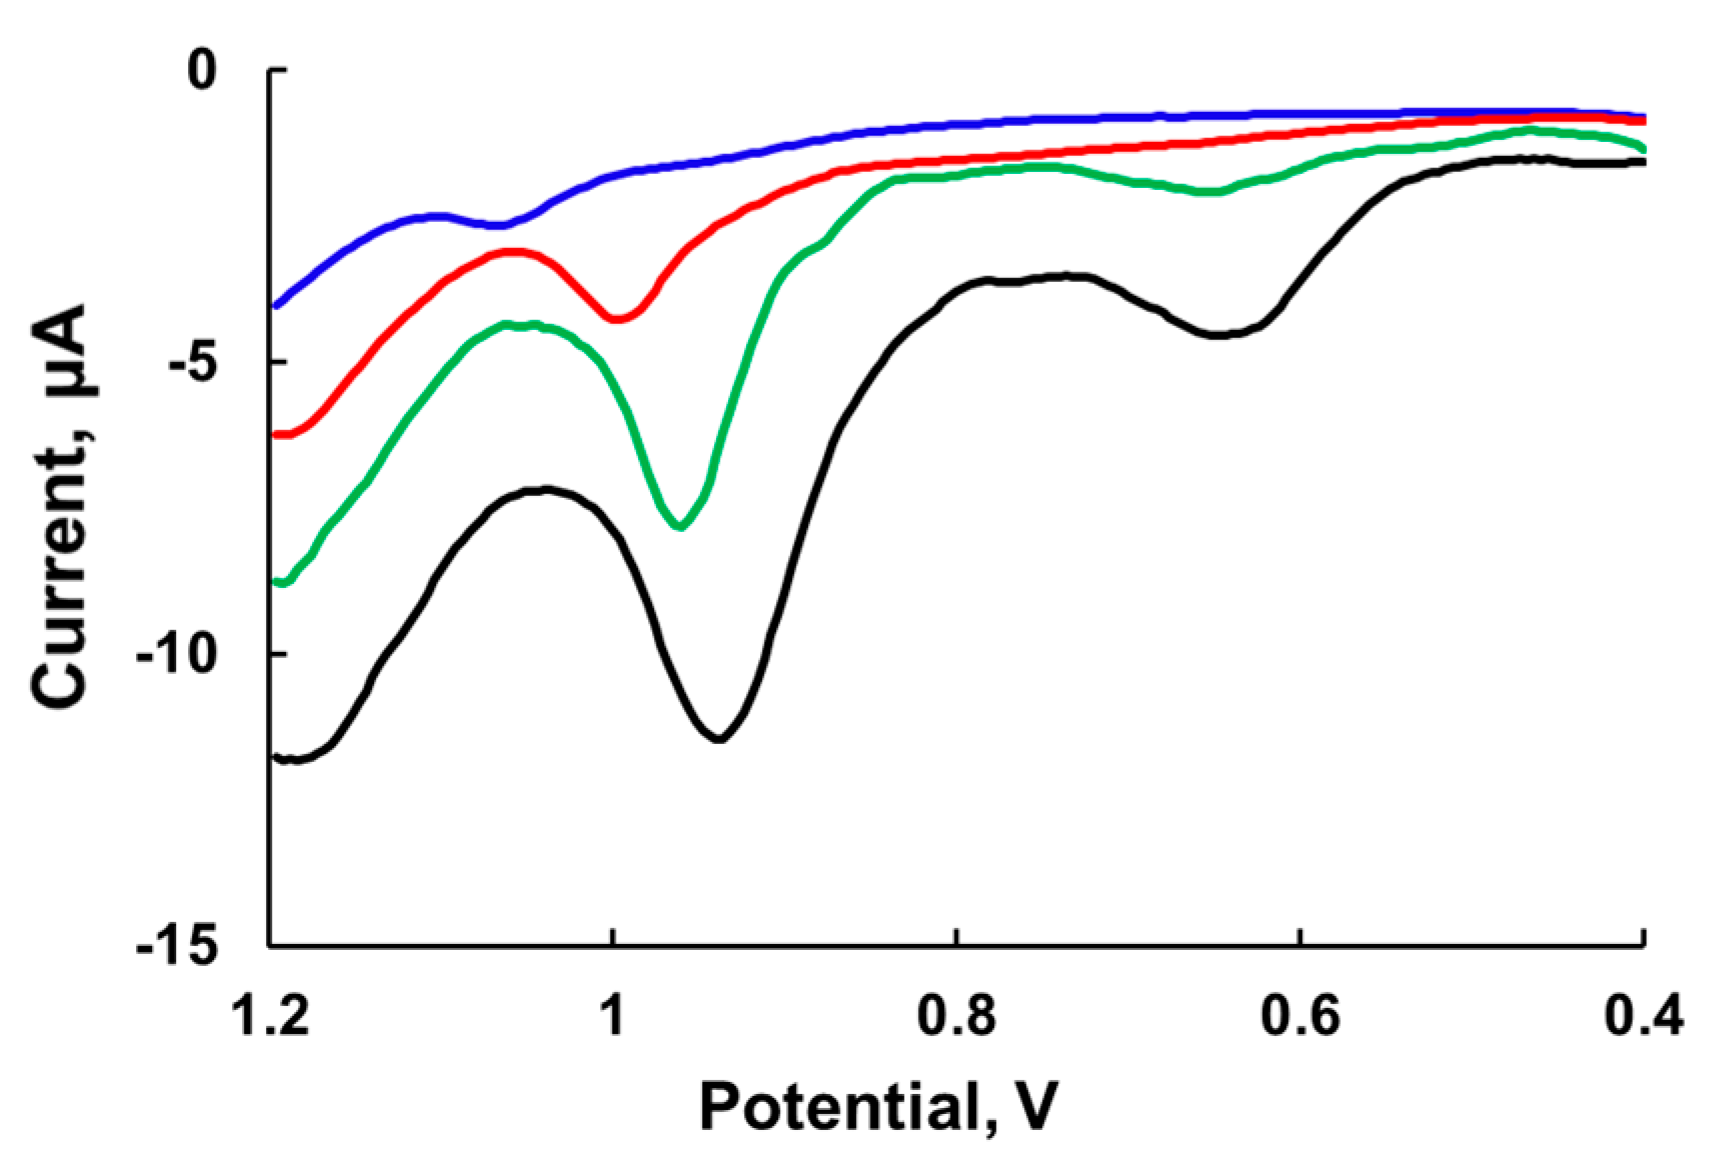
Differential pulse voltammetry (DPV) has two features: The effect of the charging current can be minimized and only faradaic current is extracted. This technique is well suited for electrochemical examination of
Ru4POM, which has a low rate constant of electron transfer to electrode; however, like other electroanalytic techniques, DPV requires the use of a high electrolyte concentrations. Indeed, the DPV peaks significantly increase with an increase in NaNO
3 electrolyte concentration in 80 mM sodium borate buffer at pH 8.0 and also shift to lower potentials (
Figure 4). The first peak becomes visible at 0.5 M NaNO
3 at ~0.65 V and shifts to a lower potential at 0.75 M NaNO
3. The width of the peak is around 90 mV, which is consistent with the one-electron transfer process (theoretical value 90 mV). The second peak has a width of about 45 mV and thus is very likely a two-electron process. At low ionic strength, the potential of the second peak is in the range of 1.0–1.1 V vs. Ag/AgCl.
We considered studying the kinetics of water oxidation at elevated concentrations of electrolyte in order to have the similar conditions to those used in electrochemical studies. However, the rate of water oxidation by Ru3 decreases with an increase in electrolyte concentration due to ionic strength effects, but the rate of Ru3 self-decomposition remains unchanged and becomes the predominant kinetic event. As such, the redox potentials measured by DPV could be extrapolated to low ionic strength to estimate the possible range of Ru4POM potentials.
2.6. Kinetic Model of Homogeneous Water Oxidation by [Ru(bpy)3]3+ Catalyzed by Ru4POM
Having information on the range of redox potentials of
Ru4POM and making minimal assumptions, the mechanism in Equations (16)–(22) is proposed:
The latter two reactions are added to describe the rate and stoichiometry of the Ru3 self-decomposition reaction in the absence of a catalyst. The values were determined from the fitting of five kinetic curves and assuming the rate law for Equation (21) as d[Ru3]/dt = −k
dd[Ru3][Ru
x]. It appeared that the overall reaction rate and O
2 yield are independent of k
dd, if k
dd > 1 × 10
5 M
−1 s
−1. We assumed that the very thermodynamically favorable reactions between two reactants with opposite charges proceed with the diffusion-controlled rate constants 1 × 10
10 M
−1s
−1. The optical density at 670 nm was calculated as A(670) = 420 × [Ru3] + 20 × [Ru2]). The results of the fitting are strongly dependent on dioxygen yield over the reaction time. Therefore, we used an additional set of experimental data. The dioxygen yield at 20 ± 2 s was measured to be 41, 60, and 85 µM in the presence of 2.5, 5.0, and 10 µM
Ru4POM, respectively. The calculated values of O
2 were the same as the experimental ones within a 5% range. For each concentration of
Ru4POM, two kinetic curves with different reaction times were used. The results of the fitting are given in
Figure 3 and the values of the parameters are given in Equations (16)–(22). The values of the variable parameters are highlighted in italics. The standard deviations are generated by the fitting software. As expected, the values of rate constants extracted by fitting have a large error range due to the low number of experimental curves used in fitting. The increase in the numbers of curves requires much longer computing time and results in only a slight decrease in accuracy of the extracted parameters. As the focus of this work is not the study of the explicit reaction mechanism, we did not fit a large set of experimental curves.
It is important to note that the Tafel-like plot cannot be used to confirm a specific kinetic model. However, it can provide additional information about the activity of a catalytic system.
2.7. Comparison of Different Homogeneous Catalytic Systems Using Tafel-Like Plots
First, we used the kinetic data on O
2 evolution in water oxidation by Ce(IV) under acidic conditions catalyzed by
Ru4POM [
15]. The experiment was performed in unbuffered 1.1 mM Ce(IV) solution. The estimated pH was 2.5. The standard redox potential of the Ce(IV)/Ce(III) couple was taken to be 1.5 V [
21,
22,
23]. The value of the overpotential was calculated as a difference between the Nernstian electrochemical solution potential (E = 1.5 + 0.059 × log([Ce(IV)]/[Ce(III)])) and the standard oxidation potential of water (E = 1.24 −0.059 × pH). We digitized the data in Figure S10 from Ref. [
15] and obtained the Tafel plot in
Figure 5 (blue circles). Based on our kinetic model, we simulated the dependence of TOF for O
2 formation as a function of overpotential at pH 8.0 (
Figure 5 red circles). As expected, both sets of data form almost a straight line with a slope of 67 mV per decade, which describes the catalytic activity of
Ru4POM over a wide range of conditions.
Finally, we collected stopped-flow data for another well-established homogeneous WOC, [Co
4(H
2O)
2(PW
9O
34)
2]
10– (
Co4POM) [
24], in 80 mM sodium borate buffer at pH 8.0 under conditions similar to those for
Ru4POM. The data were processed in the same way as described above, where the TOF for O
2 formation is equal to 1/4 of the TOF for Ru3 consumption, and plotted in
Figure 6. The
Co4POM is more active than
Ru4POM at overpotentials lower than 0.44 V, while it is lower at overpotentials higher than 0.44 V. The differences in Tafel slopes indicate that the rate-determining steps and/or the corresponding WOC reaction mechanism are different in these two systems.
In order to understand how the reaction parameters in Equations (15)–(21) affect the Tafel slope, we simulated the Tafel slope using Copasi and then observed the effects of changing each of the parameters within a range of 104–106 from the fitted values of Ru4POM. We have found that if the equilibrium of the reaction in Equation (19) is shifted to the left side (corresponding to the condition that the first oxidation potential is very high), then the Tafel slope becomes 30 mV/decade. This leads us to believe that the first oxidation potential of Co4POM is higher and the step depicted in Equation (19) becomes rate-determining instead.
Here, it is worth mentioning that experimental slopes in
Figure 3 are slightly higher than the theoretical 30 and 60 mV/decade. The TOF was also calculated based on the rate of Ru3 consumption, which includes the Ru3 self-decomposition side reaction that we deemed negligible for our analysis.
2.8. Tafel Slope for Heterogeneous Co4POM Complex
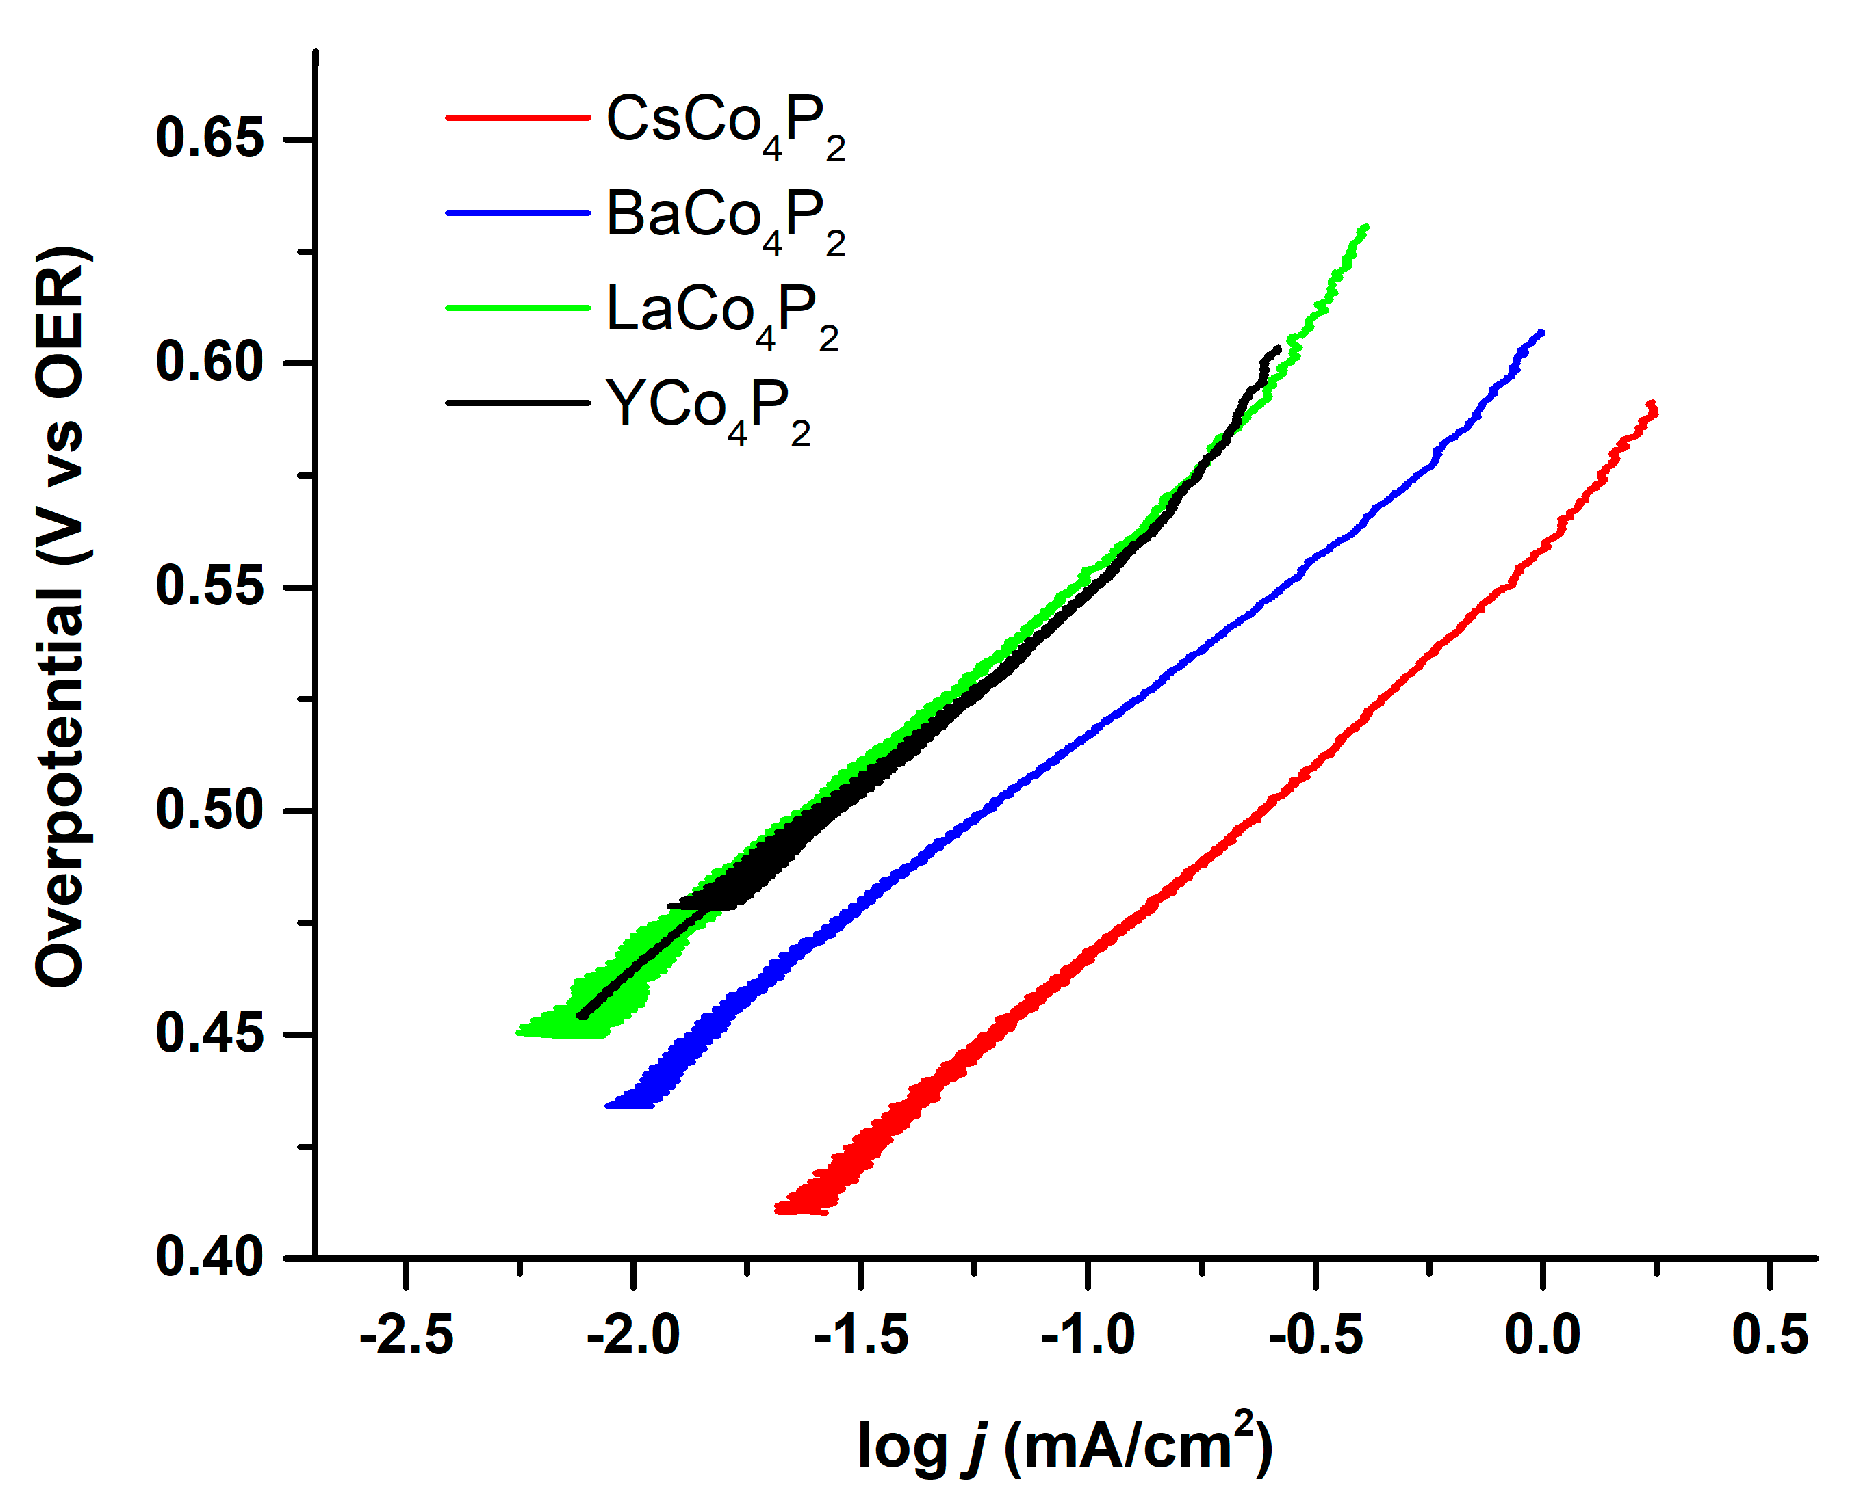
One of the reasons for performing a Tafel-like analysis on the homogeneous catalysts is to make comparisons to the analogous heterogeneous catalysts where accessible. Various different counter-cation variants of
Co4POM were heterogenized via a 5 wt% Nafion mixture and drop-casted onto a glassy carbon electrode in order to measure their Tafel behavior. These Tafel plots are shown in
Figure 6. They all exhibit similar Tafel slopes of about 80 mV/decade, which is greater than the 60 mV/decade observed for amorphous cobalt oxides. This suggests either a different WOC mechanism or different cobalt-centered active species are involved in with the two types of cobalt-containing WOCs. Nonetheless, it is likely that all these variants of
Co4POM have the same rate-determining step given their similar Tafel slopes.
As the current in these electrochemical experiments can be directly converted to TOF (four electrons per turnover), we can then compare the Tafel plots of the heterogenized
Co4POM to those of the homogeneous
Co4POM (
Figure 5). We note that these samples have similar electroactive surface areas as measured by capacitive current. The differences in exchange current density must therefore be a result of counterion effects. In this case, as they follow the expected trend of lower Lewis acidity, giving rise to higher catalytic currents, we can generally attribute the observed trend to their Lewis acid–base chemistry.
3. Materials and Methods
All common synthetic chemicals were reagent grade and purchased through commercial sources such as Sigma-Aldrich and VWR and used without further purification. Synthesis of
Ru4POM and
Co4POM was performed following exact literature procedures and recrystallized from aqueous solution [
14,
24]. Synthesis of the [Ru(bpy)
3]
3+ source, [Ru(bpy)
3](ClO
4)
3, was obtained by oxidizing [Ru(bpy)
3]Cl
2 using PbO
2 in 0.5M H
2SO
4 and precipitating by addition of HClO
4 [
25]. The product was then dried and stored in a refrigerator (4 °C).
Stopped-flow UV-Vis spectroscopy was performed on a Hi-Tech KinetAsyst Stopped Flow SF-61SX2 instrument equipped with a diode array detector operating between wavelengths ranging from 400 to 700 nm. One of the feeding syringes was filled with a solution of [Ru(bpy)
3]
3+ and the second with a freshly prepared buffer solution containing the catalyst. The consumption of [Ru(bpy)
3]
3+ was followed by a decrease in absorbance at 670 nm (ε
670 = 4.2 × 10
2 M
–1 cm
–1) with an optical path length of 10 mm. The data were acquired and treated using KinetAsyst
TM 3.0 software. Consequent analysis of the resulting kinetic data were performed using Excel and the Copasi software package [
20].
Electrochemical analyses were carried out using standard three-electrode measurements on a Pine Research Instrument WaveDriver 20 bipotentiostat and a BAS CV-50W potentiostat. All potentials were measured using glassy carbon electrodes against 1 M KCl Ag/AgCl reference electrodes (+0.235 V vs. NHE) purchased from CH Instruments. The counter electrodes were either a platinum wire or a graphite rod. Electrochemical cells were either cylindrical or conical electrochemical glassware or three-necked round-bottom flasks. All electrochemical measurements were done with the reference and working electrodes in proximity and clear from obstructions that would hinder contact with the reaction solution.
4. Conclusions
We describe a protocol to obtain Tafel-like plots for two different homogeneous catalytic systems based on kinetic and thermodynamic data. These plots visualize the activity of different catalysts under different solution overpotential conditions and allow for the ready comparison of their activity with each other, as well as with heterogeneous catalysts whose Tafel plots can be obtained using a traditional electrochemical setup. The resulting Tafel slopes indicate that the reaction mechanisms in water oxidation catalyzed by Ru4POM and Co4POM are likely different with distinct rate-determining steps.
This establishes a template with which molecularly discrete homogeneous WOCs can be directly compared to each other, regardless of the oxidant used, and addresses one of the biggest issues in WOC development: that of how to compare the catalytic reactivity of homogeneous and heterogeneous systems. In the future, we hope to expand upon this work and show further utilization of these protocols to elucidate the reaction mechanisms of other WOC systems.


