Article

Phosphate Coordination in a Water-Oxidizing Cobalt Oxide Electrocatalyst Revealed by X-ray Absorption Spectroscopy at the Phosphorus K-Edge

Department of Physics, Freie Universität Berlin, Arnimallee 14, 14167 Berlin, Germany
*
Author to whom correspondence should be addressed.
Catalysts 2023, 13(8), 1151; https://doi.org/10.3390/catal13081151
Submission received: 27 June 2023 / Revised: 15 July 2023 / Accepted: 17 July 2023 / Published: 25 July 2023
(This article belongs to the Special Issue Electrocatalytic Water Oxidation)

Abstract

:
In the research on water splitting at neutral pH, phosphorus-containing transition metal oxyhydroxides are often employed for catalyzing the oxygen evolution reaction (OER). We investigated a cobalt–phosphate catalyst (CoCat) representing this material class. We found that CoCat films prepared with potassium phosphate release phosphorus in phosphate-free electrolytes within hours, contrasting orders of magnitude’s faster K+ release. For P speciation and binding mode characterization, we performed technically challenging X-ray absorption spectroscopy experiments at the P K-edge and analyzed the resulting XANES and EXAFS spectra. The CoCat-internal phosphorus is present in the form of phosphate ions. Most phosphate species are likely linked to cobalt ions in Co–O–PO3 motifs, where the connecting oxygen could be a terminal or bridging ligand in Co-oxide fragments (P–Co distance, ~3.1 Å), with additional ionic bonds to K+ ions (P–K distance, ~3.3 Å). The phosphate coordination bond is stronger than the ionic K+-binding, explaining the strongly diverging ion release rates of phosphate and K+. Our results support a structural role of phosphate in the CoCat, with these ions binding at the margins of Co-oxide fragments, thereby limiting the long-range material ordering. The relations of catalyst-internal phosphate ions to cobalt’s redox-state changes, proton transfer, and catalytic activity are discussed.

Graphical Abstract

1. Introduction

Deciphering structure–function relationships is crucial for knowledge-guided catalyst design. In the present study, an amorphous cobalt oxide-based film material (CoCat), acting as one of the most active water oxidation catalysts at near-neutral pH [1,2], was selected as a model to study the atomic structure of phosphorus binding motifs in this electrocatalytic material. Although the crucial redox-active structural theme involving cobalt centers has been comprehensively investigated [1,3,4], the role of anions such as phosphate is insufficiently understood. Elemental analysis and energy-dispersive X-ray spectroscopy (EDS) analysis have verified the presence of phosphate ions in CoCat films [1], and earlier studies have provided insights into CoCat’s structural features [3,5,6,7,8,9,10], cobalt redox transitions [4,11], the role of redox-inert ions such as potassium [12,13,14], catalyst formation or transformation [1,14,15,16,17], and catalytic activities in response, e.g., to pH or electrolyte changes [2,14,18,19,20,21], as well as into further properties of CoCat materials [15,22,23,24,25,26,27,28,29,30,31,32]. Here, the structural motifs of phosphate binding in CoCat films were studied by technically demanding X-ray absorption spectroscopy (XAS) experiments at the P K-edge.
We recently investigated the effects of phosphate ions in the electrolyte on proton transport during water oxidation by the CoCat [18] without, however, addressing the structural properties of the catalyst-internal phosphorus species. We found that the current density at neutral pH is not limited by phosphate diffusion within the CoCat but rather relates to the depletion of KPi buffer bases close to the electrode surface. Consequently, proton transport was essentially mediated by external phosphate ions acting as a proton acceptor [18]. Therefore, enhancing the electrolyte buffer capacity is the most effective approach for improving the water oxidation rate [2]. Earlier studies showed that layered metal (hydr)oxide materials with phosphate ions instead of other buffers in the interlayer space reveal the smallest catalytic overpotential [33] without affecting the catalyst stability [34].
The characterization of phosphorus species has been carried out in natural and synthetic materials using a variety of methods [6,7,8,9,10,28,35,36,37,38], featuring, e.g., infrared and Raman spectroscopy [39,40], neutron scattering [41], 31P nuclear magnetic resonance spectroscopy [10,42,43,44], and X-ray spectroscopy techniques [9,36,45,46,47,48,49,50]. For the CoCat, the properties of the P species were studied by various approaches [6,7,8,9,10,18,35]. Inter alia, it was suggested that phosphate is incorporated in the material and located close to the cobalt ions [10,18], in which the nature of the buffering electrolyte (phosphate, Pi vs. borate, Bi) affects the domain size and medium-scale structure of the catalyst [8,35] and in which phosphate may connect to CoO6 sites via oxo bridges [6]. Earlier XAS studies revealed a pre-edge peak in the X-ray absorption near edge structure (XANES) spectrum, which was assigned to P-3p/O-2p/Co-3d orbital hybridization and interpreted as being due to phosphate binding to Co centers [9], similar to the situations in P–O–Fe(III)-containing minerals [36] or Fe(III)-oxyhydroxides with surface-adsorbed phosphate species [45,46]. Synthesis variations of CoPi catalysts showed that bulky pyrophosphate [37,51] or inter-connected phosphate groups might facilitate more disordered structures with diminished water oxidation overpotential, increased coordination stability, and enhanced electron transfer efficiency [34,37,52,53]. In electrodeposited amorphous CoCat films, phosphorus was found to be present as orthophosphate (PO43−) [7]. In related Ca-birnessite MnOX structures, P-rich surface layers were observed, and two possible P binding modes were suggested, with phosphate either directly bound to O-vacancies in the [MnO6] layers or phosphate associated with Ca2+ in the interlayer space forming Ca/PO4/H2O complexes [38]. Replacing phosphorus with arsenic in the CoCat facilitated (technically easier) XAS studies at the As K-edge [28] and revealed two possible binding motifs, with arsenate either bridging two Co centers at the margins of the CoCat layers or substituting cobalt ions within the oxide layers.
Direct atomic-level structural analysis of the P centers in the CoCat using extended X-ray absorption fine structure (EXAFS) analysis has not been reported so far, which is likely due to major technical difficulties and limitations hindering EXAFS measurements at the phosphorus K-edge. To overcome these limitations for increased insight into the phosphorus binding mode, motivated our present study. Also, for other P-containing materials, EXAFS data are very rare in the literature [47,54,55,56]. The relatively low K-edge energy of P at ~2145 eV, i.e., in the tender X-ray energy range, is not or not easily accessible at most XAS beamlines in synchrotron facilities because of, e.g., X-ray optics limitations and strong absorption of window and sample materials, which mandates well-adapted beamline layouts, measuring protocols, and sample preparation procedures. Indeed, typical low-energy (soft) XAS beamlines are often optimized for energies ≤1 keV for experiments, e.g., at 1st-row transition metal L-edges and light-element (C/N/O) K-edges, which requires high vacuum conditions and causes slow sample exchange, while high-energy (hard) XAS beamlines are often limited to energies ≥4 keV due to multiple windows in the beam and use of a cryostat with exchange gas for fast sample change. We have optimized the bending-magnet beamline, KMC-3, at the BESSY synchrotron (Helmholtz Center, Berlin) for experiments in the 2–15 keV energy range, facilitating tender energy XAS by the removal of most of the windows from the X-ray path, design of a custom thin-window (3 µm Mylar) ion chamber for incident energy (I0) detection and incident beam stabilization, and the use of a vacuum chamber (~2 mbar) sample environment facilitating rapid sample exchange at room temperature and maximizing the X-ray fluorescence count rate, as described in Section 3 and Supporting Information. This setup was employed for the collection of phosphorus XANES and EXAFS spectra of CoCat and various reference materials.
Here, we report that phosphate is released from the CoCat film only slowly, within hours, when exposed to a phosphate-free electrolyte, which is contrasted by the orders of magnitude faster release of potassium [57], implying phosphorus to be clearly more tightly bound to the CoCat material than potassium. We provide the first phosphorus XANES and EXAFS data of CoCat, which revealed the prevailing phosphorus coordination motifs. The phosphorus in CoCat is present predominantly or exclusively in the form of PO4 units (in the following, denoted as ‘phosphate’ irrespective of the protonation state and binding mode); the majority of the phosphate ions are coordinated to cobalt ions in the form of P–O–Co motifs, with additional ionic bonds to K+ ions. The relationships of cobalt redox changes, catalytic activity, and proton transfer with phosphate species in the CoCat are discussed.

2. Results and Discussion

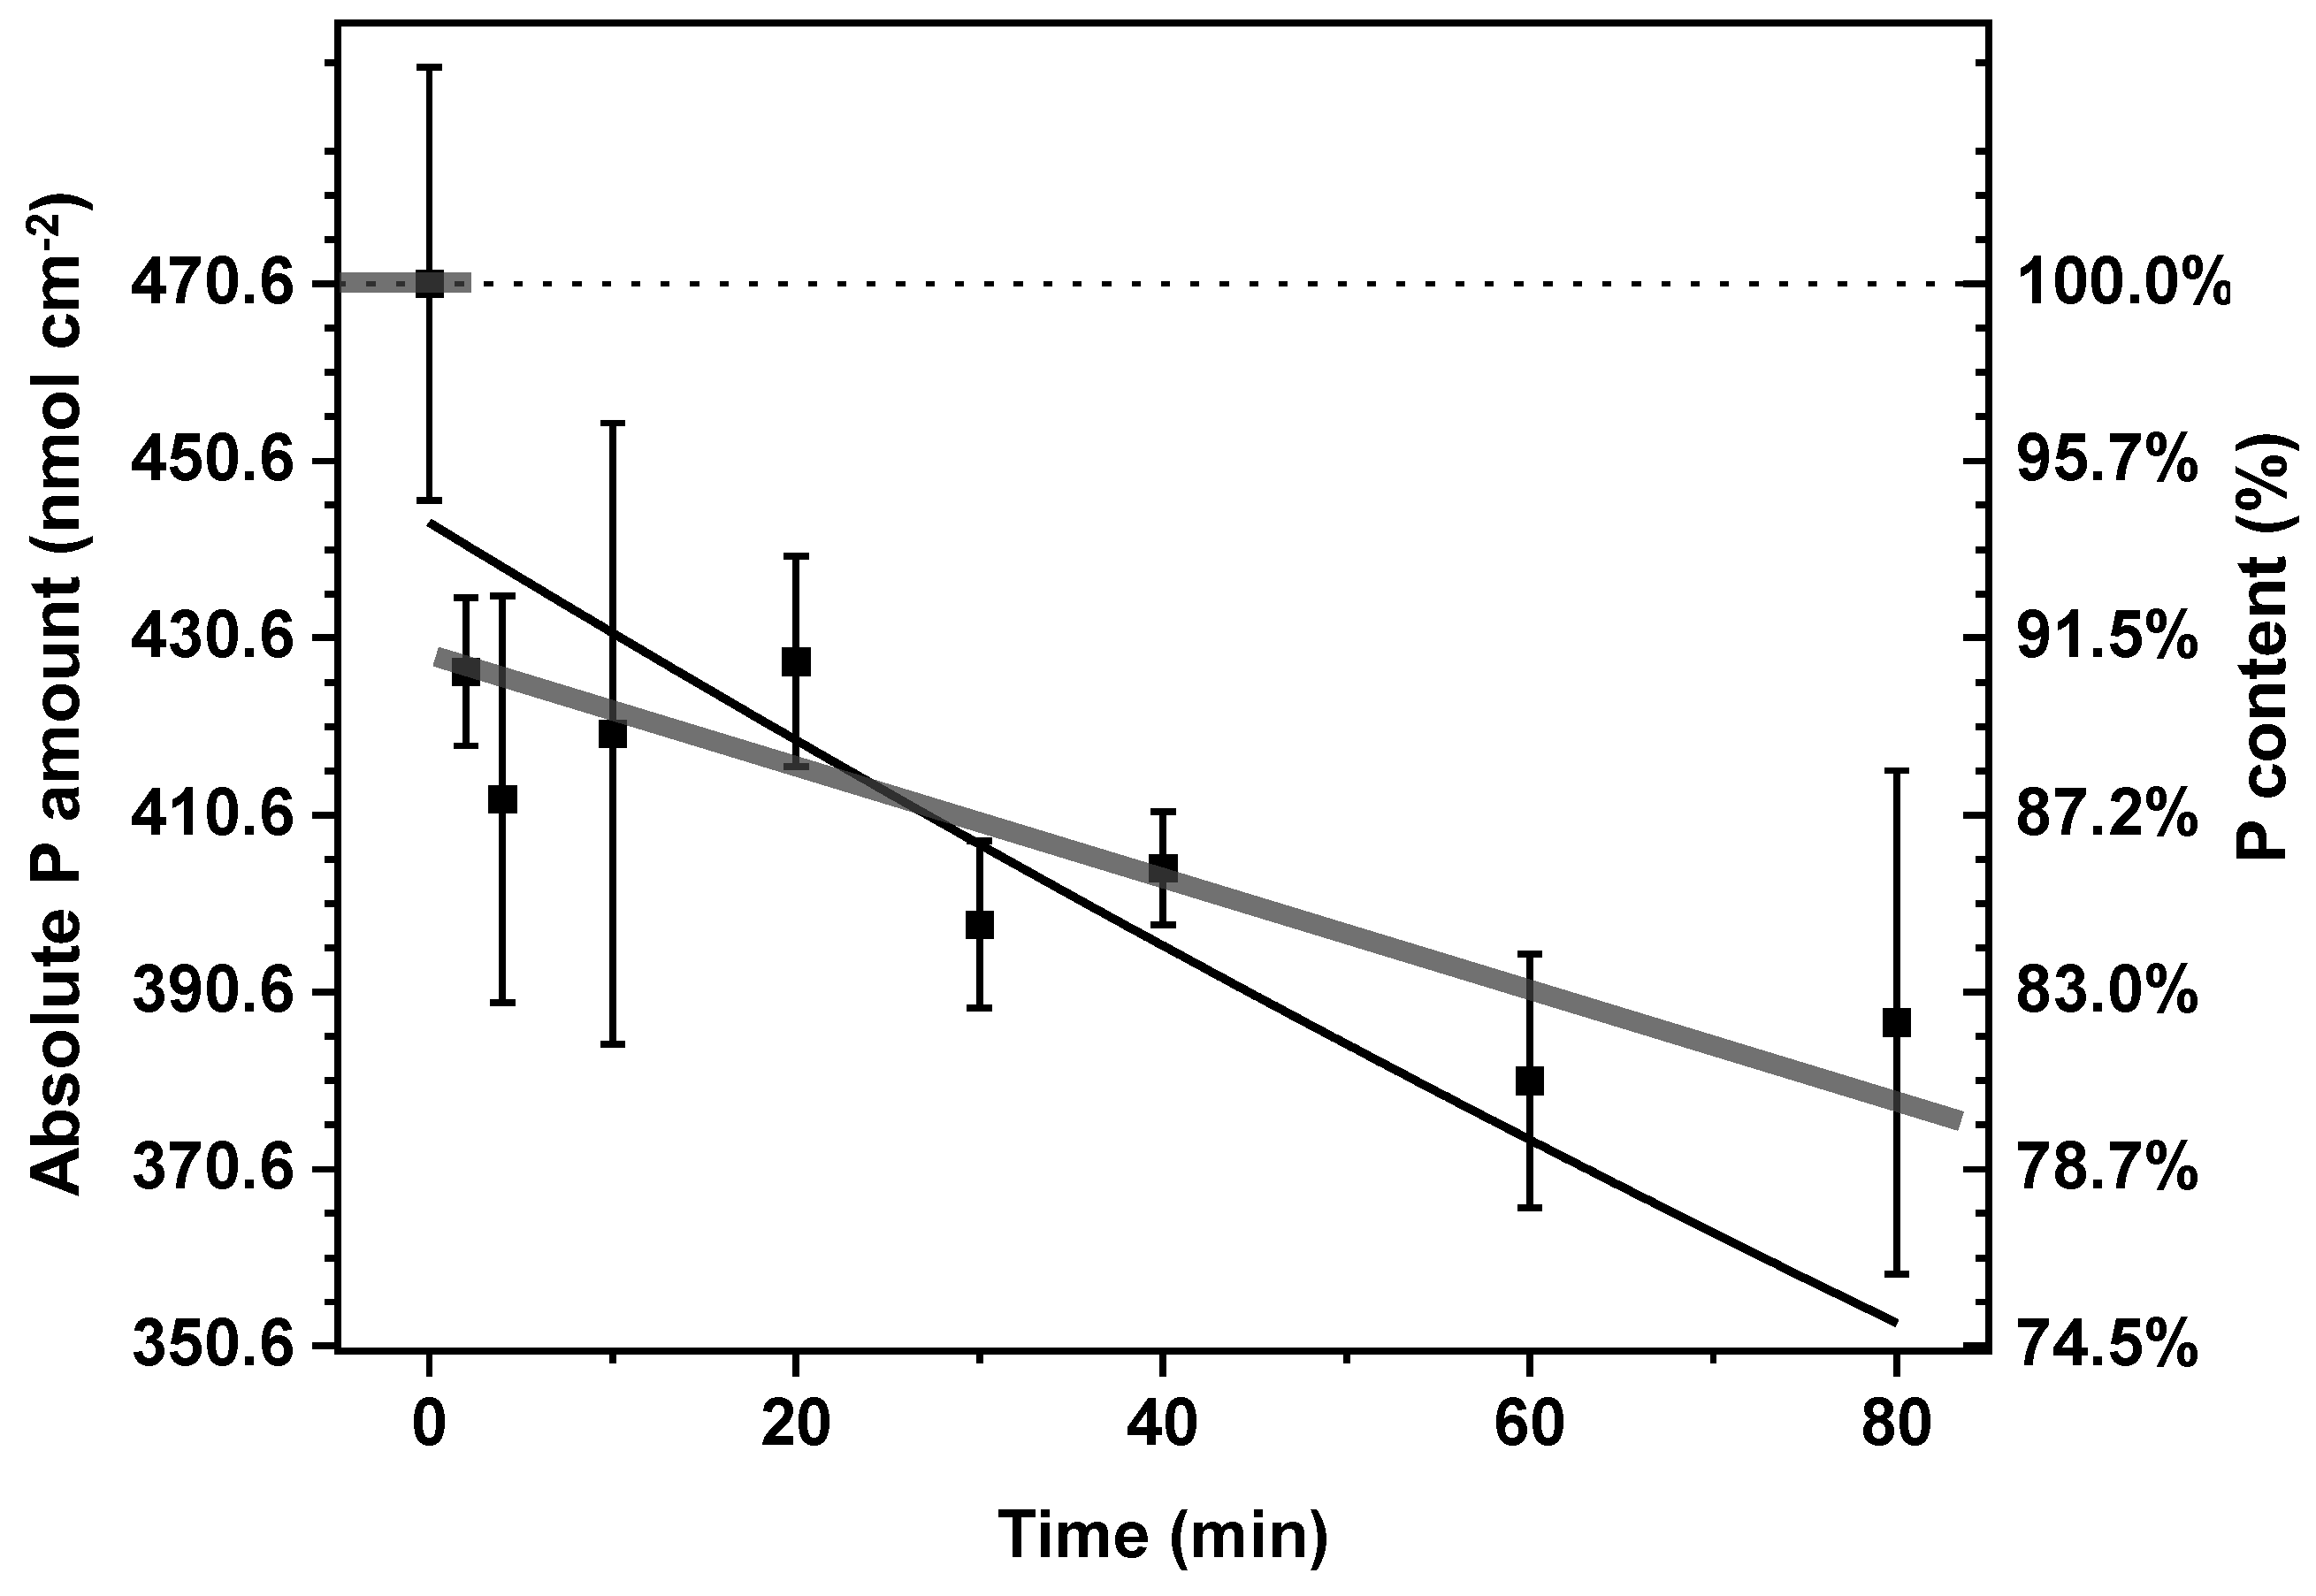
2.1. Slow Release of Phosphate from CoCat Film

To extend earlier studies on P exchange [5,16], the dynamic behavior of the phosphorus content in the CoCat catalyst operated in a Pi-free electrolyte was studied using the malachite green assay [58,59,60] for P quantification. The release rate of phosphate ions from the CoCat material was investigated by exposing the film to a phosphate-free electrolyte (500 mM KNO3, pH 7.0) at a working electrode potential of 1.0 VNHE (Figure 1 and Figures S1–S3). The potential was similar to the deposition potential where the film is long-term stable and cobalt is present mainly in the Co(III) oxidation state [4,31]. The P content in the whole CoCat film was determined after operation for various time periods, as described in Section 3.
The loss of phosphate from the CoCat film during exposure to a P-free electrolyte was surprisingly slow when compared to the potassium release, with a halftime of less than 10 s [57]. Within 80 min, the P content in the film decreased by about 18%; a single exponential fit revealed an initial decay rate of about 17% per hour (Figure 1). This slow P release is consistent with an earlier report [5]. The initial P content was about 470 nmol cm−2, which matches the reported Co:P stoichiometry of 2–3:1 for a Co content of ca. 1000 nmol cm−2 for a 100 mC cm−2 film [1,2]. Likewise, the P content of a thinner CoCat film (20 mC cm−2) revealed a similarly slow release rate (Figure S3). The slow P release from CoCat suggests that phosphate does not act as a mobile counterion, which compensates the surplus positive charges that appear in the film upon oxidation of the cobalt ions within hundreds of milliseconds [57]. Phosphate ions may rather serve a structural role, as detailed further below, and might also act as quasi-stationary proton-accepting buffer molecules that support channeling the charge-compensating H+ ions to the bulk electrolyte. Potassium was present in the electrodeposited CoCat films at roughly the same concentration as phosphorus, but the K release [57] was by 2–3 orders of magnitude faster than the P release, suggesting comparably tight P binding in the form of specific binding motifs, as scrutinized in the following.

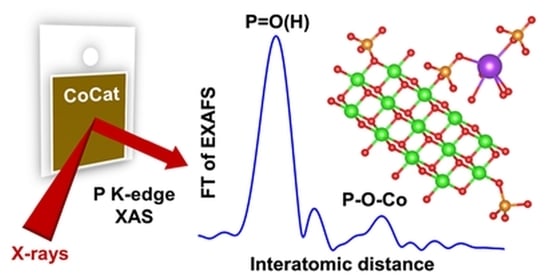
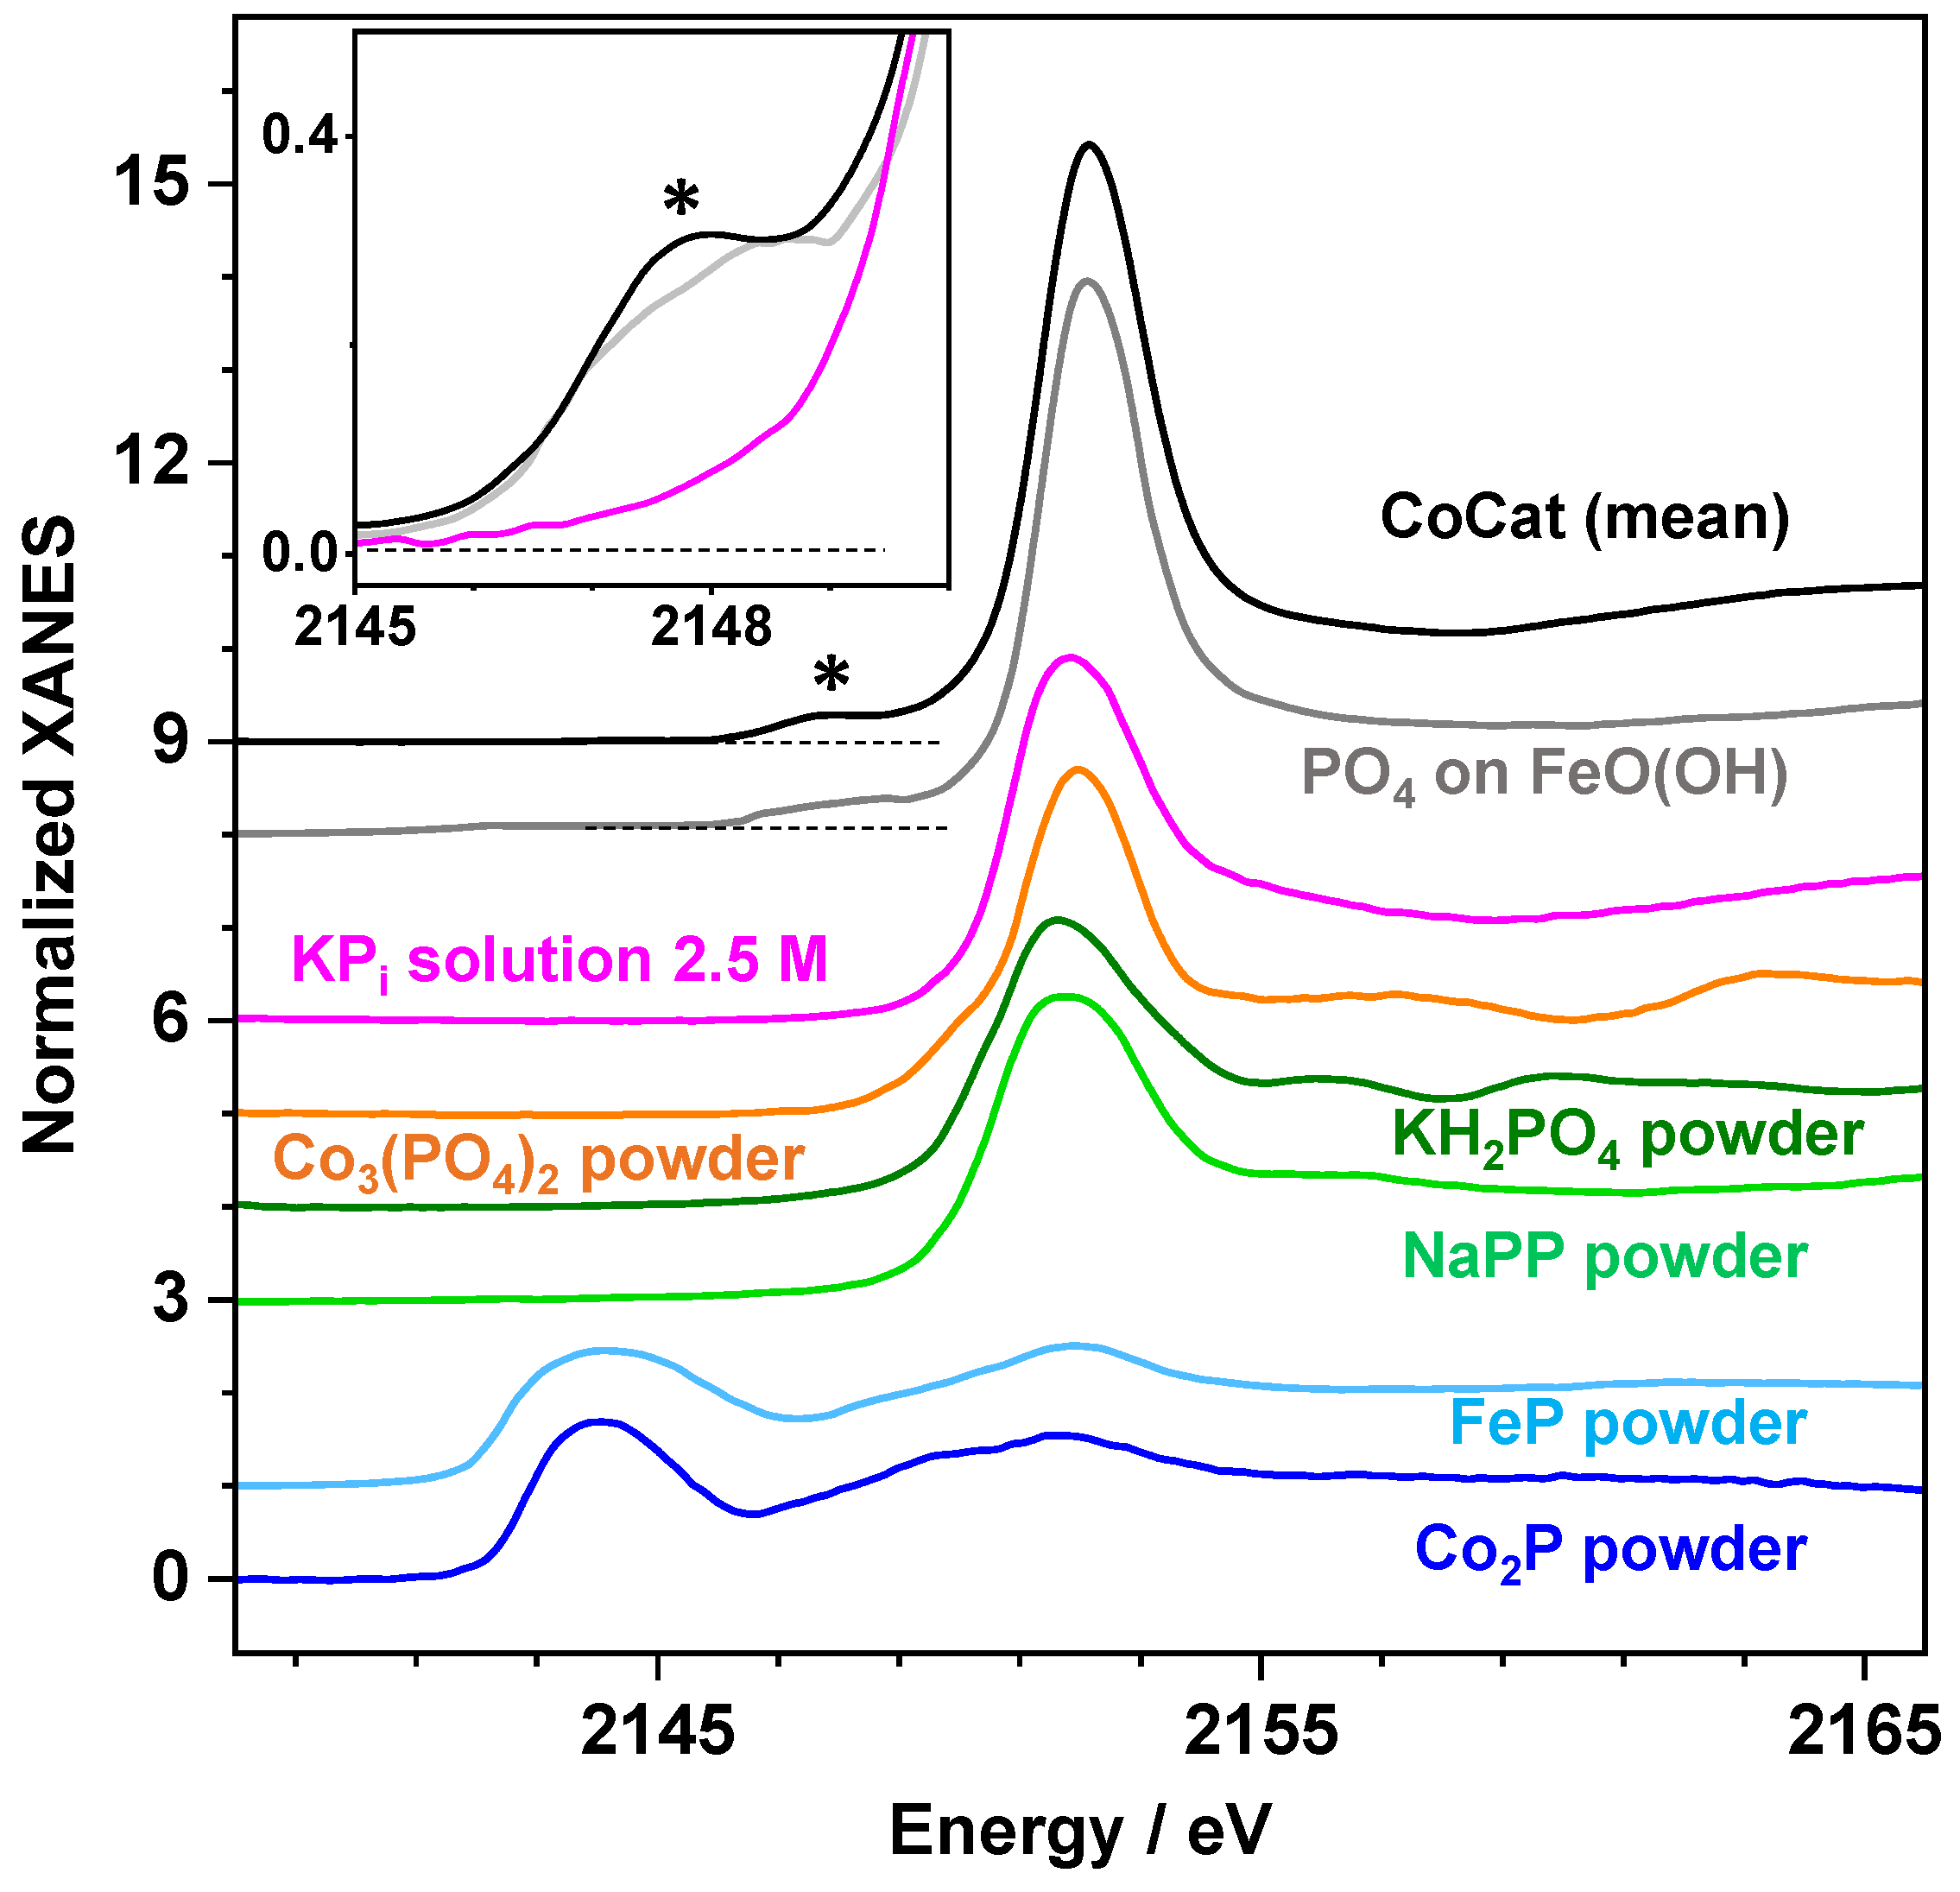
2.2. X-ray Absorption Spectroscopy at the P K-Edge Reveals Phosphate Binding Motifs

XAS spectra at the P K-edge were collected for CoCat films of increasing thickness at room temperature (Figure 2). The XANES spectra (Figure 2A) show overall similar shapes, except for a decrease of the K-edge white-line amplitude (~2152 eV) by ca. 10% when increasing the film thickness from 50 to 300 mC cm−2. This amplitude change presumably reflects a small influence of spectral flattening due to sample self-absorption at the large white-line peak. For a ca. 1 µm thick [2,30] CoCat film (150 mC cm−2) at a 2–3:1 Co:P stoichiometry, a transmission decrease by ca. 20% on the top of the P K-edge, but only by ≤5% in the EXAFS region was estimated, meaning that P self-absorption is relevant at the K-edge maximum, but negligible in the EXAFS region [50]. The EXAFS spectra (Figure 2B) indeed show practically identical shapes for all CoCat thicknesses, confirming the absence of significant self-absorption effects in the EXAFS spectra. Earlier studies of P K-edge amplitudes in phosphorus materials have revealed increasing protonation of the phosphate units (e.g., in KH2PO4 vs. K3PO4), a decreasing edge maximum in solids, but an increasing edge maximum in solution [54]. Our data show an edge decrease for a larger CoCat film thickness, which might reflect the increasing phosphorus species protonation in an environment deviating from the bulk solution, but the overall thickness-independent properties of the CoCat material argue against this conjecture. Overall, both the XANES and EXAFS spectra reveal very similar spectral shapes for all CoCat thicknesses, suggesting similar P coordination throughout the films.
The K-edge shapes were overall similar to the P centers in the phosphate sites in various solution or solid materials (Figure 3), indicating that phosphate species dominate the CoCat spectra. The pre-edge region of the XANES reveals two peak features at ~2144 eV and ~2148 eV (Figure 2A, inset). While the ~2144 eV peak decreases by ~50%, the ~2148 eV peak increases by ~10% for a 50–300 mC cm−2 CoCat thickness. The ~2144 eV peak is at an energy where metal–phosphorus compounds, such as Co2P, show their main K-edge peak (Figure 2 and Figure 3). We tested whether the used 3 µm Mylar foil cover of the sample holders contained phosphorus, as reported earlier [48]. A very small P K-edge could indeed be observed, which was at least 25-fold smaller than the K-edge of the thinnest CoCat film and, hence, practically negligible (Figure S4). However, this spectrum does not show a ~2144 eV peak feature, ruling out major spectral metal–phosphorus (M–P bond) contaminations in the setup. A further source of the latter species may be contaminations of the graphene substrate electrode and of the starting chemicals employed for CoCat electrodeposition and/or their formation during electrodeposition, but such that these contaminations affected thinner CoCat films more severely, thereby explaining the thickness dependence of the XANES feature. In any event, the relative amplitude of the ~2144 eV CoCat peak in comparison to that of, e.g., the Co2P, indicates that not more than ca. 1% of the P centers were related to metal–phosphorus species in the thinnest (50 mC cm−2) CoCat film, suggesting that such species presumably are irrelevant for the catalyst function, which involves redox changes of at least 40% of the cobalt ions [4]. We also observed, for increasing film thickness, a decrease in the detected fraction of metal-bound phosphorus species. This would be in line with spurious contaminations of components of the experimental setup, but it conflicts with a mechanistic role of metal–phosphorus bonding in OER catalysis because the catalytic activity per Co ion has been shown to be independent of the film thickness [2].
The ~2148 eV pre-edge peak shows a slight increase relative to the white-line amplitude for a thicker CoCat, likely explainable by the self-absorption effect (see above). Interestingly, such a distinct peak feature is practically absent in the XANES spectra of elemental phosphorus (with P–P bonds), materials with metal–phosphorus bonds (Co2P, FeP), phosphate-containing solids, like sodium-pyrophosphate (NaPP), KH2PO4, or Co2(PO4)2, and of phosphate in an aqueous KPi solution (Figure 3) or related compounds [9,61,62,63,64,65,66]. However, similar peak features were observed for samples where the phosphate ions are associated with metal (hydr)oxide species, for example, in crude soil or mud samples, in PO4 on FeO(OH), and for phosphate in hydrated metal–phosphorus materials, such as strengite (FePO4·2H2O) (Figure 3) [48,54,61,67]. Accordingly, the presence of the ~2148 eV peak feature in the CoCat spectra suggests that phosphate species are more specifically connected to Co ions in the spaces between the cobalt oxide layers of the CoCat film, which was studied by EXAFS analysis in the following.
EXAFS simulations revealed P-site fine structures in the reference compounds and CoCat (Table 1, Tables S1 and S2). The metrical parameters (phosphorus-ligand bond lengths and P-metal distances) for the reference compounds were in reasonable agreement with the crystal structures (Table S1, Figures S4 and S6). In particular, the typical phosphorus bonds to terminal (hydr)oxo groups, P=O(H), of 1.50–1.60 Å in all the phosphate-containing materials, the Co/Fe–P bonds of 2.2–2.3 Å in the respective metal–phosphorus compounds, as well as the distances to the metal, oxygen, phosphorus, or potassium atoms in the 2nd coordination sphere at 3–4 Å to P were discernable. For the phosphate (PO4)-containing compounds, the inclusion of a multiple-scattering contribution (P–O–O paths), with an O-O distance of ca. 2.45 Å close to the expected value (2.40–2.55 Å), improved the fit quality. In some cases (NaPP and KH2PO4), 2nd-sphere distances (P–Na, P–O) came out too short, which might be due to, e.g., small contributions from phosphorus in the Mylar foil cover of the samples [48,68] (Figure S5), 2nd-sphere multiple-scattering contributions, noise effects on the spectra, or might even stem from a systematic monochromator-scan background contribution. In any event, multiple-scattering and other EXAFS contributions of ≤2.9 Å did not significantly affect the EXAFS fit results for the longer, i.e., P–O–Co/K, distances (≥3.1 Å).
A mean EXAFS spectrum for the CoCat with maximal signal-to-noise ratio was derived by averaging the four spectra of Figure 2 for 50–300 mC cm−2 depositions (Figure 3 and Figure 4). The Fourier-transformed EXAFS of the CoCat reveals a dominant primary peak due to P=O(H) bonds, like the phosphate-containing references and smaller peak features at larger distances, in particular around 2.8 Å (Figure 4). The latter FT peak, which was essentially absent for the PO4 ions in dilute solution [47,54], is discernable in most of our reference spectra and prominent in solid metal–phosphorus materials where it reflects P–O–Co/Fe distances [54,69] (Figure S4). This finding suggests contributions to the EXAFS of interactions of phosphate ions with Co centers in the CoCat film. A stepwise refinement of the EXAFS fit approach for the CoCat spectrum was carried out (Table S2). The following observations were made: (a) four P=O(H) distances of ~1.55 Å, with a distance spread of ~0.05 Å, according to the Debye–Waller factor, readily account for the main FT peak of the CoCat (Figure 4, Table 1 and Table S2), but the global fit quality for the neglect of longer distances was insufficient (RF of ca. 24%). (b) The moderate improvement of the fit quality (RF decrease by ca. 6%) was obtained by the addition of a multiple-scattering path (P-O-O, see above) [47,54]. (c) The inclusion of a P–Co distance of ~3.1 Å, with a coordination number of ca. 0.6, decreased the RF by another 4% and accounted mostly for the FT peak around 2.8 Å of the reduced distance. (d) Direct P–Co bonds with a very small coordination number (≤0.1 per Co ion) but typical bond lengths (~2.25 Å) were discernable but hardly increased the fit quality. Evidence of a minor contribution from P–Co species was also found in the XANES, where the CoCat thickness dependence suggests that it stems from impurities, as discussed above. We consider the N-value of ~0.1 as an upper limit since there are contributions to the EXAFS that overlap in this distance range. (e) A P–K distance (~3.3 Å), with a coordination number close to 1, slightly increased N(P–Co) and finally yielded a satisfactory fit quality (RF of ca. 12%). The P–K distance is similar to the K–P distance recently reported by us from potassium K-edge XAS data of CoCat [57].
We interpret these results as follows: The four oxygen atoms at phosphorus suggest that essentially all P species in the CoCat are phosphate ions. The distance spread in the 1st sphere is compatible with the presence of P=O and P–OH bonds. (The difference in bond lengths between the P=O and P–OH bonds is too minor to be reliably resolvable so that we cannot distinguish different protonation states of the phosphate ion (HxPO4−(3−x), x = 1–3). Similarly, phosphate binding to a metal ion (M–O–P bond) is not expected to change the P–O distance significantly.)
The upper limit of direct P–Co bonds in the CoCat may be estimated as ca. 0.1 per Co ion. This value exceeds the N-value (<0.05) derived from the low-energy XANES peak amplitude, presumably due to overlapping EXAFS contributions of various origins in the 2–2.9 Å distance range (see above). This finding supports the notion that P–Co bonds are very rare in CoCat films and likely irrelevant for the catalyst function. We attribute the P–Co distances to contaminations of the (starting) materials or the experimental environment rather than to the functional CoCat itself.
The presence of 2nd-sphere P–Co (3.1 Å) (and P–K, ~3.3 Å) distances was further suggested by calculation of the CoCat FT-EXAFS spectrum starting at larger k-values, which emphasized the metal distances due to their EXAFS oscillation maxima at larger k-values compared to light scatterers (see Figure 4 and Figure S4). The detection of up to one P–K distance per P center was similar to the K–P distances from our earlier potassium EXAFS data and suggests that phosphate ions are located mostly together with potassium ions in the interlayer spaces of the CoCat-layered (hydr)oxide. P–Co distances in the CoCat of 3.1–3.2 Å are similar to the P–Co distances in the CoPO4 (3.15 Å) and Co3(PO4)2 (3.25 Å) but longer than the shortest P–Co distances (2.9 Å, 2.7 Å) in these materials (Table S1, Figure S6). Because the latter distances are indicative of phosphate sites tightly integrated into the crystalline metal–phosphate lattice, we assume that the phosphorus in the CoCat is not embedded within the ordered layers of the edge-sharing CoO6 octahedra of the (Co(µ3-O)2 type), which are the principal structural constituents of the CoCat material. The phosphate ions are rather connected to Co ions at the margins of the oxide layer fragments, protruding into the space between the oxide layers, which are furthermore filled by water molecules and K+ ions (see Figure 5). Error contour plots for the correlation of coordination numbers for P–Co vs. P–K distances, P–Co coordination numbers vs. P–Co distances, and P–Co coordination numbers vs. P–Co Debye–Waller factors (2σ2) suggested a range of ~3.1 Å P–Co distances of 0.5–1.4 per P center (Figure S8). The estimated P–Co coordination number implied that at least half of the phosphate ions were coordinated to a cobalt site in the CoCat. The latter result agrees with the pronounced pre-edge feature of the CoCat, which is similar, for example, to PO4 on (layered) iron-(hydr)oxide or other hydrated metal–phosphorus compounds.
The phosphorus binding motifs resolved in the present work differ from the main arsenic binding motifs that were earlier determined when replacing phosphate with arsenate ions in the CoCat [28]. It was found that As–CoCat likely has two distinct binding modes, with arsenate binding at (i) terminal sites at the margins of oxide fragments, likely in a bidentate mode bridging between two cobalt ions, and (ii) arsenic substituting cobalt positions within the lattice of edge-sharing CoO6 octahedra, with an unusual AsO6 coordination. The second binding mode was not detected in the P–CoCat. The relatively long P–Co distances of ≥3.1 Å indicate that phosphate is not positioned within the Co-oxide lattice. We conclude that in the P–CoCat, phosphate is mostly involved in cobalt binding in the terminal or even metal-bridging positions (Figure 5), thereby accounting for the slow phosphate release from the CoCat film.

3. Materials and Methods

3.1. Malachite Green Assay for P Quantification

CoCat films of 20/100 mC cm−2 thickness were deposited at 1.05 VNHE on ITO glass as a substrate, using a protocol described earlier [1,12]. Following iR compensation (85%) and three cyclic voltammetry (CV) sweeps (0.25–1.25 V vs. NHE), each freshly deposited film was operated at a fixed potential of 1.0 VNHE for increasing time periods (0, 2, 4, 10, 20, 30, 40, 60, and 80 min) in an aqueous electrolyte with KNO3 (500 mM) at a pH of 7.0. Two independent samples were used for each time period and, thereafter, rinsed with Mill-Q water, dried at ambient temperature, and removed from the ITO electrode for the malachite green assay. For thin CoCat films (20 mC cm−2), each sample was dissolved in 3 mL of 0.1 M of sulfuric acid (H2SO4), and to 800 µL of the sample solution 200 µL of the working reagent (freshly prepared by mixing the two reagents in a proportion of 100:1, according to the P assay kit, MAK307 from Sigma-Aldrich, Schnelldorf, Germany) was added. Due to the phosphate detection range of the malachite green phosphate assay kit (0.02–40 µM), a dilution procedure is required for thicker CoCat films (100 mC cm−2), meaning that each sample was dissolved in 3 mL H2SO4 (0.5 M), followed by pipetting the digestion solution (0.5 mL) into 2 mL pure water, leading to the same sulfuric acid concentration (0.1 M) as in the thin film digestion process. After dilution, the same procedure as for thin films was carried out, namely, pipetting 800 μL of the diluted sample solution into a cuvette, followed by adding 200 μL of the working reagent. The ratio (% v/v) of the sample solution to working reagent was 4:1.
The P content was quantified by UV-vis spectrometry based on the optical absorption at 620 nm, where the chemical complex [69], formed upon the reaction of phosphate with the malachite green agent, has a prominent absorption feature (90,000 M−1cm−1). The absorption spectrum (500–750 nm) was measured after 30 min of incubation (Figures S1 and S3), and the absorption at 620 nm was determined. According to our earlier reported calibration curve [18], the P concentration in each assay solution was determined, and the P contents in the respective CoCat samples were calculated accordingly (i.e., considering the dilution process).

3.2. XAS Absorption Spectroscopy (XAS)

CoCat films were electrodeposited on conductive graphene sheets (Graphene Supermarket, Ronkonkoma, NY, U.S.A.) using integral charges of 50–300 mC cm−2, corresponding to an estimated CoCat film thickness of ca. 0.3–2.1 µm [2]. Dry film samples (without a cover foil) held at low air pressure (ca. 2 mbar) at RT were studied by XAS. Solid phosphorus reference materials (FeP) were provided by M. Driess and colleagues (Technical University Berlin, Germany) or commercially available (Co2P, 99.9%, Alfa Aesar, Kandel, Germany; KH2PO4, ≥99%, Carl Roth GmbH, Karlsruhe, Roth, Germany; Co3(PO4), 98%, abcr, Karlsruhe, Germany; sodium pyrophosphate dibasic (NaPP), ≥99%, Merck, Darmstadt, Germany) and were diluted, ca. 1:20, by grounding with solid BN. Thin layers of powders were homogeneously dispersed on Kapton tape and covered by 3 µm Mylar foil on the side facing the X-ray beam. Solutions of P compounds (~100 µL) were filled into sample holders covered by 3 µm Mylar foil on the side facing the X-ray beam.
XAS at the P K-edge was carried out at the beamline KMC-3 at the BESSY synchrotron (Helmholtz-Center Berlin, Germany) using a custom ion chamber (ca. 7 cm pathlength) with 3 µm Mylar foil windows (40 mbar of air pressure) for incident beam intensity (I0) monitoring, a 13-element SD-detector with thin Be windows for fluorescence collection, and samples held at room temperature (~22 °C) in a vacuum chamber (ca. 2 mbar of air) flanged to the ion chamber and the detector. Samples were positioned in the beam by motorized sample-rod/chamber stages. The incident beam intensity was kept constant using MOSTAB regulation, and the monochromator was detuned to ~30% of its maximal throughput at ~2100 eV for efficient harmonics suppression (as monitored by MCA control). XAS spectra to k = 12.2 Å−1 were collected in a continuous monochromator scan mode (~15 min per scan), and up to 8 scans each on a fresh sample spot were averaged for statistics improvement. The spot size on the sample was ca. 4.0 × 1.5 mm2, as set by a focusing mirror and slits. XAS data were processed using standard procedures (deadtime correction, background subtraction, and normalization), and EXAFS simulations were conducted with FEFF7 [70] phase functions (based on a model structure including PO4 sites and respective 2nd-sphere distances) and in-house software. An E0 value of 2146 eV was used in the EXAFS data processing, which was refined to 2157 ± 2 eV in the simulations. The S02 value was 0.75 (as chosen to yield 4 P-O bonds in the phosphate-containing compounds). The EXAFS fit error, RF (%) [71], was calculated in a reduced distance range of 1–3 Å.

4. Conclusions

The technically demanding collection of phosphorus K-edge XANES and EXAFS spectra was achieved using a dedicated setup for tender energy spectroscopy at the beamline KMC-3 of the BESSY synchrotron (Berlin). The atomic-level structural properties of phosphorus species were characterized in layered cobalt-(hydr)oxide (CoCat) films for electrocatalytic water oxidation, serving as a model system for the important class of phosphorous-containing catalyst materials for OER in the neutral pH regime. Quantification of the P content in the CoCat films initially deposited in a KPi electrolyte and then exposed for increasing periods to a phosphate-free electrolyte revealed a slow release of phosphate ions with only partial release after more than four hours, as opposed to the rapid and quantitative release of potassium ions within less than one minute, indicating at least two orders of magnitude tighter binding of phosphate in the CoCat film. Accordingly, the phosphate was barely mobile and could hardly serve as a charge-compensating anion, which rapidly entered the film upon creation of positive charges due to the oxidation of up to ca. 65% of the cobalt ions in the Co(II)→Co(III) and Co(III)→Co(IV) redox transitions [4], in line with earlier reports [18,57]. Also, because potassium ions cannot effectively balance the cobalt charges, as reported in our recent potassium K-edge XAS study on the CoCat [57], the compensation of positive charges upon Co oxidation most likely proceeds exclusively by the release of protons from the CoCat film.
Our XAS experiments were carried out using a quasi-in situ, freeze-quench approach, involving catalyst electrodes exposed to electrochemical potentials before freezing and then rapidly frozen by immersion of the complete catalyst–electrode assembly in liquid nitrogen. The catalyst structure for rapidly frozen CoCat samples has been shown to be virtually identical to that of in situ material studied under operando conditions [4]. In the here reported experiments, significant CoCat modification by amorphization or formation of new phases upon exposure to catalytic potentials can be ruled out because prior to freezing at low temperature (20 K) and the XAS experiments, the CoCat electrodeposition had been performed at +1.05 VNHE in 100 KPi (at pH 7). Thus, the CoCat films of the XAS experiments had been fully equilibrated at positive electrode potentials. Therefore, the electrodeposited CoCat material was already completely amorphous; additional surface amorphization upon operation at catalytic potentials is neither expected nor was it observed [4].
Analysis of the XANES and EXAFS of the CoCat in comparison to various reference compounds with known structures revealed that phosphorus is present in the CoCat almost exclusively in the form of phosphate (PO4) species. A very minor quantity (likely <1%) of P atoms, which are directly coordinated to the metal centers (i.e., P–Co bonds) in the CoCat, was suggested by the respective XAS spectral features. Whether such species stem from impurities in the starting materials (more likely) and/or are formed during the electrodeposition procedure (less likely) remains unclear at present. The film thickness dependence of the corresponding pre-edge feature (a larger feature for the thinner films) supports spurious contaminations as their source. Also, the much larger amount (~25%) of cobalt centers that underwent a Co(III)→Co(IV) redox transition upon entering the catalytic potential regime [4] argues against the option that a sub-percent fraction of P–Co sites are relevant for OER in the CoCat. In conclusion, direct P–Co bonding most likely is structurally and mechanistically irrelevant for the CoCat material.
Both (i) a prominent pre-edge XANES feature, similar to the spectra of phosphate species in metal-(hydr)oxides and (ii) an EXAFS-detectable phosphorus–cobalt distance of ~3.1 Å per P center suggest that a major fraction of phosphate ions was connected to the cobalt centers, either in a terminal position (motif a in Figure 5) or in cobalt-bridging positions (motif b). Both motifs have been suggested earlier for phosphate [9,72] and the phosphate analog arsenate [28] in layered metal-(hydr)oxides (Figure S6, Table S1, motifs a–d in Figure 5). We believe that the EXAFS data are compatible with the majority of phosphate ions being bound to Co ions at the edges of Co-oxide fragments. This phosphate binding mode readily explains that the phosphate release from the CoCat is clearly slower than the release of K+ ions [57] because the latter ions are bound by comparably weak ionic interactions only. There may be a population of internal catalyst phosphate ions that are less tightly bound and, therefore, more rapidly released than the majority fraction (about 10%; see Figure 1), and such phosphate ions may be bound only by weak ionic interactions with K+ ions.
In summary, a charge-compensating role of phosphate ions in the redox transitions of the CoCat material can be excluded [18,57]. Our results support a predominantly structural role, where phosphates bind at the margins of Co-oxide fragments, probably limiting their size, as previously proposed [5,9,12,28]. Recently, we have characterized the pivotal role of HxPO43− ions in electrolyte proton transport [18]. The role of phosphate ions in proton conduction within the CoCat material is neither supported nor excluded by the present study. Further investigations on the mechanism of electron and proton transport within CoCat material are needed to clarify this point.

Supplementary Materials

The following supporting information can be downloaded at: https://www.mdpi.com/article/10.3390/catal13081151/s1; Figures S1 and S2: UV-vis absorption spectra of malachite green/CoCat assay solutions for 100 and 20 mC cm−2 CoCat sample series; Figure S3: Absolute phosphate contents in CoCat films (20 mC cm−2); Figure S4: Phosphorus K-edge EXAFS spectra of CoCat and reference compounds; Table S1: EXAFS simulation parameters for reference compounds; Figure S5: Comparison of non-normalized X-ray fluorescence spectra at the P K-edge for CoCat (50 mC cm−2), a BN-diluted Co2P powder sample, and an empty Mylar foil (3 µm)-covered sample holder; Figure S6: Crystal structures of phosphorus compounds; Table S2: refinement of P-EXAFS simulation parameters for CoCat; Figure S7: Cobalt EXAFS of CoCat (40 mC cm−2) operated at 1.1 VNHE; Table S3: EXAFS simulation parameters for Co-EXAFS of CoCat; Figure S8: P-EXAFS fit error contour plots; References [18,71,73,74,75,76,77,78,79,80,81,82,83] are cited in the supplementary materials.

Author Contributions

Conceptualization, S.L. and H.D.; methodology, S.L., M.H. and H.D.; investigation, S.L., S.F., P.B., S.M. and M.H.; software, P.B.; writing—original draft preparation, S.L.; writing—review and editing, S.L., M.H. and H.D; visualization, S.L. and M.H.; supervision, H.D. All authors have read and agreed to the published version of the manuscript.

Funding

This research was funded by the Deutsche Forschungsgemeinschaft (DFG, German Research Council) under Germany’s Excellence Strategy—EXC 2008/1–390540038—UniSysCat and the German Federal Ministry of Education and Research (BMBF project “Live-XAS”, Grant 05K22KE1).

Data Availability Statement

Data can be made available to readers upon reasonable request.

Acknowledgments

The authors thank Helmholtz-Zentrum Berlin (HZB) for beamtime allocation at the KMC-3 beamline of the BESSY synchrotron (Berlin) and Ivo Zizak, as well as the further HZB staff for their technical support. S.L. gratefully acknowledges support by the China Scholarship Council (CSC) in the form of a doctoral fellowship. S.F. is grateful to the Einstein Foundation of Berlin for a Ph.D. fellowship.

Conflicts of Interest

The authors declare no conflict of interest.

References

  1. Kanan, M.W.; Nocera, D.G. In situ formation of an oxygen-evolving catalyst in neutral water containing phosphate and Co2+. Science 2008, 321, 1072–1075. [Google Scholar] [CrossRef] [PubMed] [Green Version]
  2. Klingan, K.; Ringleb, F.; Zaharieva, I.; Heidkamp, J.; Chernev, P.; Gonzalez-Flores, D.; Risch, M.; Fischer, A.; Dau, H. Water oxidation by amorphous cobalt-based oxides: Volume activity and proton transfer to electrolyte bases. ChemSusChem 2014, 7, 1301–1310. [Google Scholar] [CrossRef] [PubMed]
  3. Kanan, M.W.; Yano, J.; Surendranath, Y.; Dinca, M.; Yachandra, V.K.; Nocera, D.G. Structure and valency of a cobalt-phosphate water oxidation catalyst determined by in situ X-ray spectroscopy. J. Am. Chem. Soc. 2010, 132, 13692–13701. [Google Scholar] [CrossRef] [PubMed]
  4. Risch, M.; Ringleb, F.; Kohlhoff, M.; Bogdanoff, P.; Chernev, P.; Zaharieva, I.; Dau, H. Water oxidation by amorphous cobalt-based oxides: In situ tracking of redox transitions and mode of catalysis. Energy Environ. Sci. 2015, 8, 661–674. [Google Scholar] [CrossRef] [Green Version]
  5. Ullman, A.M.; Brodsky, C.N.; Li, N.; Zheng, S.-l.; Nocera, D.G. Probing Edge Site Reactivity of Oxidic Cobalt Water Oxidation Catalysts. J. Am. Chem. Soc. 2016, 138, 4229–4236. [Google Scholar] [CrossRef] [PubMed]
  6. Du, P.W.; Kokhan, O.; Chapman, K.W.; Chupas, P.J.; Tiede, D.M. Elucidating the domain structure of the cobalt oxide water splitting catalyst by X-ray pair distribution function analysis. J. Am. Chem. Soc. 2012, 134, 11096–11099. [Google Scholar] [CrossRef]
  7. Eom, C.J.; Suntivich, J. In Situ Stimulated Raman Spectroscopy Reveals the Phosphate Network in the Amorphous Cobalt Oxide Catalyst and Its Role in the Catalyst Formation. J. Phys. Chem. C 2019, 123, 29284–29290. [Google Scholar] [CrossRef]
  8. Liu, Y.; Nocera, D.G. Spectroscopic Studies of Nanoparticulate Thin Films of a Cobalt-Based Oxygen Evolution Catalyst. J. Phys. Chem. C 2014, 118, 17060–17066. [Google Scholar] [CrossRef]
  9. Yoshida, M.; Mineo, T.; Mitsutomi, Y.; Yamamoto, F.; Kurosu, H.; Takakusagi, S.; Asakura, K.; Kondoh, H. Structural Relationship between CoO6 Cluster and Phosphate Species in a Cobalt–Phosphate Water Oxidation Catalyst Investigated by Co and P K-edge XAFS. Chem. Lett. 2015, 45, 277–279. [Google Scholar] [CrossRef]
  10. Harley, S.J.; Mason, H.E.; McAlpin, J.G.; Britt, R.D.; Casey, W.H. A 31P NMR investigation of the CoPi water-oxidation catalyst. Chem. Eur. J. 2012, 18, 10476–10479. [Google Scholar] [CrossRef]
  11. Pasquini, C.; D’Amario, L.; Zaharieva, I.; Dau, H. Operando Raman spectroscopy tracks oxidation-state changes in an amorphous Co oxide material for electrocatalysis of the oxygen evolution reaction. J. Chem. Phys. 2020, 152, 194202. [Google Scholar] [CrossRef]
  12. Risch, M.; Klingan, K.; Ringleb, F.; Chernev, P.; Zaharieva, I.; Fischer, A.; Dau, H. Water oxidation by electrodeposited cobalt oxides-role of anions and redox-inert cations in structure and function of the amorphous catalyst. ChemSusChem 2012, 5, 542–549. [Google Scholar] [CrossRef]
  13. Gerken, J.B.; Landis, E.C.; Hamers, R.J.; Stahl, S.S. Fluoride-modulated cobalt catalysts for electrochemical oxidation of water under non-alkaline conditions. ChemSusChem 2010, 3, 1176–1179. [Google Scholar] [CrossRef]
  14. Surendranath, Y.; Dinca, M.; Nocera, D.G. Electrolyte-dependent electrosynthesis and activity of cobalt-based water oxidation catalysts. J. Am. Chem. Soc. 2009, 131, 2615–2620. [Google Scholar] [CrossRef]
  15. Kanan, M.W.; Surendranath, Y.; Nocera, D.G. Cobalt–phosphate oxygen-evolving compound. Chem. Soc. Rev. 2009, 38, 109–114. [Google Scholar] [CrossRef]
  16. Lutterman, D.A.; Surendranath, Y.; Nocera, D.G. A self-healing oxygen-evolving catalyst. J. Am. Chem. Soc. 2009, 131, 3838–3839. [Google Scholar] [CrossRef]
  17. Surendranath, Y.; Lutterman, D.A.; Liu, Y.; Nocera, D.G. Nucleation, growth, and repair of a cobalt-based oxygen evolving catalyst. J. Am. Chem. Soc. 2012, 134, 6326–6336. [Google Scholar] [CrossRef]
  18. Liu, S.; Zaharieva, I.; D’Amario, L.; Mebs, S.; Kubella, P.; Yang, F.; Beyer, P.; Haumann, M.; Dau, H. Electrocatalytic Water Oxidation at Neutral pH–Deciphering the Rate Constraints for an Amorphous Cobalt-Phosphate Catalyst System. Adv. Energy Mater. 2022, 12, 2202914. [Google Scholar] [CrossRef]
  19. Pasquini, C.; Zaharieva, I.; Gonzalez-Flores, D.; Chernev, P.; Mohammadi, M.R.; Guidoni, L.; Smith, R.D.L.; Dau, H. H/D Isotope effects reveal factors controlling catalytic activity in Co-based oxides for water oxidation. J. Am. Chem. Soc. 2019, 141, 2938–2948. [Google Scholar] [CrossRef]
  20. Esswein, A.J.; Surendranath, Y.; Reece, S.Y.; Nocera, D.G. Highly active cobalt phosphate and borate based oxygen evolving catalysts operating in neutral and natural waters. Energy Environ. Sci. 2011, 4, 499–504. [Google Scholar] [CrossRef]
  21. Gerken, J.B.; McAlpin, J.G.; Chen, J.Y.C.; Rigsby, M.L.; Casey, W.H.; Britt, R.D.; Stahl, S.S. Electrochemical water oxidation with cobalt-based electrocatalysts from pH 0–14: The thermodynamic basis for catalyst structure, stability, and activity. J. Am. Chem. Soc. 2011, 133, 14431–14442. [Google Scholar] [CrossRef] [PubMed]
  22. Bediako, D.K.; Ullman, A.M.; Nocera, D.G. Catalytic Oxygen Evolution by Cobalt Oxido Thin Films. In Solar Energy for Fuels. Topics in Current Chemistry; Tüysüz, H., Chan, C.K., Eds.; Springer: Cham, Switzerland, 2016; Volume 371, pp. 173–213. [Google Scholar] [CrossRef]
  23. Khosravi, M.; Mohammadi, M.R. Trends and Progress in Application of Cobalt-Based Materials in Catalytic, Electrocatalytic, Photocatalytic, and Photoelectrocatalytic Water Splitting. Photosynth. Res. 2022, 154, 329–352. [Google Scholar] [CrossRef] [PubMed]
  24. Bediako, D.K.; Costentin, C.; Jones, E.C.; Nocera, D.G.; Savéant, J.-M. Proton–Electron Transport and Transfer in Electrocatalytic Films. Application to a Cobalt-Based O2-Evolution Catalyst. J. Am. Chem. Soc. 2013, 135, 10492–10502. [Google Scholar] [CrossRef]
  25. Farrow, C.L.; Bediako, D.K.; Surendranath, Y.; Nocera, D.G.; Billinge, S.J.L. Intermediate-Range Structure of Self-Assembled Cobalt-Based Oxygen-Evolving Catalyst. J. Am. Chem. Soc. 2013, 135, 6403–6406. [Google Scholar] [CrossRef]
  26. Surendranath, Y.; Kanan, M.W.; Nocera, D.G. Mechanistic studies of the oxygen evolution reaction by a cobalt-phosphate catalyst at neutral pH. J. Am. Chem. Soc. 2010, 132, 16501–16509. [Google Scholar] [CrossRef]
  27. Brodsky, C.N.; Bediako, D.K.; Shi, C.; Keane, T.P.; Costentin, C.; Billinge, S.J.L.; Nocera, D.G. Proton–Electron Conductivity in Thin Films of a Cobalt–Oxygen Evolving Catalyst. ACS Appl. Mater. Interfaces 2019, 2, 3–12. [Google Scholar] [CrossRef]
  28. Villalobos, J.; Gonzalez-Flores, D.; Klingan, K.; Chernev, P.; Kubella, P.; Urcuyo, R.; Pasquini, C.; Mohammadi, M.R.; Smith, R.D.L.; Montero, M.L.; et al. Structural and functional role of anions in electrochemical water oxidation probed by arsenate incorporation into cobalt-oxide materials. Phys. Chem. Chem. Phys. 2019, 21, 12485–12493. [Google Scholar] [CrossRef]
  29. Gonzalez-Flores, D.; Sanchez, I.; Zaharieva, I.; Klingan, K.; Heidkamp, J.; Chernev, P.; Menezes, P.W.; Driess, M.; Dau, H.; Montero, M.L. Heterogeneous water oxidation: Surface activity versus amorphization activation in cobalt phosphate catalysts. Angew. Chem. Int. Ed. 2015, 54, 2472–2476. [Google Scholar] [CrossRef]
  30. Costentin, C.; Porter, T.R.; Saveant, J.-M. Conduction and Reactivity in Heterogeneous-Molecular Catalysis: New Insights in Water Oxidation Catalysis by Phosphate Cobalt Oxide Films. J. Am. Chem. Soc. 2016, 138, 5615–5622. [Google Scholar] [CrossRef]
  31. Mohammadi, M.R.; Loos, S.; Chernev, P.; Pasquini, C.; Zaharieva, I.; Gonzalez-Flores, D.; Kubella, P.; Klingan, K.; Smith, R.D.L.; Dau, H. Exploring the Limits of Self-Repair in Cobalt Oxide Films for Electrocatalytic Water Oxidation. ACS Catal. 2020, 10, 7990–7999. [Google Scholar] [CrossRef]
  32. Costentin, C. Proton-Coupled Electron Transfer Catalyst: Heterogeneous Catalysis. Application to an Oxygen Evolution Catalyst. ACS Catal. 2020, 10, 7958–7967. [Google Scholar] [CrossRef]
  33. Hunter, B.M.; Hieringer, W.; Winkler, J.R.; Gray, H.B.; Müller, A.M. Effect of interlayer anions on [NiFe]-LDH nanosheet water oxidation activity. Energy Environ. Sci. 2016, 9, 1734–1743. [Google Scholar] [CrossRef] [Green Version]
  34. Yang, C.; Laberty-Robert, C.; Batuk, D.; Cibin, G.; Chadwick, A.V.; Pimenta, V.; Yin, W.; Zhang, L.; Tarascon, J.-M.; Grimaud, A. Phosphate Ion Functionalization of Perovskite Surfaces for Enhanced Oxygen Evolution Reaction. J. Phys. Chem. Lett. 2017, 8, 3466–3472. [Google Scholar] [CrossRef]
  35. Kwon, G.; Jang, H.; Lee, J.-S.; Mane, A.; Mandia, D.J.; Soltau, S.R.; Utschig, L.M.; Martinson, A.B.F.; Tiede, D.M.; Kim, H.; et al. Resolution of Electronic and Structural Factors Underlying Oxygen-Evolving Performance in Amorphous Cobalt Oxide Catalysts. J. Am. Chem. Soc. 2018, 140, 10710–10720. [Google Scholar] [CrossRef]
  36. Prietzel, J.; Klysubun, W. Phosphorus K -edge XANES spectroscopy has probably often underestimated iron oxyhydroxide-bound P in soils. J. Synchrotron Radiat. 2018, 25, 1736–1744. [Google Scholar] [CrossRef]
  37. Kim, H.; Park, J.; Park, I.; Jin, K.; Jerng, S.E.; Kim, S.H.; Nam, K.T.; Kang, K. Coordination tuning of cobalt phosphates towards efficient water oxidation catalyst. Nat. Commun. 2015, 6, 8253. [Google Scholar] [CrossRef] [Green Version]
  38. Ronge, E.; Ohms, J.; Roddatis, V.; Jones, T.; Sulzmann, F.; Knop-Gericke, A.; Schlögl, R.; Kurz, P.; Jooss, C.; Skorupska, K. Operation of calcium-birnessite water-oxidation anodes: Interactions of the catalyst with phosphate buffer anions. Sustain. Energy Fuels 2021, 5, 5535–5547. [Google Scholar] [CrossRef]
  39. Rudolph, W.W.; Irmer, G. Raman and infrared spectroscopic investigations on aqueous alkali metal phosphate solutions and density functional theory calculations of phosphate-water clusters. Appl. Spectrosc. 2007, 61, 1312–1327. [Google Scholar] [CrossRef]
  40. Preston, C.M.; Adams, W.A. A laser Raman spectroscopic study of aqueous orthophosphate salts. J. Phys. Chem. C 1979, 83, 814–821. [Google Scholar] [CrossRef]
  41. Mason, P.E.; Cruickshank, J.M.; Neilson, G.W.; Buchanan, P. Neutron scattering studies on the hydration of phosphate ions in aqueous solutions of K3PO4, K2HPO4 and KH2PO4. Phys. Chem. Chem. Phys. 2003, 5, 4686–4690. [Google Scholar] [CrossRef]
  42. Cade-Menun, B.; Liu, C.W. Solution Phosphorus-31 Nuclear Magnetic Resonance Spectroscopy of Soils from 2005 to 2013: A Review of Sample Preparation and Experimental Parameters. Soil Sci. Soc. Am. J. 2014, 78, 19–37. [Google Scholar] [CrossRef] [Green Version]
  43. Kruse, J.; Abraham, M.; Amelung, W.; Baum, C.; Bol, R.; Kühn, O.; Lewandowski, H.; Niederberger, J.; Oelmann, Y.; Rüger, C.; et al. Innovative methods in soil phosphorus research: A review. J. Plant. Nutr. Soil Sci. 2015, 178, 43–88. [Google Scholar] [CrossRef] [PubMed] [Green Version]
  44. Kizewski, F.; Liu, Y.T.; Morris, A.; Hesterberg, D. Spectroscopic Approaches for Phosphorus Speciation in Soils and Other Environmental Systems. J. Environ. Qual. 2011, 40, 751–766. [Google Scholar] [CrossRef] [PubMed]
  45. Khare, N.; Hesterberg, D.; Martin, J.D. XANES investigation of phosphate sorption in single and binary systems of iron and aluminum oxide minerals. Environ. Sci. Technol. 2005, 39, 2152–2160. [Google Scholar] [CrossRef]
  46. Khare, N.; Hesterberg, D.; Beauchemin, S.; Wang, S.-L. XANES Determination of Adsorbed Phosphate Distribution between Ferrihydrite and Boehmite in Mixtures. Soil Sci. Soc. Am. J. 2004, 68, 460–469. [Google Scholar] [CrossRef]
  47. Persson, I.; Trublet, M.; Klysubun, W. Structure Determination of Phosphoric Acid and Phosphate Ions in Aqueous Solution Using EXAFS Spectroscopy and Large Angle X-ray Scattering. J. Phys. Chem. A 2018, 122, 7413–7420. [Google Scholar] [CrossRef]
  48. Beauchemin, S.; Hesterberg, D.; Chou, J.; Beauchemin, M.; Simard, R.R.; Sayers, D.E. Speciation of Phosphorus in Phosphorus-Enriched Agricultural Soils Using X-Ray Absorption Near-Edge Structure Spectroscopy and Chemical Fractionation. J. Environ. Qual. 2003, 32, 1809–1819. [Google Scholar] [CrossRef]
  49. Luo, L.; Ma, Y.; Sanders, R.L.; Xu, C.; Li, J.; Myneni, S.C.B. Phosphorus speciation and transformation in long-term fertilized soil: Evidence from chemical fractionation and P K-edge XANES spectroscopy. Nutr. Cycl. Agroecosyst. 2017, 107, 215–226. [Google Scholar] [CrossRef]
  50. Hurtarte, L.C.C.; Souza-Filho, L.F.; Santos, W.O.; Vergütz, L.; Prietzel, J.; Hesterberg, D. Optimization of data processing minimizes impact of self-absorption on phosphorus speciation results by P K-edge XANES. Soil Systems 2019, 3, 61. [Google Scholar] [CrossRef] [Green Version]
  51. Menezes, P.W.; Panda, C.; Walter, C.; Schwarze, M.; Driess, M. A Cobalt-Based Amorphous Bifunctional Electrocatalysts for Water-Splitting Evolved from a Single-Source Lazulite Cobalt Phosphate. Adv. Func. Mater. 2019, 29, 1808632. [Google Scholar] [CrossRef]
  52. Gond, R.; Sada, K.; Senthilkumar, B.; Barpanda, P. Bifunctional Electrocatalytic Behavior of Sodium Cobalt Phosphates in Alkaline Solution. ChemElectroChem 2018, 5, 153–158. [Google Scholar] [CrossRef]
  53. Liu, M.; Qu, Z.; Yin, D.; Chen, X.; Zhang, Y.; Guo, Y.; Xiao, D. Cobalt–Iron Pyrophosphate Porous Nanosheets as Highly Active Electrocatalysts for the Oxygen Evolution Reaction. ChemElectroChem 2018, 5, 36–43. [Google Scholar] [CrossRef]
  54. Rouff, A.A.; Rabe, S.; Nachtegaal, M.; Vogel, F. X-ray absorption fine structure study of the effect of protonation on disorder and multiple scattering in phosphate solutions and solids. J. Phys. Chem. A 2009, 113, 6895–6903. [Google Scholar] [CrossRef]
  55. Dalba, G.; Fornasini, P.; Rocca, F.; Lagarde, P.; Vlaic, G. EXAFS study of the coordination of phosphorus in AgPO3 glass. J. Non-Cryst. Solids 1988, 106, 181–184. [Google Scholar] [CrossRef]
  56. Küper, G.; Hormes, J.; Sommer, K. In situ X-ray absorption spectroscopy at the K-edge of red phosphorus in polyamide 6,6 during a thermo-oxidative degradation. Macromol. Chem. Phys. 1994, 195, 1741–1753. [Google Scholar] [CrossRef]
  57. Liu, S.; Farhoosh, S.; Beyer, P.; Mebs, S.; Zaharieva, I.; Haumann, M.; Dau, H. Role of Potassium in Electrocatalytic Water Oxidation Investigated in a Volume-Active Cobalt Material at Neutral pH. Adv. Sustain. Syst. 2023, 7, 2300008. [Google Scholar] [CrossRef]
  58. Rao, A.S.; Reddy, K.S.; Takkar, P.N. Malachite green method compared to ascorbic acid for estimating small amounts of phosphorus in water, 0.01 M calcium chloride, and olsen soil extracts. Commun. Soil Sci. Plant Anal. 1997, 28, 589–601. [Google Scholar] [CrossRef]
  59. Feng, J.; Chen, Y.; Pu, J.; Yang, X.; Zhang, C.; Zhu, S.; Zhao, Y.; Yuan, Y.; Yuan, H.; Liao, F. An improved malachite green assay of phosphate: Mechanism and application. Anal. Biochem. 2011, 409, 144–149. [Google Scholar] [CrossRef]
  60. Rahutomo, S.; Kovar, J.L.; Thompson, M.L. Malachite Green Method for Determining Phosphorus Concentration in Diverse Matrices. Commun. Soil Sci. Plant Anal. 2019, 50, 1743–1752. [Google Scholar] [CrossRef]
  61. Franke, R. X-ray absorption and photoelectron spectroscopy investigation of binary Nickelphosphides. Spectrochim. Acta A Mol. Biomol. Spectrosc. 1997, 53, 933–941. [Google Scholar] [CrossRef]
  62. Yin, Z.; Kasrai, M.; Bancroft, G.M.; Tan, K.H.; Feng, X. X-ray-absorption spectroscopic studies of sodium polyphosphate glasses. Phys. Rev. B 1995, 51, 742–750. [Google Scholar] [CrossRef] [PubMed]
  63. Prietzel, J.; Dümig, A.; Wu, Y.; Zhou, J.; Klysubun, W. Synchrotron-based P K-edge XANES spectroscopy reveals rapid changes of phosphorus speciation in the topsoil of two glacier foreland chronosequences. Geochim. Cosmochim. Acta 2013, 108, 154–171. [Google Scholar] [CrossRef]
  64. Werner, F.; Prietzel, J. Standard Protocol and Quality Assessment of Soil Phosphorus Speciation by P K-Edge XANES Spectroscopy. Environ. Sci. Technol. 2015, 49, 10521–10528. [Google Scholar] [CrossRef] [PubMed]
  65. Vogel, C.; Rivard, C.; Wilken, V.; Muskolus, A.; Adam, C. Performance of secondary P-fertilizers in pot experiments analyzed by phosphorus X-ray absorption near-edge structure (XANES) spectroscopy. Ambio 2018, 47, 62–72. [Google Scholar] [CrossRef] [Green Version]
  66. Schmieder, F.; Gustafsson, J.P.; Klysubun, W.; Zehetner, F.; Riddle, M.; Kirchmann, H.; Bergström, L. Phosphorus speciation in cultivated organic soils revealed by P K-edge XANES spectroscopy. J. Plant. Nutr. Soil Sci. 2020, 183, 367–381. [Google Scholar] [CrossRef]
  67. Donahue, C.M.; Daly, S.R. Ligand K-Edge XAS Studies of Metal-Phosphorus Bonds: Applications, Limitations, and Opportunities. Comment. Inorg. Chem. 2018, 38, 54–78. [Google Scholar] [CrossRef]
  68. Popmintchev, D.; Galloway, B.R.; Chen, M.-C.; Dollar, F.; Mancuso, C.A.; Hankla, A.; Miaja-Avila, L.; O’Neil, G.; Shaw, J.M.; Fan, G.; et al. Near- and Extended-Edge X-Ray-Absorption Fine-Structure Spectroscopy Using Ultrafast Coherent High-Order Harmonic Supercontinua. Phys. Rev. Lett. 2018, 120, 093002. [Google Scholar] [CrossRef] [Green Version]
  69. Giusti, L.; Landaeta, V.R.; Vanni, M.; Kelly, J.A.; Wolf, R.; Caporali, M. Coordination chemistry of elemental phosphorus. Coord. Chem. Rev. 2021, 441, 213927. [Google Scholar] [CrossRef]
  70. Zabinsky, S.I.; Rehr, J.J.; Ankudinov, A.; Albers, R.C.; Eller, M.J. Multiple-scattering calculations of x-ray-absorption spectra. Phys. Rev. B 1995, 52, 2995–3009. [Google Scholar] [CrossRef]
  71. Dau, H.; Liebisch, P.; Haumann, M. X-ray absorption spectroscopy to analyze nuclear geometry and electronic structure of biological metal centers-potential and questions examined with special focus on the tetra-nuclear manganese complex of oxygenic photosynthesis. Anal. Bioanal. Chem. 2003, 376, 562–583. [Google Scholar] [CrossRef]
  72. Risch, M.; Khare, V.; Zaharieva, I.; Gerencser, L.; Chernev, P.; Dau, H. Cobalt-oxo core of a water-oxidizing catalyst film. J. Am. Chem. Soc. 2009, 131, 6936–6937. [Google Scholar] [CrossRef]
  73. The Materials Project. Materials Data on FeP by Materials Project; United States Department of Energy: Washington, DC, USA, 2020. [Google Scholar]
  74. Zheng, T.; Yang, Z.; Gui, D.; Liu, Z.; Wang, X.; Dai, X.; Liu, S.; Zhang, L.; Gao, Y.; Chen, L.; et al. Overcoming the crystallization and designability issues in the ultrastable zirconium phosphonate framework system. Nat. Commun. 2017, 8, 15369. [Google Scholar] [CrossRef] [Green Version]
  75. Hultgren, R.; Gingrich, N.S.; Warren, B.E. The Atomic Distribution in Red and Black Phosphorus and the Crystal Structure of Black Phosphorus. J. Chem. Phys. 1935, 3, 351–355. [Google Scholar] [CrossRef]
  76. Endo, S.; Chino, T.; Tsuboi, S.; Koto, K. Pressure-induced transition of the hydrogen bond in the ferroelectric compounds KH2PO4 and KD2PO4. Nature 1989, 340, 452–455. [Google Scholar] [CrossRef]
  77. Leung, K.Y.; Calvo, C. The Structure of Na4P2O7 at 22 °C. Can. J. Chem. 1972, 50, 2519–2526. [Google Scholar] [CrossRef] [Green Version]
  78. Wyckoff, R.W.G. Second edition. Interscience Publishers, New York, New York Note: Cadmium iodide structure. Cryst. Struct. 1963, 1, 239–444. [Google Scholar]
  79. Nord, A.G.; Stefanidis, T. Structure refinements of Co3(PO4)2. A note on the reliability of powder diffraction studies. Acta Chem. Scand. Ser. A 1983, 37, 715–721. [Google Scholar] [CrossRef] [Green Version]
  80. Krupkova, R.; Fabry, J.; Vanek, P.; Cisarova, I. Two modifications of a KH2PO4.HF adduct. Acta Cryst. C 2003, 59, i79–i82. [Google Scholar] [CrossRef]
  81. Zhou, H.; Upreti, S.; Chernova, N.A.; Whittingham, M.S. Lithium cobalt(II) pyrophosphate, Li1.86CoP2O7, from synchrotron X-ray powder data. Acta Cryst. E 2011, 67, i58–i59. [Google Scholar] [CrossRef] [Green Version]
  82. Taxer, K.; Bartl, H. On the dimorphy between the variscite and clinovariscite group: Refined finestructural relationship of strengite and clinostrengite, Fe(PO4) 2H2O. Cryst. Res. Technol. 2004, 39, 1080–1088. [Google Scholar] [CrossRef]
  83. Jain, A.; Ong, S.P.; Hautier, G.; Chen, W.; Richards, W.D.; Dacek, S.; Cholia, S.; Gunter, D.; Skinner, D.; Ceder, G.; et al. Commentary: The Materials Project: A materials genome approach to accelerating materials innovation. APL Mater. 2013, 1, 011002. [Google Scholar] [CrossRef] [Green Version]
Figure 1. Phosphate content in CoCat films (100 mC cm−2) exposed to a phosphate-free electrolyte (KNO3 500 mM, pH 7.0) at a potential of 1.0 VNHE (pH 7) for the indicated time periods. Left y-axis, absolute P content in the total CoCat film determined by the malachite green assay (see Section 3 for details). Right y-axis, respective relative P contents. Each data point (squares) shows the average of two individual films with three assays performed for each film; error bars show standard deviations. The fit line corresponds to a single exponential decay with a time constant of 350 min and zero offset. The first data point is assumed to be the intrinsic P content of the electrodeposited CoCat film (before electrolyte exposure) and was used to calculate the relative P content in percent. The dotted line denotes 100% P content. The P content in a thinner film (20 mC cm−2) was further determined and data are shown in Figure S3. There may be a population of catalyst-internal phosphate ions that are less tightly bound and thus more rapidly released than the majority fraction, as suggested by the downward jump (of about 10%) from the initial phosphate level to the level detected within the first 10 min of exposure to the phosphate-free buffer (Figure 1 and Figure S3), as illustrated by the thick shaded line.
Catalysts 13 01151 g001
Figure 2. Phosphorus K-edge XAS spectra of CoCat films. (A) XANES spectra of CoCat for varying thicknesses (50–300 mC cm−2 deposition) compared to Co2P powder and KPi solution (2.5 M); magnified pre-edge features shown in the inset. The asterisk marks a feature at ~2144 eV, as discussed in the text. The indicated absorption values in the inset refer to the ~2144 eV peak and the percentages (in parenthesis) for the CoCat were determined relative to the Co2P peak (considered as 100%, at the asterisk position of the blue line). (B) Fourier transforms (FTs) of k3-weighted EXAFS spectra (in the inset) for CoCat films of various thicknesses with the corresponding deposition charge (a and b denote two independently prepared 150 mC cm−2 CoCat films).
Catalysts 13 01151 g002
Figure 3. Phosphorus K-edge XANES spectra of the CoCat and reference compounds. The CoCat spectrum represents the mean of the four spectra recorded for film thicknesses ranging from 50 to 300 mC cm−2 (Figure 2); reference spectra are for boron nitride-diluted powder or aqueous KPi solution samples. The inset shows the pre-edge feature at ~2148 eV (marked by *) of the CoCat in magnification, in comparison to spectra of a KPi solution and a PO4 on FeO(OH) sample from the literature [48,49]. For respective EXAFS spectra, see Figure 4 and Figure S4.
Catalysts 13 01151 g003
Figure 4. Mean phosphorus K-edge XAS spectrum of CoCat films. The spectrum was derived by averaging XAS data for 50–300 mC cm−2 depositions (Figure 2). The Fourier transform (FT) was calculated from the EXAFS spectrum in the inset (thin lines, experimental data; thick lines, simulation with parameters in Table 1). The FT was calculated from 3.8–12.2 Å−1, omitting low k EXAFS data to emphasize 2nd-sphere phosphorus-cobalt distances contributing to the FT peak around 2.8 Å (compare Figure S4).
Catalysts 13 01151 g004
Figure 5. Hypothetical structural motifs of phosphorus binding in the CoCat material. (a) Phosphate terminally coordinated to a Co ion of the Co-oxide layer. (b) Phosphorus binding via an O-atom bridging between Co ions. (c) Phosphate ion bound to the oxide layer and, in addition, (ionically) bonded to a K+ ion. (d) Interlayer phosphate bound to a K+ ion but not to the Co-oxide layer. (e) Phosphate bridging between two cobalt ions. (f) Polyphosphate (here, di-phosphate bound to the Co-oxide layer). (g) Phosphorus integrated into the Co-oxide layer in the form of a PO6-octaeder. The structural motifs e, f, and g are disfavored by the EXAFS analysis and most likely not realized in the CoCat material.
Catalysts 13 01151 g005
Table 1. EXAFS simulation parameters for the CoCat. Coordination number, N [per P atom]; interatomic distance, R [Å]; Debye–Waller parameter, 2σ22]. Data of the mean CoCat spectrum of Figure 4. * Fixed parameter; # denotes coupling of 2σ2 to yield the same value for all shells. A 1st-sphere multiple-scattering path contribution (P–O–O) with the expected coordination number of phosphate (PO4) sites is denoted by “ms” (the R-value is the apparent O–O distance). S02 was 0.75. The filtered R-factor, RF, represents the deviation between the data and simulation (in percent) for reduced distances here ranging from 1 to 3 Å. The error of 2σ2 is ±0.001 Å2. For respective distance (R) ranges of reference compounds, see Figures S4 and S6. A refinement of the EXAFS fit for CoCat is shown in Table S2.
ShellN
(per P)
R
(Å)
2
2)
RF
(%)
CoCatP–O4 *1.55 ± 0.010.006 #11.7
P–O–Oms6 *2.42 ± 0.010.006 #
P–Co0.1 ± 0.12.26 ± 0.030.006 #
P–Co0.7 ± 0.23.09 ± 0.030.006 #
P–K0.9 ± 0.33.30 ± 0.030.006 #
Disclaimer/Publisher’s Note: The statements, opinions and data contained in all publications are solely those of the individual author(s) and contributor(s) and not of MDPI and/or the editor(s). MDPI and/or the editor(s) disclaim responsibility for any injury to people or property resulting from any ideas, methods, instructions or products referred to in the content.

