Next Article in Journal
Infection and Spread of Root Rot Caused by Heterobasidion parviporum in Picea abies Stands after Thinning: Case Studies on Former Pasture and Meadow Lands
Next Article in Special Issue
Performance and Phenotypic Stability of Norway Spruce Provenances, Families, and Clones Growing under Diverse Climatic Conditions in Four Nordic Countries
Previous Article in Journal
Relationship between Forest Ecophysiology and Environment
Previous Article in Special Issue
Assisted Migration Field Tests in Canada and Mexico: Lessons, Limitations, and Challenges
 
 
Correction published on 13 September 2021, see Forests 2021, 12(9), 1237.
Article

Reciprocal Common Garden Altitudinal Transplants Reveal Potential Negative Impacts of Climate Change on Abies religiosa Populations in the Monarch Butterfly Biosphere Reserve Overwintering Sites

by
Ana Laura Cruzado-Vargas
1,
Arnulfo Blanco-García
2,
Roberto Lindig-Cisneros
3,
Mariela Gómez-Romero
2,4,
Leonel Lopez-Toledo
5,
Erick de la Barrera
3 and
Cuauhtémoc Sáenz-Romero
5,*
1
Instituto de Investigaciones Agropecuarias y Forestales, Universidad Michoacana de San Nicolás de Hidalgo (UMSNH), Morelia 58330, Michoacán, Mexico
2
Facultad de Biología, Universidad Michoacana de San Nicolás de Hidalgo (UMSNH), Morelia 58030, Michoacán, Mexico
3
Instituto de Investigaciones en Ecosistemas y Sustentabilidad, Universidad Nacional Autónoma de México (UNAM), Morelia 58190, Michoacán, Mexico
4
Cátedra, Consejo Nacional de Ciencia y Tecnología (CONACyT), Ciudad de México 03940, Mexico
5
Instituto de Investigaciones sobre los Recursos Naturales, Universidad Michoacana de San Nicolás de Hidalgo (UMSNH), Morelia 58330, Michoacán, Mexico
*
Author to whom correspondence should be addressed.
Forests 2021, 12(1), 69; https://doi.org/10.3390/f12010069
Submission received: 9 December 2020 / Revised: 3 January 2021 / Accepted: 4 January 2021 / Published: 9 January 2021

Abstract

:
Research Highlights: Reciprocal altitudinal transplants of Abies religiosa seedlings within the Monarch Butterfly Biosphere Reserve (MBBR) allow prediction of the impacts of climatic change, because they grow in sites with a climate that differs from that of their origin. Background and Objectives: Climatic change is generating a mismatch between the sites currently occupied by forest populations and the climate to which they have adapted. This study determined the effect on the survival and growth of A. religiosa seedlings of transfer to sites that were warmer or colder than that of the origin of their seeds. Materials and Methods: Eleven provenances of A. religiosa, collected along an altitudinal gradient (3000 to 3550 m a.s.l.), were assayed in common gardens in three sites of contrasting altitude: 3400, 3000 and 2600 m a.s.l. The results were evaluated by fitting a response curve with a mixed model. Results: The climate transfer distance for the seasonal balance between the temperature conducive to growth (degree days above 5 °C) and the available precipitation (a ratio expressed as dryness index) dominated the shape of the response function curve. The rainy season (June–October) dryness index transfer distance was critical for survival, while that of the cold and dry season (November–February) was critical for aerial biomass, and the annual index was critical for the increase in basal diameter. The effect of climatic transfer distance is much more negative (triggering about 45% mortality) when transfer is toward warmer and dryer sites (at 400 m lower in altitude, +1.9 °C warmer and 16% less precipitation), than when shifting toward colder and wetter sites (400 m higher in altitude, resulting in 95% survival). Conclusions: The projected higher temperatures and lower precipitation due to climatic change will undoubtedly cause severe mortality in young A. religiosa seedlings. A 400 m shift upwards in altitude to compensate for climatic change (assisted migration) appears to be a feasible management action.

Graphical Abstract

1. Introduction

In the near future, climatic change will generate warmer climates and displace the climatic zones towards the poles and towards higher altitudes in mountainous regions [1]. Given that, as the result of a long process of evolutionary adaptation, species and their populations are distributed in localities that are generally coupled to a climate suitable for them, climatic change will generate a decoupling between the populations and the climate to which they are adapted [2,3], influencing phenological changes, population and growth dynamics [4] and reproduction [5]. Stress induced by this decoupling favors the frequency and intensity of the development of pests and diseases [6,7,8,9,10] and defoliation through drought stress [11], inducing a severe process of forest decline, which is already underway globally [12], especially at the xeric limit (lower altitudinal or south in the northern hemisphere) [13,14].
Forest tree species that present a wide geographic distribution can present an important genetic differentiation among populations in terms of quantitative characters, such as adaptation to the diversity of environmental conditions [3,15,16]. This differentiation is expressed in different variables such as growth rate, seasonality of elongation of the apical bud and resistance to frost damage [17,18,19,20]. Provenance assays allow the expression of these differences by cultivating plants from different geographic origins (provenances) under the same environmental conditions [21]. In general, for forest populations, a pattern of variation of growth has been reported in which the provenances originating from the colder (higher altitude) part of the natural distribution express a lower potential for growth in height, but a greater resistance to frost damage while, in contrast, those from the low part of the altitudinal distribution (warmer) have greater potential for growth but are more susceptible to frost damage [22,23,24].
In Mexico, one of the most important species for biological conservation is Abies religiosa (sacred fir or oyamel), because it hosts the overwintering sites of the monarch butterfly (Danaus plexippus L.) for five months (November–March) [25]. The areas of the greatest extension of A. religiosa are found within the Trans-Mexican Volcanic Belt, at between 2400 and 3600 m a.s.l. and mainly between 19° and 20° in latitude North [26]. The Monarch Butterfly Biosphere Reserve (MBBR) is found within the Trans-Mexican Volcanic Belt, on the border between the states of Michoacán and Estado de México. The forests of A. religiosa can be strongly affected by climatic change—it will induce a decoupling between the populations of A. religiosa and the environment suitable for them, such that by the decade 2090, the models project that suitable climatic habitat for A. religiosa will have disappeared completely from the MBBR [26]. Previous studies have reported that A. religiosa presents a high percentage of non-viable seeds (63–79%) [27,28], in addition to very low recruitment and high mortality of sacred fir seedlings, necessitating the implementation of an active restoration program or other management actions [29]. Additionally, so that the populations of this species can remain coupled to their favorable climatic habitat, their upwards altitudinal displacement of between 300 and 500 m will be necessary by 2060 [30], due to the projected increases in temperature and diminution in precipitation. This could have a considerable effect on the overwintering of the monarch butterfly, in addition to severe environmental impacts. For these reasons, human-assisted displacement of seed sources towards higher altitudes (through reforestation programs) appears to be an option for consideration as a strategy of adaptive management to climatic change. This is because, while the populations of forest species can, and in fact currently are, migrating altitudinally towards higher altitudes through natural means, the speed at which they can accomplish this is lower than that necessary to remain coupled to the climate that favors them [31,32].
The results of two previous field tests indicate that it is feasible to conduct assisted altitudinal migration to above the provenances of A. religiosa, translocating the seed sources up to 400 m higher in altitude than their origin, but only when planted beneath the shade protection of local shrubs (such as Baccharis conferta) serving as nurse plants [33]. However, to date, no experiments have determined what would happen if young A. religiosa seedlings are exposed to greater temperatures and lower precipitation, as projected in scenarios of climatic change [26,34]. There is also evidence that there are serious difficulties in terms of the natural regeneration of young seedlings, because the warm and dry season of March–May is now more dry and hot than usual, causing a severe mortality of seedlings in April [29]. Although an important genetic differentiation has been demonstrated among populations of A. religiosa for resistance to frost damage along altitudinal gradients [20], a significant genetic differentiation has not been demonstrated among populations for resistance to drought, for example, in the differential accumulation of solutes, such as the amino acid proline, that confer physiological resistance to drought [35,36].
Considering the above, the objective of this study was to evaluate the effects of climatic transfer (climatic difference between the site of origin and the site of plantation) on the survival and growth of young A. religiosa seedlings, through reciprocal transplants of eleven provenances of A. religiosa to common gardens at three contrasting altitudes. The climatic transfer was conducted by simulating three possible scenarios: (i) towards altitudes lower than the seed source origin (simulating a future climate of higher temperature and lower precipitation); (ii) towards higher altitudes (to confirm the viability of assisted migration); and (iii) to a site of intermediate altitude as a reference. The latter two sites were located in the core zone and on the edge of the buffer zone of the MBBR, respectively, in Estado de México, in central-western Mexico. The intention was to generate guidelines for decision-making in terms of the transfer of seed sources in a program of assisted migration, as well as to quantify the impacts of climatic change and the risks of failing to practice adaptive management in the face of climatic change.

2. Materials and Methods

2.1. Study Site

The study was conducted within the Monarch Butterfly Biosphere Reserve (MBBR), which forms part of the Trans-Mexican Volcanic Belt, and in Tlalpujahua de Rayón, Michoacán. The altitudes of the MBBR range from 2200 to 3640 m a.s.l. and the annual average temperatures range from 8 to 22 °C [37]. The vegetation is mainly comprised by forests of fir (A. religiosa), pine (Pinus spp.), oak (Quercus spp.), and cedar (Cupressus spp.) [38].

2.1.1. Seed Collection Sites

Cones were collected (in December 2017) from eleven provenances of A. religiosa, along an altitudinal transect (3000 to 3550 m a.s.l. in altitude; altitudinal difference of 50 m between sites), within the MBBR (Table 1). At each site, cones were collected at random from ten trees, at a distance of at least 30 m apart [39], in order to reduce the possibility of endogamy.

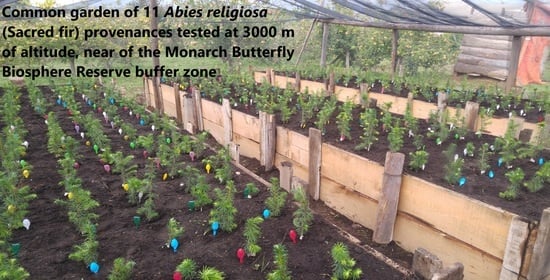
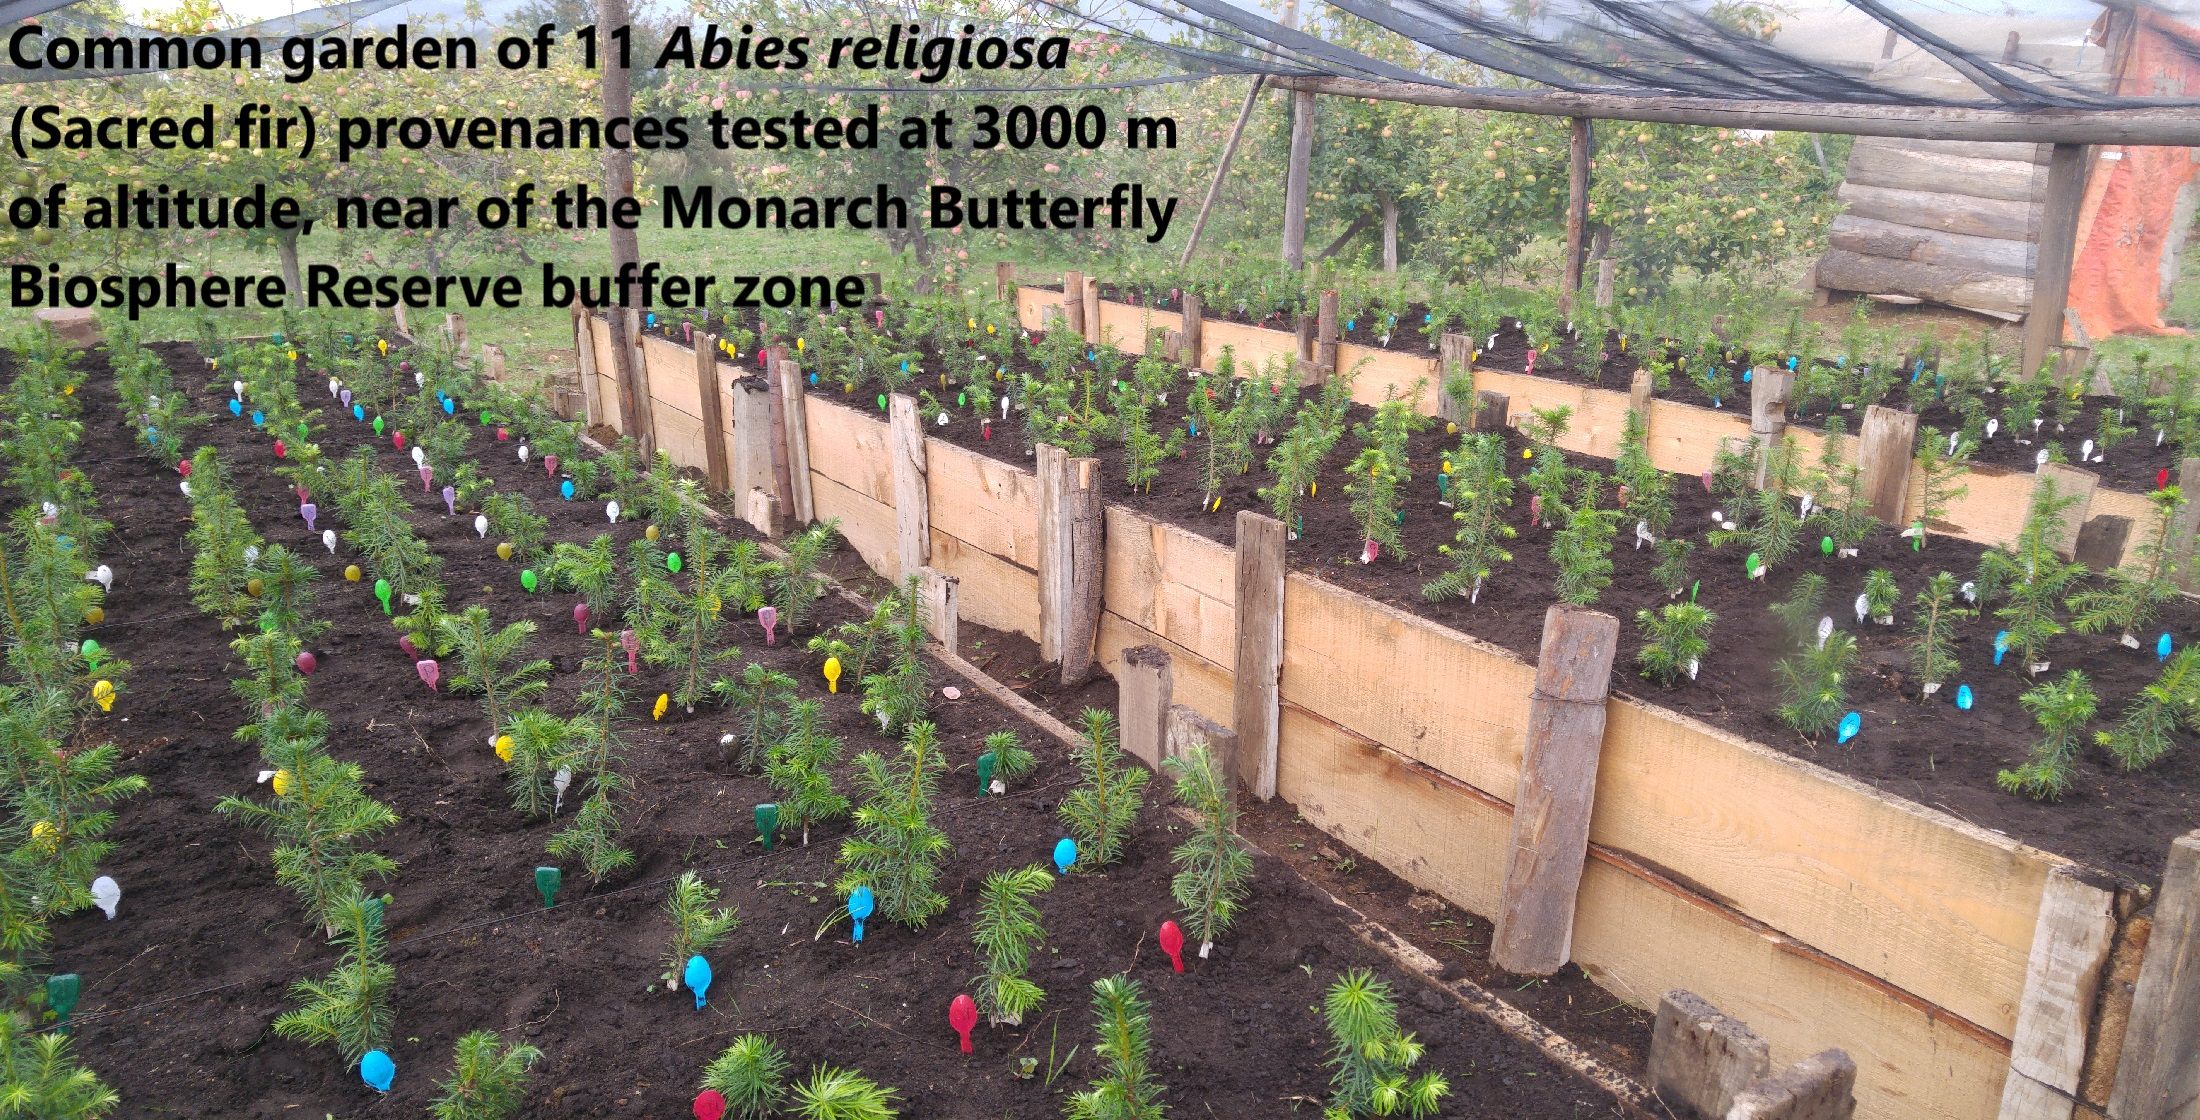
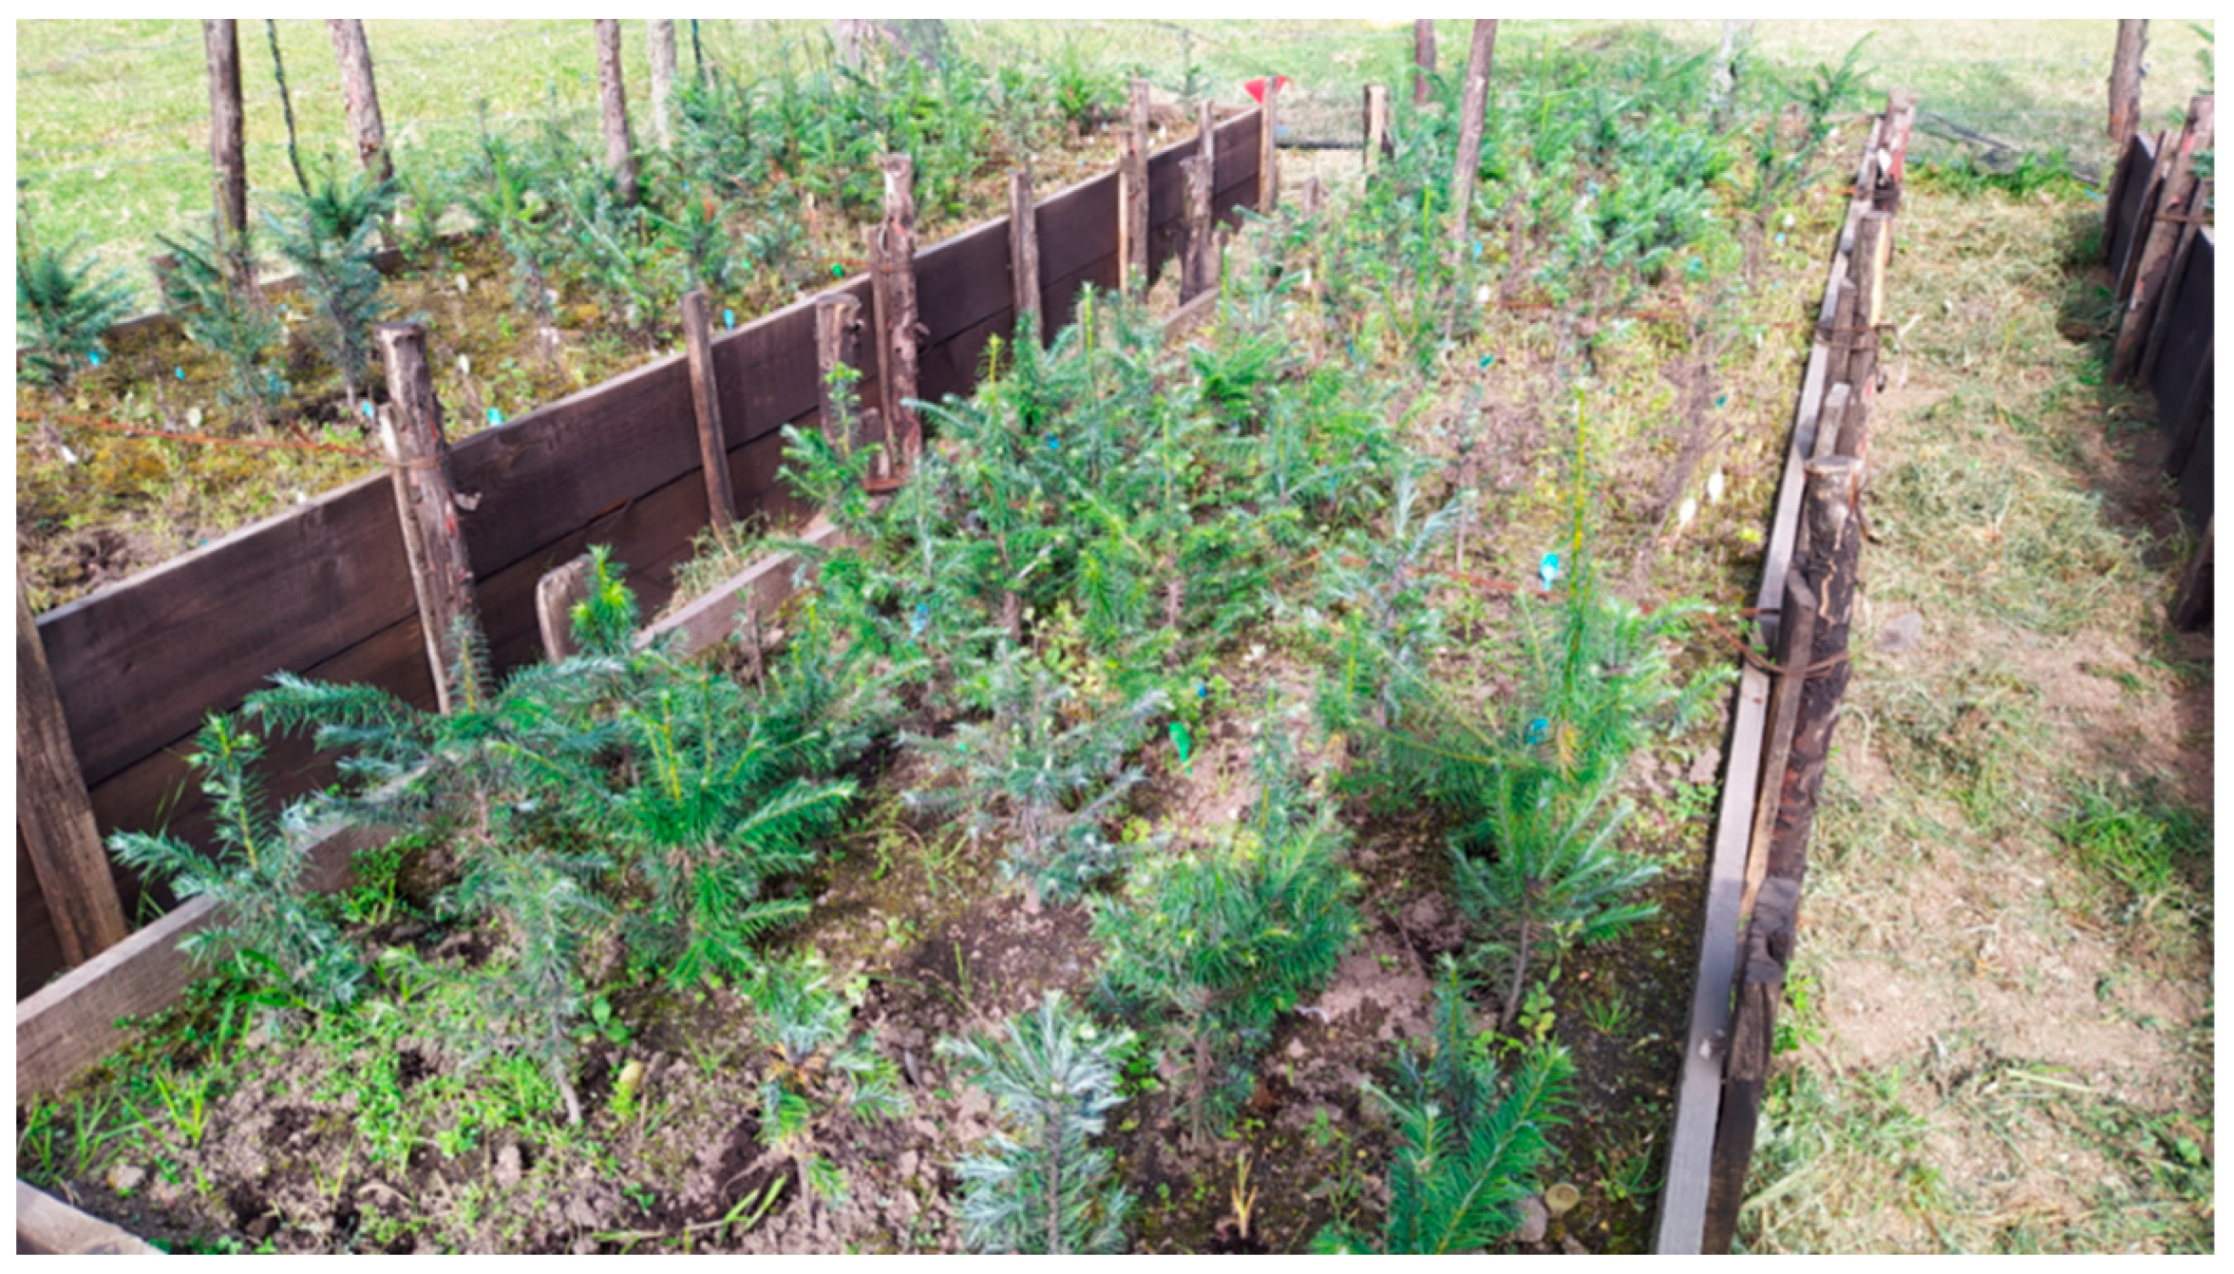
2.1.2. Provenance Test Sites in Common Gardens

Three field provenance tests were established in common gardens (Table 3): (a) high altitude site at 3400 m a.s.l., to confirm the viability of altitudinally upwards assisted migration, within the core zone of the MBBR (at an approximate linear distance of 300 m from a monarch butterfly overwintering site); (b) intermediate altitude site at 3000 m a.s.l., on the edge of the buffer zone of the MBBR; and (c) low altitude site at 2600 m a.s.l., to quantify the effects of a warmer, drier climate than that of the seed origin (considering that the temperature changes by approximately 0.5 °C for each 100 m of altitudinal difference [34]).

2.2. Production of Plants in Nursery

Once the seed was obtained from the mother tree, it was stratified at 4 °C for 14 days [39,41]. Each lot of seeds subjected to stratification comprised a similar quantity of seeds originating from each mother tree, so that the progenies were represented equally in the provenances.
Plant production was conducted for 14 months (May 2018–June 2019) in a shade-house (35% shade mesh) in the Instituto de Investigaciones sobre los Recursos Naturales (INIRENA), in Morelia city in Michoacán, Mexico. Plants were germinated in a seedbed and later transplanted into containers of 380 cm3, with a mixed substrate comprising loamy soil, agrolite, vermiculite and peat moss (volume 60:15:15:10, respectively). Transplantation was conducted with an equal quantity of seeds germinated from each mother tree, so that they were represented equally in the provenances. To prevent differential growth among the provenances in the nursery as a result of possible environmental differences within the shade house, the plants were positioned in a completely random block design (6 blocks, 11 provenances, 54 plants per plot).

2.3. Test of Provenances in Common Gardens in the Field

In each field site (as in Table 3), three raised beds were constructed, with wooden frames of 5 × 1.5 × 0.4 m in length:width:height. The internal base of each raised bed was covered by a metal mesh (aperture size 3.5 cm) to prevent access by gophers. To ensure that the sites differed only in terms of the climate as a result of their altitude, and thus to evaluate the impact of the climatic transfer in each provenance, the raised beds were filled with the same forest soil, transported from a forest site dominated by A. religiosa at the intermediate altitude (3000 m a.s.l.), thus avoiding any confounding effect of the local soil. Finally, the raised beds were covered by a shade mesh (35%) at a height of 2.5 m, to simulate the protective effect of nurse plants [33] (Figure 1).
The seedlings produced in the nurseries were transplanted to the raised beds in July 2019 (beginning of the rainy season), at age 14 months. In each site, six completely random blocks were established (11 provenances per block, five seedlings per provenance per plot in line, at a spacing of 0.2 × 0.2 m and with two blocks per raised bed. At the extremes of the raised bed, a protection strip was planted, comprising a mixture of seedlings of all of the provenances, in order to control the edge effect (Figure 1).
The trees (the seeds of which were collected at different altitudes) represented in the common garden tests by their seedlings are herein termed populations, while the location of origin of a population is called the provenance.

2.4. Measurements

For sixteen months, monthly or bimonthly evaluations of plant survival and height were conducted, with semestral evaluations of the basal diameter. The first evaluations of plant height and basal diameter were conducted six months after plantation, in the expectation that the plants would be well established by that time. The final measurement was taken at the end of the growing season of the following year (November 2020). Plant height was measured with a 1 mm precision up to the tip of the apical bud, supporting the ruler on a bar of aluminum, which was in turn supported on the edge of the wooden frame (to avoid measurement errors due to the irregular surface of the substrate). Basal diameter was measured at the base of the stem with a digital vernier (KNOVA®, Cupertino, CA, USA) at a 0.1 mm precision.
The increase in seedling height and basal diameter was obtained by subtracting the first measurement (December 2019) from the final measurement (November 2020). Survival was estimated as the percentage of live plants per plot. Substrate moisture content was measured with a W.E.T (water content, electrical conductivity and temperature) sensor of type W.E.T-2 (Delta-T-Devices, Cambridge, UK) as well as gravimetrically, by measuring the wet and dry weights of soil samples.

2.5. Estimation of Aerial Biomass
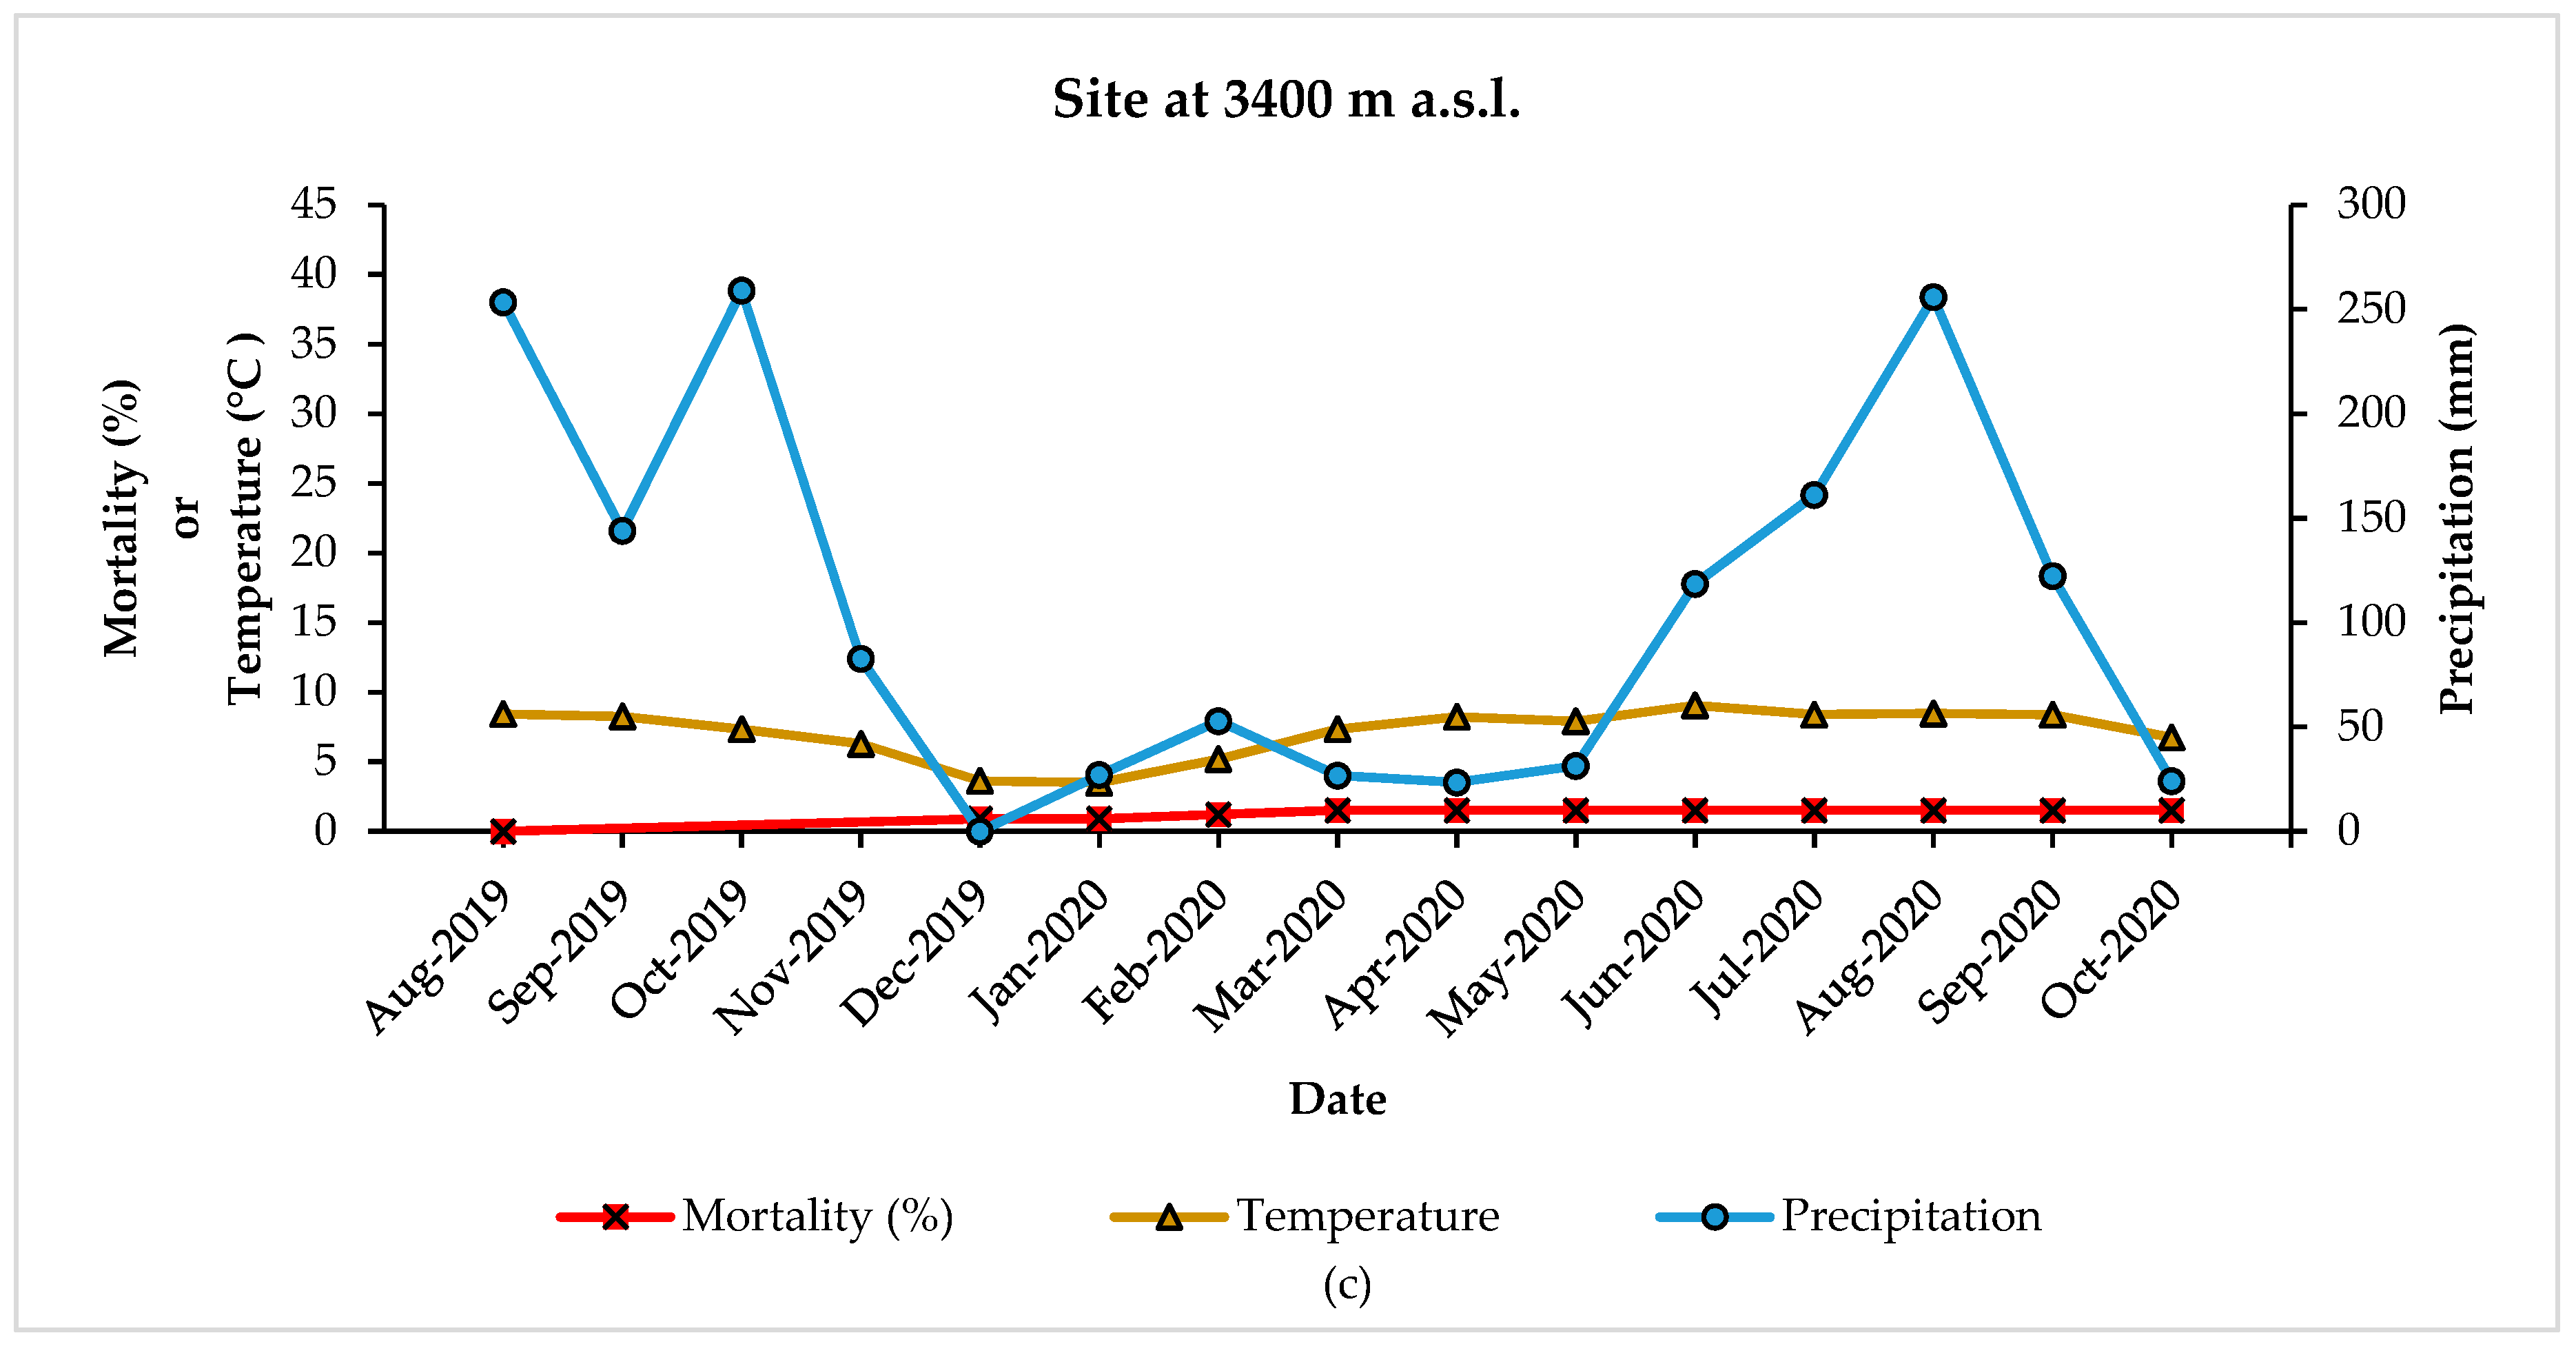
Following the methodology of Martinez-Luna, et al. [42], the aerial biomass of the seedlings in the common garden field assay was estimated using a regression formula from the measurements of total height and basal diameter. The formula was fitted by measuring (through destructive harvest) seedling height, basal diameter and dry weight of the stem, branches, and foliage (dried for 48 h at 65 °C in a Shel Lab drying oven (model FX4) and weighed on a Mettler Toledo analytical balance, model AB204-S). Five seedlings of diverse sizes were selected for this harvest from each of the 11 assayed provenances (harvested from a surplus lot of plants). The regression was fitted using Proc Reg of SAS [43,44], from which the following parameters were obtained:
B a = 1.62490 + ( 0.03538 × H t ) + ( 0.77238 × D b )
where Ba is the aerial biomass (g), Ht is the total height (mm), and Db is the basal diameter (mm 0.1).

2.6. Climatic Data

Climatic data from the provenance of origin of the seeds were obtained for the reference period 1961–1990 through climatic spline models (based on [34]), available at the website [40]. The climate of the provenance is considered the recent historic climate to which the provenances have evolved and adapted [45]. The climate of the field assay sites, which was that experienced by the seedlings while growing in the field common gardens, was estimated using three data loggers HOBOs (temperature/external channel data logger; Onset Computer Corporation®, Bourne, MA, USA) per site, set to record temperature every 30 min. Monthly precipitation was measured by capturing rainwater, averaging the results from two rainwater traps per site.
The climatic variables estimated for both the provenances and the sites are described in Table 2, and are considered of physiological importance for representing the seasonal or annual balance between the available humidity and the temperature in terms of seedling growth [17,46]. The seasonal indices warm and dry season dryness index (WDSDI), rainy season dryness index (RSDI) and cold and dry season dryness index (CDSDI) aim to represent the seasonality of each of the A. religiosa study sites and are based on the seasonality observed in [33].
From the climate of the provenances and of the field test sites, the climatic or altitudinal transfer distance (CTD or ATD = climate or altitude of the test site − climate or altitude of the source of the provenance) was estimated in order to represent the impact of growing in a site with a climate (or altitude) that differed from that of the seed origin.

2.7. Statistical Analysis

A curve was estimated for each of the four response variables studied (survival, increase in basal diameter, increase in height, and aerial biomass of A. religiosa seedlings), to measure the effect of the climatic or altitudinal transfer (growing in a site with a climate or altitude that differed from that of the seed origin), using a mixed model in Proc Mixed of SAS [43,44], based on refs [16,46].
The fixed effects considered three components of the effect of climate as a selective force that produces a genetic differentiation among populations and/or a response of phenotypic plasticity (also considered as a genotype × environment interaction [15]): (a) the climate of the provenance (C); (b) the climatic transfer distance (D = climate of the test site − climate of the provenance); and (c) the interaction between climate of the provenance and climatic transfer distance (C × D). Random effects provided the variance that was not explained by the fixed effects; i.e., those derived from the experimental design: site, provenance, block and the interaction between the site and the provenance. The climatic transfer distance is a concept originally known as “ecological distance” [47]; more details regarding the reasoning of this model can be found in refs [16,48].

2.7.1. Mixed Model

The following mixed model was fitted, based on refs [16,46]:
Y i j k l = μ + β 0 + β 1 D ij + β 2 D ij 2 + β 3 C j + β 4 ( D ij × C j ) + β 5 S i + β 6 P j + β 7 B k ( S i ) + β 8 ( S i × P j ) + e i j k l
where Y i j k l is the survival or aerial biomass or increase in basal diameter or increase in plant height, corresponding to the lth tree for the jth provenance in the kth block in the ith test site, and β 0 is the intercept. D ij is the climatic transfer distance (difference between the value of a climatic variable in the test site and that of the provenance) for the jth provenance in the ith test site, C j is the value of the climatic variable in the jth provenance, and D ij × C j is the interaction between the climatic transfer distance for the jth provenance in the ith test site and the climatic variable in the jth provenance. S i is the effect of the ith test site, P j is the effect of the jth provenance, B k ( S i ) is the effect of the kth block nested within the ith test site, and e i j k l is the error term.

2.7.2. Selection of Variables to Fit the Best Mixed Model

The climatic variables for use in the mixed model were selected using the following steps, independently for each response variable, based on refs [16,46]:
(1)
Five climatic variables were selected that best described the climate of the provenance, estimating the Spearman correlations between the values of the climatic variables and the average value per provenance across sites of the response variables, and selecting those with the highest |r| value.
(2)
The climatic variables for the climatic transfer distance were selected by fitting a reduced mixed model, eliminating from the model (Equation (2)) the term of climate of the provenance (Cj) and its respective interaction (Dij × Cj). The five climatic variables selected were those for which the model obtained the lowest (and thus the best) value of the Akaike information criterion (AIC) and, in addition, that necessarily presented the estimated parameter of the quadratic term both negative and significant, in order to ensure that it was biologically sound [15,16].
(3)
Subsequently, 5 × 5 = 25 full “competing” models were run, which included all of the possible combinations of the five variables of the climate of provenance and the five variables of climatic transfer distance preselected in the previous two steps. The best model was selected based on the AIC value.
In total, 100 models (25 “competing” models for each of the four response variables) were run, in order to determine the best model for understanding the response of survival, increase in basal diameter, increase in plant height and aerial biomass.
Finally, from the regression parameters estimated for the fixed effects, quadratic curves of response to the climatic transfer were estimated for each response variable, in order to visualize the effect on survival and growth of growing in a site with a climate that differs to that of the origin of the populations.

3. Results

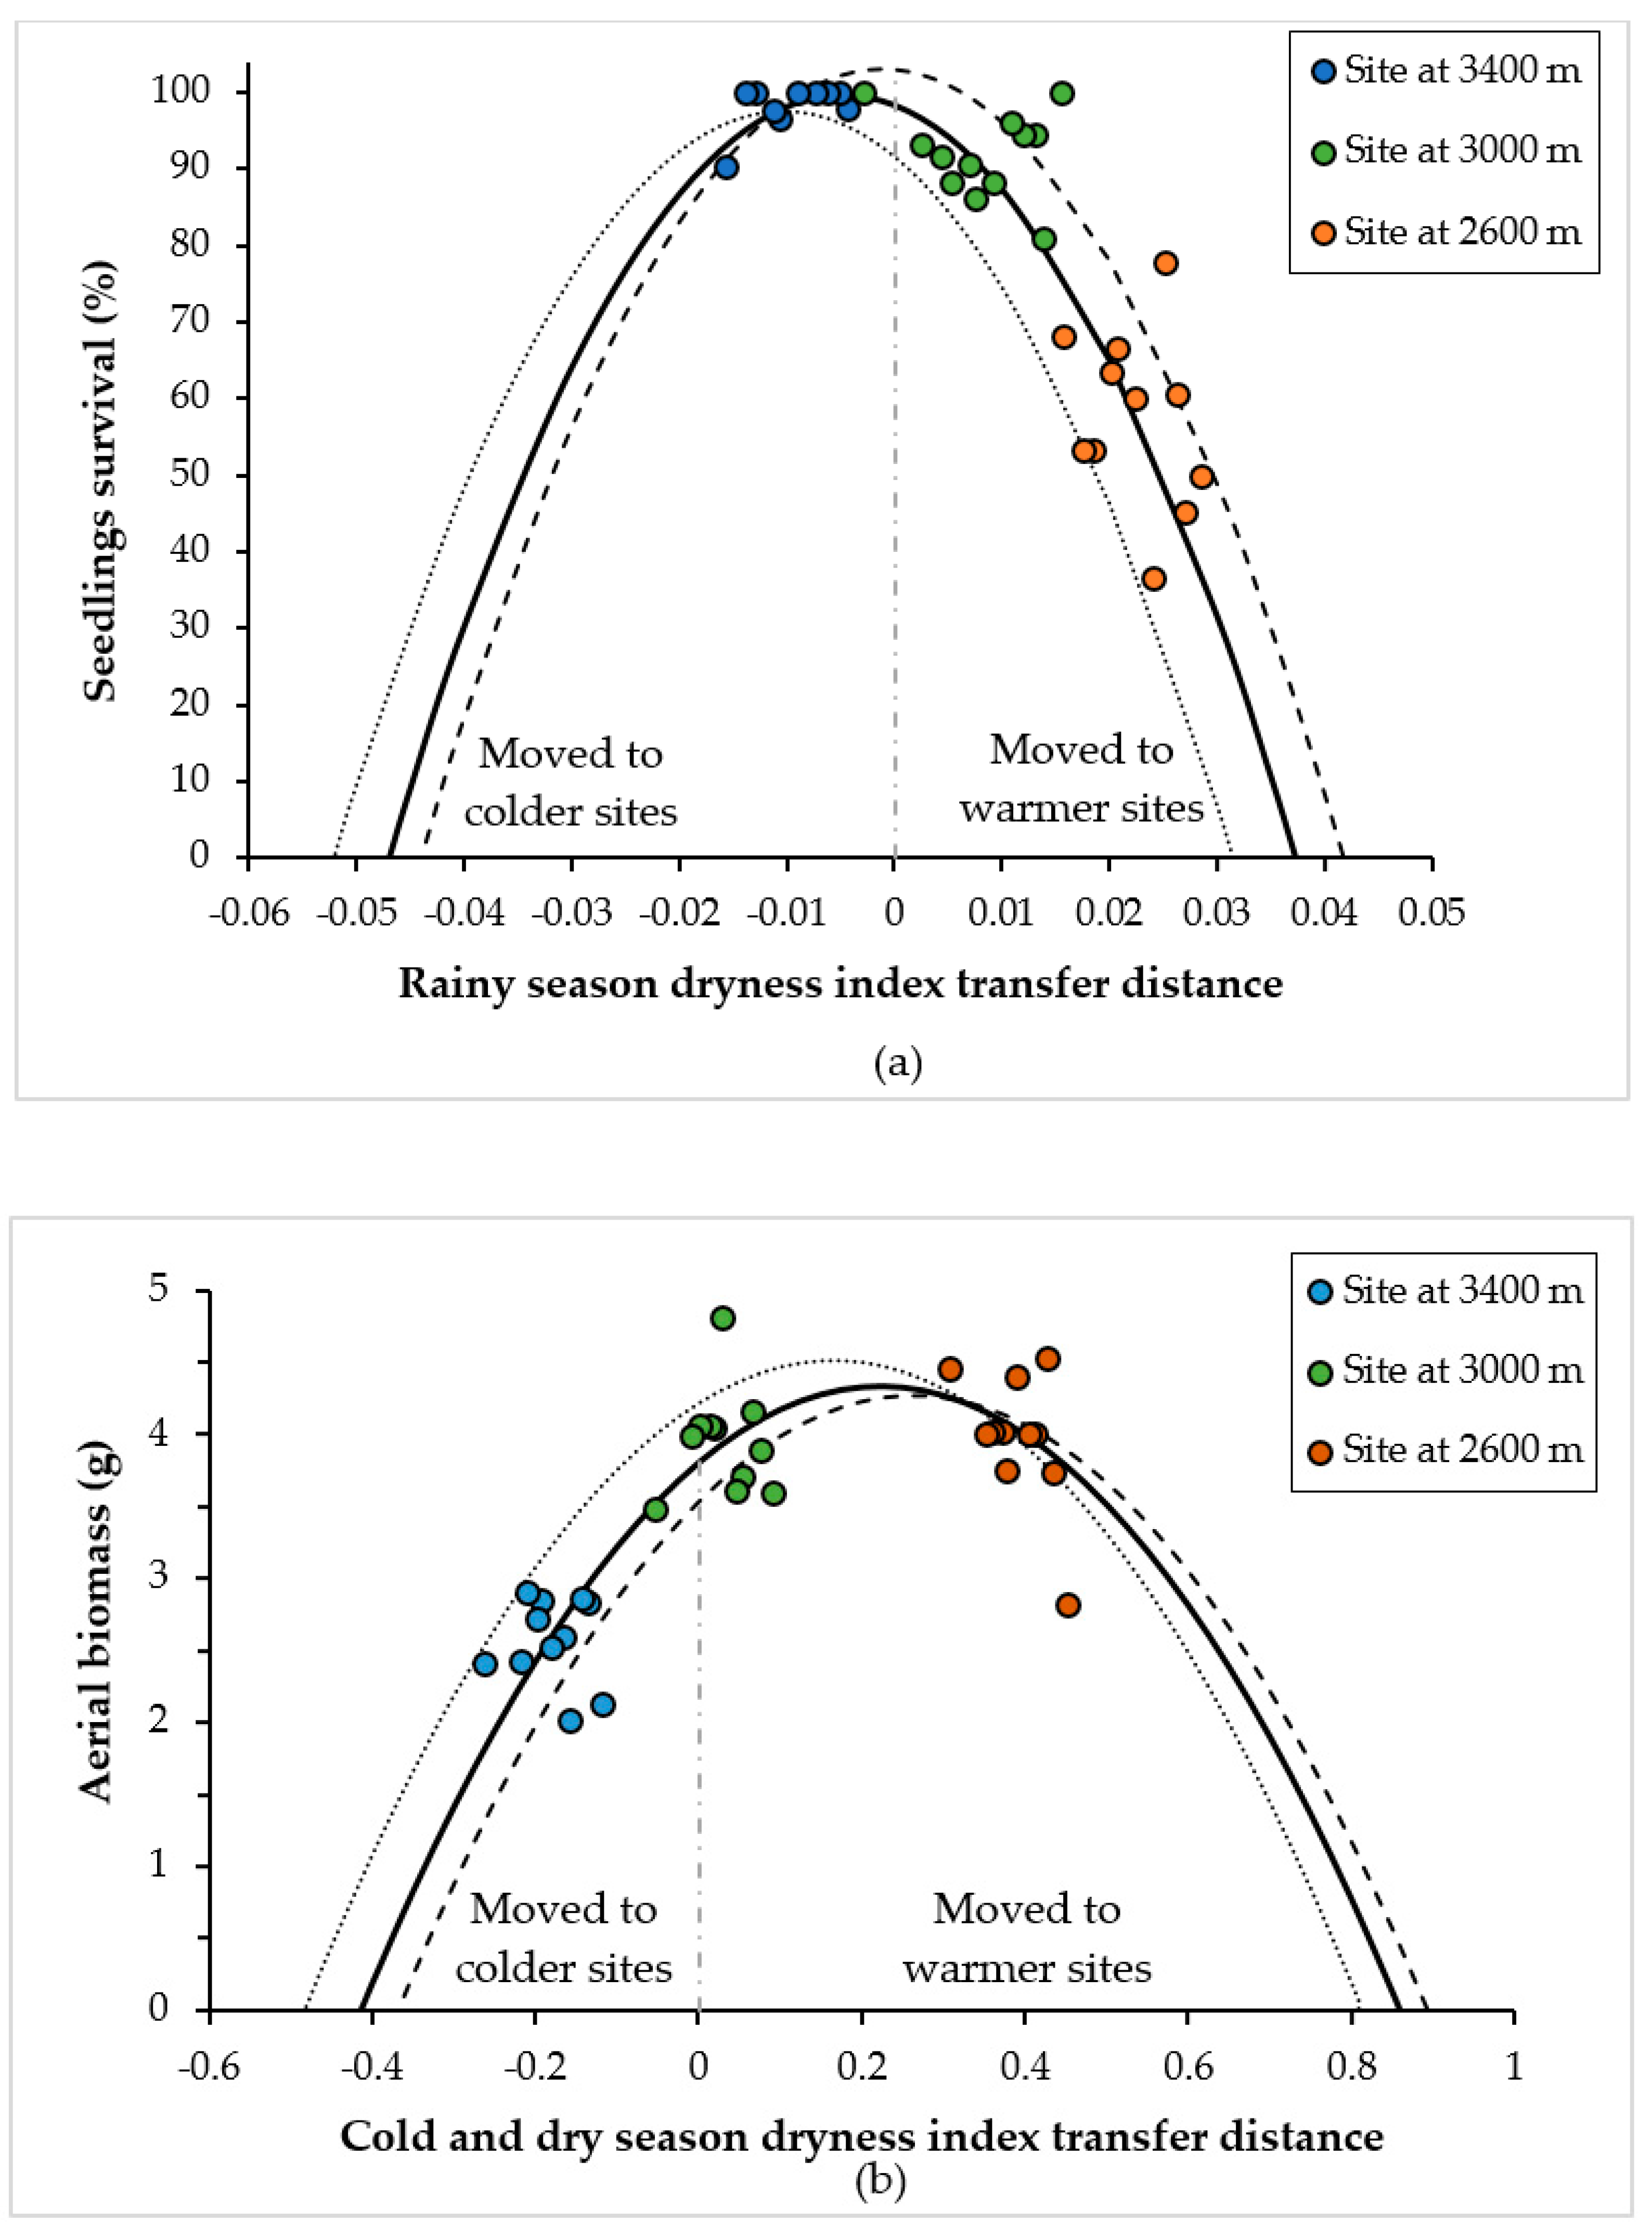
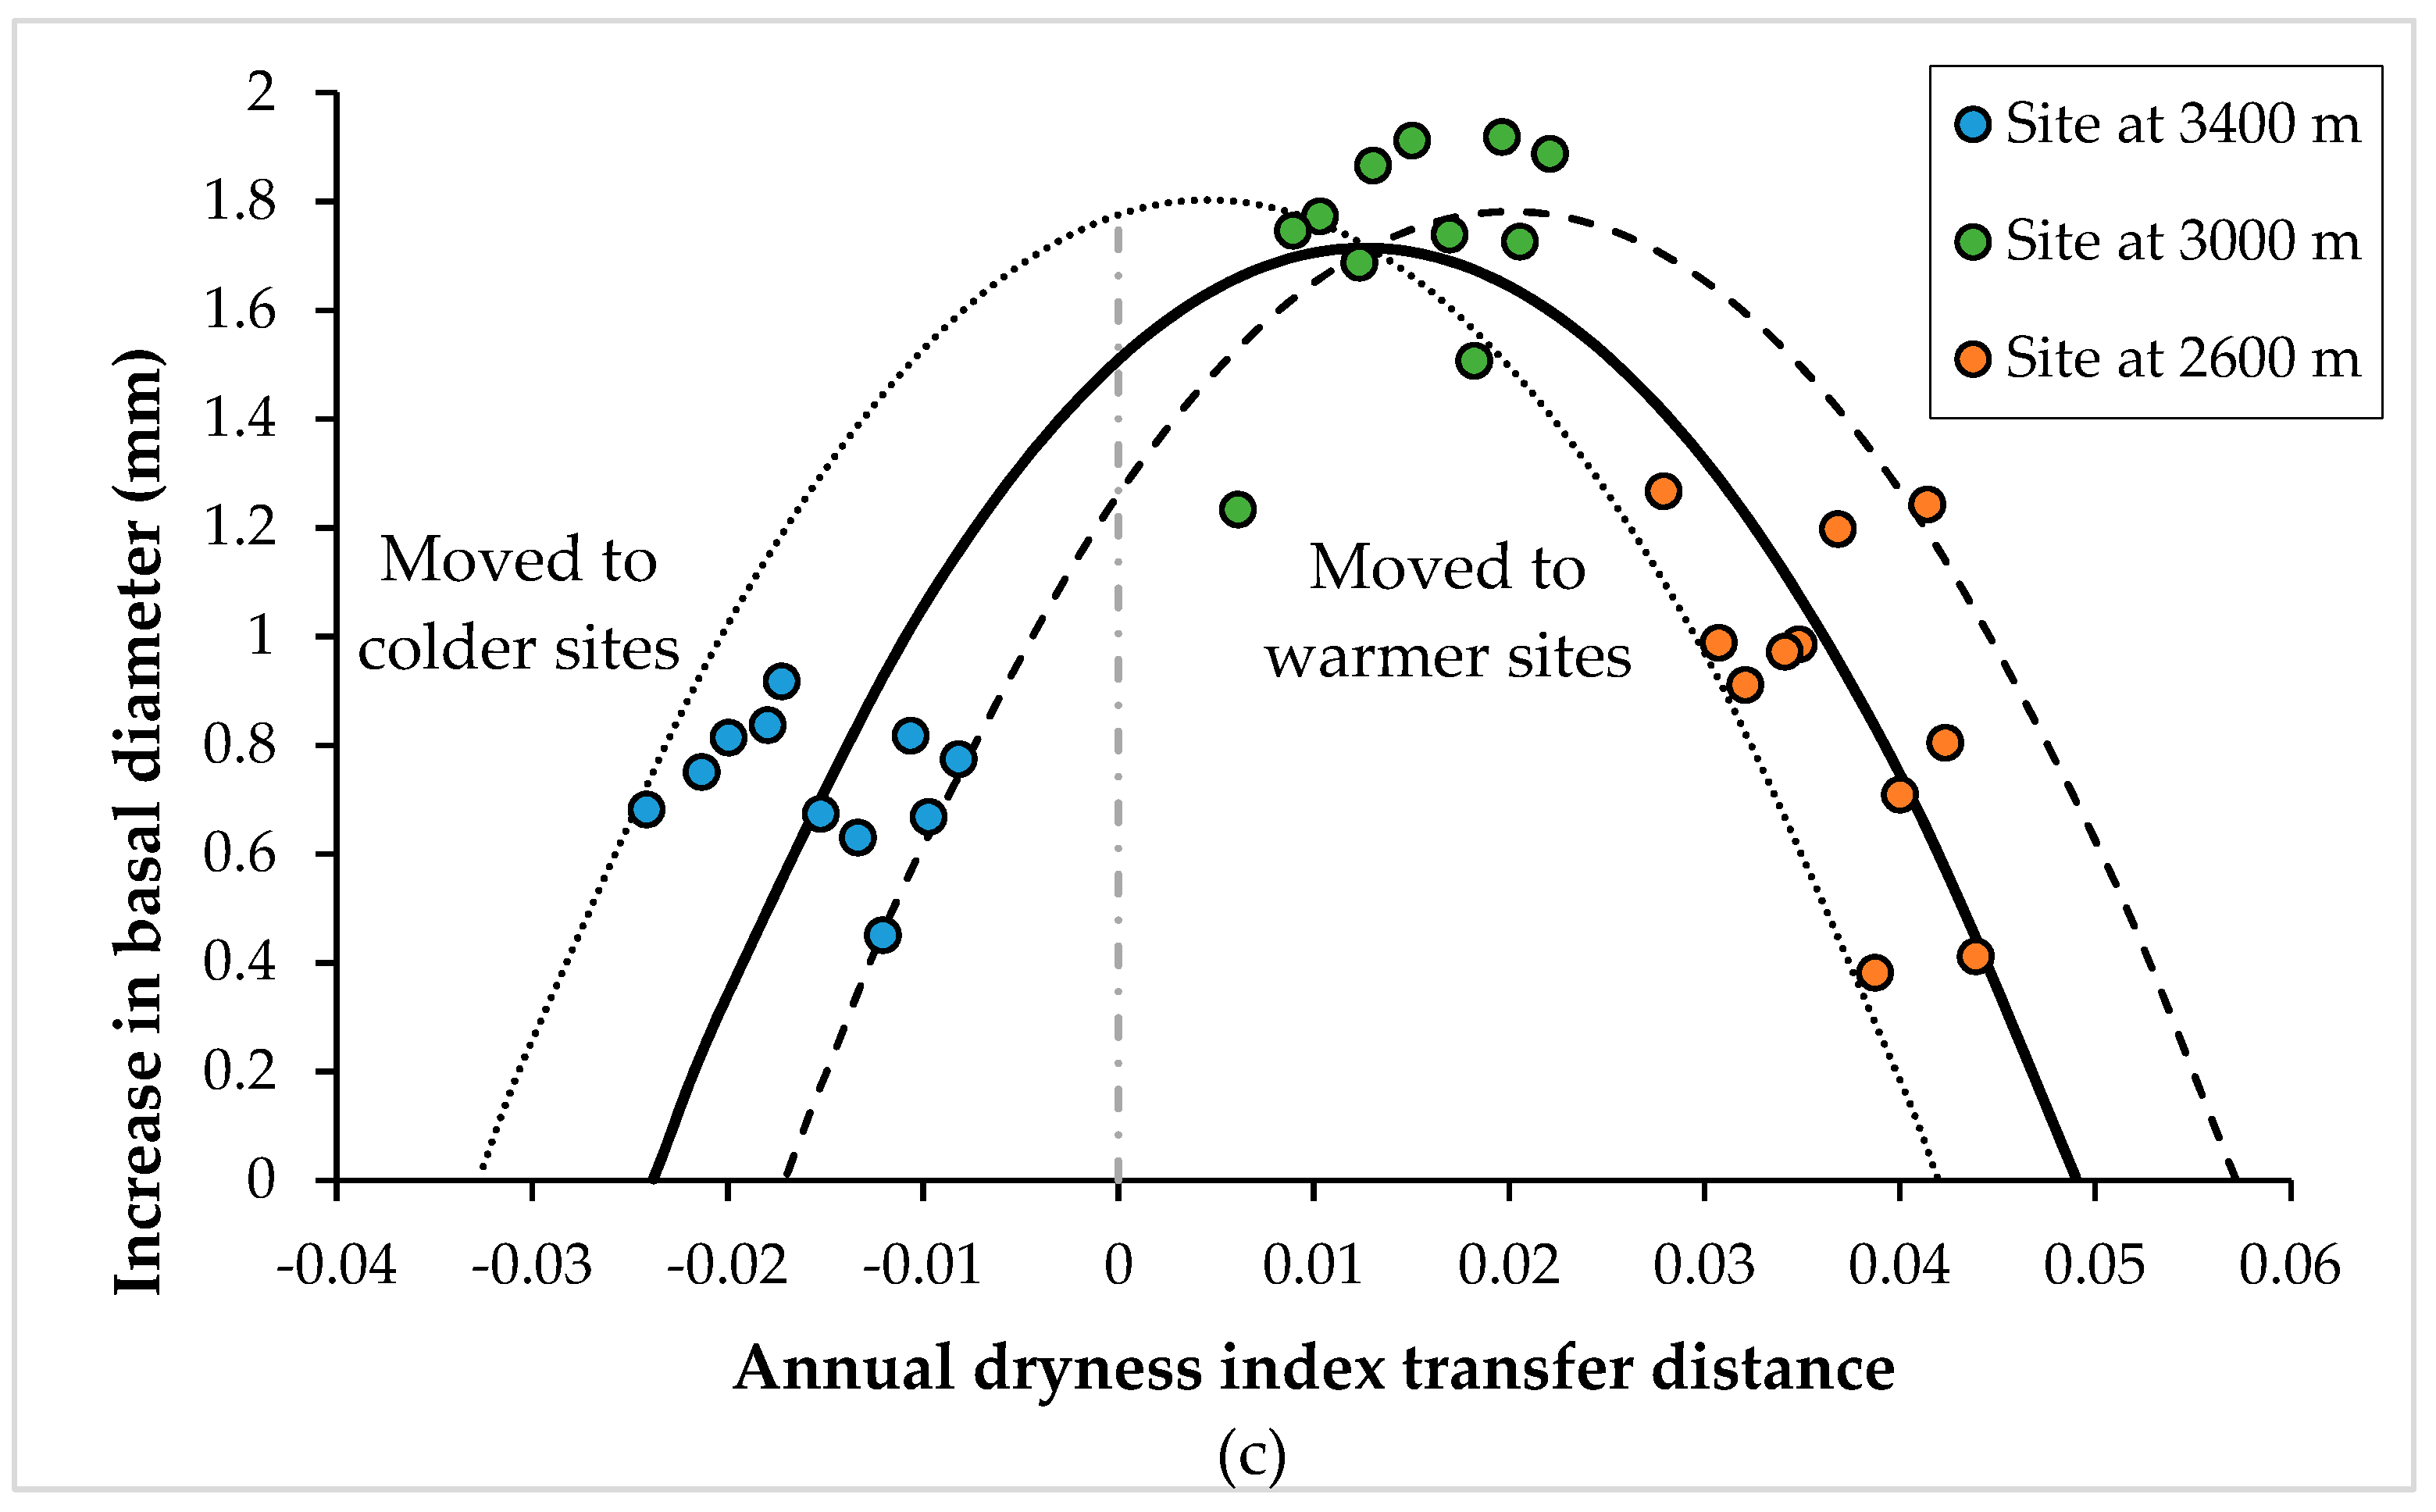
3.1. Climatic Variables That Best Explained the Climatic Transfer Distance Response Function

The survival response function was best explained (lowest AIC value = 1651.1) by the quadratic term of the rainy season dryness index transfer distance (RSDI_td2; p = 0.0112), although the linear term was not significant (p = 0.3542). The other fixed effect terms, the climate of the provenance term selected (warm and dry season dryness index, WDSDI; p = 0.0941) and the interaction between climatic transfer distance and the climate of the provenance (RSDI_td × WDSDI; p = 0.1273), were also not significant. Regarding the random effect terms, only the block nested within the site was significant (p = 0.0252), contributing 21% of the total variance, where 100% is the sum of the contribution of the random terms only (Table 4).
The biomass response function was best explained (lowest AIC value = 2397.2) by the significant linear and quadratic term of the cold and dry season dryness index transfer distance (CDSDI_td, p = 0.0002; CDSDI_td2, p < 0.0001; respectively). The climate of the provenance term selected (warm and dry season dryness index, WDSDI) was also significant (p = 0.0198), as was the interaction CDSDI_td × CDSDI (p = 0.0395). The random effect term that contributed most to the total variance (among the random effects) was block nested within site (p = 0.0196), contributing 7% of the total variance (Table 4).
The increase in basal diameter response function was best explained (lowest AIC value = 1917.3) by the significant linear and quadratic term of the annual dryness index (ADI) transfer distance (p < 0.0001). The climate of the provenance term selected (mean temperature of the coldest month, MTCM) was also significant (p = 0.0036), as was the interaction ADI_td × MTCM (p < 0.0001). The random effect term that most contributed to the total variance was block nested within site (p = 0.0095), contributing 15% of the total variance (Table 4).
The increase in seedling height response function was best explained (lowest AIC value = 5122.4) by RSDI, although, as with transfer distance, it was not significant (linear: p = 0.23; quadratic: p = 0.3517), as well as the climate of the provenance term selected (MMIN, p = 0.1605). Again, only block nested within site was significant (p = 0.0096) among the random terms, contributing 11% of the total variance (results not shown in Table 4 for simplicity).
In all of the four response variables analyzed, site was not significant, and the error term contributed the most among all the random terms (from 79% for survival to 88% for aerial biomass; Table 4).

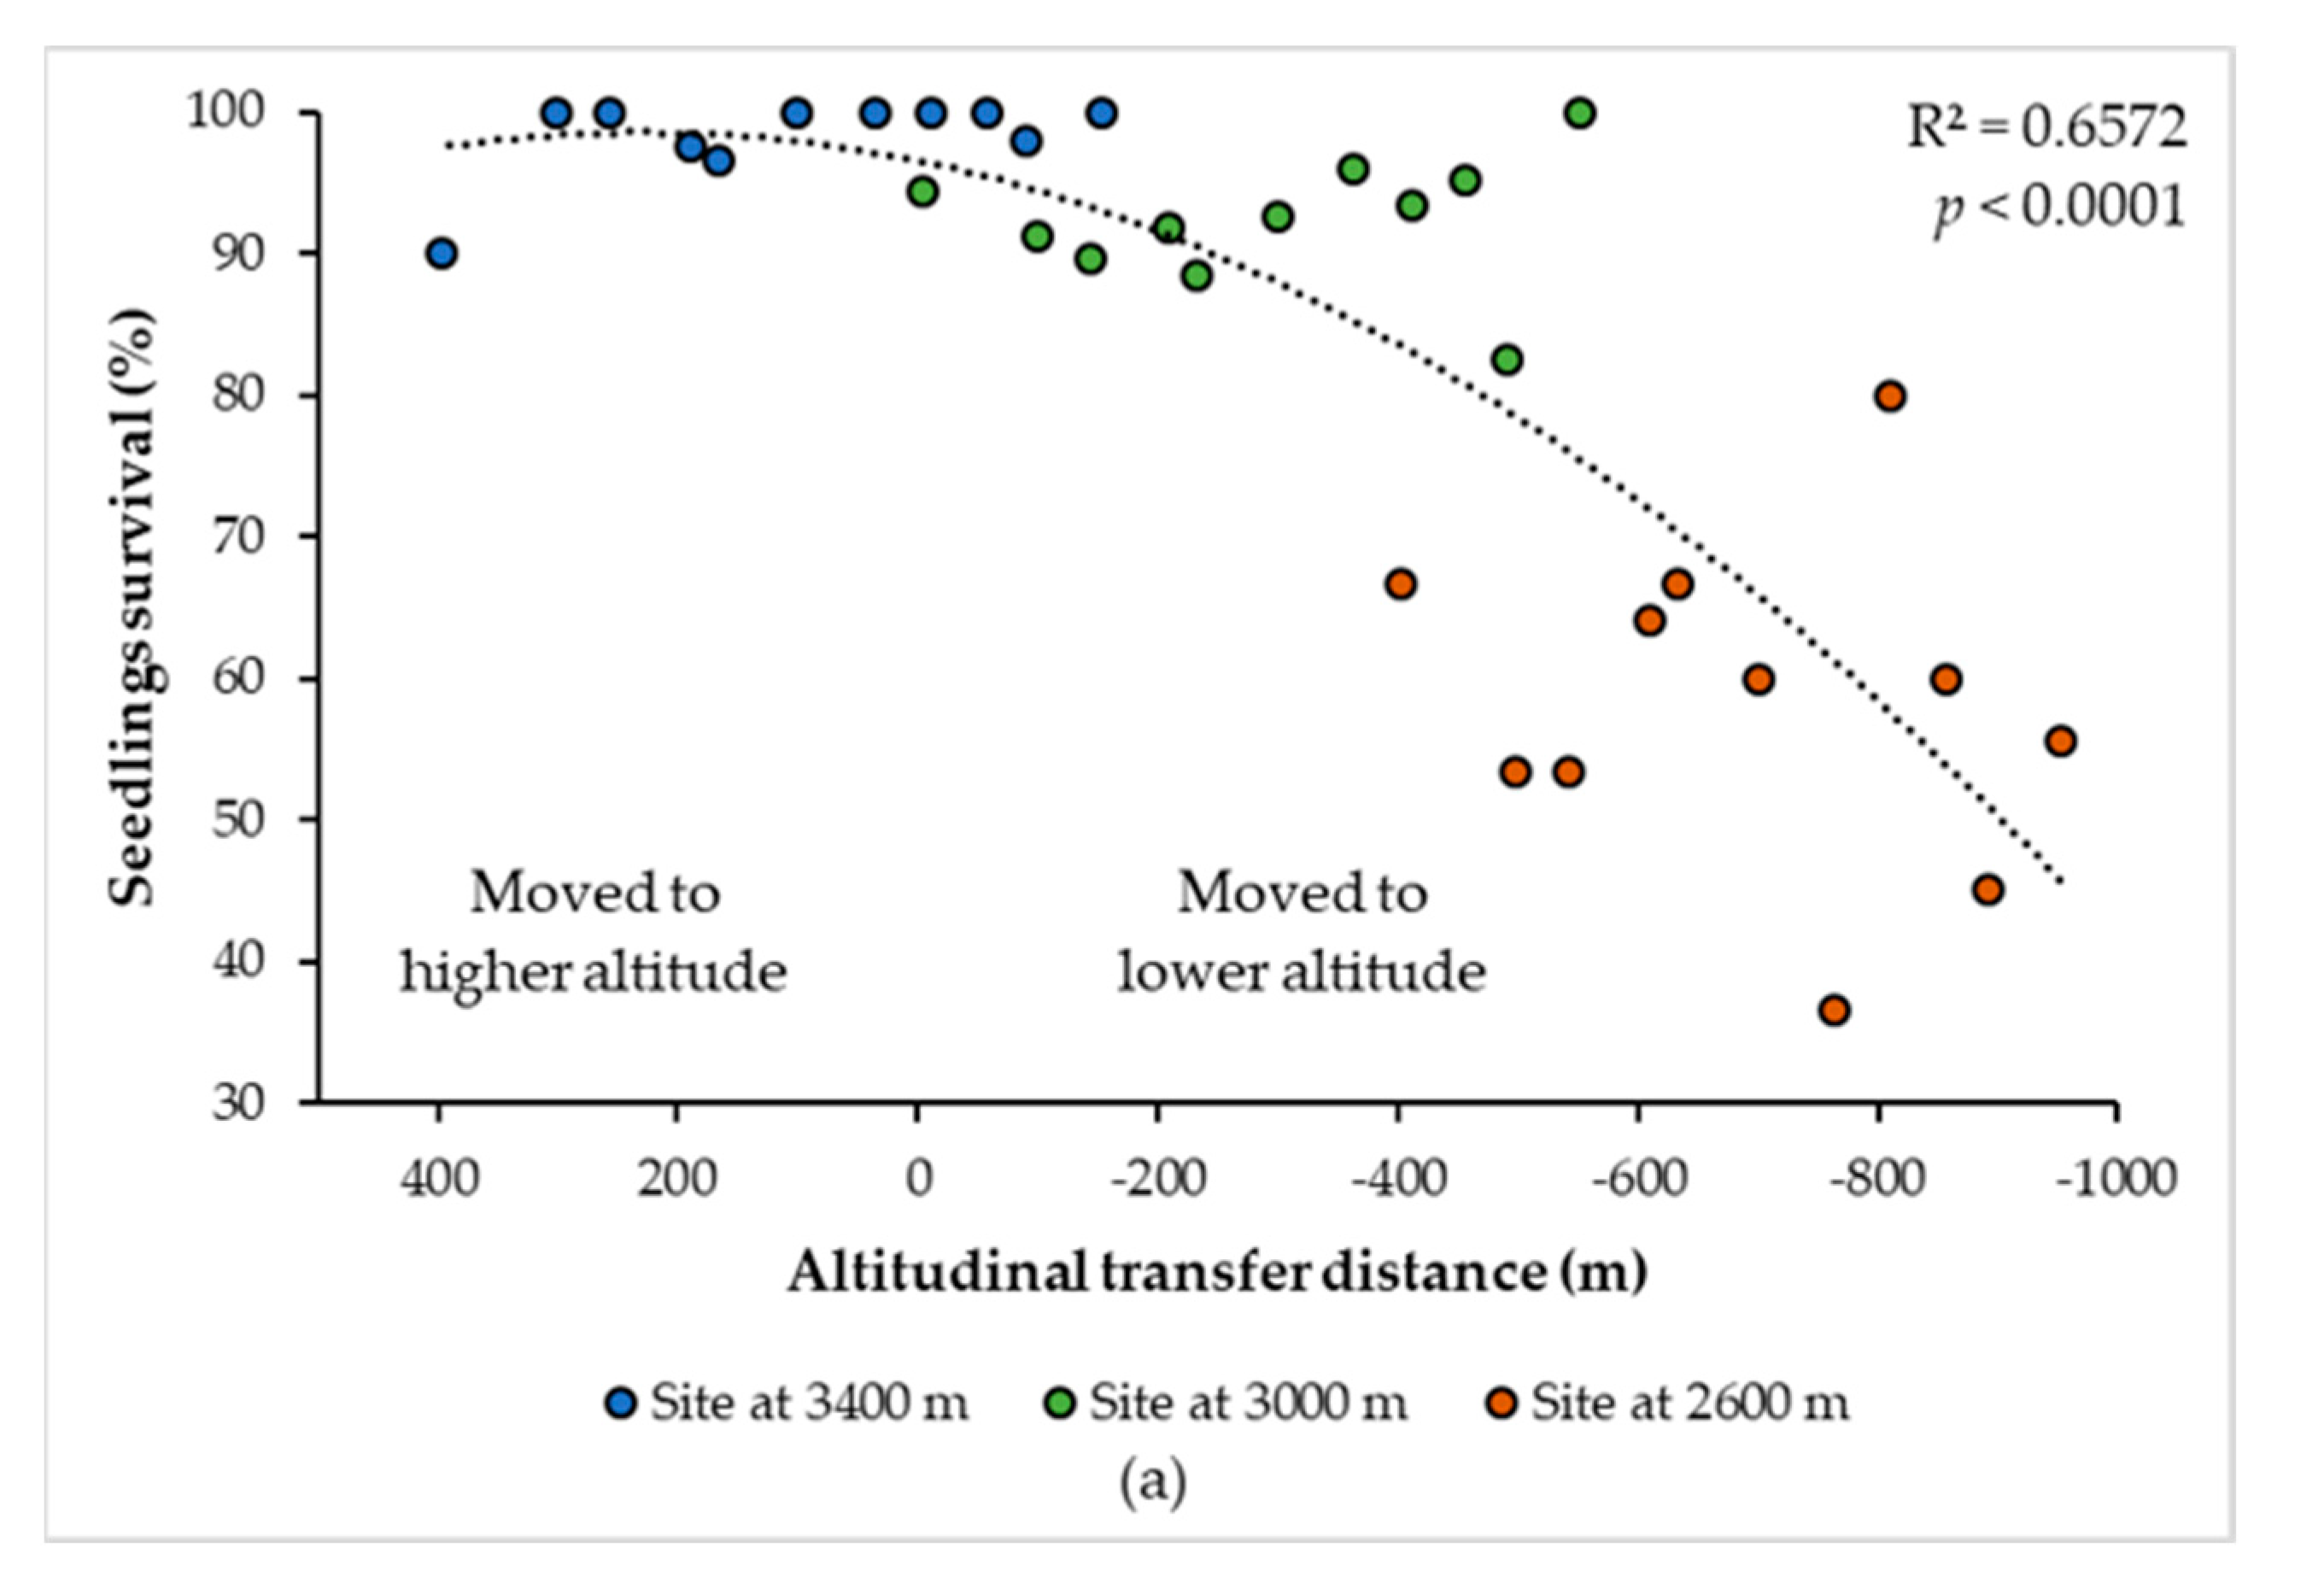
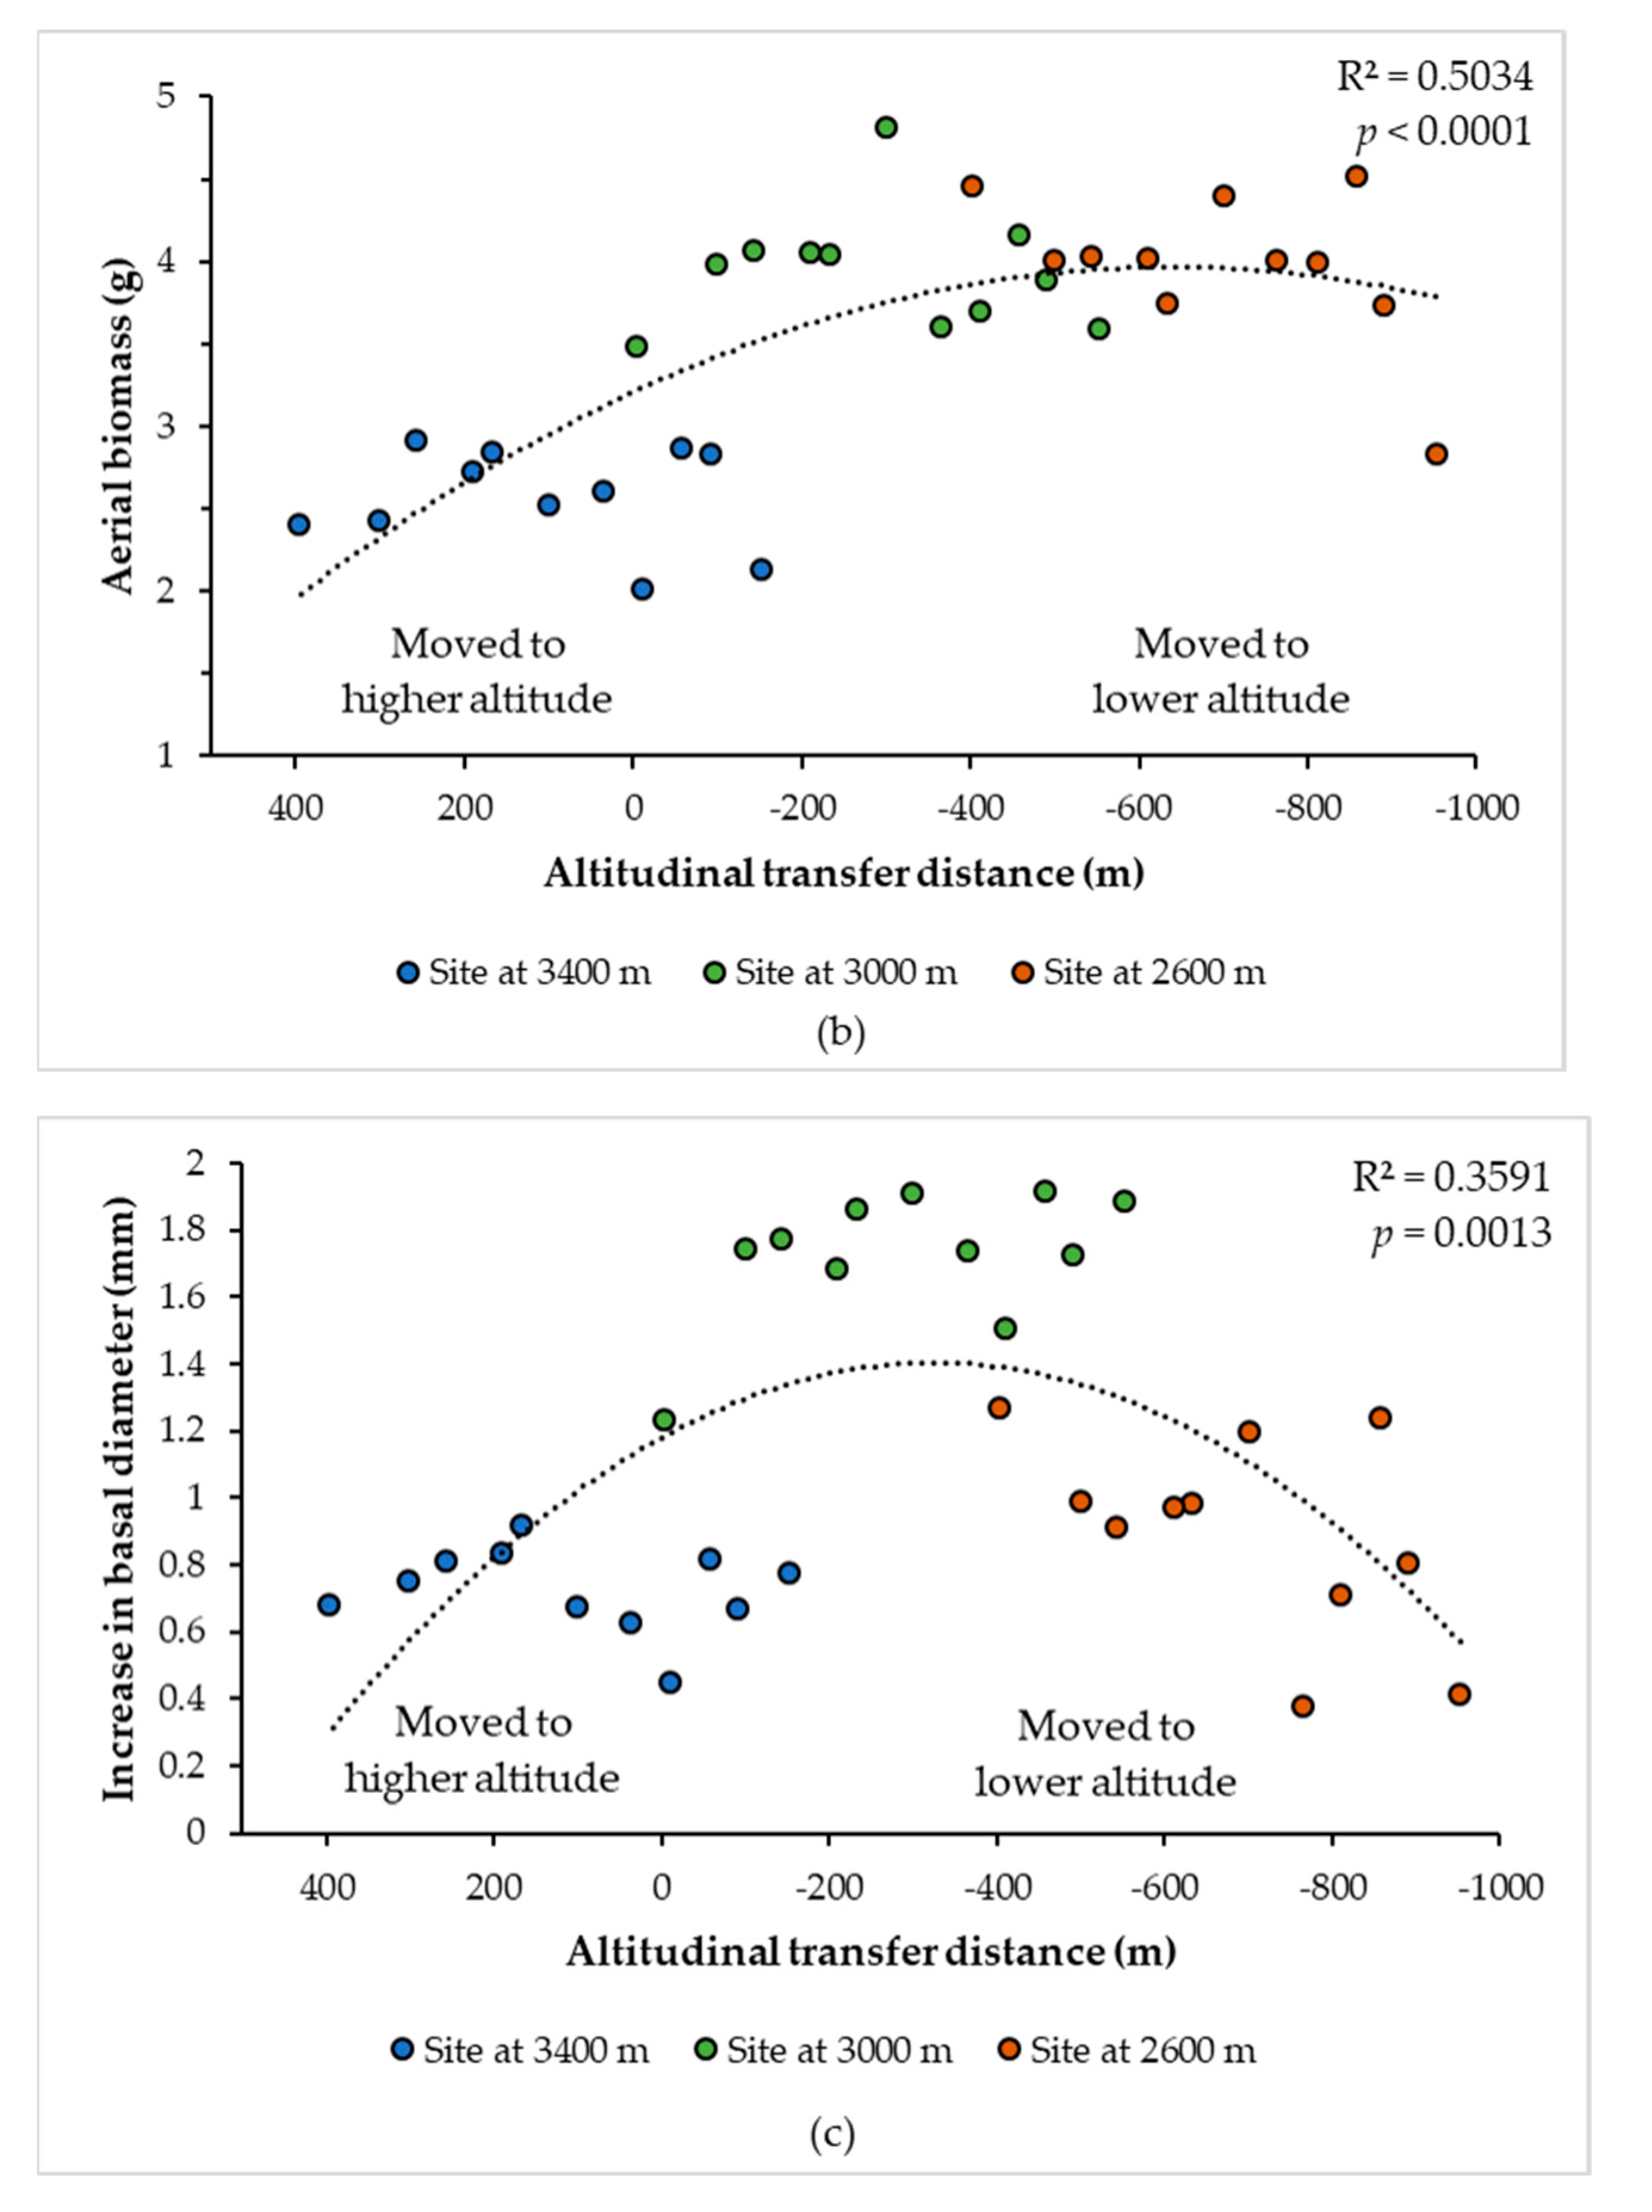
3.2. Curves of Response to the Climatic and Altitudinal Transfer Distance

The predicted response curve for survival indicated that when the seed sources were moved toward warmer and dryer sites (toward lower altitude, right side of the curve in Figure 2a), there is a severe induced mortality. In sharp contrast, when the shift is conducted toward a colder and moister site (to higher altitudes, sites at 3400 m a.s.l.), survival is maintained mostly above 95%. This is even more evident when fitting a simple quadratic regression of survival against altitudinal transfer distance (Figure 3a), where exceeding the 400 m shift to lower altitudes (grossly equivalent to +2 °C, based on a lapse rate of 0.5 °C per 100 m [34]) causes significantly increased mortality. It should also be noted in Figure 2a that the maximum value of the response curve is displaced slightly towards the left side (colder and moister sites), either for the average species curve or for the extreme lower altitudinal population curve. This suggests that the optimum of survival for the species in general, and for the extreme lower population, would be a colder site than that occupied at present.
The predicted response curve for aerial biomass indicated that, when seed sources are moved toward warmer and dryer sites (to a lower altitude, right side of curve the in Figure 2b), there is little negative effect on the growth expressed as aerial biomass: the observed values fluctuated around the maximum predicted value of the curve (about 4.2 g of aerial biomass in dry weight). In contrast, when seed sources are shifted toward colder and moister sites, there is an important loss of accumulated aerial biomass. This becomes more evident when plotting the average biomass per population and per site against the altitudinal transfer distance (Figure 3b).
The predicted response curve for the increase in basal diameter indicated that the greatest growth occurs at a site that is warmer and dryer than that occupied by the populations at present, given that the curves are displaced to the right (Figure 2c). It is also clear that when they are moved toward colder and moister sites (left of the x-axis) or warmer and dryer sites (right side of the x-axis), relative to the optimum, they present a lower growth in basal diameter. The resulting curve regarding altitudinal transfer distance indicated clearly that the optimum growth, for all the provenances in general, was achieved at the site of intermediate elevation (3000 m a.s.l.; Figure 3c).
When comparing the average value across sites for the mean annual temperature and annual precipitation to the average value across sites of the reference period 1961–1990, it is evident that the sites have already increased in temperature (for the observed period) by an average of 0.58 °C, while precipitation has decreased by 27 mm (around 3%) (Table 5).
When plotting seedling mortality, monthly precipitation and mean temperature per site, and comparing among the sites (Figure 4), it is evident that precipitation differences among sites are not particularly large, but seem to have a meaningful effect, nevertheless. The low altitude site (2600 m a.s.l., 1407.4 mm total precipitation in 15 months; Figure 4a), had 16.5% lower total precipitation over the observed period than the site of intermediate altitude (3000 m a.s.l., 1685.14 mm; Figure 4b), while the site of elevated altitude (3400 m a.s.l., 1853.6 mm; Figure 4c) had 9.1% higher total precipitation than the intermediate site. The temporal patterning of the dry/rainy season seems to be similar across the three sites. Surprisingly, the apparently relative minor differences in mean temperature between the sites at 2600 m a.s.l. (14.9 °C averaging across all the 15 months observed) and 3000 m a.s.l. (13.02 °C; 1.9 °C of difference among those two sites), combined with the 16.5% difference in precipitation, seemed to be enough to trigger much higher mortality at the site at 2600 m a.s.l., particularly during the dry months, whether cold and dry (December–February) or warm and dry (March–May; Figure 4a). Moreover, an unexpected and relatively high mortality occurred just after the rainy season abruptly ended in October 2020 (Figure 4a), suggesting that several seedlings were already debilitated before the rainy season, perhaps subsequently expressing a drought stress legacy effect after the rainy season. In sharp contrast, seedling mortality at the site at 3400 m a.s.l., which was much colder and only 9.1% more rainy than the intermediate site, was nearly zero (Figure 4c).

4. Discussion

The most statistically significant climatic variables in terms of the response of survival and growth in A. religiosa seedlings to the climatic transfer distance were, in all cases, the balance between the temperature useful to growth (degree days above 5 °C) and available precipitation. That balance, expressed as dryness indices in our analysis, varied only in different seasons for the response variables: the rainy season (June–October) dryness index transfer distance was critical for survival, while that of the cold and dry season (November–February) was critical for aerial biomass, and the annual index was critical for the increase in basal diameter.
The effect of climatic transfer distance was much more negative (in terms of seedling survival) when transferring toward warmer and dryer sites, than when shifting to colder and moister sites. Apparently, there is a critical threshold that, when crossed, triggers mortality: a shift to a site 400 m lower in altitude, equivalent to +2 °C considering an overall lapse rate [34], or a difference of +1.9 °C based on the observed months, or a reduction in precipitation of 16%.
Most of the seedling mortality at the low altitude site (2600 m a.s.l.) occurred during the dry season (December–May). This is consistent with previous observations of a high mortality of emergent seedlings of natural regeneration in the core zone of the Monarch Butterfly Biosphere Reserve (MBBR) [29], and seems to support the projected decrease in climatic habitat suitable for A. religiosa inside the MBBR as a result of climatic change [26,30,49,50,51]. The apparent reason for the observed timing of this mortality is that the dry season was as dry as always, perhaps a little more so, but was warmer due to the ongoing climatic change. It was surprising to us that the relatively small differences in temperatures and precipitation between the sites at 2600 m a.s.l. and 3000 m a.s.l. made such a large difference to survival. Thus, the amount of residual moisture in the soil during the dry season, following the rainy season of the previous year, seems to be critical for survival of the young seedlings.
The high survival (around 95%) of the seed sources shifted to higher altitudes than their origin (to the site at 3400 m a.s.l.) confirms the viability of assisted migration to higher altitudes in the Trans-Mexican Volcanic Belt as a management measure for consideration, in order to reduce the projected impacts of climatic change, as shown in previous field tests [33].
Suitable climatic habitat projections for the 2060 decade, under intermediate greenhouse emission scenarios (RCP 6.0 watts/m2), indicate that it is required to shift the A. religiosa seed sources upwards in altitude by between 300 and 500 m in order to realign the populations with the climate to which they are adapted [30]. Our evidence that is safe to move these sources upwards in altitude by 400 m therefore supports such a management proposal.
The mean temperature of the coldest month (MTCM) was the most important climate variable at the seed source for the increase in basal diameter. This indicates that genetic differentiation among populations for growth potential is shaped by the cold temperatures, at least in our case for those seedlings that survived the dry season. This is consistent with previous patterns of genetic variation among A. religiosa populations along altitudinal clines demonstrated in a common garden test under optimal conditions, where MTCM was also found to be the climatic variable that best explained the differences among populations [20].
Aerial biomass necessarily had to be measured, at the end of the observation period, in live plants that had survived the transfer toward warmer and dryer sites. It is therefore likely that those seedlings might have had some resistance or tolerance to the drought stress, and growing in a site with higher temperature (2600 m a.s.l.), they were able to grow more. In contrast, although the proportion of seedlings that survived in those that were transferred to a colder and moister site was higher (as in Figure 2a), growth was likely limited by the colder temperatures.

Implications for Management of Abies religiosa Inside the MBBR

The results indicate that increased temperatures and reduced precipitation due to climatic change would undoubtedly have a negative impact on the recruitment of A. religiosa seedlings at the lower altitudinal limits of the natural distribution range of the species, through increased mortality during the dry season (December–May). Active ecological restoration efforts in the MBBR must therefore consider how to increase the survival of planted A. religiosa seedlings in order to restore perturbed sites and ensure the maintenance of the monarch butterfly overwintering sites. In this context, perturbed sites at the low altitude of the natural range distribution of A. religiosa should have priority. Actions should include: (a) conducting reforestation using local shrubs (such as Baccharis conferta or other native understory species) as nurse plants for the A. religiosa seedlings [33]; and (b) conducting assisted migration to higher altitudes to realign A. religiosa populations with the climate to which they are adapted. Previous estimates regarding such realignment, targeting the climate projected for the 2030 decade, have suggested an upwards shift in altitude of 350 m [20]. The results of the present study suggest that it is safe to shift up to 400 m upwards in altitude, in terms of good seedling survival. Thus, an upward shift of between 350 and 400 m in altitude seems to be advisable. If such action is not undertaken, the lack of recruitment of natural regeneration seedlings is likely to continue as a result of the high mortality of young seedlings at lower altitudes (as demonstrated by ref [29]), impeding the natural renewal of adult A. religiosa trees within the MBBR, which will endanger the monarch butterfly overwintering sites in the long term.

5. Conclusions

The balance between the seasonal temperature available for growth (degree days > 5 °C) and the available precipitation is a determining factor for the permanence of A. religiosa, because the survival of young seedlings depends on the residual humidity of the soil during the dry season, following the rainy season of the previous year. A 2 °C increase in temperature and a 16% decrease in precipitation would imply a high mortality rate (~45%), negatively impacting the recruitment of naturally regenerating seedlings, mainly at the lower altitudinal limit of the natural distribution of the species. These results suggest that an upward movement of 400 m in altitude, through assisted migration, will have positive effects on the survival of A. religiosa seedlings, re-coupling the populations to the climate to which they are adapted and increasing the possibility of maintaining the overwintering sites of the monarch butterfly.

Author Contributions

C.S.-R., A.L.C.-V., A.B.-G. and R.L.-C. conceived the research project. A.B.-G. carried out the seed collection. A.L.C.-V., A.B.-G., M.G.-R. and C.S.-R. produced the seedlings and conducted the field experiments. A.L.C.-V. and C.S.-R. took measurements, determined the statistical analyses, and generated the response curves. R.L.-C., M.G.-R., L.L.-T. and E.d.l.B. provided important suggestions during the development of the project and for the data discussion. A.L.C.-V. and C.S.-R. led the writing of the manuscript. All authors have read and agreed to the published version of the manuscript.

Funding

Financial support was provided to C.S.-R. by The Monarch Butterfly Fund (Madison, WI, USA), the Mexican Fund for the Conservation of Nature and United States Forest Service USDA (funded by the U.S. Agency for International Development), the Fondo de Conservación del Eje Neovolcánico A.C., the American Forests (USA), the Forest Genetic Resources Working Group of the North American Forestry Commission (FAO) and the UMSNH Coordinación de la Investigación Científica; the Basic Research Fund of the Mexican Council of Science and Technology (CONACYT) (Ciencia Básica-2014-242985) was provided to A.B.-G.; the PAPIIT program (IN116218) of UNAM was provided to R.L.-C.; and a CONACyT graduate studies fellowship was provided to A.L.C.-V. (733822).

Institutional Review Board Statement

Not applicable.

Informed Consent Statement

Not applicable.

Data Availability Statement

The data presented in this study are available on request from the corresponding author.

Acknowledgments

This paper is an undertaking of the Forest Genetic Resources Working Group (FGRWG)/North American Forest Commission/Food and Agricultural Organization of the United Nations. We thank Francisco Ramírez-Cruz (deceased), Doña Petra Cruz-Cruz, Francisca Ramírez-Cruz, and A. Belén Luis-Ramírez for providing numerous facilities for seed collection, seedling nursery production, common garden test planting, maintenance and measurements at Ejido La Mesa, Municipality of San José del Rincón, Estado de México; without their help, this study would not have been possible. Thanks also go to Esmeralda Navarro-Miranda, Cecilia Zamora-Sánchez, Erika Gómez-Pineda, Verónica Osuna-Vallejo, Adanely Jiménez-Villegas, J. Sinaí Ávalos-Montes, Patricia Herrejón-Calderón and other UMSNH students for assistance in the maintenance and measurement of the nursery and field experiments. Special thanks go to Gerald E. Rehfeldt (USDA—Forest Service, Moscow, Idaho) for advice on the experimental design and data analysis. Keith MacMillan provided assistance with the English writing.

Conflicts of Interest

The authors declare no conflict of interest.

References

  1. Jia, G.; Shevliakova, E.; Artaxo, P.; De Noblet-Ducoudré, N.; Houghton, R.; House, J.; Kitajima, K.; Lennard, C.; Popp, A.; Sirin, A.; et al. Land–Climate Interactions. In Climate Change and Land: An Ipcc Special Report on Climate Change, Desertification, Land Degradation, Sustainable Land Management, Food Security, and Greenhouse Gas Fluxes in Terrestrial Ecosystems; Shukla, P.R., Skea, J., Calvo Buendia, E., Masson-Delmotte, V., Pörtner, H.-O., Roberts, D.C., Zhai, P., Slade, R., Connors, S., van Diemen, R., et al., Eds.; Cambridge University Press: Cambridge, UK; New York, NY, USA, 2019; pp. 1–186. [Google Scholar]
  2. Pearson, R.G.; Dawson, T.P. Predicting the impacts of climate change on the distribution of species: Are bioclimate envelope models useful? Glob. Ecol. Biogeogr. 2003, 12, 361–371. [Google Scholar] [CrossRef] [Green Version]
  3. Rehfeldt, G.E.; Leites, L.P.; Joyce, D.G.; Weiskittel, A.R. Role of population genetics in guiding ecological responses to climate. Glob. Chang. Biol. 2017, 24, 858–868. [Google Scholar] [CrossRef] [PubMed]
  4. Matias, L. Changes in the distribution limits of tree species as a consequence of climate variations. Ecosistemas 2012, 21, 91–96. [Google Scholar] [CrossRef] [Green Version]
  5. Hedhly, A.; Hormaza, J.I.; Herrero, M. Global warming and sexual plant reproduction. Trends Plant Sci. 2009, 14, 30–36. [Google Scholar] [CrossRef] [PubMed]
  6. Alfaro, R.I.; Fady, B.; Vendramin, G.G.; Dawson, I.K.; Fleming, R.A.; Sáenz-Romero, C.; Lindig-Cisneros, R.A.; Murdock, T.; Vinceti, B.; Navarro, C.M.; et al. The role of forest genetic resources in responding to biotic and abiotic factors in the context of anthropogenic climate change. For. Ecol. Manag. 2014, 333, 76–87. [Google Scholar] [CrossRef]
  7. Rubin-Aguirre, A.; Sáenz-Romero, C.; Lindig-Cisneros, R.; del-Rio-Mora, A.; Tena-Morelos, C.; Campos-Bolaños, R.; del-Val, E. Bark beetle pests in an altitudinal gradient of a Mexican managed forest. For. Ecol. Manag. 2015, 343, 73–79. [Google Scholar] [CrossRef]
  8. del-Val, E.; Sáenz-Romero, C. Bark-beetles (Coleoptera: Curculionidae) and climate change: Current situation and perspectives for temperate forests. TIP Rev. Espec. Cienc. Químico Biológicas 2017, 20, 53–60. [Google Scholar] [CrossRef] [Green Version]
  9. Valenzuela, P.L.; López-García, J. Detection of trees damaged by pests in Abies religiosa forests in the Monarch Butterfly Biosphere reserve using infrared aerial photography. Investig. Geográficas 2017, 1–12. [Google Scholar] [CrossRef]
  10. Morales-Rangel, A.; Cambrón-Sandoval, V.H.; Soto-Correa, J.C.; Jones, R.W.; Obregón-Zúñiga, J.A. Temperature effect in populations of Dendroctonus frontalis Zimmerman and Dendroctonus mexicanus Hopkins (Coleoptera: Curculionidae: Scolytinae) under a climate change scenario in Sierra Gorda queretana. Acta Zoológica Mex. 2018, 34, 1–8. [Google Scholar] [CrossRef]
  11. Flores-Nieves, P.; López-López, M.Á.; Ángeles-Pérez, G.; de la Isla-Serrano, M.d.L.; Calva-Vásquez, G. Biomass estimation and distribution models of Abies religiosa (Kunth) Schltdl. et Cham. In decline. Rev. Mex. Cienc. For. 2011, 2, 9–20. [Google Scholar]
  12. Allen, C.D.; Breshears, D.D.; McDowell, N.G. On underestimation of global vulnerability to tree mortality and forest die-off from hotter drought in the Anthropocene. Ecosphere 2015, 6, 1–55. [Google Scholar] [CrossRef]
  13. Mátyás, C.; Vendramin, G.G.; Fady, B. Forests at the limit: Evolutionary–genetic consequences of environmental changes at the receding (xeric) edge of distribution. Report from a research workshop. Ann. For. Sci. 2009, 66, 800. [Google Scholar] [CrossRef]
  14. Mátyás, C. Forecasts needed for retreating forests. Nature 2010, 464, 1271. [Google Scholar] [CrossRef] [PubMed]
  15. Rehfeldt, G.E.; Wykoff, W.R.; Ying, C.C. Physiologic plasticity, evolution, and impacts of a changing climate on Pinus contorta. Clim. Chang. 2001, 50, 355–376. [Google Scholar]
  16. Leites, L.P.; Rehfeldt, G.E.; Robinson, A.P.; Crookston, N.L.; Jaquish, B. Possibilities and limitations of using historic provenance tests to infer forest species growth responses to climate change. Nat. Resour. Model. 2012, 25, 409–433. [Google Scholar] [CrossRef]
  17. Rehfeldt, G.E. Ecological Genetics of Pinus contorta from the Rocky Mountains (USA): A Synthesis. Silvae Genet. 1988, 37, 3–4. [Google Scholar]
  18. Rehfeldt, G. A model of genetic variation for Pinus ponderosa in the Inland Northwest (USA): Applications in gene resource management. Can. J. For. Res. 1991, 21, 1491–1500. [Google Scholar] [CrossRef]
  19. Ruiz-Talonia, L.; Sánchez-Vargas, N.; Bayuelo-Jiménez, J.; Lara-Cabrera, S.; Sáenz-Romero, C. Altitudinal genetic variation among native Pinus patula provenances: Performance in two locations, seed zone delineation and adaptation to climate change. Silvae Genet. 2014, 63, 139–148. [Google Scholar] [CrossRef] [Green Version]
  20. Ortiz-Bibian, M.; Blanco-García, A.; Lindig-Cisneros, R.; Gómez-Romero, M.; Castellanos-Acuña, D.; Herrerías-Diego, Y.; Sánchez-Vargas, N.; Sáenz-Romero, C. Genetic variation in Abies religiosa for quantitative traits and delineation of elevational and climatic zoning for maintaining monarch butterfly overwintering sites in Mexico, considering climatic change. Silvae Genet. 2017, 66, 14–23. [Google Scholar] [CrossRef] [Green Version]
  21. Zobel, B.; Talbert, J. Applied Forest Tree Improvement; John Wiley & Sons: North Carolina State Univ., NC, USA, 1984. [Google Scholar]
  22. Viveros-Viveros, H.; Sáenz-Romero, C.; López-Upton, J.; Vargas-Hernández, J.J. Growth and frost damage variation among Pinus pseudostrobus, P. montezumae and P. hartwegii tested in Michoacán, México. For. Ecol. Manag. 2007, 253, 81–88. [Google Scholar] [CrossRef]
  23. Sáenz-Romero, C.; Tapia-Olivares, B. Genetic variation in frost damage and seed zone delineation within an altitudinal transect of Pinus devoniana (P. michoacana) in Mexico. Silvae Genet. 2008, 57, 165–170. [Google Scholar] [CrossRef] [Green Version]
  24. Loya-Rebollar, E.; Sáenz-Romero, C.; Lindig-Cisneros, R.; Lobit, P.; Villegas-Moreno, J.; Sánchez-Vargas, N. Clinal variation in Pinus hartwegii populations and its application for adaptation to climate change. Silvae Genet. 2013, 62, 86–95. [Google Scholar] [CrossRef] [Green Version]
  25. Oberhauser, K.; Peterson, A.T. Modeling current and future potential wintering distributions of eastern North American monarch butterflies. Proc. Natl. Acad. Sci. USA 2003, 100, 14063–14068. [Google Scholar] [CrossRef] [Green Version]
  26. Sáenz-Romero, C.; Rehfeldt, G.E.; Duval, P.; Lindig-Cisneros, R.A. Abies religiosa habitat prediction in climatic change scenarios and implications for monarch butterfly conservation in Mexico. For. Ecol. Manag. 2012, 275, 98–106. [Google Scholar] [CrossRef]
  27. de Pascual Pola, C.N.; Musálem, M.Á.; Ortega-Alcalá, J. Study of some characteristics of cones and seeds of Abies religiosa (HBK) Schl. et Cham. Agrociencia 2003, 37, 521–531. Available online: http://www.redalyc.org/articulo.oa?id=30237509 (accessed on 10 August 2020).
  28. Ortiz-Bibian, M.A.; Castellanos-Acuña, D.; Gómez-Romero, M.; Lindig-Cisneros, R.; Silva-Farías, M.Á.; Sáenz-Romero, C. Variation among Abies religiosa (H.B.K.) Schl. et Cham populations along an altitudinal gradient. I. Seed germination capacity. Rev. Fitotec. Mex. 2019, 42, 301–308. [Google Scholar]
  29. Guzmán-Aguilar, G.; Carbajal-Navarro, A.; Sáenz-Romero, C.; Herrerías-Diego, Y.; López-Toledo, L.; Blanco-García, A. Abies religiosa seedling limitations for passive restoration practices at the Monarch Butterfly Biosphere Reserve in Mexico. Front. Ecol. Evol. 2020, 8, 1–10. [Google Scholar] [CrossRef]
  30. Gómez-Pineda, E.; Sáenz-Romero, C.; Ortega-Rodríguez, J.M.; Blanco-García, A.; Madrigal-Sánchez, X.; Lindig-Cisneros, R.; López-Toledo, L.; Pedraza-Santos, M.E.; Rehfeldt, G.E. Suitable climatic habitat changes for Mexican conifers along altitudinal gradients under climatic change scenarios. Ecol. Appl. 2020, 30, e02041. [Google Scholar] [CrossRef] [PubMed]
  31. Lenoir, J.; Gégout, J.-C.; Marquet, P.; De Ruffray, P.; Brisse, H. A significant upward shift in plant species optimum elevation during the 20th century. Science 2008, 320, 1768–1771. [Google Scholar] [CrossRef] [PubMed]
  32. Jump, A.S.; Mátyás, C.; Peñuelas, J. The altitude-for-latitude disparity in the range retractions of woody species. Trends Ecol. Evol. 2009, 24, 694–701. [Google Scholar] [CrossRef] [Green Version]
  33. Carbajal-Navarro, A.; Navarro-Miranda, E.; Blanco-García, A.; Cruzado-Vargas, A.L.; Gómez-Pineda, E.; Zamora-Sánchez, C.; Pineda-García, F.; O’Neill, G.; Gómez-Romero, M.; Lindig-Cisneros, R.; et al. Ecological restoration of Abies religiosa forests using nurse plants and assisted migration in the Monarch Butterfly Biosphere Reserve, Mexico. Front. Ecol. Evol. 2019, 7, 421. [Google Scholar] [CrossRef] [Green Version]
  34. Sáenz-Romero, C.; Rehfeldt, G.E.; Crookston, N.L.; Duval, P.; St-Amant, R.; Beaulieu, J.; Richardson, B.A. Spline models of contemporary, 2030, 2060 and 2090 climates for Mexico and their use in understanding climate-change impacts on the vegetation. Clim. Chang. 2010, 102, 595–623. [Google Scholar] [CrossRef]
  35. Vargas, A.L.C. Variation of quantitative Characters between Procedures of Abies religiosa Originated in the Altitudinal Gradient in the Reserve of the Biosphere of the Monarch Butterfly: Stage of Vivero. Master’s Thesis, Universidad Autónoma Chapingo, Texcoco de Mora, Estado de México, México, 2017. Available online: http://repositorio.chapingo.edu.mx:8080/bitstream/handle/20.500.12098/425/mccf-cval_17.pdf?sequence=1&isAllowed=y (accessed on 15 August 2020).
  36. Sánchez, C.Z. Variación Genética en Abies religiosa (Kunth) Schltdl. et Cham. a lo Largo de un Gradiente Altitudinal en Respuesta al Estrés por Sequía. Master’s Thesis, Universidad Michoacana de San Nicolás de Hidalgo, Morelia, Michoacán, México, 2020. Available online: http://bibliotecavirtual.dgb.umich.mx:8083/xmlui/bitstream/handle/DGB_UMICH/1912/IIAF-M-2020-0195.pdf?sequence=1&isAllowed=y (accessed on 15 August 2020).
  37. Sáenz-Ceja, J.E.; Pérez-Salicrup, D.R. Modification of fire regimes inferred from the age structure of two conifer species in a tropical montane forest, Mexico. Forests 2020, 11, 1193. [Google Scholar] [CrossRef]
  38. Flores-Martínez, J.J.; Martínez-Pacheco, A.; Rendón-Salinas, E.; Rickards, J.; Sarkar, S.; Sánchez-Cordero, V. Recent forest cover loss in the core zones of the Monarch Butterfly Biosphere Reserve in Mexico. Front. Environ. Sci. 2019, 7, 167. [Google Scholar] [CrossRef]
  39. Prieto-Ruíz, J.A.; Bustamante-García, V.; Muñoz-Flores, H.J.; Álvarez-Zagoya, R. Análisis de conos y semillas en coníferas. In Técnicas en el Manejo Sustentable de los Recursos Naturales; Ocañas, F.G., González, J.A.G., Mendoza, H.V., Parra, A.C., Eds.; Facultad de Ciencias Forestales, Universidad Autónoma de Nuevo León: Monterrey, Mexico, 2014; pp. 27–44. [Google Scholar]
  40. Research on Forest Climate Change: Potential Effects of Global Warming on Forests and Plant Climate Relationships in Western North America and Mexico. Available online: http://charcoal.cnre.vt.edu/climate/ (accessed on 1 November 2020).
  41. Arriola, P.; Flores, G.; Gijón, H.; Pineda, O.; Jacob, C.; de Pascual, P.N. Producción de Planta de Abies Religiosa (Kunth) Schltdl. & Cham. en Vivero; Folleto Técnico Núm 19; CENID-COMEF, INIFAP: Ciudad de México, Mexico, 2015. [Google Scholar]
  42. Martinez-Luna, J.E.; Carrillo-Anzures, F.; Acosta-Mireles, M.; Sánchez, M.E.R.; Perez-Miranda, R. Allometric equations to estimate carbon in seedlings of Pinus hartwegii Lindl. Rev. Mex. Cienc. For. 2020, 11, 11. [Google Scholar] [CrossRef]
  43. SAS Institute. SAS/STAT (Version 9.4) Computer Software; SAS Institute Inc.: Cary, NC, USA, 2014. [Google Scholar]
  44. SAS Institute. Base SAS 9.4 Procedures Guide, 5th ed.; SAS Institute Inc.: Cary, NC, USA, 2015. [Google Scholar]
  45. Sáenz-Romero, C.; Rehfeldt, G.E.; Ortega-Rodríguez, J.M.; Marín-Togo, M.C.; Madrigal-Sánchez, X. Pinus leiophylla suitable habitat for 1961–1990 and future climate. Bot. Sci. 2015, 93, 709–718. [Google Scholar] [CrossRef] [Green Version]
  46. Sáenz-Romero, C.; Lamy, J.B.; Ducousso, A.; Musch, B.; Ehrenmann, F.; Delzon, S.; Cavers, S.; Chałupka, W.; Dağdaş, S.; Hansen, J.K.; et al. Adaptive and plastic responses of Quercus petraea populations to climate across Europe. Glob. Chang. Biol. 2017, 23, 2831–2847. [Google Scholar] [CrossRef] [Green Version]
  47. Mátyás, C. Modeling climate change effects with provenance test data. Tree Physiol. 1994, 14, 797–804. [Google Scholar] [CrossRef] [Green Version]
  48. Leites, L.P.; Robinson, A.P.; Rehfeldt, G.E.; Marshall, J.D.; Crookston, N.L. Height-growth response to climatic changes differs among populations of Douglas-fir: A novel analysis of historic data. Ecol. Appl. 2012, 22, 154–165. [Google Scholar] [CrossRef]
  49. Miranda, R.P.; Sánchez, F.M.; Hernández, A.G.; Padilla, V.J.A. Distribution of Abies religiosa (Kunth) Schltdl. et. Cham. and Pinus montezumae Lamb. in the face of climate change. Rev. Mex. Cienc. For. 2014, 5, 18–33. [Google Scholar]
  50. Islas-Báez, A.; Pérez-Miranda, R.; González-Hernández, A.; Romero-Sánchez, M.E.; Velasco-Bautista, E. Risk habitat of the monarch butterfly (Danaus plexippus) by climate change scenarios. Ra Ximhai 2015, 11, 49–59. [Google Scholar]
  51. Sánchez-Velásquez, L.R.; Pineda-López, M.R.; Ibarra-Zavaleta, S.P.; López-Serrano, Y. Fir forest demography using matrix projections: Anomaly precipitation due to climatic change decrease population viability. For. Ecol. Manag. 2021, 482, 118845. [Google Scholar] [CrossRef]
Figure 1. Raised beds of the provenance tests (common gardens) in the site at 2600 m a.s.l., October 2020, 15 months after transplantation. Each raised bed contained two complete randomized blocks.
Forests 12 00069 g001
Figure 2. Seedling response to climatic transfer distance for: (a) seedling survival; (b) aerial biomass (dry weight); and (c) increase in basal diameter. Predicted response curves (constructed with the estimated parameters according to the fixed terms of the mixed model, as in Table 4), are indicated for the species (solid line) and for the populations of the coldest site (dashed line) and the warmest site (dotted line). Symbols are observed averages per population per site (the color distinguishes the particular test site). Respective climatic transfer distance on the x-axis signifies the transfer to drier and/or warmer sites if the values are positive, and transfer to cooler and/or moister sites if they are negative. Zero signifies a climate similar to that of the site of provenance.
Forests 12 00069 g002aForests 12 00069 g002b
Figure 3. Estimated response curve (based on a quadratic regression) of the plants to the altitudinal transfer for: (a) survival; (b) aerial biomass (in dry weight); and (c) increase in basal diameter. Symbols indicate the average observed values per provenance per site. Symbol color denotes the particular assay site: blue, 3500 m a.s.l.; green, 3000 m a.s.l.; orange, 2600 m a.s.l. Positive values on the x-axis indicate movement towards sites of higher altitude, which are colder and moister, while negative values indicate movement towards sites of lower altitude, which are warmer and drier.
Forests 12 00069 g003aForests 12 00069 g003b
Figure 4. Mortality (%), monthly mean temperature (°C) and monthly precipitation (mm) in the period August 2019 to October 2020, for each test site, at (a) 2600 m a.s.l., (b) 3000 m a.s.l. and (c) 3400 m a.s.l.
Forests 12 00069 g004aForests 12 00069 g004b
Table 1. Geographic location and some climatic variables (their acronyms as in Table 2) of Abies religiosa seed collection sites within the Monarch Butterfly Biosphere Reserve (MBBR).
Altitude (m a.s.l)Lat. NLong. WMAT (°C)MAP (mm)MTCM (°C)ADI IndexWDSDI IndexCDSDI IndexRSDI Index
355219.564100.2298.511076.20.0340.1520.1600.029
349119.567100.2338.810946.50.0350.1610.1760.030
345719.571100.2359.010896.70.0360.1650.1840.031
341119.573100.2379.310797.00.0380.1730.1990.032
336419.575100.2349.510657.20.0390.1830.2060.033
330019.579100.2319.910487.50.0410.1910.2220.035
323319.580100.22410.210297.80.0430.2010.2330.036
321019.581100.22010.310228.00.0440.2040.2380.037
314319.581100.21410.610018.30.0460.2160.2500.039
309919.586100.21410.89878.50.0470.2260.2600.040
300319.595100.21011.39698.90.0500.2530.3030.041
Sites at altitudes from 3552 to 3300 m a.s.l and at 3099 m a.s.l. were collected at Ejido La Mesa. Sites from 3233 to 3143 m a.s.l. were collected at Ejido Buenavista Casablanca. Site at 3003 m a.s.l. was collected at Ejido Guadalupe Buenavista, Municipality of San José del Rincón, Estado de México.
Table 2. Climatic variables estimated for each provenance (seed origin, taken from [40]) and for each test site (taken from data loggers HOBOs and rainwater capture data).
CodeUnitDefinition
MAT°CMean annual temperature
MAPmmMean annual precipitation
GSPmmGrowing season precipitation (total precipitation from April–September)
WDSPmmWarm and dry season (total precipitation March–May)
RSPmmRainy season (total precipitation June–October)
CDSPmmCold and dry season (total precipitation November–February)
MTCM°CMean temperature in the coldest month
MMIN°CMean minimum temperature in the coldest month
MTWM°CMean temperature in the warmest month
MMAX°CMean maximum temperature in the warmest month
DD5°CDegree-days > 5 °C
WDSDD5°CWarm and dry season (March–May degree days > 5 °C)
RSDD5°CRainy season (June–October degree days > 5 °C)
CDSDD5°CCold and dry season (November–February degree days > 5 °C)
ADIindexAnnual dryness index ( ADI = DD 5 / MAP )
GSDIindexGrowing season dryness index ( GSDI = GSDD 5 / GSP )
WDSDIindexWarm and dry season (March–May) dryness index ( WDSDI = WDSDD 5 / WDSP )
RSDIindexRainy season (June–October) dryness index ( RSDI = RSDD 5 / RSP )
CDSDIindexCold and dry season (November–February) dryness index ( CDSDI = CDSDD 5 / CDSP )
Table 3. Location and some climatic variables (their acronyms as in Table 2) of sites of tests of provenances in common gardens.
SiteAltitude (m a.s.l.)Lat. NLong. WMAT (°C)MAP (mm)MTCM (°C)ADI IndexWDSDI IndexCDSDI IndexRSDI Index
Llano Grande 1340019.57100.239.310767.00.0260.1980.0410.026
La Mesa 2300019.58100.1811.39518.90.0560.5370.2510.044
Tlalpujahua 3260019.80100.1612.89069.60.0780.9300.6110.057
1 Core zone of the Monarch Butterfly Biosphere Reserve (MBBR). 2 Ejido La Mesa, Municipality of San José del Rincón, Estado de México (near the buffer zone of the MBBR). 3 Michoacán state.
Table 4. Analysis of the mixed model for seedling survival, biomass and increase in basal diameter. Akaike information criterion (AIC), estimated parameters (coefficients of regression for fixed effects and variances estimated for random effects), contribution to the total variance (of the random effects) and significance (p).
Parameter or Source of VariationSurvivalBiomassIncrease in Basal Diameter
Fixed EffectsEstimatepEstimatepEstimatep
Akaike Information Criterion1651.1---2397.2---1917.3---
Intercept119.70.01152.40.04780.0810.8824
Climate at seed source
Warm and dry season dryness index (WDSDI)−111.30.09416.80.0198------
Mean temperature in the coldest month (MTCM)------------0.190.0036
Climate transfer distance
Rainy season dryness index (RSDI)1426.80.3542------------
Cold and dry season dryness index (CDSDI)------8.70.0002------
Annual dryness index (ADI)------------143.5<0.0001
(Climate transfer distance)2
RSDI2−55,9550.0112------------
CDSDI2------−10.6<0.0001------
ADI2------------−1291.2<0.0001
Interaction climate seed source × Climate transfer distance−10,2020.1273−20.60.0395−14.7<0.0001
Random EffectsVariance% *pVariance% *pVariance% *p
Site001001001
Population1.50.340.44120.0423.100.12170.0101.40.1364
Block (Site)91.221.020.02520.0977.190.01960.10815.040.0095
Site × Population0010.0191.430.2036001
Error341.078.64<0.00011.19588.28<0.00010.59883.55<0.0001
* Contribution to total variance expressed as a percentage, where 100% is the sum of the contribution to the total variance of the random terms only.
Table 5. Comparison of the most important climatic variables related to the survival response function, corresponding to the reference period 1961–1990 and the data obtained by averaging the test sites.
Climatic VariableReference Period 1961–1990 December 2019–November 2020Difference
MAT11.13 °C11.71 °C+0.58 °C
MAP980 mm952.7 mm−27.3 mm
Publisher’s Note: MDPI stays neutral with regard to jurisdictional claims in published maps and institutional affiliations.

