Performance Analysis of the Demand-Based Ventilation in a Nordic Apartment Building


Abstract
:Featured Application
Abstract
1. Introduction
2. Materials and Methods
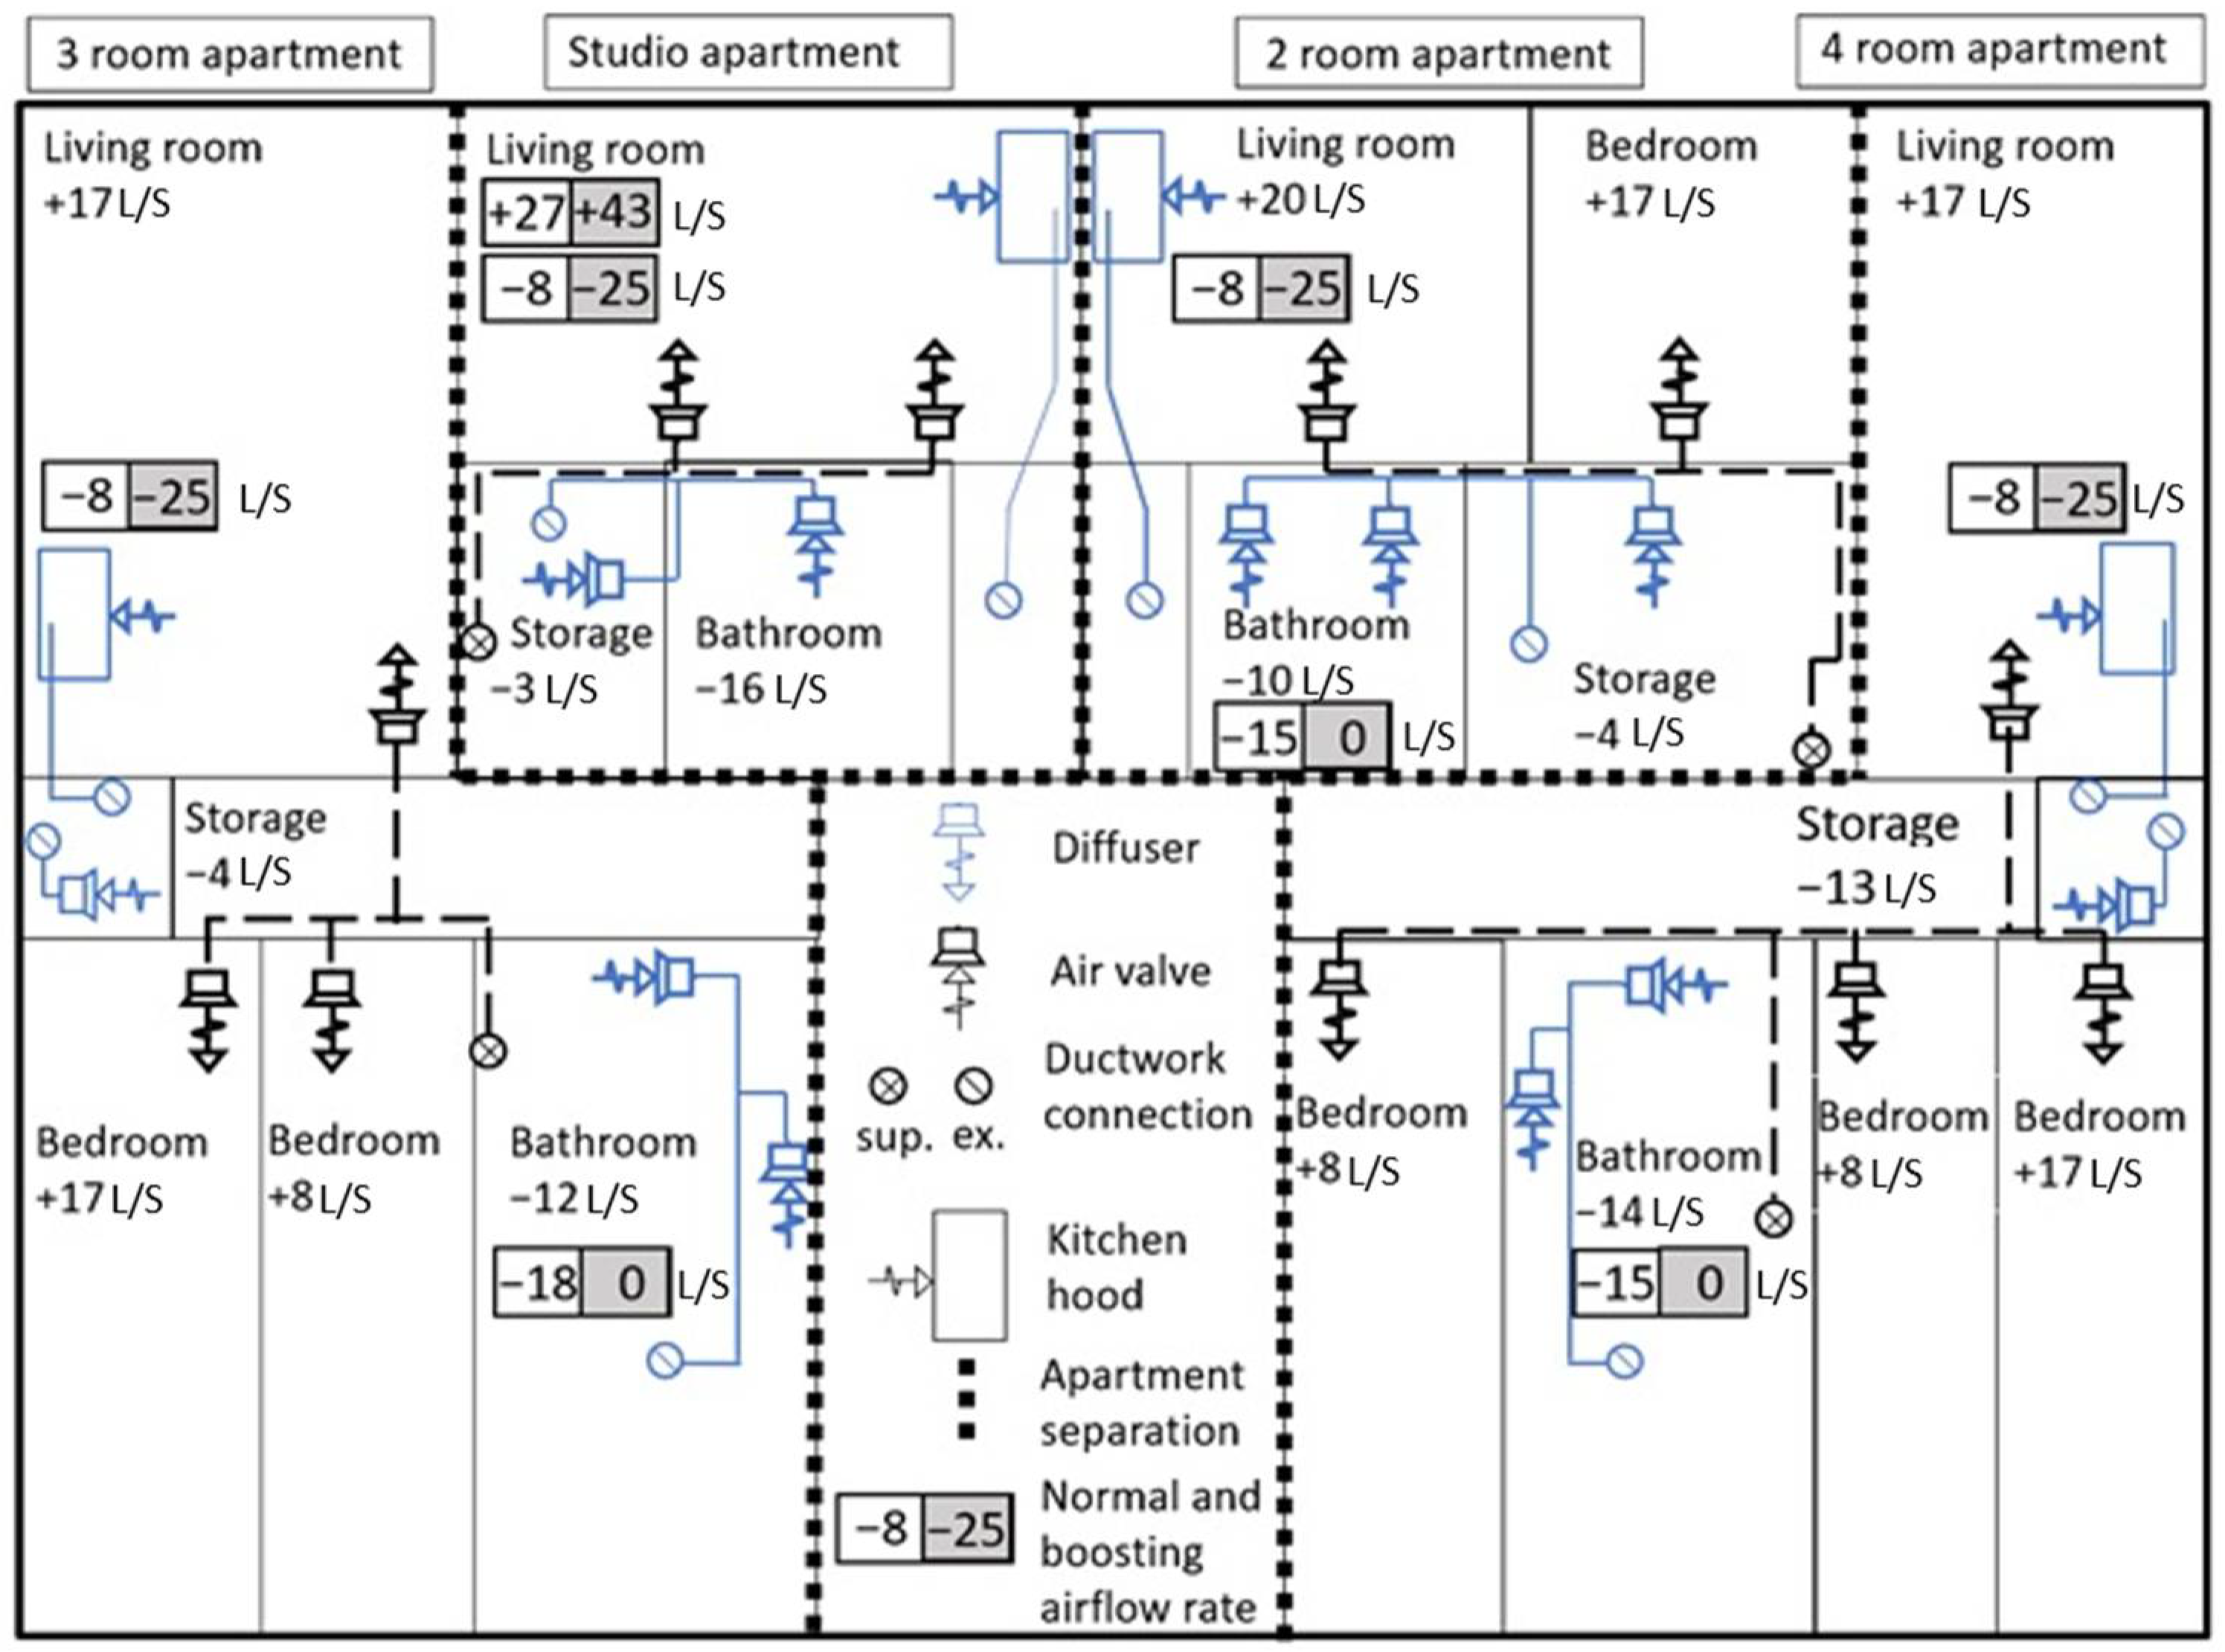
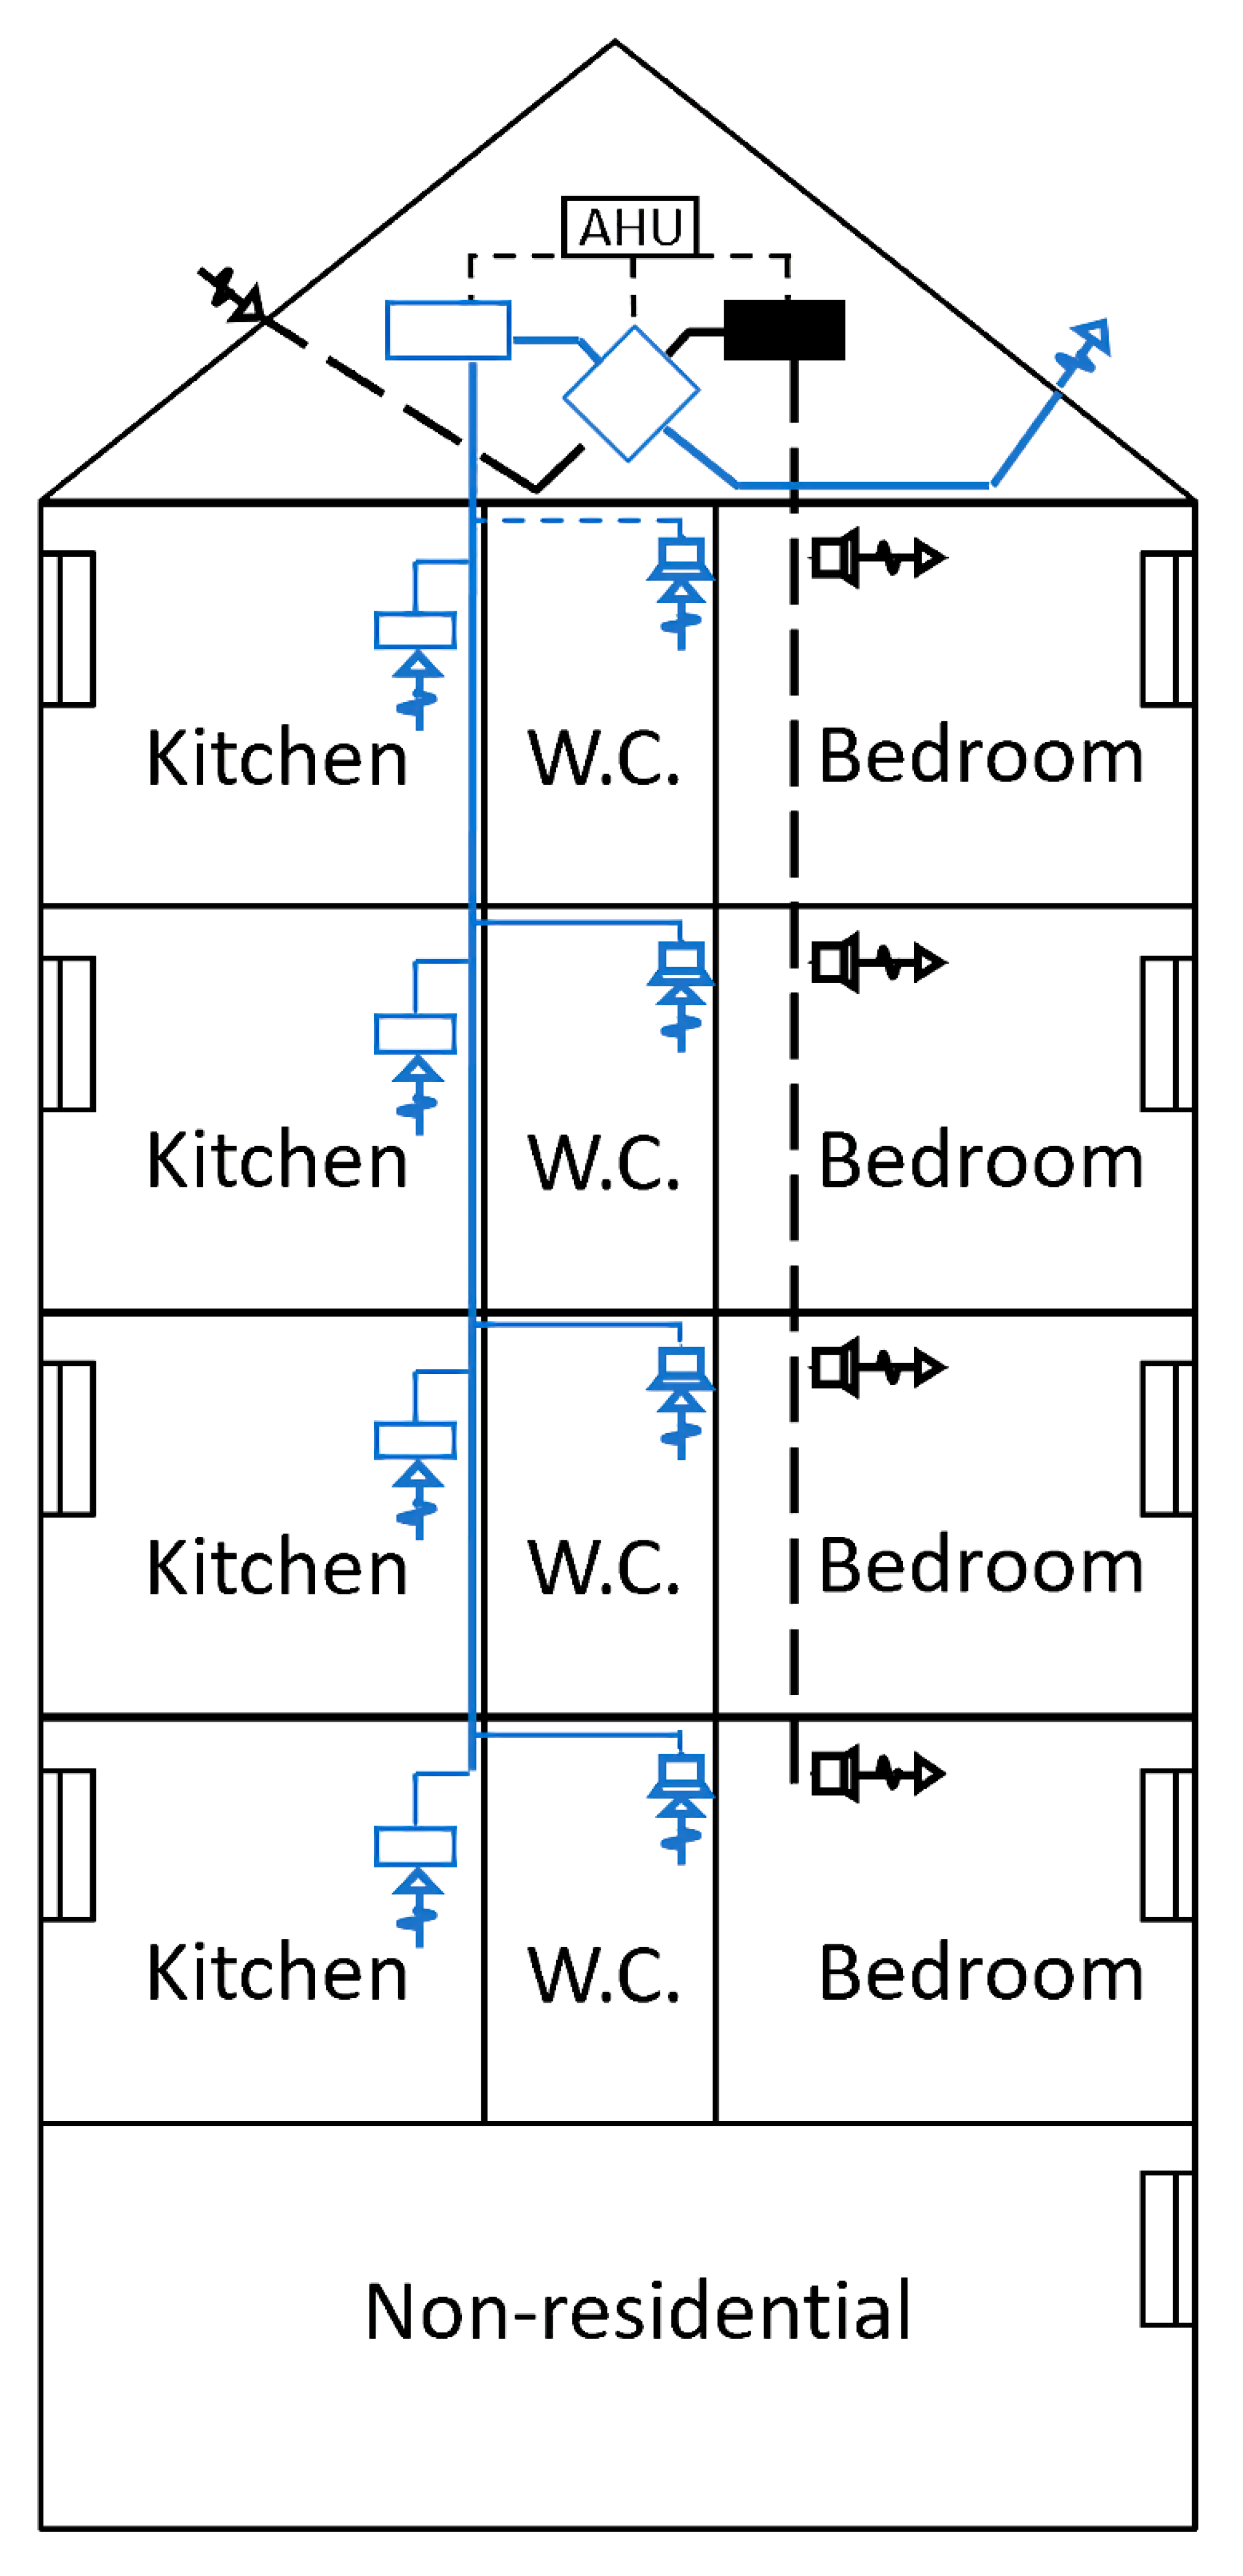
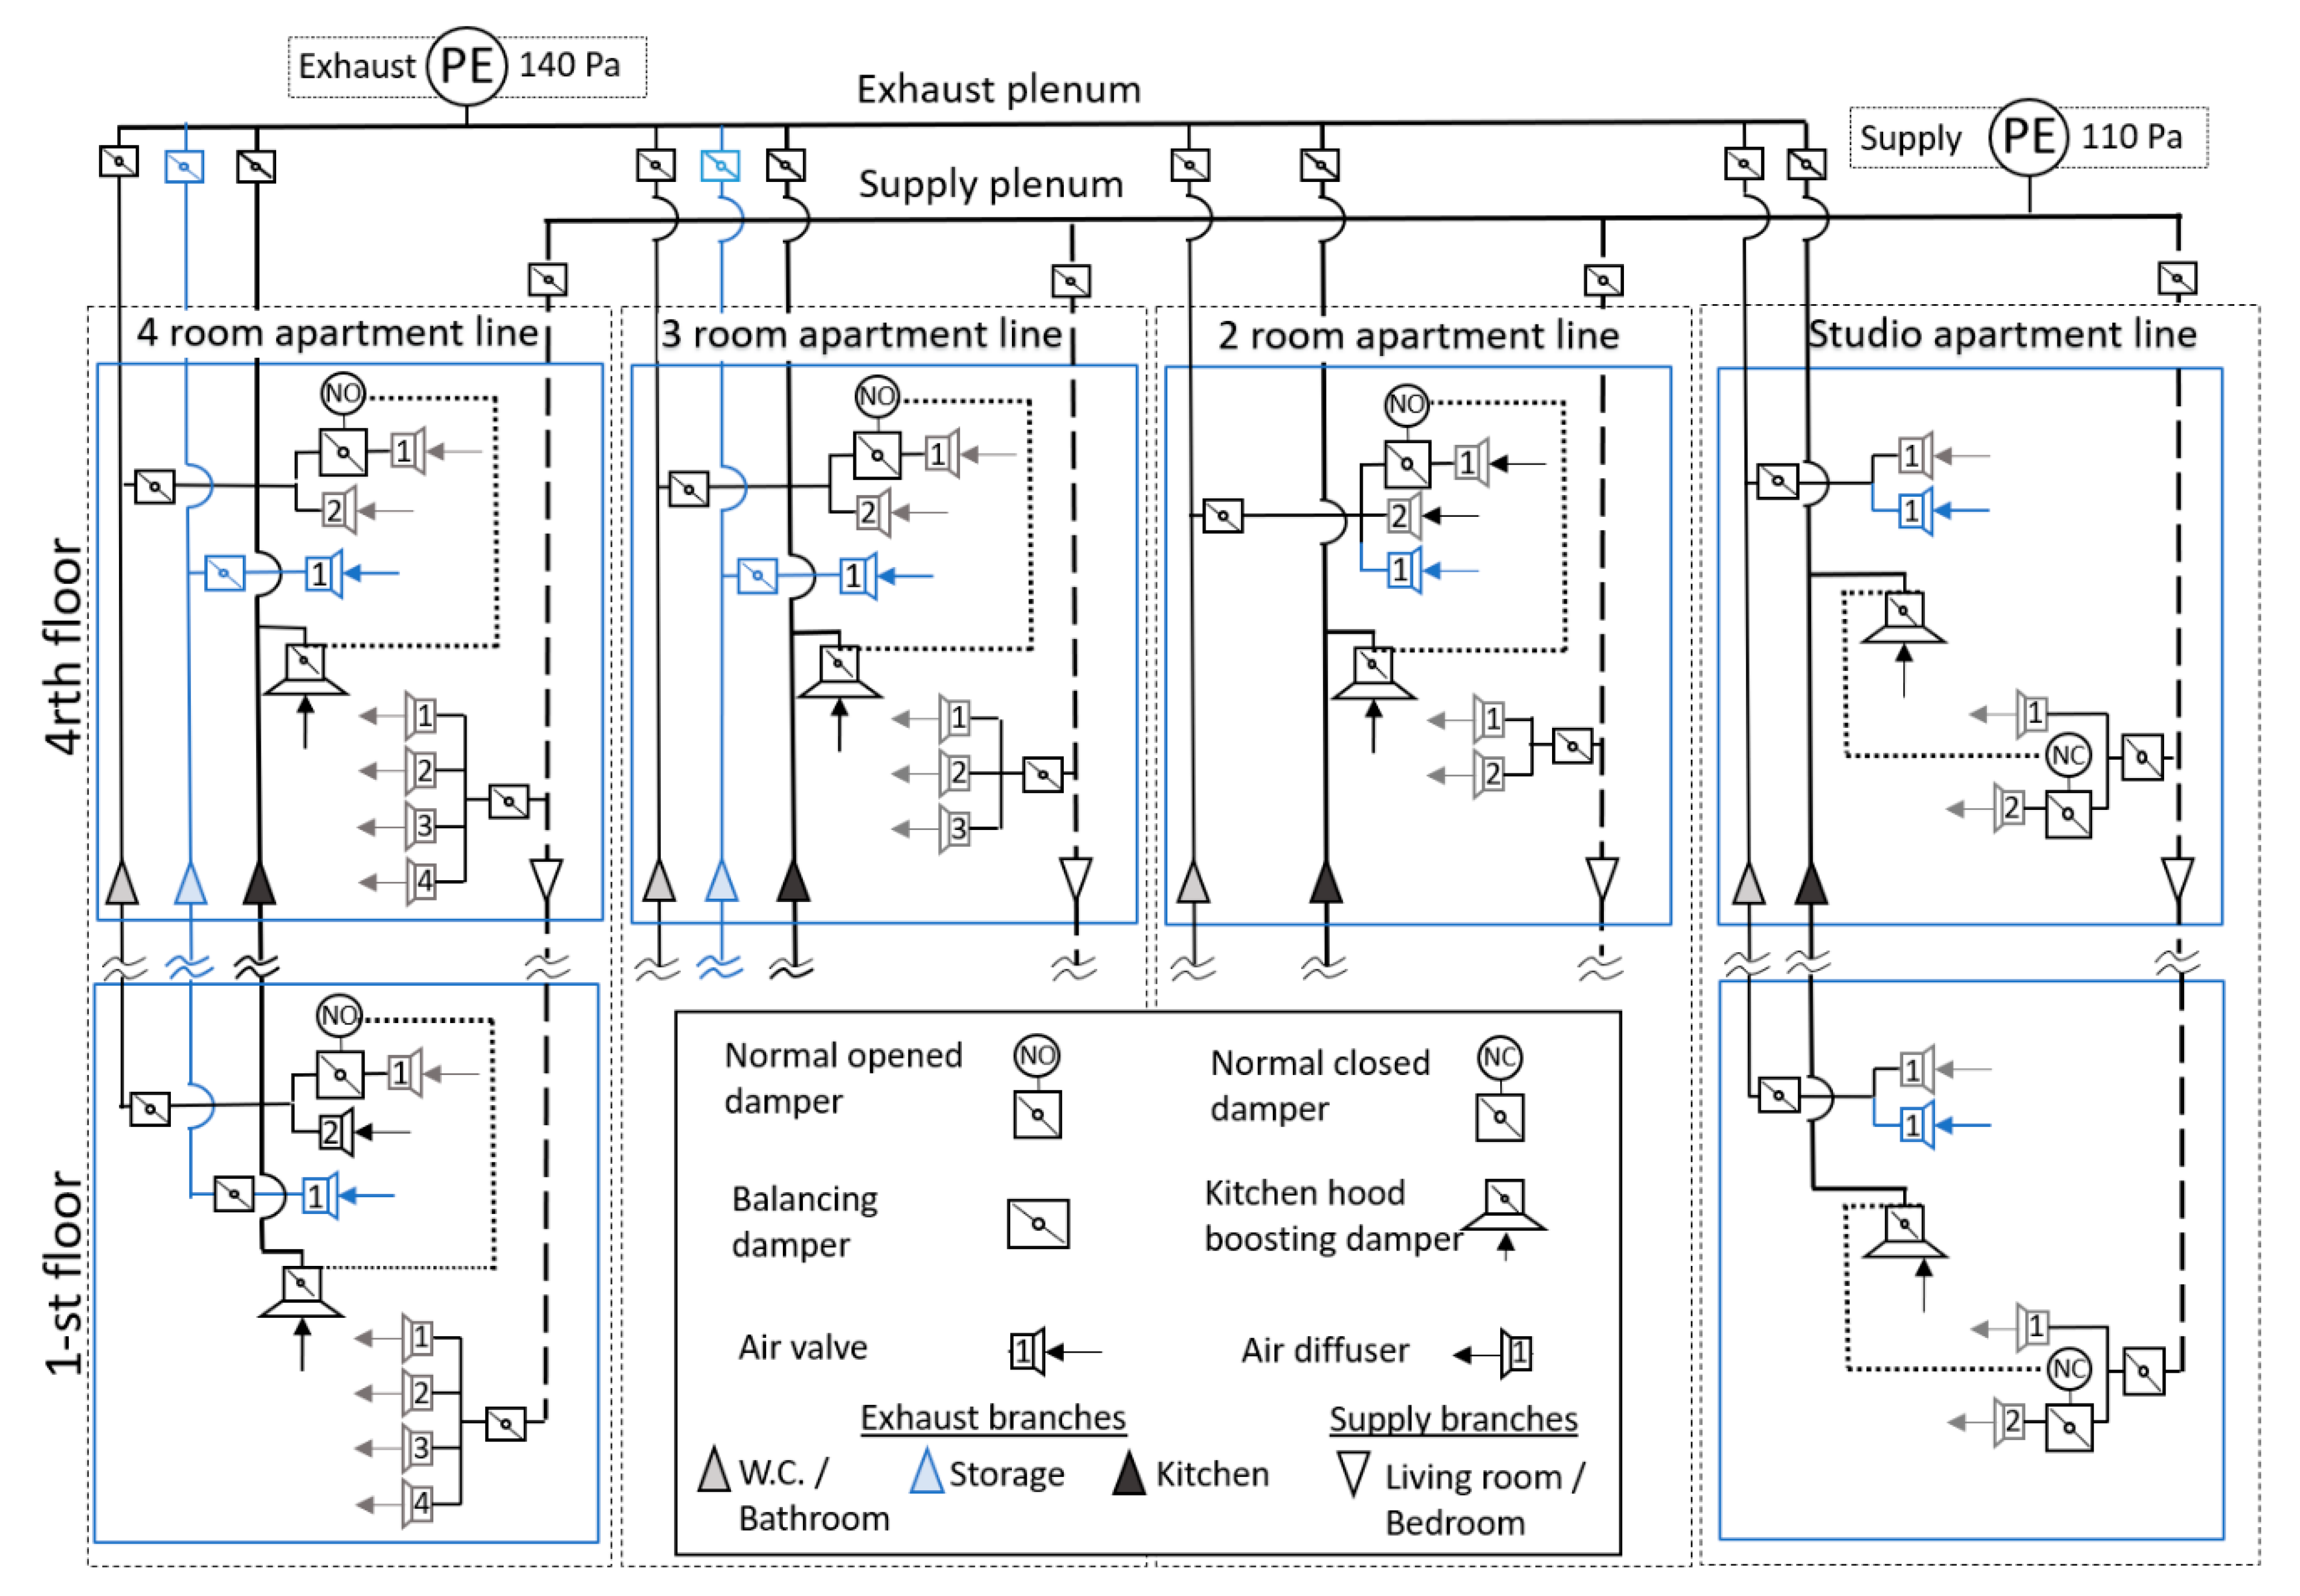
2.1. Building Description
2.2. Simulation Model
2.3. Airtightness
3. Results
3.1. Performance of Standard Demand-Based Ventilation System
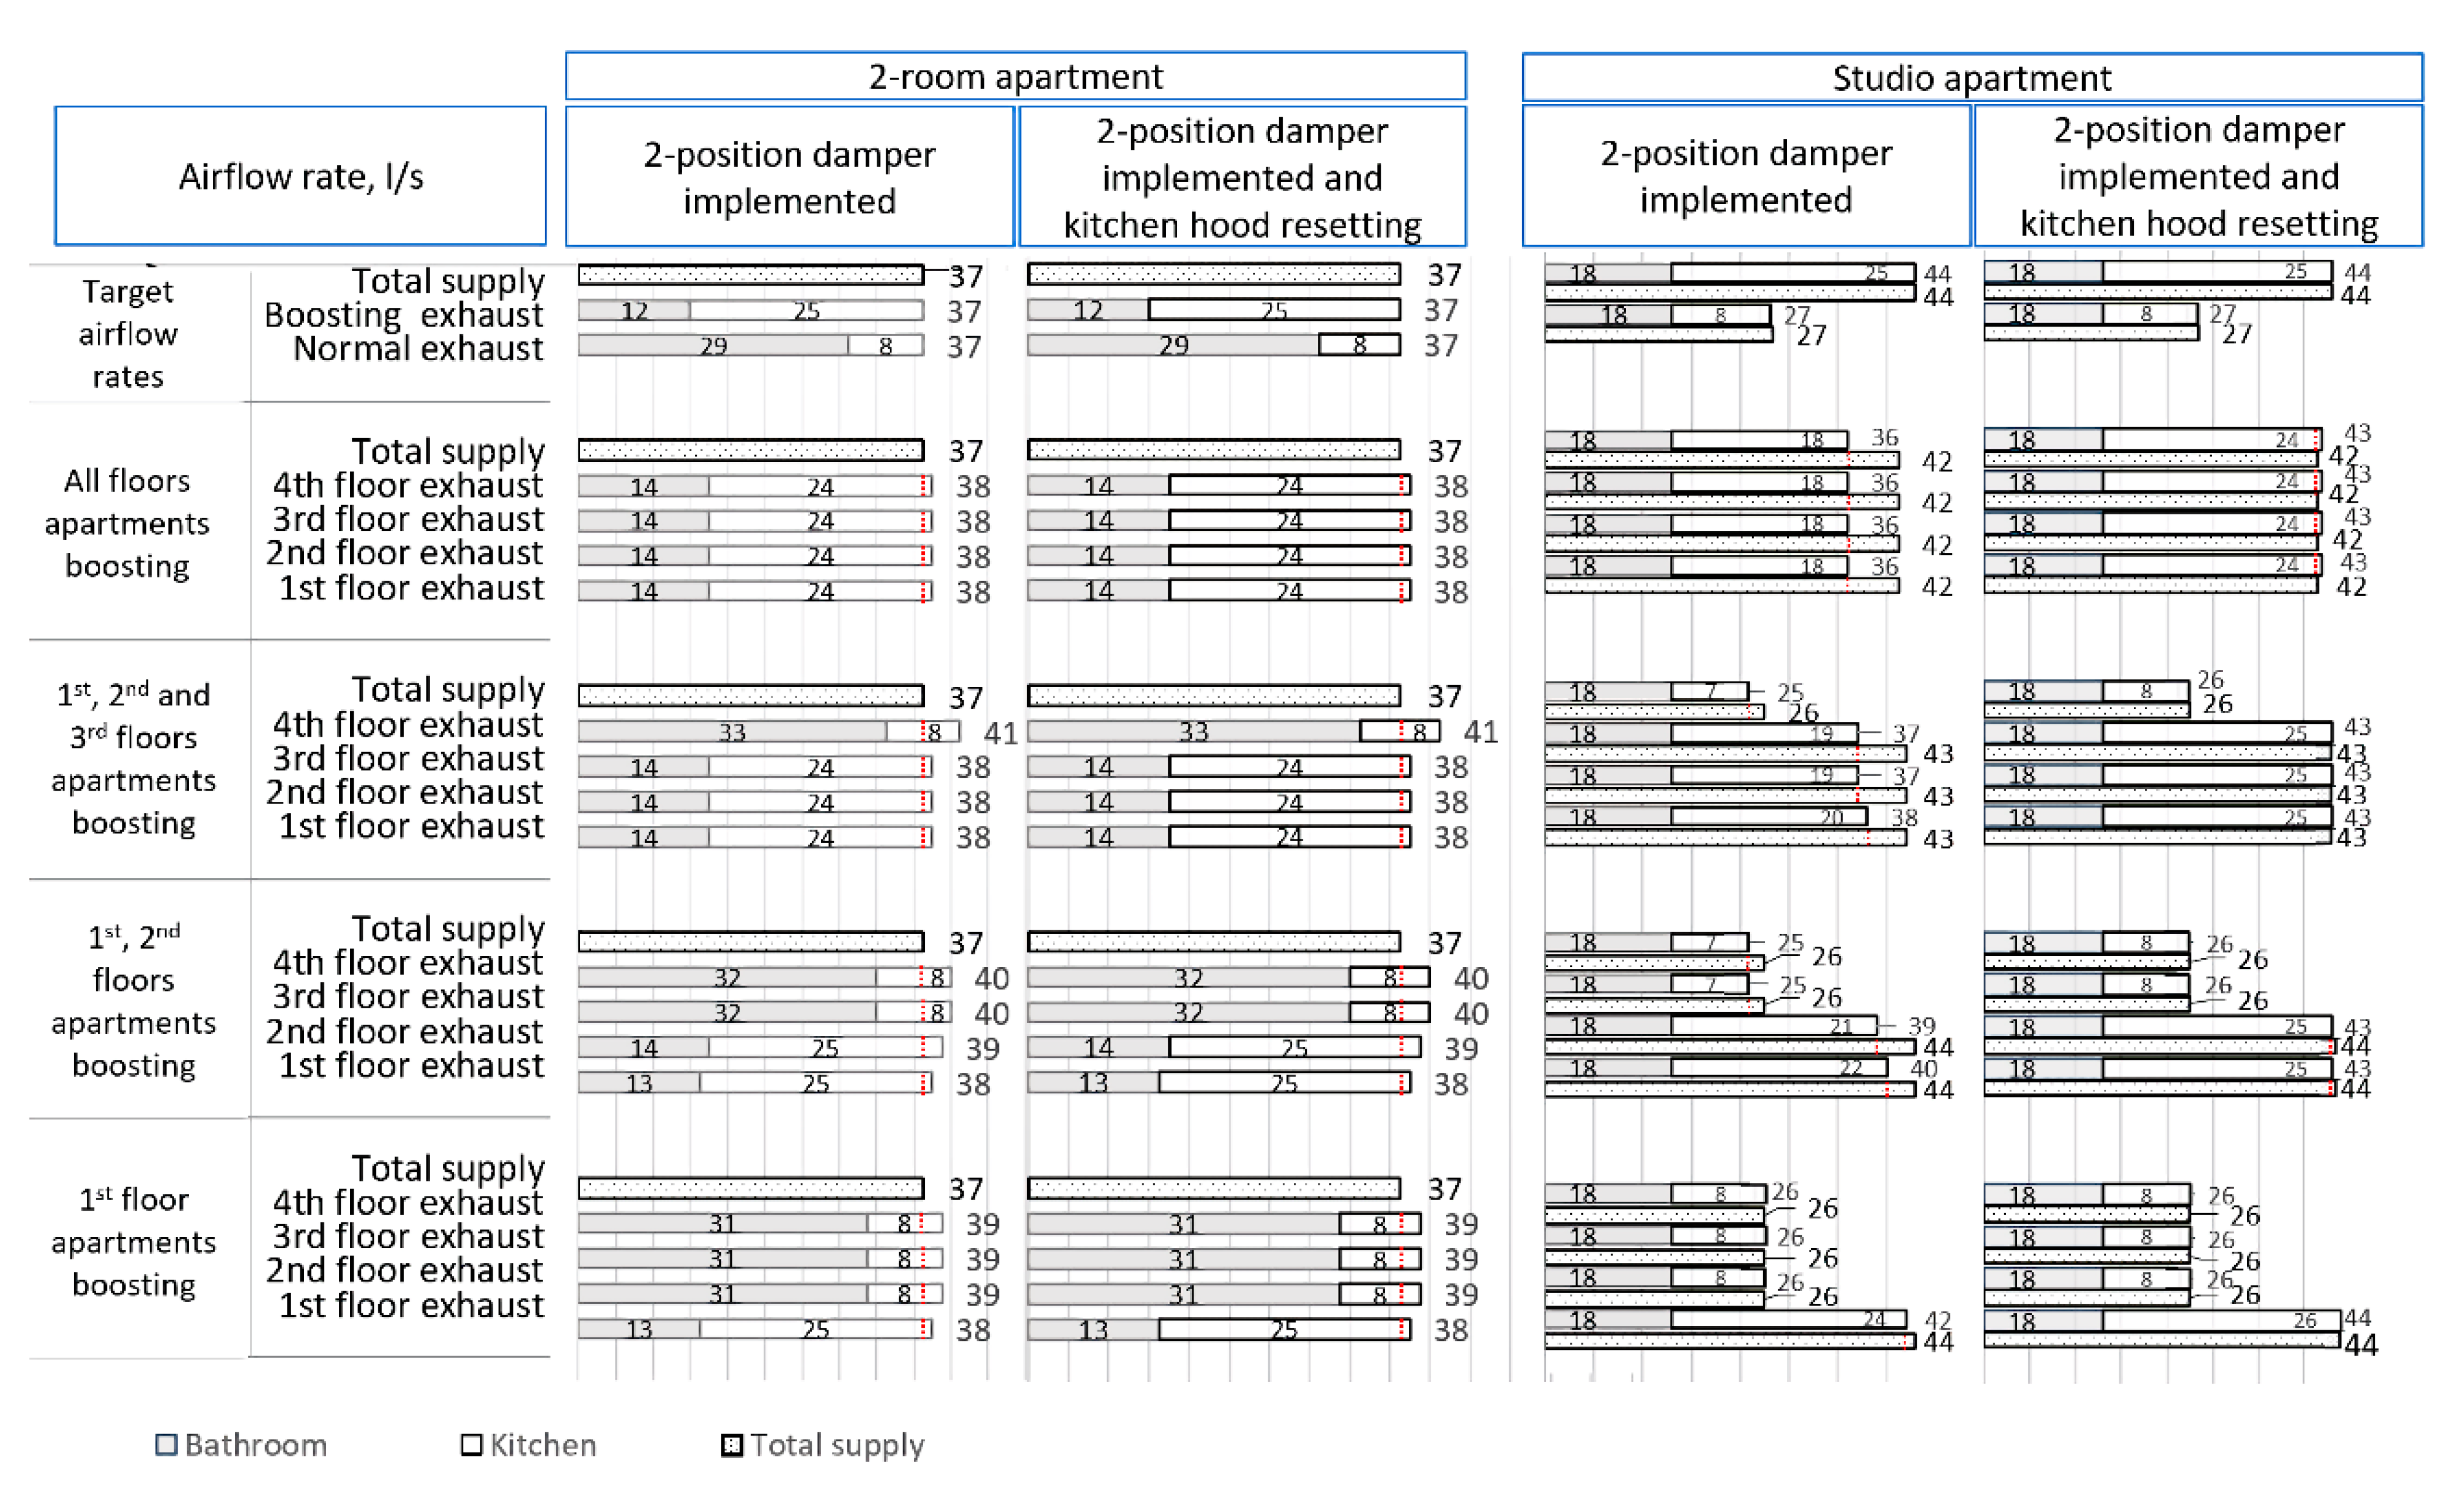
3.2. Performance with the Improved Design Concept
4. Conclusions
Author Contributions
Funding
Institutional Review Board Statement
Informed Consent Statement
Data Availability Statement
Acknowledgments
Conflicts of Interest
References
- Olesen, B.W. Indoor Environment Criteria for Design and Calculation of Energy Performance of Buildings EN15251. Proceedings of The 6th International Conference on Indoor Air Quality, Ventialtion & Energy Conservation in Buildings: Sustainable Built environment, Sendai, Japan, 28 October 2007. [Google Scholar]
- Fernbas Energy Performance of Buildings Directive. Available online: https://ec.europa.eu/energy/topics/energy-efficiency/energy-efficient-buildings/energy-performance-buildings-directive_en (accessed on 5 November 2020).
- Dimitroulopoulou, C. Ventilation in European dwellings: A review. Build. Environ. 2012, 47, 109–125. [Google Scholar] [CrossRef]
- Brelih, N.; Seppanen, O. Ventilation rates and IAQ in European standards and national regulations. In Proceedings of the 32nd AIVC Conference and 1st TightVent Conference, Brussels, Belgium, 12–13 October 2011. [Google Scholar]
- IV Design Guides-FINVAC. Available online: https://finvac.org/iv-oppaat/ (accessed on 25 December 2020).
- Ministry of the Environment. National Building Code of Finland. Part D2. Indoor Climate and Ventilation of Buildings Regulations and Guidelines; Ministry of the Environment: Helsinki, Finland, 2012.
- Ministry of the Environment. Decree of the Ministry of the Environment on the Indoor Climate and Ventilation of New Buildings 1009/2017; Ministry of the Environment: Helsinki, Finland, 2017.
- Rämö, A. Statistics Finland—Building Stock 2019. Available online: http://www.stat.fi/til/rakke/2019/rakke_2019_2020-05-27_kat_002_en.html (accessed on 5 November 2020).
- Säteri, J.; Seppänen, O.; Ahola, M. Finnish design ventilation rates for residential buildings. E3S Web Conf. 2019, 111, 02016. [Google Scholar] [CrossRef] [Green Version]
- Koiv, T.-A.; Mikola, A.; Simson, R. Ventilation Solutions in Renovated Apartment Buildings in Cold Climate Conditions. Engineering 2015, 7, 129. [Google Scholar] [CrossRef] [Green Version]
- Kuusk, K.; Kalamees, T. Estonian Grant Scheme for Renovating Apartment Buildings. Energy Procedia 2016, 96, 628–637. [Google Scholar] [CrossRef] [Green Version]
- Kurnitski, J. Residential Heat Recovery Ventilation; U.S. Department of Energy: Washington, DC, USA, 2018; ISBN 978-1-5231-2560-9.
- Kamendere, E.; Zogla, G.; Kamenders, A.; Ikaunieks, J.; Rochas, C. Analysis of Mechanical Ventilation System with Heat Recovery in Renovated Apartment Buildings. Energy Procedia 2015, 72, 27–33. [Google Scholar] [CrossRef] [Green Version]
- Myhren, J.A.; Holmberg, S. Performance evaluation of ventilation radiators. Appl. Therm. Eng. 2013, 51, 315–324. [Google Scholar] [CrossRef] [Green Version]
- Myhren, J.A.; Holmberg, S. Design considerations with ventilation-radiators: Comparisons to traditional two-panel radiators. Energy Build. 2009, 41, 92–100. [Google Scholar] [CrossRef]
- Hesaraki, A.; Holmberg, S. Demand-controlled ventilation in new residential buildings: Consequences on indoor air quality and energy savings. Indoor Built Environ. 2015, 24, 162–173. [Google Scholar] [CrossRef] [Green Version]
- Okochi, G.S.; Yao, Y. A review of recent developments and technological advancements of variable-air-volume (VAV) air-conditioning systems. Renew. Sustain. Energy Rev. 2016, 59, 784–817. [Google Scholar] [CrossRef]
- Silva, M.F.; Maas, S.; Souza, H.A.; de Gomes, A.P. Post-occupancy evaluation of residential buildings in Luxembourg with centralized and decentralized ventilation systems, focusing on indoor air quality (IAQ). Assessment by questionnaires and physical measurements. Energy Build. 2017, 148, 119–127. [Google Scholar] [CrossRef]
- Balvers, J.; Bogers, R.; Jongeneel, R.; van Kamp, I.; Boerstra, A.; van Dijken, F. Mechanical ventilation in recently built Dutch homes: Technical shortcomings, possibilities for improvement, perceived indoor environment and health effects. Archit. Sci. Rev. 2012, 55, 4–14. [Google Scholar] [CrossRef]
- Guyot, G.; Sherman, M.H.; Walker, I.S. Smart ventilation energy and indoor air quality performance in residential buildings: A review. Energy Build. 2018, 165, 416–430. [Google Scholar] [CrossRef] [Green Version]
- Tafelmeier, S.; Pernigotto, G.; Gasparella, A. Annual Performance of Sensible and Total Heat Recovery in Ventilation Systems: Humidity Control Constraints for European Climates. Buildings 2017, 7, 28. [Google Scholar] [CrossRef] [Green Version]
- Nielsen, T.R.; Drivsholm, C. Energy efficient demand controlled ventilation in single family houses. Energy Build. 2010, 42, 1995–1998. [Google Scholar] [CrossRef]
- Mortensen, D.K.; Walker, I.S.; Sherman, M.H. Optimization of Occupancy Based Demand Controlled Ventilation in Residences. Int. J. Vent. 2011, 10, 49–60. [Google Scholar] [CrossRef] [Green Version]
- Merzkirch, A.; Maas, S.; Scholzen, F.; Waldmann, D. Field tests of centralized and decentralized ventilation units in residential buildings—Specific fan power, heat recovery efficiency, shortcuts and volume flow unbalances. Energy Build. 2016, 116, 376–383. [Google Scholar] [CrossRef]
- Mortensen, D.K.; Nielsen, T.R. System Design for Demand Controlled Ventilation in Multi-Family Dwellings. Int. J. Vent. 2011, 10, 205–216. [Google Scholar] [CrossRef]
- Merzkirch, A.; Maas, S.; Scholzen, F.; Waldmann, D. A semi-centralized, valveless and demand controlled ventilation system in comparison to other concepts in field tests. Build. Environ. 2015, 93, 21–26. [Google Scholar] [CrossRef]
- The National Building Code of Finland. Available online: https://ym.fi/en/the-national-building-code-of-finland (accessed on 11 November 2020).
- Zhao, W.; Hopke, P.K.; Norris, G.; Williams, R.; Paatero, P. Source apportionment and analysis on ambient and personal exposure samples with a combined receptor model and an adaptive blank estimation strategy. Atmos. Environ. 2006, 40, 3788–3801. [Google Scholar] [CrossRef]
- Kim, K.-H.; Kabir, E.; Kabir, S. A review on the human health impact of airborne particulate matter. Environ. Int. 2015, 74, 136–143. [Google Scholar] [CrossRef]
- Kalamees, T.; Kurnitski, J.; Jokisalo, J.; Eskola, L.; Jokiranta, K.; Vinha, J. Measured and simulated air pressure conditions in Finnish residential buildings. Build. Serv. Eng. Res. Technol. 2010, 31, 177–190. [Google Scholar] [CrossRef]
- Space Design Software Tool Halton HIT Planning Tool—From Halton. Available online: https://www.halton.com/services/hit-planning-tool-space-design-software-tool/ (accessed on 5 November 2020).
- Topic: MagiCAD for Revit. Available online: https://help.magicad.com/mcrev/2018-UR-3/EN/magicad_for_revit.html?ms=AQIAAAAAAAAAQCA%3D&st=MA%3D%3D&sct=MA%3D%3D&mw=MjQw (accessed on 5 November 2020).
- Vinha, J.; Manelius, E.; Korpi, M.; Salminen, K.; Kurnitski, J.; Kiviste, M.; Laukkarinen, A. Airtightness of residential buildings in Finland. Build. Environ. 2015, 93, 128–140. [Google Scholar] [CrossRef] [Green Version]
- Jokisalo, J.; Kurnitski, J.; Korpi, M.; Kalamees, T.; Vinha, J. Building leakage, infiltration, and energy performance analyses for Finnish detached houses. Build. Environ. 2009, 44, 377–387. [Google Scholar] [CrossRef]


| Room Type | Component | 4-Room Apartment | 3-Room Ap. | 2-Room Ap. | Studio Ap. | ||||||||||||
|---|---|---|---|---|---|---|---|---|---|---|---|---|---|---|---|---|---|
| Size, mm | Airflow, L/s | K-Value | Size, mm | Airflow, L/s | K-Value | Size, mm | Airflow, L/s | K-Value | Size, mm | Airflow, L/s | K-Value | ||||||
| Bathroom | Air valve, 1 | Ø125 | N 1 | B 2 | 3.35 | Ø125 | N | B | 4.24 | Ø125 | N | B | 3.00 | Ø125 | N | B | 3.06 |
| 15 | 0 | 18 | 0 | 15 | 0 | 16 | 16 | ||||||||||
| Air valve, 2 | Ø125 | 14 | 14 | 2.86 | Ø125 | 12 | 12 | 2.45 | Ø100 | 10 | 10 | 1.96 | Ø100 | 3 | 3 | 0.57 | |
| Storage or W.C. | Air valve, 1 | Ø125 | 13 | 13 | 2.91 | Ø100 | 4 | 4 | 0.73 | Ø100 | 4 | 4 | 0.73 | ||||
| Kitchen | Range hood | Ø125 | 8 | 25 | 0.73 3 2.44 4 | Ø125 | 8 | 25 | 0.73 3 2.44 4 | Ø125 | 8 | 25 | 0.73 3 2.44 4 | Ø125 | 8 | 25 | 0.73 3 2.44 4 |
| Living/bedroom | Diffuser, 1 | Ø125 | 17 | 17 | 4.91 | Ø125 | 17 | 17 | 4.12 | Ø125 | 20 | 20 | 4.85 | Ø125 | 27 | 27 | 4.77 |
| Diffuser, 2 | Ø125 | 17 | 17 | 4.54 | Ø125 | 17 | 17 | 4.12 | Ø125 | 17 | 17 | 4.37 | Ø125 | 0 | 16 | 3.01 | |
| Diffuser, 3 | Ø100 | 8 | 8 | 2.41 | Ø100 | 8 | 8 | 2.00 | |||||||||
| Diffuser, 4 | Ø100 | 8 | 8 | 1.71 | |||||||||||||
| Room Type | 4-Room Apartment | 3-Room Ap. | 2-Room Ap. | Studio Ap. | ||||||||||||
|---|---|---|---|---|---|---|---|---|---|---|---|---|---|---|---|---|
| Size, mm | Airflow, L/s | K-Value | Size, mm | Airflow, L/s | K-Value | Size, mm | Airflow, L/s | K-Value | Size, mm | Airflow, L/s | K-Value | |||||
| Bathroom | Ø250 | N 1 | B 2 | 25.94 | Ø250 | N | B | 26.83 | Ø200 | N | B | 36.68 | Ø200 | N | B | 17.00 |
| 116 | 56 | 120 | 48 | 116 | 56 | 76 | 76 | |||||||||
| Storage or W.C. | Ø125 | 52 | 52 | 11.63 | Ø125 | 16 | 16 | 2.92 | ||||||||
| Kitchen | Ø200 | 32 | 100 | 7.16 | Ø200 | 32 | 100 | 7.16 | Ø200 | 32 | 100 | 7.16 | Ø200 | 32 | 100 | 7.16 |
| Living/bedroom | Ø250 | 200 | 200 | 57.74 | Ø250 | 168 | 168 | 43.38 | Ø200 | 148 | 148 | 33.10 | Ø200 | 108 | 176 | 34.15 |
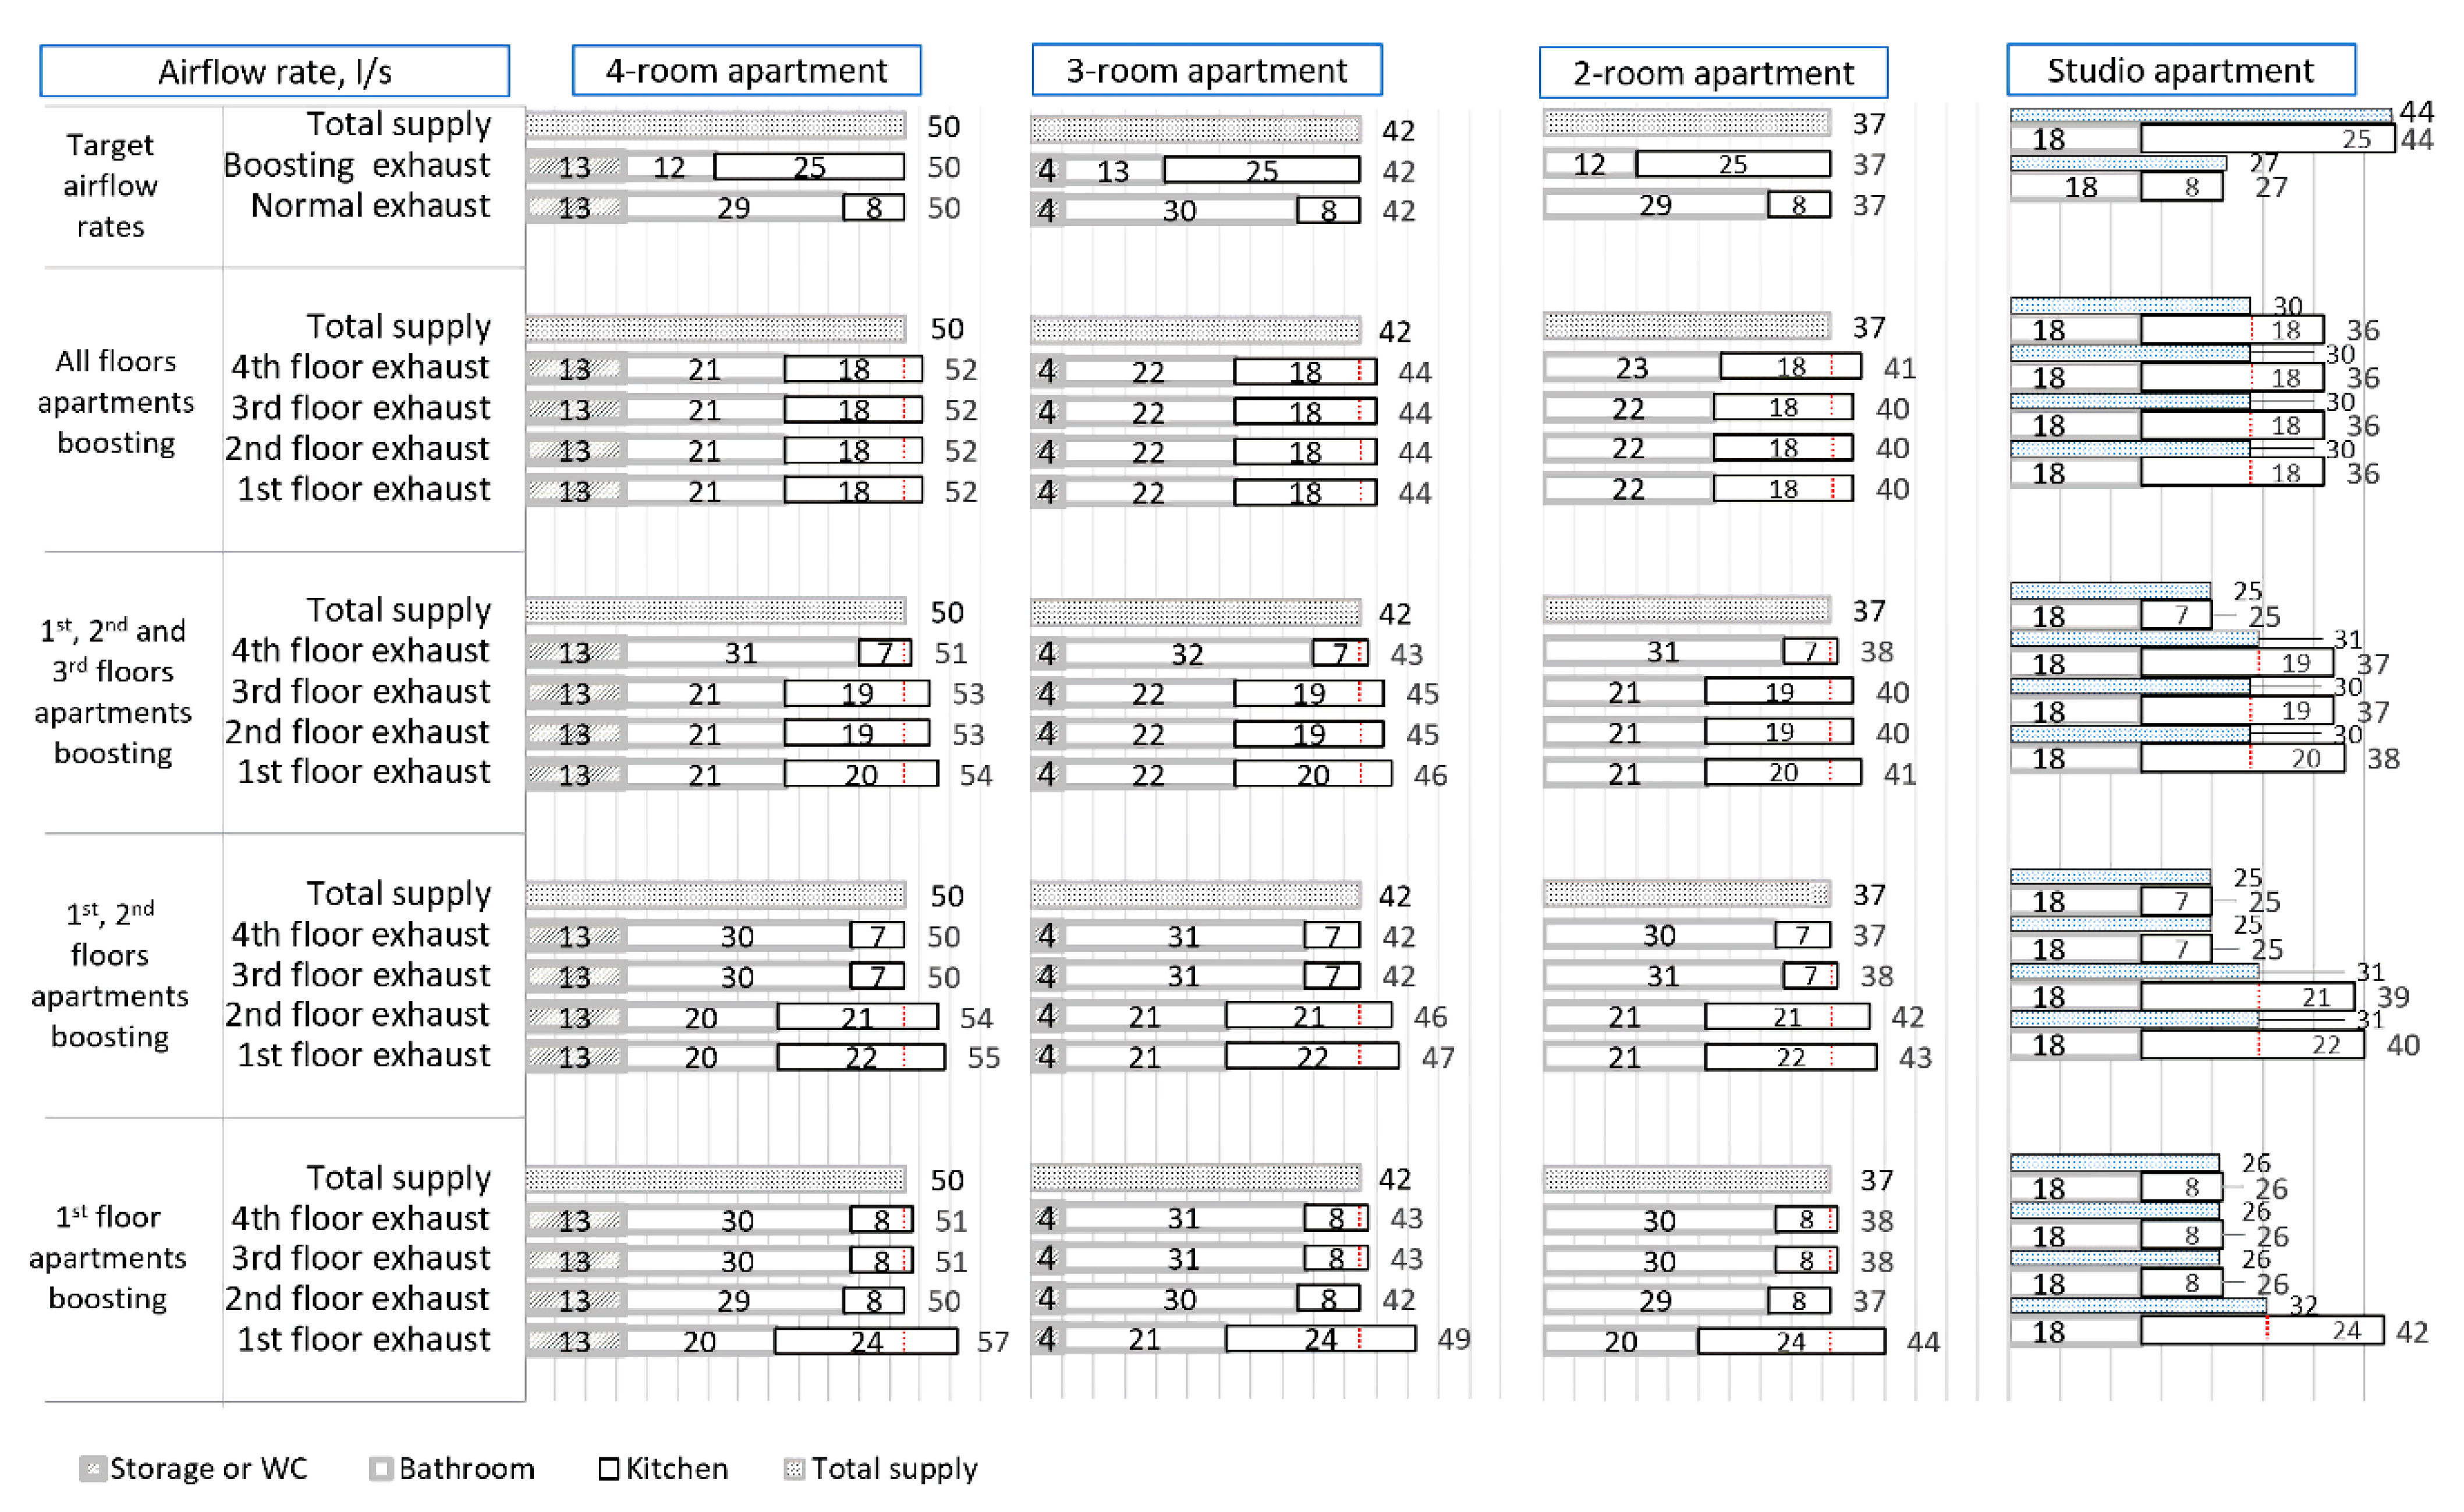
 |  | ||
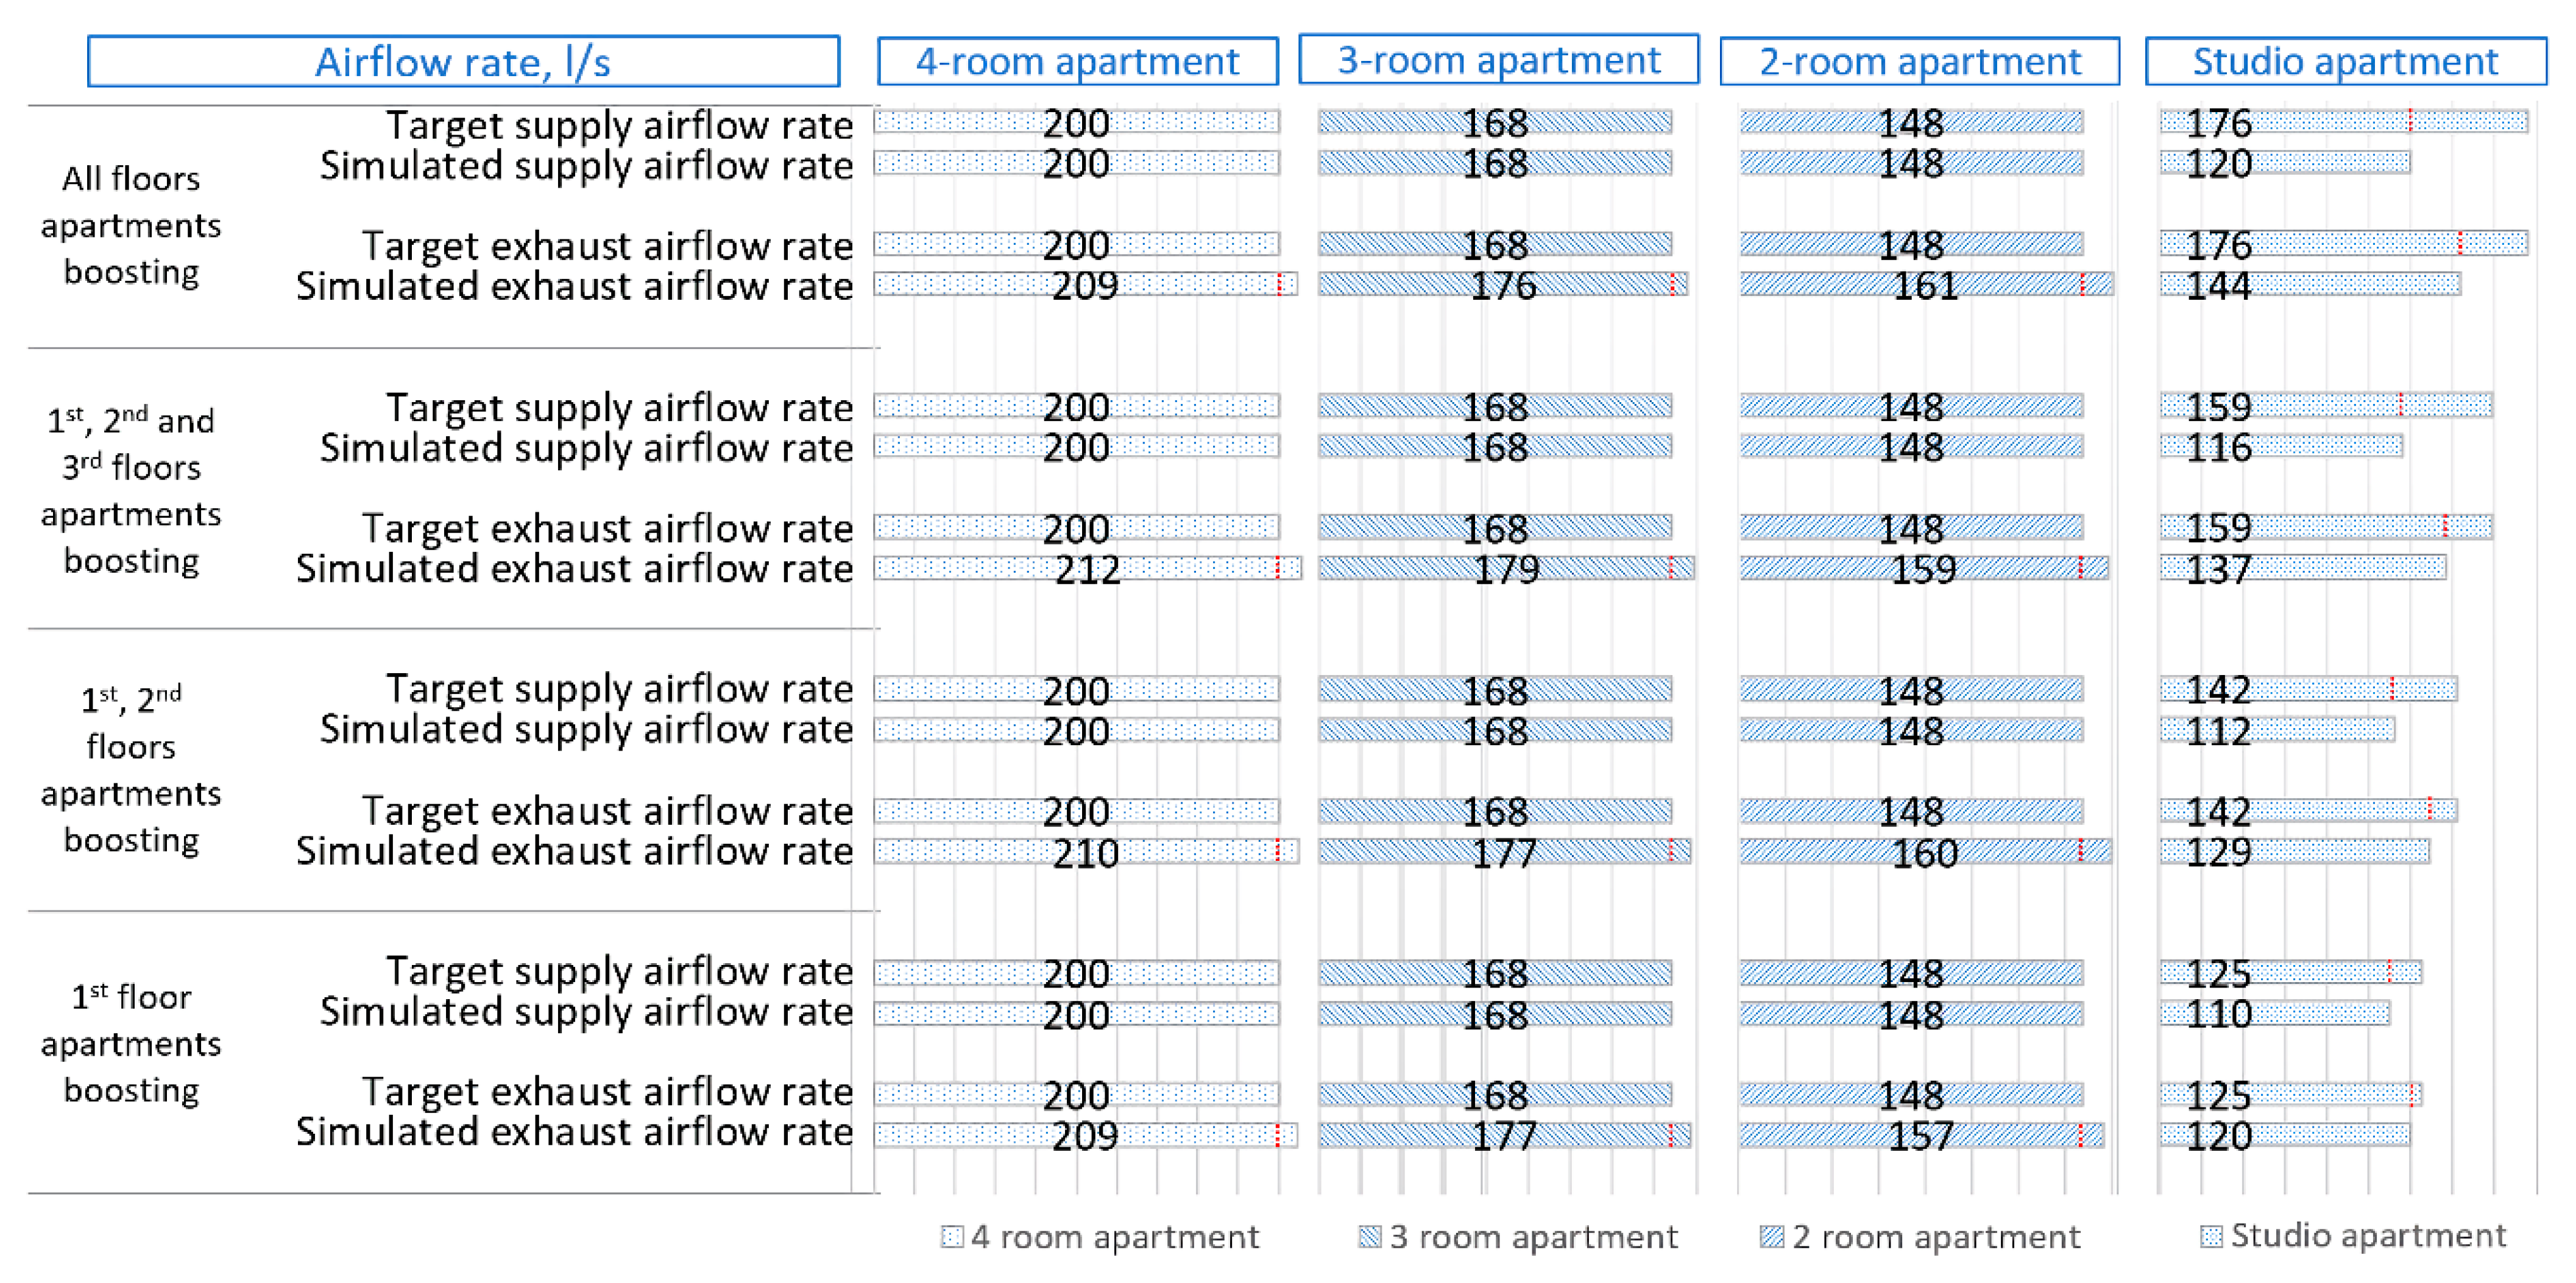
 |  | ||
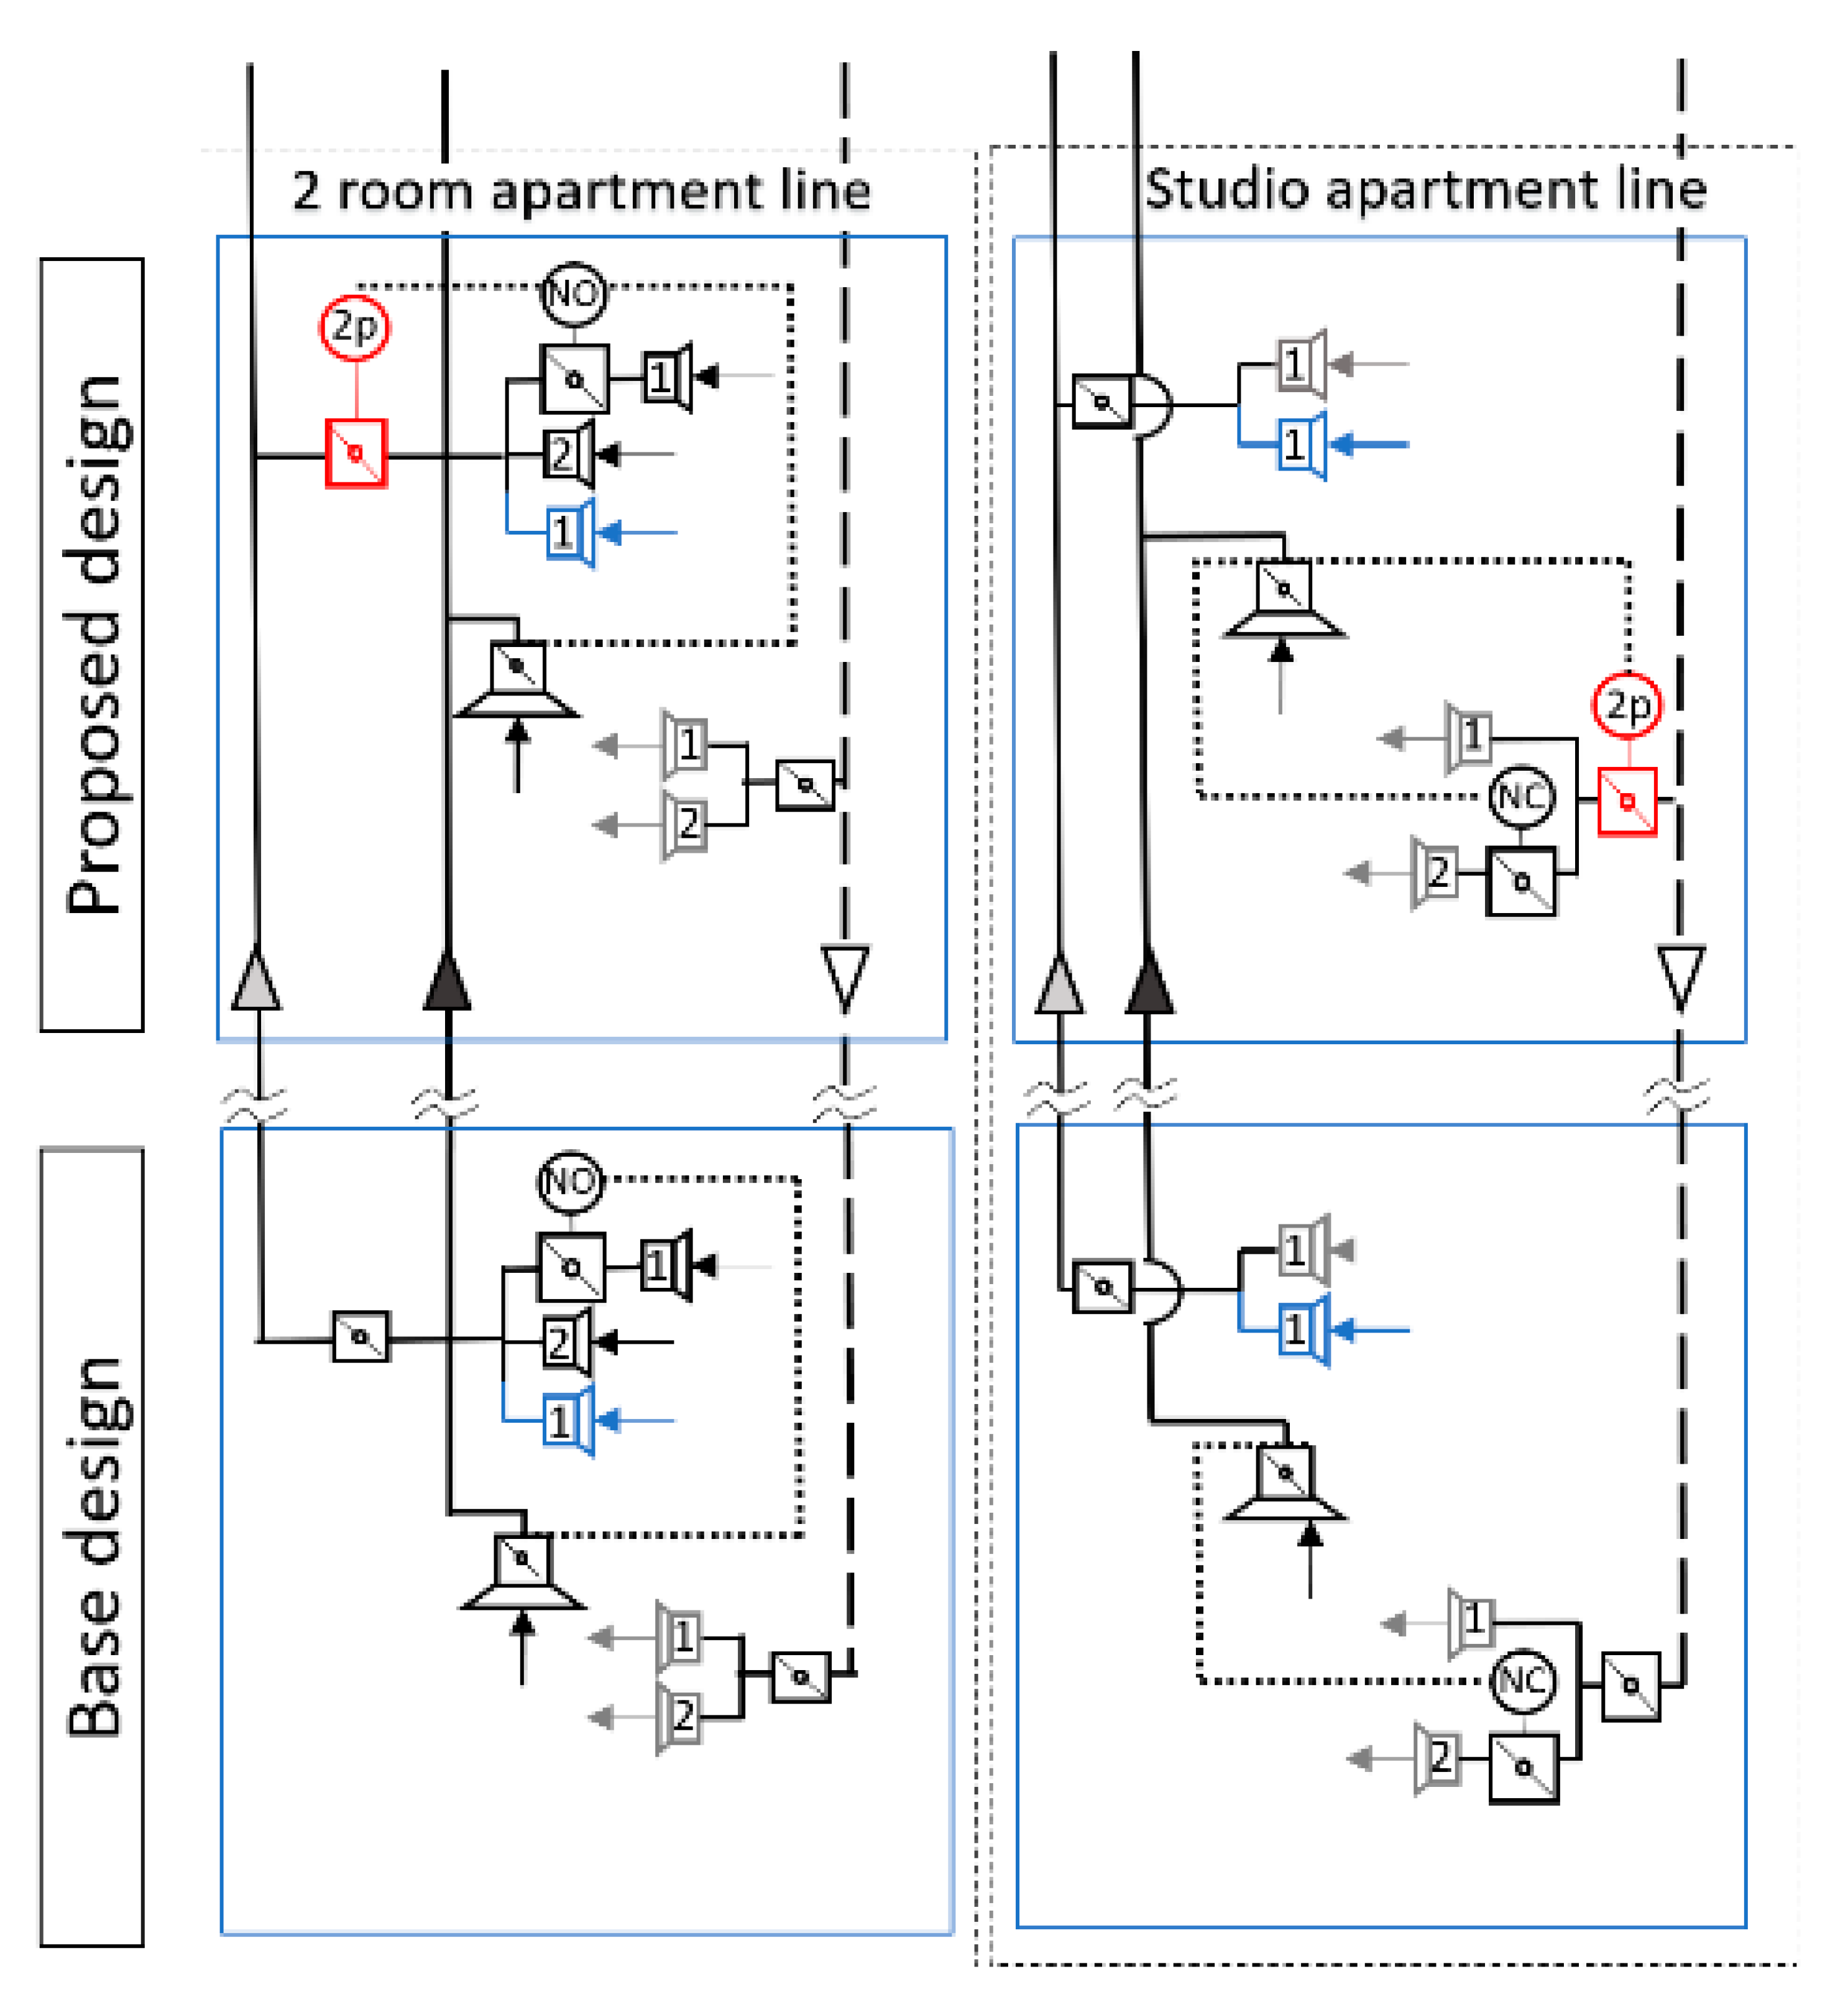
 |  |
| Apartment Type | 2.5 1/h | 1 1/h | 0.5 1/h |
|---|---|---|---|
| Studio apartment | −4.4 Pa | −15.4 Pa | −39.8 Pa |
| 2-room apartment | −1.6 Pa | −5.5 Pa | −15.4 Pa |
| 3-room apartment | −0.9 Pa | −3.3 Pa | −12.7 Pa |
| 4-room apartment | −0.7 Pa | −2.5 Pa | −6.4 Pa |
Publisher’s Note: MDPI stays neutral with regard to jurisdictional claims in published maps and institutional affiliations. |
© 2020 by the authors. Licensee MDPI, Basel, Switzerland. This article is an open access article distributed under the terms and conditions of the Creative Commons Attribution (CC BY) license (http://creativecommons.org/licenses/by/4.0/).
Share and Cite
Kravchenko, I.; Kosonen, R.; Kilpeläinen, S. Performance Analysis of the Demand-Based Ventilation in a Nordic Apartment Building. Appl. Sci. 2021, 11, 176. https://doi.org/10.3390/app11010176
Kravchenko I, Kosonen R, Kilpeläinen S. Performance Analysis of the Demand-Based Ventilation in a Nordic Apartment Building. Applied Sciences. 2021; 11(1):176. https://doi.org/10.3390/app11010176
Chicago/Turabian StyleKravchenko, Ilia, Risto Kosonen, and Simo Kilpeläinen. 2021. "Performance Analysis of the Demand-Based Ventilation in a Nordic Apartment Building" Applied Sciences 11, no. 1: 176. https://doi.org/10.3390/app11010176
APA StyleKravchenko, I., Kosonen, R., & Kilpeläinen, S. (2021). Performance Analysis of the Demand-Based Ventilation in a Nordic Apartment Building. Applied Sciences, 11(1), 176. https://doi.org/10.3390/app11010176