Article

Determining the Combining Ability and Gene Action for Rice Yellow Mottle Virus Disease Resistance and Agronomic Traits in Rice (Oryza sativa L.)

1
African Centre for Crop Improvement (ACCI), School of Agricultural, Earth and Environmental Sciences, University of KwaZulu-Natal, Private Bag X01, Scottsville, Pietermaritzburg 3209, South Africa
2
Tanzania Agricultural Research Institute, Ilonga Centre (TARI-Ilonga), P.O. Box 33, Kilosa 67410, Morogoro, Tanzania
*
Author to whom correspondence should be addressed.
Agronomy 2021, 11(1), 12; https://doi.org/10.3390/agronomy11010012
Submission received: 4 November 2020 / Revised: 15 December 2020 / Accepted: 16 December 2020 / Published: 23 December 2020

Abstract

:
Selecting genetically diverse and complementary parental lines and superior crosses are pre-requisites in developing improved cultivars. The objectives of this study were to determine the combining ability effects and gene action conditioning rice yellow mottle virus disease (RYMVD) resistance and agronomic traits in rice (Oryza sativa L.). Ten parental lines and their 45 F2 progenies were field evaluated in three locations using a 5 × 11 alpha lattice design with two replications. The genotype × site interaction effects were significant (p < 0.05) for the number of tillers (NT), number of panicles per plant (NPP), number of grains per panicle (NGP), percentage of filled grains (PFG), thousand grain weight (TGW), RYMVD resistance and grain yield (GY). The analysis of general and specific combining ability (GCA and SCA) indicated involvement of both additive and non-additive gene action governing inheritance of traits. High GCA/SCA ratio estimate revealed additive genetic effect was predominant. Parental lines Mwangaza, Lunyuki, Salama M-57, Salama M-19, IRAT 256 and Salama M-55, which had negative GCA effects for RYMVD, and families such as SARO 5 × Salama M-55, IRAT 245 × Rangimbili, Rangimbili × Gigante and Rangimbili × Mwangaza, which had negative SCA effects for RYMVD, were selected for RYMV resistance breeding. The crosses Rangimbili × Gigante, Gigante × Salama M-19 and Rangimbili × Salama M-55 were selected due to their desirable SCA effects for GY. The predominance of additive gene effects for agronomic traits and RYMVD resistance in the present breeding populations suggested that rice improvement could be achieved through gene introgression using recurrent selection.

1. Introduction

Rice (Oryza sativa L., 2n = 2x = 24) is the second most important global crop after wheat in terms of total production [1]. Globally, rice is cultivated on about 167 million hectares with an annual production of 744.4 million tons of grain [2]. More than 90% of rice is grown and consumed in Asia [3,4], while sub-Saharan Africa (SSA) region accounts for about 10% of the global rice production [5]. In East and Southern Africa region, Tanzania is the second largest producer of rice after Madagascar. Rice is ranked as the second most important staple crop after maize (Zea mays) in Tanzania [6,7].
Despite the contribution of rice to food and nutrition security, and enhanced livelihoods of millions of people in Tanzania, the average yield in the country is 1.5 t ha−1, which is significantly lower than the yield potential of 4.6 t ha−1 reported in Asia [5]. The low productivity of rice in Tanzania is caused by a combination of biotic and abiotic stresses, and socio-economic constraints [8]. The rice yellow mottle virus (RYMV) disease has been identified as a major biotic constraint limiting rice productivity in SSA countries including Tanzania [7,9]. The disease has since become endemic in all the rice-growing regions under both rain-fed and irrigated production farming systems [10]. The RYMV causes yield losses ranging from 20% to 100%, depending on cultivar susceptibility, and stage of growth at the onset and development of infection [6,11,12]. The RYMV disease is characterized by mottling and yellowing symptoms, resulting in reduced photosynthetic area, stunted growth, reduced tiller formation and increased grain sterility [9,11]. Locally grown, farmer-preferred rice varieties with good culinary properties have been reported to be susceptible to RYMV [13]. Hence, there is a need to develop improved rice varieties with RYMV resistance and farmer-preferred traits.
Host plant resistance is the most economical and environmentally friendly approach to control the RYMV. The development of RYMV resistant and agronomically superior genotypes requires genetically diverse and complementary parental lines and superior crosses for selection [14]. Genes conditioning RYMV resistance have been reported previously [15,16,17]. The RYMV1 and RYMV2 are the most widely reported genes [15,18,19]. Hence, RYMV resistant and agronomically suitable donor parents can be used in local pre-breeding programs to develop new populations for variety development. Gene introgression requires an understanding of the nature of gene action and trait heritability.
Assessing combining ability and gene action for RYMV resistance and agronomic traits in rice would provide a basis for the development and selection of a breeding population. Combining ability analysis can facilitate the selection of suitable parents for hybridization, and identification of promising recombinants [20,21,22]. Broadly, combining ability is divided into the general combining ability (GCA) effects of the parents, and the specific combining ability (SCA) effects of the crosses. The GCA is the average performance of a line in a series of hybrid combinations and relates to additive gene action. The SCA refers to the deviation of the performance of a cross-based on the average performance of its parents. The SCA effects are associated with non-additive gene actions such as dominance and epistasis [23]. In a breeding program, selection of parents showing good GCA effects and their progenies with high SCA effects for desirable traits are essential.
The diallel mating design has been extensively utilized in determining the combining ability effects in rice breeding following [24]. This mating design has been widely used in genetic analysis to investigate the inheritance of important traits of various crops including rice. The design entails crossing of a parent with other parents in all possible combinations. With diallel analysis, it is assumed that the genes in the parents are independently distributed. The mating design is useful in providing pedigreed breeding population for selection, progeny tests and to estimate genetic parameters. The diallel was used because it can facilitate analyses of progenies developed from combinations involving a wide range of parents including inbred lines or broad-based parental lines. Griffings’ full diallel analysis (Method I) that includes parents, crosses and their reciprocals is used to estimate maternal effects, while Method III includes only parents that becomes the design of choice in various genetic analysis studies. Method II includes reciprocals and is used in measuring various genetic parameters. Method II reduces the number of entries from p2 cross combinations, for a full diallel, to p/2(p + 1) [24]. This lowers both labor and cost of the crossing program, particularly for crops with cleistogamous flowering system such as rice.
Several studies have been carried out on combining ability effects in rice with varied results. Refs. [25,26] reported a preponderance of additive gene action in conditioning RYMV resistance. Conversely, Ref. [27] who reported dominance gene action was responsible for conditioning resistance to RYMV. Therefore, combining ability analyses and genetic predictions are dependent on the test populations and environment. With a goal of developing rice varieties adapted to Tanzanian conditions, with strong RYMV resistance, genetically diverse rice genotypes were assembled and evaluated using agronomic traits and simple sequence repeat (SSR) markers [28]. The RYMV resistance is the trait of priority for this research. However, there is need to complement economic agronomic traits such as early flowering and maturity, panicle size or other farmer-preferred desirable traits. RYMV resistant varieties must be suitable for farming conditions or meet farmer expectations in other attributes. Consequently, breeding for the RYMV resistance was considered in combination with other agronomic performance. The RMYV resistance is the most significant trait. Breeding approach based on recurrent backcrossing to at least the BC5 generation would be more appropriate, with field evaluation in Tanzania. This allowed for the selection of promising and complementary parents to be included in a rice pre-breeding program in Tanzania. Therefore, the objective of this study was to determine the combining ability effects and gene action conditioning rice yellow mottle virus resistance and agronomic traits in the selected parental lines and derived families for subsequent breeding activities.

2. Materials and Methods

2.1. Plant Materials

Ten selected rice genotypes were used to generate new populations. A description of the parental genotypes are presented in Table 1. The parents were selected from previous phenotypic and genotypic evaluations for their diversity in terms of RYMV resistance and agronomic traits. The parental varieties (accessions) were selected based on their high yield and RYMV resistance while landraces were included because of their wide adaptability to varied growing environments, agronomic and quality (aromatic) traits preferred by smallholder farmers and local markets. The selections included genotypes sourced from Sokoine University of Agriculture (SUA), landraces from local farmers, a variety from the Tanzania Agricultural Research institute (TARI) and one genotype from AfricaRice.

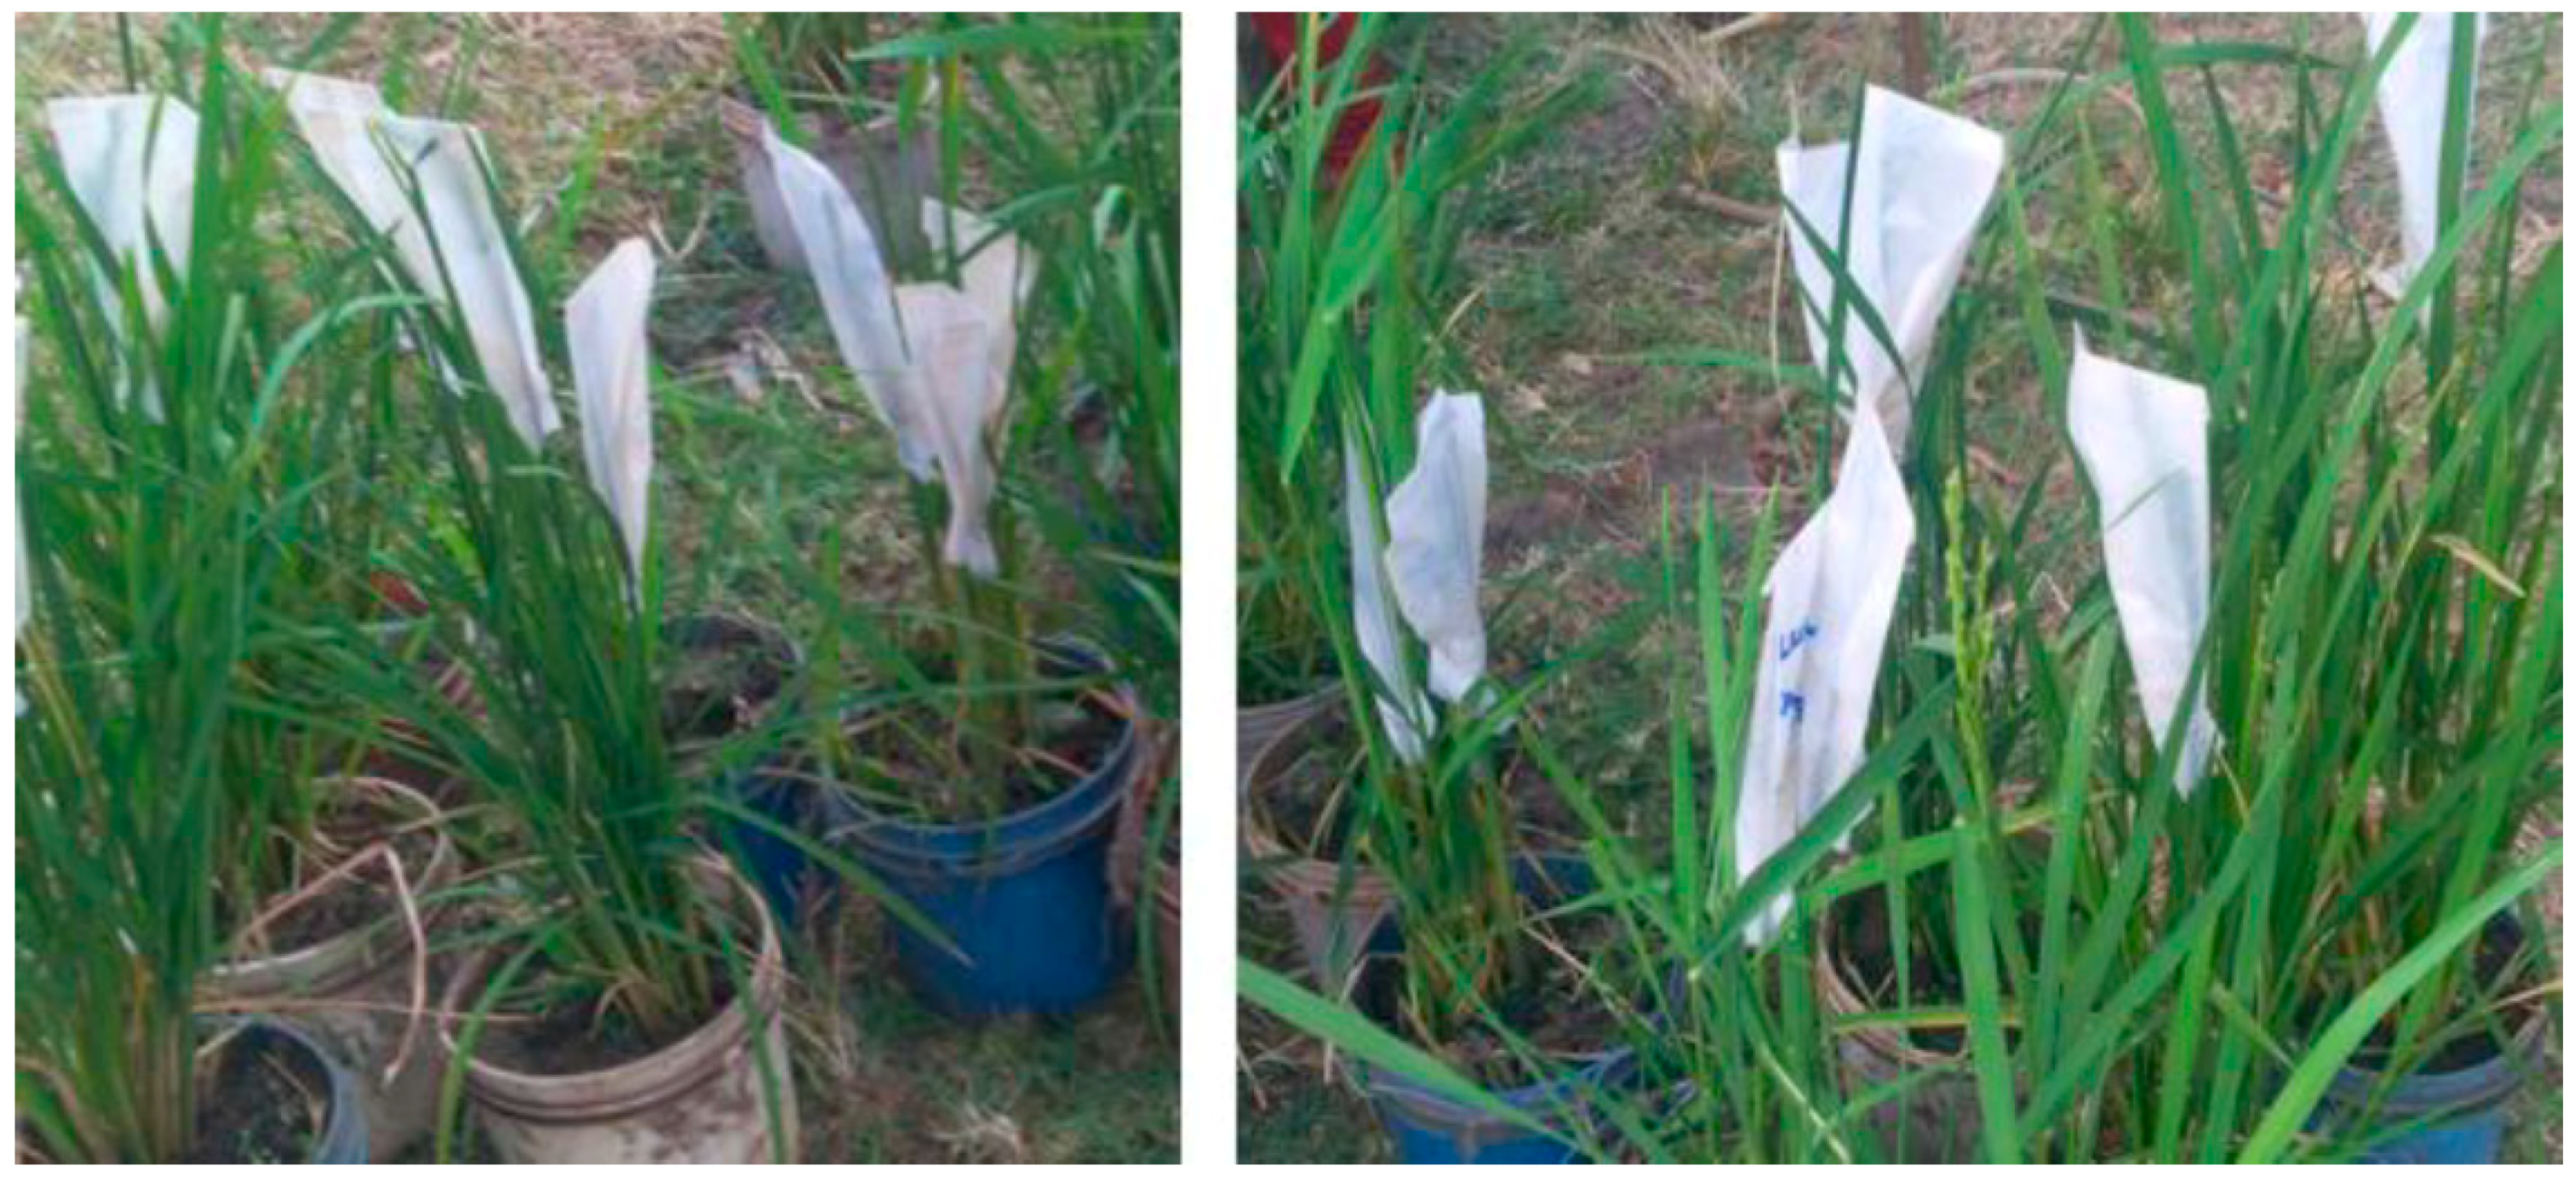
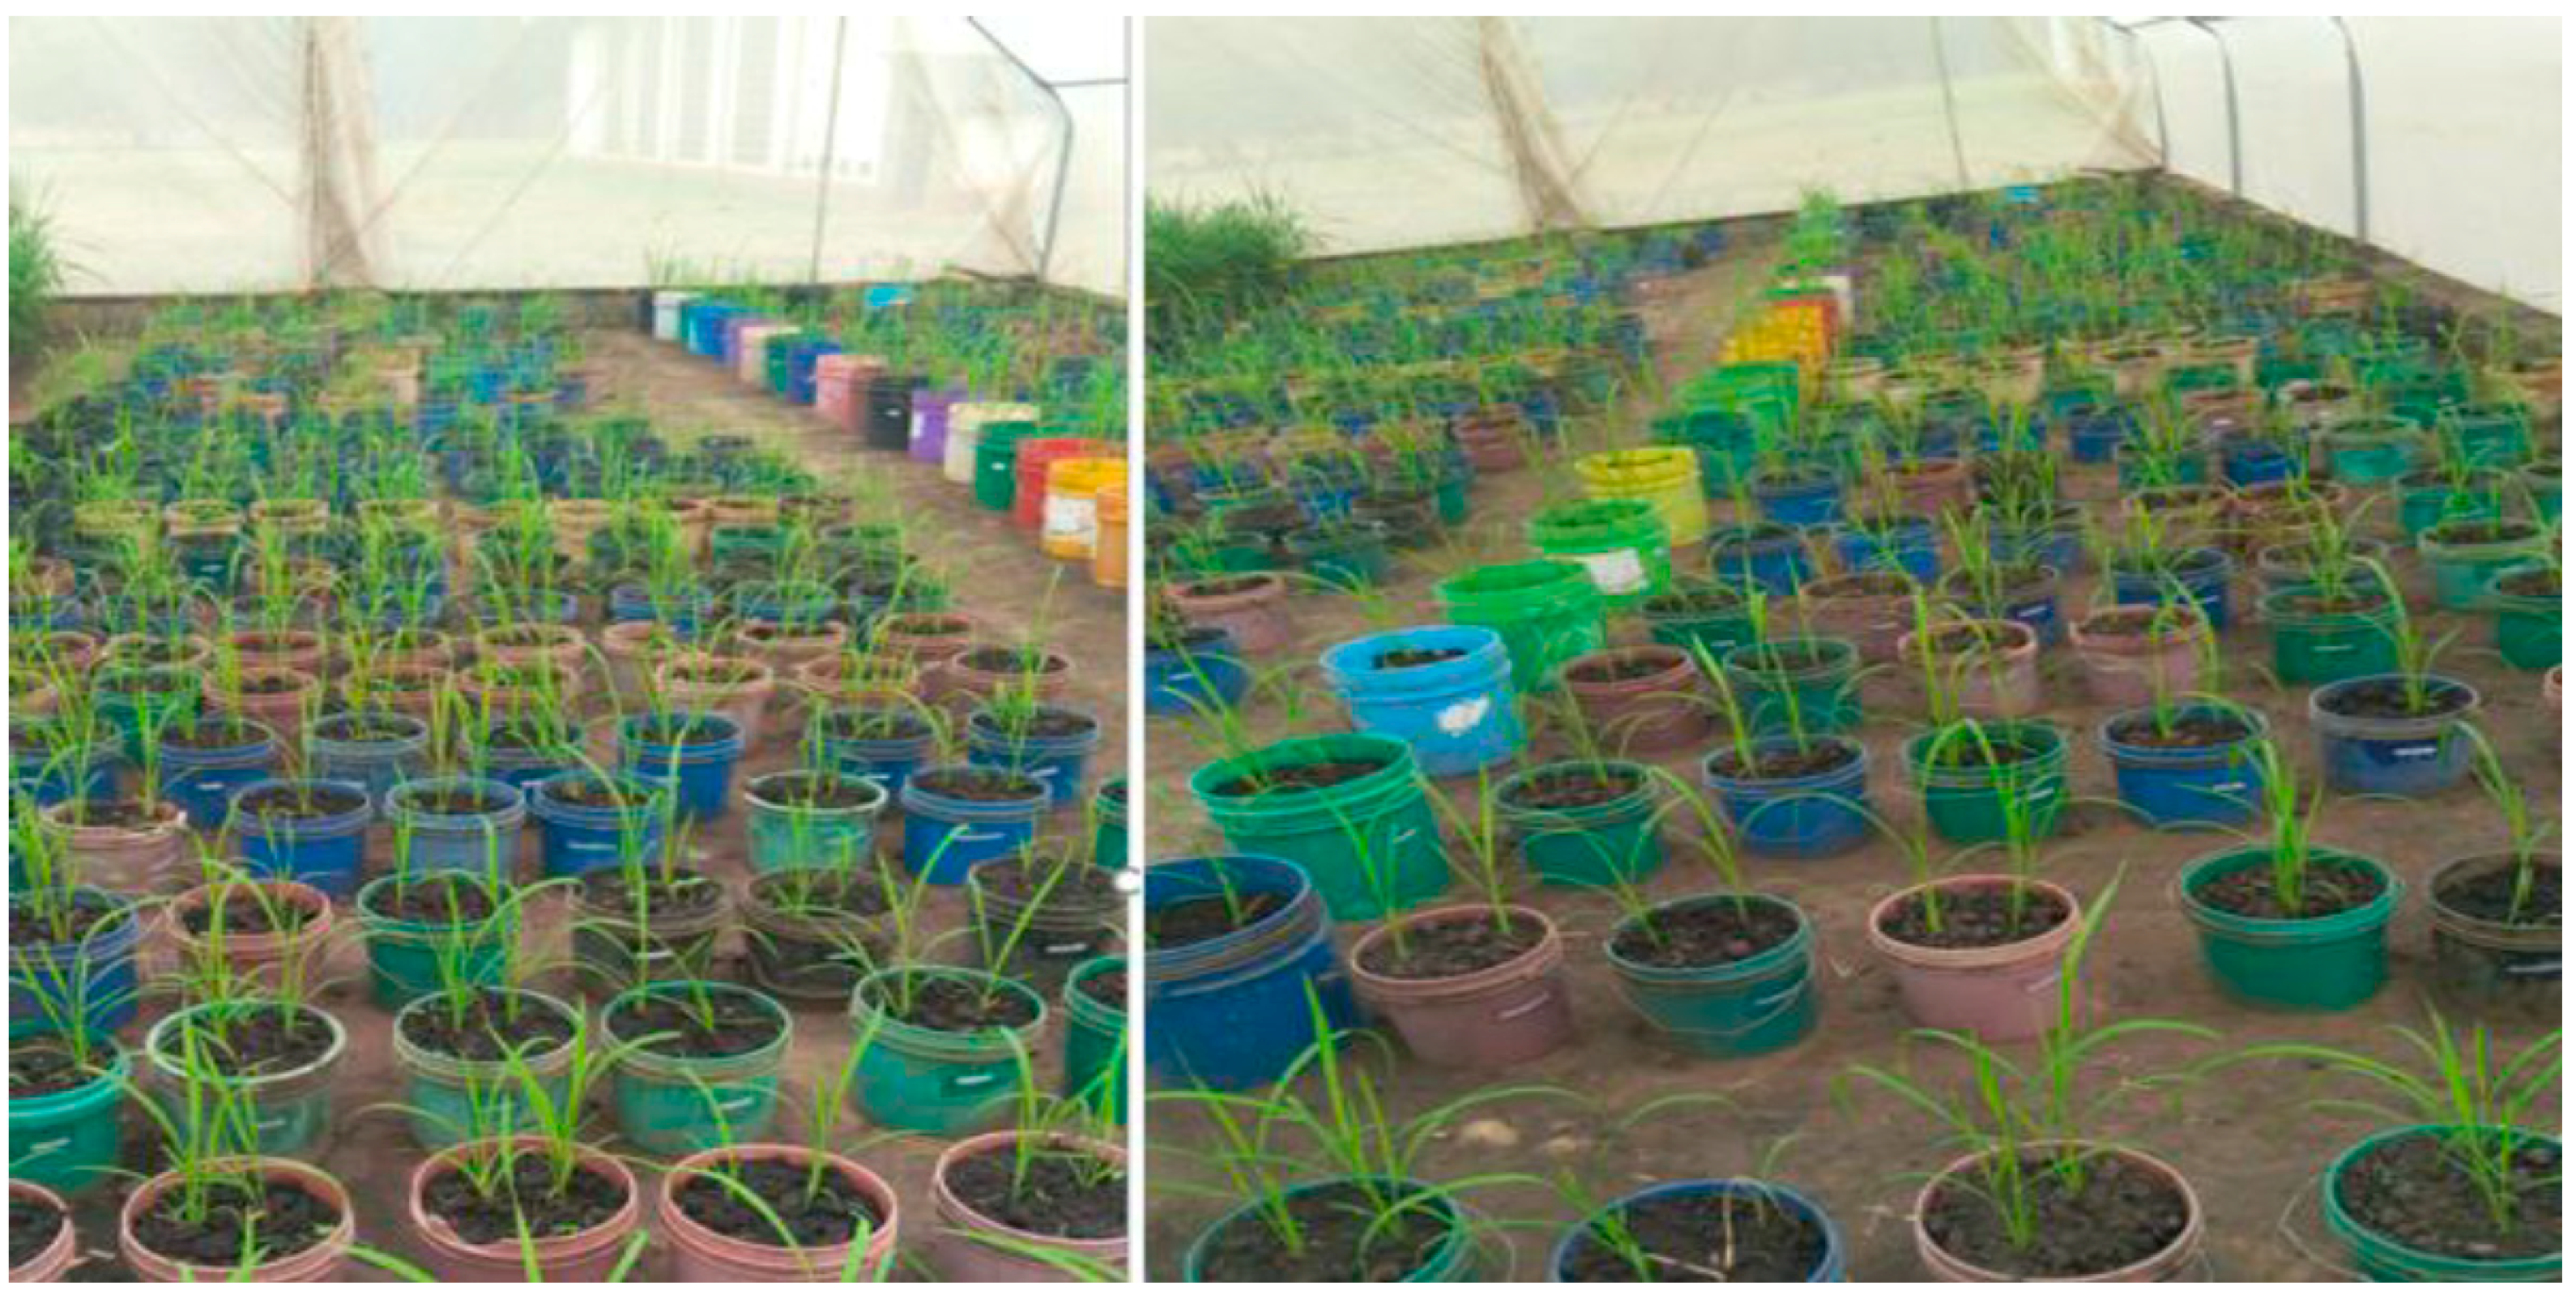
2.2. Population Development

Crossing blocks were initiated under a screenhouse condition at Tanzania Agricultural Research Institute (TARI), Ilonga (6°50′3.39″ S and 36°59′30.17″ E), with an altitude of 491 m above sea level. The temperature range and mean relative humidity during the growing period were 20–32 °C and 87.4%, respectively. The parents were planted in 10 L capacity plastic pots. Crosses were undertaken using a 10 × 10 half-diallel mating design to produce 45 F1 families, between May and August in 2018. Parents were stagger-planted at weekly intervals to synchronize flowering. A vacuum emasculation method was used [29]. Pollination was carried out between 10.00 a.m. to 12:00 noon. After emasculation, panicles were immediately covered with a pollination bag and sealed with paper clips to avoid unintended cross-pollinations. The pollinating bag was removed from the emasculated female parent and a fertile panicle from the male parent was gently dusted onto the female panicle. The flowers were bagged immediately after hand pollination. The pollinating bag covered the female parent (Figure 1) to prevent cross-pollination and to maintain high relative humidity for better fertilization. Mature seeds from each successful cross were harvested 25 to 30 days after pollination and kept separately with proper records. The seed of the F1 crosses (Figure 2 and Figure 3) were planted for seed bulking and genetic analysis at the F2 generation.

2.3. Field Evaluations

2.3.1. Descriptions of the Study Areas

The parental lines and their F2 crosses were field evaluated in three sites namely, Ifakara, Ilonga and Mkindo sites in Tanzania (Table 2). The experimental sites are recognized hotspots for RYMV disease [6,10]. The sites are known for the high disease pressure that develops during the growing season and can cause yield losses of 100% under epidemic conditions [10]. Evaluations were conducted during the main cropping season (December 2019 to June 2020). The climatic conditions of the study sites are summarized in Table 2. All the three sites experience a sub-humid tropical climate with a bimodal rainfall distribution. The short rainy season usually starts in October and ends in December, while the long rainy season lasts between March and May.

2.3.2. Experimental Design and Management

The 10 parents and the 45 F2 crosses were established using a 5 × 11 alpha lattice design with two replications at each site. Each genotype was planted in a plot measuring 2.4 m × 2.4 m. The seeds were planted directly at Ifakara while transplanting of 21-day old seedlings was carried out at the Ilonga and Mkindo sites. The seeds or seedlings were sown or transplanted, respectively, in each plot at a spacing of 20 cm × 20 cm, with one plant per hill. Potassium and phosphorous fertilizers were used for basal application at all sites prior to planting at a rate of 65 kg P ha−1 and 54 kg K ha−1, respectively. Urea fertilizer (46% nitrogen content) was broadcasted in two equal splits (the first at tillering and the second at panicle initiation) as top dressings to deliver a total level of 60 kg N ha−1. The rest of the cultural practices, including thinning and hand weeding, were applied as recommended, to ensure uniform and healthy crop growth.

2.3.3. Data Collection

Data collected included the rice yellow mottle virus reaction and agronomic traits, based on the IRRI Standard Evaluation System (SES) for rice [3]. The severity of the rice yellow mottle virus (RYMV) disease reaction was scored using a scale of 1 to 9 [30] (Table 3).
Data on days to 50% flowering (DFL), number of tillers per plant (NT), plant height (PH), number of panicles per plant (NPP), panicle length (PL), number of grains per panicle (NGP), percentage-filled grains per panicle (PFG), 1000-grain weight (TGW) and grain yield (GY) were collected. The DFL were recorded by counting the number of days from sowing to when 50% of all the plants in each plot had flowered. The NT from 10 randomly selected plants in a plot were recorded at physiological maturity. PH was measured in centimeters (cm) using a ruler from the soil surface to the tip of the longest panicle at physiological maturity. The NPP was recorded by counting the number of fully exerted panicles bearing grains from a sample of selected 10 plants and their sum averaged to obtain the NPP. The PL was measured in centimeter using a ruler from the panicle base node to the tip (end) at the base on 10 randomly selected plants per plot. NGP was counted using a seed counter and recorded as an average of samples from 10 panicles per plot. The PFG was calculated as the proportion of unfilled grains to the total number of grains from 10 sampled panicles per plot. TGW in grams was obtained by counting 1000 grains from each plot using a seed counter (Elmor C1, Biotronic Bharat, New Delhi, India) and weighing on an electronic balance (Ohaus Scout Pro Model 502 AC, Beijing, China). The GY was determined by harvesting all panicles in each plot. The panicles were threshed and winnowed to remove chaff. The weight of the grains was adjusted to 14% moisture content and was expressed in tons per hectare (t ha−1).

2.3.4. Data Analysis

The performance of each cross and parent was determined through the analysis of variance using the REML procedure of GenStat 24th edition [31] and data normality was tested using the Shapiro–Wilkes test before the analysis of variance (ANOVA). Means separation was performed using the Fishers’ Unprotected Least Significant Difference (LSD) procedure at a 5% probability level. Separate ANOVAs were conducted using REML approach for each location and later combined data analysis were calculated across locations after a test for homogeneity of variance was conducted. Parents and crosses were considered as fixed effects, while replication was considered as a random effect in computing the ANOVA for combining ability effects. Griffing’s [24] diallel method 2, model 1, was used to estimate the GCA and SCA effects as:
Yij = μ + gi + gj + sij + 1 b c Σ k   eijkl .
where Yij = observed value of the cross between parent i and j; μ = The population (general) mean; gi and gj = GCA effects of ith and jth parents, respectively; sij = SCA of the cross between parents i and j; eijkl = environmental effect associated with ijklth individual observation in kth replication. The GCA for each parent was calculated as described by [22]:
GCAP = XP − μ.
The SCA effects of the crosses were computed from the formula:
SCAX = XX − E (XX) = XX − [GCAP + μ];
where GCAP = general combining ability effect of the parent; XP = Mean of the parent; μ = Overall mean of all crosses; SCAX = specific combining ability of the parent in the cross; XX = observed mean value of the cross; E (XX) = expected values of the cross basing on the GCA of the parent.
Baker’s ratios were also computed to estimate the relative importance of additive and non-additive gene action in the expression of traits using Baker’s general predicted ratio (GPR) as follows:
GCA/SCA = 2MSGCA/(2MSGCA + MSSCA)
where MSGCA = mean square for GCA and MSSCA = mean square for SCA.
A ratio of >0.5 implies that GCA is more important than SCA in the inheritance of the character and a ratio of <0.5 implies that SCA is more important than GCA in the inheritance of the character [32].

3. Results

3.1. Analysis of Variance and Mean Performance

The mean squares and significant tests among genotypes revealed that NT, NPP, NGP, PFG, TGW and GY were significantly (p ≤ 0.05) affected by genotype × site interaction effects (Table 4). The genotypes exhibited significant differences for all assessed traits. Genotype performance also varied across the sites for all the traits except for the RYMV reaction.
Mean values, coefficients of variation (CVs), and least significant differences (LSDs) of the genotypes evaluated across three locations are presented on Table 5. The mean DTF was 81.5 days (Table 5). Cross Lunyuki × Mwangaza was the earliest to attain 50% flowering at 66 days, which was followed by crosses Mwangaza × Salama M-19 and IRAT 256 × Rangimbili both at 67 days. Zambia × Salama M-55 was the latest cross to flower and mature at 116 days. The parent Mwangaza was the earliest to reach 50% flowering, after 66 days (Table 5). The NT ranged from 9 to 14 with a mean of 10.6. In terms of tillering capacity, the crosses IRAT 256 × Zambia and IRAT 256 × Lunyuki produced the maximum NT of 14 and 13, respectively. The PH ranged between 97.4 and 132 cm, with a mean of 115.2 cm. Crosses SARO × Gigante, SARO × Salama M-55 and Rangimbili × Mwangaza were the shortest with PHs of 97.4 cm, 101.4 cm and 101.6 cm, respectively. Cross IRAT 256 × SARO was the tallest at 157.7 cm. The parent Rangimbili recorded with the highest PH of 132.7 cm. The mean number of NPP varied from 9 to 13, with a grand mean of 9.5 NPP (Table 5). The highest number of NPP was 13, and 12 observed on the crosses IRAT 256 × Lunyuki and IRAT 256 × Zambia, in that order. The mean PL of the test genotypes was 23.7 cm. The longest PL crosses across the testing environments were Zambia × SARO and Rangimbili × Salama M-55 with PL of 25.3 cm and 25.2 cm, respectively. The mean NGP of the test genotypes was 124.5. The crosses with the maximum NGP were Salama M-57 × IRAT 256, Rangimbili × Gigante, Gigante × Salama M-19 and Salama M-55 × Gigante, with 147, 146, 145 and, 144 NGP, in that order. The parents Salama M-55 and Salama M-19 had the highest NGP of 171 and 157, respectively. The PFG values varied from 64.2 to 97.1% with a mean of 84.1%. The best performing crosses were Gigante × Salama M-19, Rangimbili × Mwangaza, Salama M-57 × Lunyuki, and IRAT 256 × Mwangaza with PFG of 96.6%, 95.4%, 95.3% and 95.1%, respectively. The parental lines Mwangaza, Salama M-55 and Salama M-19 recorded with the highest means for PFG. The mean TGW was 32.3 g. Families Rangimbili × Mwangaza, Lunyuki × Mwangaza, Mwangaza × Salama M-19 and Mwangaza × Gigante had the highest TGW value of 34.3 g, 34 g, 33.8 g and 33.7 g, respectively. The RYMVD symptoms ranged from 1 to 7 with the overall mean score of 3.5. Crosses Salama M-57 × IRAT 256, Salama M-57 × Lunyuki, Salama M-57 × Mwangaza, Salama M-57 × Salama M-19, IRAT 256 × Rangimbili, IRAT 256 × Mwangaza, Rangimbili × Mwangaza, Lunyuki × Mwangaza, Lunyuki × Salama M-19, SARO × Salama M-55, Mwangaza × Salama M-19, Salama M-55 × Gigante, and Salama M-55 × Salama M-19 had the sources of RYMVD resistance with lowest RYMVD score of 1. The parental lines Salama M-57, IRAT 256, Lunyuki, Mwangaza, Salama M-55, and Salama M-19 showed resistance to RYMVD with a score of 1. The GY differed from 2.7 to 4.7 t ha−1 with a mean of 3.7 t ha−1. The crosses with the highest GY values (Table 5) were Salama M-57 × IRAT 256, Rangimbili × Salama M-55, Rangimbili × Gigante, Gigante × Salama M-19, Salama M-55 × Gigante, IRAT 256 × Rangimbili, and Salama M-57 × SARO had mean grain yield of > 4.0 t ha−1. The parental lines Salama M-19, Salama M-57, Salama M-55, and IRAT 256 had the highest means for grain yield, producing 4.0 t ha−1 each.

3.2. Combining Ability Effects of Parents and Their Crosses

The GCA and SCA variances for RYMVD reaction and assessed agronomic traits were significant (p ≤ 0.001) (Table 6). The GCA and SCA effects for most agronomic traits exhibited marked variability across the test sites exhibited by their significant interaction with the site variance. In contrast, the GCA and SCA effects for RYMVD were not affected by site variance.

3.3. General Combining Ability Effects of the Parents

The GCA effects for agronomic traits and RYMVD reaction varied widely among the parental lines (Table 7). Lines with negative GCA effects for RYMVD reaction scores and DFL are ideal for developing RYMVD resistant and early flowering cultivars, in that order. Parents Mwangaza, IRAT 256, Lunyuki and Salama M-57 had low negative GCA effects for DFL. SARO 5, IRAT 256, Gigante and Salama M-57 had high positive GCA for NT and NPP. Gigante and SARO 5 recorded with low negative GCA effects for PH. Parents Zambia and Salama M-55 had high positive GCA effects for PL. Further, Salama M-55, Rangimbili and Salama M-57 had large positive GCAs for NGP. Positive GCAs were also observed for the PFG on Salama M-57, Mwangaza, and Lunyuki. The parents IRAT 256, Mwangaza and Gigante had the highest GCA effects for TGW. Negative GCAs for RYMVD reaction were observed for parents Mwangaza, Lunyuki, Salama M-57, Salama M-19, IRAT 256 and Salama M-55. Parental lines Salama M-57, IRAT 256, and Salama M-19 exhibited the highest GCA effects for GY, making them suitable candidates for GY improvement.

3.4. Specific Combining Ability Effects of Crosses

The crosses exhibited marked variation based on the SCA effects for the assessed traits (Table 8). The families, including Zambia × Salama M-19, SARO 5 × Salama M-55, Salama M-55 × Salama M-19 and Rangimbili × SARO 5, had low negative SCA effects for DFL in a desirable direction. Salama M-57 × SARO 5, IRAT 256 × Zambia, IRAT 256 × Lunyuki and Zambia × Salama M-19 had large positive SCA effects values for NT. Crosses SARO 5 × Salama M-55, Rangimbili × Mwangaza, IRAT 256 × Rangimbili and SARO 5 × Gigante recorded low SCA effects for PH. The highest positive SCA effects for NPP were obtained from the crosses IRAT 256 × Zambia, IRAT 256 × Lunyuki, Salama M-57 × SARO 5 and Rangimbili × Zambia. Crosses Zambia × SARO 5, Mwangaza × Gigante and Salama M-57 × Rangimbili had high positive SCA effects for PL. The crosses Salama M-57 × IRAT 256, Gigante × Salama M-19, Rangimbili × Gigante, IRAT 256 × Rangimbili and Lunyuki × Mwangaza had large positive SCA effects for NGP. Likewise, SARO 5 × Gigante, Lunyuki × SARO 5, Rangimbili × Salama M-55, Salama M-57 × Rangimbili and Salama M-55 × Gigante had high positive SCA estimates for NGP. Rangimbili × Gigante, Gigante × Salama M-19, SARO 5 × Salama M-55, IRAT 256 × Rangimbili recorded with high positive SCA effects for PFG. Crosses Rangimbili × Mwangaza, Lunyuki × Mwangaza, Lunyuki × SARO 5 and IRAT 256 × Rangimbili had positive SCA effects for TGW. Crosses SARO 5 × Salama M-55, IRAT 245 × Rangimbili, Rangimbili × Gigante, Rangimbili × Mwangaza and Salama M-57 × IRAT 256 had low negative SCA effects for RYMVD. Rangimbili × Gigante, Gigante × Salama M-19, Rangimbili × Salama M-55, Salama M-57 × IRAT 256, IRAT 256 × Rangimbili and Mwangaza × Salama M-19 had high positive SCA effects value for GY. Crosses IRAT 256 × Mwangaza, Lunyuki × Mwangaza, Zambia × Gigante and Zambia × Salama M-55 also had high SCA effects for GY.

4. Discussion

4.1. Analysis of Variance and Mean Performance of Genotypes

The significant differences for agronomic traits and RYMVD reaction among the parental lines and their progenies (Table 4) indicated the existence of adequate genetic variability for establishing a successful rice-breeding program. The observed variation is underpinned by differences in genetic constitution among the parental lines, which may have evolved from different gene pools, and provided useful segregants among the F2 progenies. The parental lines included landraces, accessions and varieties. The genetic groups have different characteristics, which gave rise to the observed variation in the F2. For instance, landraces are known to be segregating at numerous loci, while varieties are the products of careful and deliberate selection that makes them very different from landraces [33].
Genetic variability for agronomic traits such as DFL, NT, PH, NPP, NGP, TGW and GY has been also reported in previous studies. For instance, Ref. [4] who found significant genotypic variation among rice accessions evaluated in Bangladesh. Ref. [26] who found significant genotypic variation for RYMV disease reaction and agronomic traits in rice in Uganda. Ref. [34] who reported significant variation in yield and its contributing traits in newly developed rice genotypes in China. In the present study, across sites variability was not detected for the RYMVD reaction among the test genotypes (Table 4). This was attributed to the high disease pressure found at each of the test sites, ensuring even levels of RYMVD infection and disease development. This is contrast to [11,35], who reported that RYMV disease infection and disease development were affected by the test environments. Nine crosses were highly resistant to RYMV disease, with scores of 1.0, indicating that they possessed strong RYMV resistance, possessing the RYMV1 or RYMV2 genes, or new resistance gene(s). Refs. [15,18] who reported the RYMV1 and RYMV2 genes were responsible for resistance to RYMV disease in most African rice varieties. Families such as Salama M-57 × IRAT 256, Salama M-57 × Lunyuki, Salama M-57 × Salama M-19, IRAT 256 × Rangimbili, IRAT 256 × Mwangaza, Rangimbili × Mwangaza, Lunyuki × Mwangaza and SARO 5 × Salama M-55 were identified as new sources of RYMV resistance genes for breeding.
There were significant genotype × location interaction effects for agronomic traits across three test sites. For instance, crosses Rangimbili × Salama M-55 and Salama M-57 had the higher mean values for GY and NGP, respectively, at the Ilonga site than the Ifakara and Mkindo sites. This was probably because different rainfall and temperature conditions existed between the three locations, the highest rainfall being at the Ilonga site. Rainfall and air temperature affected rice yield responses in the Guinea Savannah Zone [36]. Yield components are quantitative traits and their expressions is affected by the genotype × environment interactions. Rice genotypes were evaluated in Nigeria yielding significant environmental influence on agronomic performance [37]. The significant genotype × environment interaction effects provides opportunities to identify genotypes with specific or broad adaptation. Some of the crosses, such as Salama M-57 × IRAT 256, Rangimbili × Salama M-55, Rangimbili × Gigante, Salama M-55 × Gigante, and Gigante × Salama M-19, performed well at all three sites with a high level of stability. Such genotypes would be ideal for developing cultivars with broader yield stability across sites. There is an opportunity to select transgressive segregants amongst the new families. The cross Salama M-57 × IRAT 256 yielded better than the parents across test environments, indicating superior genetic combinations.
Selection of superior rice genotypes across sites should target multiple traits including NT, PL, NGP, PFG and TGW, aiming to increase adaptability to biotic and abiotic stresses. Crosses such as Salama M-57 × IRAT 256, Salama M-19 × Gigante, Rangimbili × Gigante, Rangimbili × Salama M-55, Salama M-55 × Gigante, IRAT 256 × Rangimbili and IRAT 256 × Mwangaza exhibited desirable grain yield and RMVD resistance, which make them suitable candidates for breeding.

4.2. Combining Ability Effects and Gene Action

Establishment of a successful breeding program depends on the magnitude of the combining ability effects of parents and trait heritability to the offspring. The study found significant GCA and SCA effects for all the traits, indicating that both additive and non-additive gene actions condition the inheritance of RYMV resistance and the tested agronomic traits. This implies that crosses and recurrent selection programs can be used to exploit both additive and non-additive gene action to enhance grain yield in rice. The GCA effects indicate that selection of high performing parents would contribute to the generation of superior crosses for cultivar development. Previous studies reported the significance of both additive and non-additive gene action in the expression of agronomic and yield traits [38,39,40]. The GCA and SCA effects exhibited variability across sites showing that environmental variance influenced the ability of parents to pass favorable traits to their offspring. The high GCA: SCA ratios calculated for all the traits in this study indicated that additive gene effects were preponderant over non-additive gene effects, and therefore a recurrent selection approach would be effective for trait improvement. Similarly, [41] who found that additive gene action was preponderant for several agronomic traits including DFL, NT, NGP, PFG and GY. Other studies have reported that additive gene action has a predominant role in the inheritance of agronomic traits and RYMVD resistance in rice [4,26,42,43].

4.3. General Combining Ability Effects of Parents for RYMV Resistance and Agronomic Traits

The selection of parents based on per se performance does not always result in producing superior crosses [44]. The combining ability effects of parents are useful in selecting parents that can potentially improve target traits in the offspring. Selection is often based on mean performance in one or several environments but per se performance may not always result in the generation of superior crosses. Genotypes such as Mwangaza, IRAT 256 and Lunyuki exhibited negative GCA effects for DFL, indicating that they had the genetic potential to reduce the average number of days to flowering. Early flowering has significant benefits by escaping terminal drought stress if seasonal rains end early. Similarly, Ref. [45] who found negative GCAs for DFL and PH. Gigante, SARO 5 and Mwangaza were selected as good combiners for PH displaying negative GCA effects for shortness. Therefore, significant negative GCA effects for DFL and PH are useful for the development of early dwarf varieties that are preferred in rainfall-constrained environments to escape potential drought stress. Parents SARO 5 and IRAT 256 were identified as good combiners for NT and NPP, expressing higher and positive GCA effects. Also, Ref. [45] who reported significant positive GCA effects for NT and NPP. The parental lines exhibited high and positive GCA effects for PL, NGP. PFG and TGW, suggesting their desirability for improvement of yield-related components because of their greater contribution of these traits to high grain yield. Previous studies reported the significance of using parents with high and positive GCA effects for the improvement of agronomic traits [40,46]. Parental lines with negative scores for RYMVD were considered the best combiners for increasing RYMV resistance. Ref. [47] who reported that negative GCA and SCA effects are desirable for disease resistance. The parents Mwangaza, Lunyuki, Salama M-57, Salama M-19, IRAT 256 and Salama M-55 were selected as good combiners for RYMVD resistance due to their negative GCA effects. These genotypes may possess the RYMV1 and RYMV2 genes or novel gene(s) responsible for RYMV resistance. These could be useful as sources of RYMV resistance in developing new cultivars suitable under Tanzanian growing conditions. Ref. [26] who reported significant GCA effects for resistance to RYMV. Salama M-57, IRAT 256 and Salama M-19 had high and positive GCA effects for grain yield, suggesting that the selected parental genotypes were good general combiners for grain yield by contributing favorable alleles. Previous studies also reported good general combiners for yield and yield traits in rice genotypes [41]. These genotypes could be regarded as good sources of additive genes for grain yield improvement [43].

4.4. Specific Combining Ability Effects

A high value of the SCA effect of a cross for a particular trait reflects the contribution of non-additive gene action. This genetic parameter is particularly important for hybrid breeding [22]. Crosses with significant SCA effects in the desired direction would warrant further field evaluation to identify the best segregants. Crosses with high SCA effects are important targets for selection of transgressive segregants [48]. The crosses Zambia × Salama M-19, SARO 5 × Salama M-55, Salama M-55 × Salama M-19 and Rangimbili × SARO 5 were selected for their negative SCA effect for DFL. These are early flowering genotypes that reduce exposure to terminal drought. Salama M-57 × SARO 5, IRAT256 × Zambia, IRAT 256 × Lunyuki and Zambia × Salama M-19 were selected with better NT. Negative SCA effects are required for PH to develop short stature cultivars. Thus, the crosses SARO 5 × Salama M-55, Rangimbili × Mwangaza, IRAT 256 × Rangimbili and SARO 5 × Gigante were selected to develop ideotypes with medium height plants. Crosses IRAT 256 × Zambia, IRAT 256 × Lunyuki and Salama M-57 × SARO 5 were selected for their desirable SCA effects for NPP. Further, crosses Zambia × SARO 5, Mwangaza × Gigante and Salama M-57 × Rangimbili were best specific combiners for PL. Salama M-57 × IRAT 256, Gigante × Salama M-19, Rangimbili × Gigante and IRAT 256 × Rangimbili had superior NGP values, supported by their high and positive SCA effects. Rangimbili × Gigante, Gigante × Salama M-19, SARO 5 × Salama M-55 and IRAT 256 × Rangimbili were selected with better PFG scores. Crosses Rangimbili × Mwangaza, Lunyuki × SARO 5, and IRAT 256 × Rangimbili were the best specific combiners for TGW. The best crosses expression of RYMV resistance were SARO 5 × Salama M-55, IRAT 245 × Rangimbili, Rangimbili × Gigante, Rangimbili × Mwangaza and Salama M-57 × IRAT 256. These crosses had significantly lower and negative SCA effect for RYMVD possessing RYMV resistance genes (Table 7). The hybrids Rangimbili × Gigante, Gigante × Salama M-19, Rangimbili × Salama M-55 and Salama M-57 × IRAT 256 were good specific combiners for grain yield because they expressed high SCA effects for grain yield. In a previous study [40] superior SCA effects were reported for grain yield in rice varieties. Crosses selected with desirable SCA effects for RYMVD, GY, PFG and NGP can be used to generate new rice varieties. The families Rangimbili × Gigante and Salama M-57 × IRAT 256 are recommended for further breeding or production in RYMV endemic agro-ecologies in Tanzania or similar agro-ecologies.

5. Conclusions

The present study found marked differences in the performance of the test parents and their families. Significant GCA and SCA effects were detected for the assessed traits among tested crosses and parents, which implies that both additive and non-additive effects influence these traits in the selected parents and crosses, in that order. The predominance of additive gene effects for RYMVD resistance and agronomic traits in the studies breeding populations suggested that rice improvement could best be achieved through gene introgression via the recurrent selection method. Parents Mwangaza, Lunyuki, Salama M-57, Salama M-19, IRAT 256 and Salama M-55 had negative GCA effects are good general combiners for RYMVD resistance and are recommended for future breeding programs and ago-ecologies of Tanzania infested with RYMV disease. Parental lines Salama M-57, IRAT 256, and Salama M-19 are suggested for future breeding program for GY. Based on the SCA effects, among the families, good specific combiners included SARO 5 × Salama M-55, IRAT 245 × Rangimbili, Rangimbili × Gigante and Rangimbili × Mwangaza had negative SCA effects for RYMVD, which could be useful for selection of RYMVD resistant progenies. The crosses Rangimbili × Gigante, Gigante × Salama M-19 and Rangimbili × Salama M-55 are good specific combiners for GY. Overall, the selected promising rice parents and families with significant GCA and SCA effects in the desired direction will be useful genetic resources of RYMV resistance for further breeding or production in RYMV endemic agro-ecologies. Further stability tests and farmers participatory evaluation of the selected genotypes across representative growing environments are required in developing lines with farmer-preferred traits, resistance to RYMV and high yields. This will allow recommendation of new lines adapted to specific or broad rice environments in Tanzania. Further evaluations in multiple test environments ensures selection of RYMV resistant lines with limited disease escape.

Author Contributions

Each author has participated sufficiently in the completion of this work. H.S., M.L., I.M., and A.I.T.S. contributed to the data analysis, and review of this manuscript. W.T.S. implemented the experiments and wrote up the original draft of the manuscript. All authors have read and agreed to the published version of the manuscript.

Funding

This research was supported by the Alliance for Green Revolution in Africa (AGRA) through the African Centre for Crop Improvement (PASS030), University of KwaZulu-Natal.

Data Availability Statement

Please refer to suggested Data Availability Statements in section “MDPI Research Data Policies” at https://www.mdpi.com/ethics.

Acknowledgments

The Alliance for a Green Revolution in Africa (AGRA) is gratefully acknowledged for financial support of the study through the African Centre for Crop Improvement (ACCI) at University of KwaZulu-Natal (UKZN); Tanzania Agricultural Research Institute thanked for providing the screen house for population development and transport from one site to another. Thanks are due to the Permanent Secretary, Ministry of Agriculture and the Government of Tanzania, for giving study leave to the first author.

Conflicts of Interest

The authors declare no conflict of interest.

References

  1. Food and Agriculture Organization of the United Nations (FAO). Crop Prospects and Food Situation. Quarterly Global Report. Available online: http://www.fao.org/policy-support/tools-and-publications/resources-details/en/c/1039827/ (accessed on 10 October 2020).
  2. Food and Agriculture Organization of the United Nations (FAO). Rice Market Monitor. Available online: http://faostat.fao.org/default.aspx (accessed on 22 August 2020).
  3. IRRI. Standard Evaluation System for Rice, 4th ed.; International Rice Research Institute: Manila, Philippines, 2013. [Google Scholar]
  4. Akanksha, B.; Jaiswal, H.K. Combining ability studies for yield and quality parameters in basmati rice (Oryza sativa L.) genotypes using diallel approach. Electron. J. Plant Breed. 2019, 10, 9–17. [Google Scholar] [CrossRef]
  5. Food and Agriculture Organization of the United Nations (FAOSTAT). 2015. Available online: http://faostat.fao.org/default.aspx (accessed on 27 September 2020).
  6. Hubert, J.; Lyimo, J.F.H.; Luzi-Kihupi, A. Pathogenic variation and occurrence of multiple resistance-breaking rice yellow mottle virus strains in Tanzania. Am. J. Plant Sci. 2017, 8, 1820–1841. [Google Scholar] [CrossRef] [Green Version]
  7. Suvi, W.T.; Shimelis, H.; Laing, M. Breeding rice for rice yellow mottle virus resistance in Sub-Saharan Africa: A review. Acta Agric. Scand. B Soil Plant Sci. 2018, 69, 1–8. [Google Scholar] [CrossRef]
  8. Atera, E.A.; Onyancha, F.N.; Majiwa, E.B.O. Production and marketing of rice in Kenya: Challenges and opportunities. J. Dev. Agric. Econ. 2018, 10, 64–70. [Google Scholar]
  9. Hubert, J.; Luzi-Kihupi, A.; Hébrard, E.; Lyimo, H.J.F. Farmers’ knowledge and perceptions of rice yellow mottle virus in selected rice growing areas in Tanzania. Int. J. Sci. Res. 2016, 5, 549–559. [Google Scholar]
  10. Kanyeka, Z.L.; Kibanda, N.J.M.; Mbapila, J. Rice yellow mottle virus in Tanzania. In Proceedings of the Potential and Constraints for Improvement of Rice Cultivation Seminar, Kilimanjaro Agricultural Training Centre (KATC), Moshi, Tanzania, 11–15 March 1996; pp. 17–22. [Google Scholar]
  11. Kouassi, N.K.; N’Guessan, P.; Albar, L.; Fauquet, C.M.; Brugidou, C. Distribution and characterization of rice yellow mottle virus: A threat to African farmers. J. Plant Dis. 2005, 89, 124–133. [Google Scholar] [CrossRef] [Green Version]
  12. Luzi-Kihupi, A.; Zakayo, J.A.; Tusekelege, H.; Mkuya, M.; Kibanda, N.J.M.; Khatib, K.J.; Maerere, A. Mutation Breeding for Rice Improvement in Tanzania in: Induced Plant Mutations in the Genomics Era; Food and Agriculture Organization of the United Nations: Rome, Italy, 2009; pp. 385–387. [Google Scholar]
  13. Ochola, D.; Tusiime, G. Pathogenicity of rice yellow mottle virus and the potential sources of resistance against the disease in Eastern Uganda. Asian J. Plant Pathol. 2011, 5, 1–15. [Google Scholar] [CrossRef]
  14. Zouzou, M.; Kouakou, T.H.; Koné, M.; Souley, I. Screening rice (Oryza sativa L.) varieties for resistance to rice yellow mottle virus. Scient. Res. Essay 2008, 3, 416–424. [Google Scholar]
  15. Ndjiondjop, M.N.; Albar, L.; Fargette, D.; Fauquet, C.; Ghesquière, A. The genetic basis of high resistance to rice yellow mottle virus (RYMV) in cultivars of two cultivated rice species. J. Plant Dis. 1999, 83, 931–935. [Google Scholar] [CrossRef]
  16. Traore, V.S.E.; Asante, M.D.; Gracen, V.E.; Offei, S.K.; Traore, O. Screening of rice accessions for resistance to rice yellow mottle virus. Amer. J. Exp. Agric. 2015, 9, 1–12. [Google Scholar] [CrossRef]
  17. Sereme, D.; Ouedraogo, I.; Neya, B.J.; Zida, P.E.; Yao, N.; Sie, M. Screening improved rice varieties (Oryza spp.) for their resistance /tolerance to rice yellow mottle virus in West Africa. Int. J. Agric. Inn. Res. 2016, 5, 481–486. [Google Scholar]
  18. Thiemele, D.; Boisnard, A.; Ndjiondjop, M.N.; Cheron, S.; Sere, Y.; Ake, S.; Ghesquiere, A.; Albar, L. Identification of a second major resistance gene to rice yellow mottle virus, RYMV2, in the African cultivated rice species, O. glaberrima. Theoret. Appl. Genet. 2010, 121, 169–179. [Google Scholar] [CrossRef] [PubMed]
  19. Pinel-Galzi, A.; Dubreuil-Tranchant, C.; Hébrard, E.; Mariac, C.; Ghesquière, A.; Albar, L. Mutations in rice yellow mottle virus polyprotein P2a involved in RYMV2 gene resistance breakdown. Front. Plant Sci. 2016, 7, 1–11. [Google Scholar] [CrossRef] [PubMed] [Green Version]
  20. Sprague, G.F.; Tatum, L.A. General vs. specific combining ability in single crosses of corn. Agron. J. 1942, 34, 923–932. [Google Scholar] [CrossRef]
  21. Falconer, D.S.; Mackay, T.F.C.; Frankham, R. Introduction to Quantitative Genetics, 4th ed.; Prentice Hall: Harlow, UK, 1996; Volume 7. [Google Scholar]
  22. Acquaah, G. Principles of Plant Genetics and Breeding, 2nd ed.; Wiley-Blackwell: Oxford, UK, 2012. [Google Scholar]
  23. Schlegel, R.H.J. Dictionary of Plant Breeding; CRC Press: Boca Raton, FL, USA, 2010. [Google Scholar]
  24. Griffing, B. Concept of general and specific combining ability in relation to diallel crossing systems. Aust. J. Biol. Sci. 1956, 9, 463–493. [Google Scholar] [CrossRef]
  25. Mogga, M.L.; Lamo, J.; Asea, G.; Edema, R. Inheritance of resistance to rice yellow mottle virus disease in selected rice cultivars in Uganda. In Proceedings of the Second RUFORUM biennial meeting, Entebbe, Uganda, 23 September 2020. [Google Scholar]
  26. Munganyinka, E.; Edema, R.; Lamo, J.; Gibson, P.; Rukundo, P. Combining ability for resistance to rice yellow mottle virus disease in interspecific and intraspecific rice genotypes. Afr. J. Crop Sci. 2015, 3, 102–107. [Google Scholar]
  27. Paul, C.P.; Ng, N.Q.; Ladeinde, T.A.O. Mode of gene action of inheritance for resistance to rice yellow mottle virus. Afr. Crop Sci. J. 2003, 11, 143–150. [Google Scholar] [CrossRef] [Green Version]
  28. Suvi, W.T.; Shimelis, H.; Laing, M.; Mathew, I.; AShayanowako, I.T. Assessment of the genetic diversity and population structure of rice genotypes using SSR markers. Acta Agric. Scand. B Soil Plant Sci. 2019, 70, 76–86. [Google Scholar] [CrossRef]
  29. Lamo, J. Genetic Studies on Drought Tolerance and Grain Shattering in Rice. Ph.D. Thesis, University of KwaZulu-Natal, Pietermaritzburg, South Africa, 2010; p. 205. [Google Scholar]
  30. International Rice Research Institute. Standard Evaluation System for Rice, 5th ed.; Genetic Resources Center, IRRI: Manila, Philippines, 2002; p. 27. [Google Scholar]
  31. Payne, R.W.; Murray, D.A.; Harding, S.A. An Introduction to the GenStat Command Language, 18th ed.; VSN International: Hemel Hempstead, UK, 2017. [Google Scholar]
  32. Baker, R.J. Issues in diallel analysis. Crop Sci. 1978, 18, 533–536. [Google Scholar] [CrossRef]
  33. Kumbhar, S.D.; Kulwal, P.L.; Patil, J.V.; Sarawate, C.D.; Gaikwad, A.P.; Jadhav, A.S. Genetic diversity and population structure in landraces and improved rice varieties from India. Rice Sci. 2015, 22, 99–107. [Google Scholar] [CrossRef] [Green Version]
  34. Zhang, S.L.; Hu, J.A.; Yang, C.D.; Haitao, L.; Yang, F.; Zhou, J.H.; Samson, B.K.; Boualaphanh, C.; Huang, L.Y.; Huang, G.F.; et al. Genotype by environment interactions for grain yield of perennial rice derivatives (Oryza sativa L./Oryza longistaminata) in southern China and Laos. Field Crops Res. 2019, 207, 62–70. [Google Scholar] [CrossRef]
  35. Joseph, A.; Olufolaji, D.B.; Mwilene, F.E.; Onasanya, A.; Omale, M.M.; Onasanya, R.O.; Sere, Y. Effect of leaf age on rice yellow mottle virus severity chlorophyll content with mechanical inoculation and vector transmission method. Trends Appl. Sci. Res. 2011, 6, 1345–1351. [Google Scholar] [CrossRef] [Green Version]
  36. René, N.K.; Koné, B.; Firmin, K.K.; Florant, Z.; Joachim, T.M.; Albert, Y.K.; Emanuel, D.A.; Daouda, K. Variations of rainfall and air temperature affecting rain-fed rice growth and yield in a Guinea savanna zone. J. Agric. Environ. Sci. 2016, 5, 65–77. [Google Scholar]
  37. Bashir, M.; Ehirim, B.O.; Maji, A.T.; Bakare, S.O.; Isong, A.; Odoba, A. Evaluation of yield components and genotype x environment interaction on grain yield of submergence lowland rice genotypes. Int. J. Pure Appl. Biosci. 2018, 6, 623–630. [Google Scholar]
  38. Dar, S.; Rather, A.G.; Ahanger, M.A.; Sofi, N.R.; Talib, S. Gene action and combining ability studies for yield and component traits in rice (Oryza sativa L.): A review. J. Plant. Pest Sci. 2014, 3, 110–127. [Google Scholar]
  39. Mulbah, Q.S.; Shimelis, H.A.; Laing, M.D. Combining ability and gene action of three components of horizontal resistance against rice blast. Euphytica 2015, 206, 805–814. [Google Scholar] [CrossRef]
  40. Malemba, G.M.; Nzuve, F.M.; Kimani, J.M.; Olubayo, M.F.; Muthomi, J.W. Combining ability for drought tolerance in upland rice varieties at reproductive stage. J. Agric. Sci. 2017, 9, 138–150. [Google Scholar] [CrossRef] [Green Version]
  41. Yuga, M.E.; Kimani, J.M.; Kimani, P.M.; Olubayo, M.F.; Muthomi, J.W.; Nzuve, F.M. Combining ability and heterosis for agronomic and yield traits in indica and japonica rice crosses. J. Agric. Sci. 2018, 10, 92. [Google Scholar] [CrossRef]
  42. Hasan, M.J.; Kulsum, U.K.; Lipi, L.F.; Shamsuddin, A.K.M. Combining ability studies for developing new rice hybrids in Bangladesh. Bangladesh J. Bot. 2013, 42, 215–222. [Google Scholar] [CrossRef] [Green Version]
  43. Zewdu, Z. Combining ability analysis of yield and yield components in selected rice (Oryza sativa L.) genotypes. Cogent Food. Agric. 2020, 6, 1811594. [Google Scholar] [CrossRef]
  44. Simmonds, N.W.; Smartt, J. Principles of Crop Improvement, 2nd ed.; Blackwell Science Ltd.: Oxford, UK, 1999. [Google Scholar]
  45. Akter, A.; Hasan, M.J.; Begum, H.; Kulsum, M.U.; Hossain, M.K. Combining ability analysis in rice (Oryza sativa L.). Bangladesh J. Plant Breed. Genet. 2010, 23, 7–13. [Google Scholar] [CrossRef]
  46. Raju, C.D.; Kumar, S.S.; Raju, C.S.; Srijan, A. Combining ability studies in the selected parents and hybrids in rice. Int. J. Pure. Appl. Biosci. 2014, 2, 271–279. [Google Scholar]
  47. Bokmeyer, J.M.; Bonos, S.A.; Meyer, W.A. Inheritance characteristics of brown patch resistance in tall fescue. Crop Sci. 2009, 49, 2302–2308. [Google Scholar] [CrossRef] [Green Version]
  48. Rajput, S.S.; Kandalkar, V.S. Combining ability and heterosis for grain yield and its attributing traits in bread wheat (Triticum aestivum L.). J. Pharmacogn. Phytochem. 2018, 7, 113–119. [Google Scholar]
Figure 1. Emasculated and pollinated rice genotypes covered with pollination bags.
Agronomy 11 00012 g001
Figure 2. Germinating F1 seed in a Petri-dish being advanced to F2.
Agronomy 11 00012 g002
Figure 3. F1 plants established in plastic pots to produce F2 seeds.
Agronomy 11 00012 g003
Table 1. Description of rice parental genotypes used for population development.
NoGenotypeStatusOriginRYMV ResistanceAgronomic and Grain Quality Traits
1Salama M-57AccessionTanzaniaResistanceUnscented; long grain
2IRAT 256AccessionTanzaniaResistanceUnscented
3RangimbiliLandraceTanzaniaSusceptibleScented; high grain quality
4ZambiaLandraceTanzaniaSusceptibleScented; high grain quality,
5LunyukiAccessionTanzaniaResistanceUnscented, long grain
6SARO 5VarietyTanzaniaSusceptibleScented, high yielding
7MwangazaVarietyTanzaniaResistanceUnscented; long grain
8Salama M-55AccessionTanzaniaResistanceUnscented
9GiganteAccessionAfricaRiceSusceptibleLarge panicle
10Salama M-19AccessionTanzaniaResistanceUnscented; long grain
Table 2. Descriptions of the three sites used for evaluation of 45 crosses and 10 parents.
SiteDistrictTest
Condition
Latitude
(S)
Longitude
(E)
Altitude
(masl)
Total Annual
Rainfall (mm)
TMax
(°C)
TMin
(°C)
IfakaraKilomberoRain-fed08°03′36°40′27198027.3417.71
IlongaKilosaIrrigated6°74′37°05′607119428.4319. 24
MkindoMvomeroIrrigated6°14′38°41′43097525.6716.94
Table 3. RYMV disease severity rating scale and description [29].
Rating ScaleDescription
1Highly resistant (no symptoms observed)
3Resistant (leaves green, but with sparse dots or streaks, less than 5% reduction of height)
5Moderate resistant (Leaves green or pale green with mottling, 6–25% height reduction)
7Susceptible (Leaves pale yellow or yellow, 26–75% height reduction, flowering slightly delayed)
9Highly susceptible (Leaves yellow or orange, more than 75% height reduction, no flowering)
Table 4. Mean squares and significant tests for 10 traits among 10 parents and 45 F2 crosses of rice evaluated in three locations in Tanzania.
Sources of VariationdfDFLNTPHNPPPLNGPPFGTGWRYMVDGY
Site21694.03 ***208.37 ***863.30 ***90.87 ***64.95 ***3493.17 ***416.9 ***3.65 *0.18 ns6.61 ***
Rep (Site)285.92 ***33.27 ***1760.60 ***3.68 ns7.71 *17.55 ns19.82 ns2.37 *0.1 ns0.1 ns
Block (Rep)208.00 ns4.81 **129.9 ns4.23 **4.14 ***257.45 ***25.91 ns1.99 ***0.24 ns0.2 *
Genotype54441.33 ***6.43 ***342.2 ***4.99 ***5.98 ***1649.19 ***477.17 ***6.87 ***26.81 ***0.97 ***
Genotype × Site1086.949 ns3.29 *76.9 ns3.47 **2.19 ns236.45 ***45.23 ***1.47 ***0.45 ns0.32 ***
Error1029.331.981041.951.6781.425.930.820.830.11
Note: df = degree of freedom; DFL = Days to 50% flowering; NT = number of tillers/plant; NPP = number of panicle/panicle; PH= plant height; PL = panicle length; NGP = number of grains/panicle; PFG = percentage filled grains/panicle; TGW= thousand grain weight; RYMVD = rice yellow mottle virus disease reaction; GY = grain yield; * = p < 0.05; ** = p < 0.01; *** = p < 0.001; ns, non-significant.
Table 5. Means for agronomic traits and RYMVD reaction of 10 parental genotypes and 45 F2 crosses of rice evaluated across locations in Tanzania.
GenotypesDFLNTPHNPPPLNGPPFGTGWRYMVDGY
Crosses
Salama M-57 × IRAT 2567711113.9922.914793.731.814.7
Salama M-57 × Rangimbili7611121.7924.813193.430.533.8
Salama M-57 × Zambia7611117.7924.612170.931.852.9
Salama M-57 × Lunyuki769113.8922.48795.332.014.0
Salama M-57 × SARO7412117.21123.210891.731.734.1
Salama M-57 × Mwangaza6910119.11024.212091.432.813.9
Salama M-57 × Salama M-557511119.21023.89876.932.353.4
Salama M-57 × Gigante7912114.31023.711478.531.853.8
Salama M-57 × Salama M-197810118.8922.89489.732.513.8
IRAT 256 × Rangimbili6711108.11021.314294.932.314.2
IRAT 256 × Zambia7514128.51223.712281.131.853.0
IRAT 256 × Lunyuki7713112.71322.011678.831.353.6
IRAT 256 × SARO7812132.01022.610879.430.753.5
IRAT 256 × Mwangaza6810109.2921.812195.133.814.0
IRAT 256 × Salama M-556911118.41023.38967.632.053.0
IRAT 256 × Gigante6912111.31122.412778.832.353.8
IRAT 256 × Salama M-197811116.81121.39971.231.572.8
Rangimbili × Zambia8611124.91124.712669.530.853.5
Rangimbili × Lunyuki7610117.6923.812986.630.733.1
Rangimbili × SARO7112107.41122.210179.730.853.7
Rangimbili × Mwangaza689101.6821.311395.434.313.5
Rangimbili × Salama M-558710123.4925.214884.631.334.6
Rangimbili × Gigante8511110.91023.614693.432.734.6
Rangimbili × Salama M-198210120.5923.78572.231.753.1
Zambia × Lunyuki7511126.41024.09270.130.053.1
Zambia × SARO8211128.31025.310571.931.373.2
Zambia × Mwangaza6910118.2923.79787.732.733.5
Zambia × Salama M-551169115.4824.813678.532.353.9
Zambia × Gigante8012118.41024.610970.233.053.3
Zambia × Salama M-197012120.5923.69073.331.052.7
Lunyuki × SARO8212115.41123.312477.031.853.6
Lunyuki × Mwangaza6610111.6922.812493.134.013.9
Lunyuki × Salama M-557711123.31023.112187.732.233.7
Lunyuki × Gigante7710117.21023.512392.432.533.8
Lunyuki × Salama M-197711112.6921.810791.831.813.9
SARO × Mwangaza7912112.91023.59385.030.833.6
SARO × Salama M-556811101.41023.313391.630.514.0
SARO × Gigante891297.41122.513081.531.553.7
SARO × Salama M-197911111.31023.310584.330.233.4
Mwangaza × Salama M-557110119.3923.710067.833.253.0
Mwangaza × Gigante7211115.61024.510369.533.753.0
Mwangaza × Salama M-19679113.7823.711090.633.813.3
Salama M-55 × Gigante8311117.9923.914487.133.514.3
Salama M-55 × Salama M-197211120.81024.113384.532.213.1
Gigante × Salama M-198510109.1923.714596.633.034.5
Parents
Salama M-57809120.4922.911196.131.714.5
IRAT 2567511108.61022.111595.031.314.2
Rangimbili9510132.7925.212468.529.773.2
Zambia969122.7825.413675.233.373.5
Lunyuki7411129.21123.612294.129.513.6
SARO9311100.21021.511566.830.773.3
Mwangaza6612102.3922.713497.134.813.6
Salama M-558711126.3925.317196.933.214.6
Gigante891297.11123.39464.234.572.9
Salama M-1910511111.61023.215796.131.614.6
Mean81.510.6115.29.523.7124.584.132.33.53.7
LSD5.532.8119.852.772.5818.3010.331.831.380.68
CV (%)3.4113.138.4114.305.437.636.082.8119.349.24
Note: DFL = days to 50% flowering; NT= number of tillers/plant; PH = plant height; NPP = number of panicle/panicle; PL = panicle length; NGP = number of grains/panicle; PFG = percentage filled grains/panicle; TGW = thousand grain weight; RYMVD = rice yellow mottle virus disease reaction; GY = grain yield; LSD = least significance difference; CV = coefficient of variation.3.2. Combining Ability Effects of Parents and Their Crosses.
Table 6. Mean squares and significant tests of general and specific combining ability effects for agronomic traits and RYMVD reaction across three sites in Tanzania.
Sources of VariationdfDFLNTPHNPPPLNGPPFGTGWRYMVDGY
Site21694.03 ***208.37 ***863.32 ***90.87 ***64.95 ***3493.17 ***416.90 ***3.65 **0.05 ns6.61 ***
Rep(site)3192.59 ***66.94 ***1180.31 ***29.39 ***6.25 ***14.13 ***13.38 ***1.99 ns0.10 ns0.15ns
GCA91258.56 ***17.28 ***1013.74 ***14.79 ***24.49 ***2072.20 ***1172.52 ***36.37 ***57.31 ***1.80 ***
SCA45438.71 ***4.77 ***283.51 ***4.14 **3.47 **2253.02 ***514.30 ***3.60 ***14.19 ***1.62 ***
GCA × site1811.24 ns6.22 ***65.34 ns7.14 ***5.19 ***399.08 ***61.65 ***3.54 ***0.50 ns0.54 ***
SCA × site907.37 ns3.7 *92.76 ns3.55 **2.12 ns260.04 ***46.48 ***1.52 ***0.30 ns0.32 ***
Error1629.432.63103.572.311.9675.225.050.900.440.11
Baker’s Ratio0.70.80.80.80.90.50.70.90.80.5
Note: DF = degree of freedom; DFL = Days to 50% flowering; NT = number of tillers/plant; PH = plant height; NPP = number of panicle/panicle; PL = panicle length; NGP = number of grains/panicle; PFG = percentage filled grains/panicle; TGW = thousand grain weight; RYMVD = rice yellow mottle virus disease; GY = grain yield; * = p < 0.05; ** = p < 0.01; *** = p < 0.001; ns, non-significant.
Table 7. General combining ability effects for yield and yield components and RYMVD reaction of 10 parental genotypes across three sites.
GenotypeDFLNTPHNPPPLNGPPFGTGWRYMVDGY
Salama M-57−1.92 ***0.34 **1.76 *0.26 *0.08 ns4.88 ***4.60 ***−0.12 ns−0.73 ***0.33 ***
IRAT 256−4.46 ***0.60 ***−0.61 ns0.74 ***−1.00 ***0.14 ns1.01 **2.15 **−0.34 ***0.25 ***
Rangimbili2.21 ***−0.42 ***2.18 **−0.39 ***0.30 ns5.74 ***−1.01 **−0.64 ***0.27 ***0.01 ns
Zambia4.93 ***−0.12 ns5.69 ***−0.24 *1.03 ***−2.63 ***−7.88 ***−0.05 ***1.66 ***−0.34 ***
Lunyuki−2.71 ***0.16 ns2.80 ***0.26 *0.29 **2.17 ***3.55 ***−0.57 ***−0.76 ***−0.01 ns
SARO 52.00 ***0.81 ***−4.31 ***0.60 ***−0.43 ***−5.38 ***−3.56 ***−0.96 ***0.86 ***−0.06 *
Mwangaza−8.37 ***−0.75 ***4.13 ***−0.58 ***−0.23 ***−3.70 ***4.29 ***1.39 ***−1.09 ***−0.10 ***
Salama M-552.55 ***−0.27 *3.03 ***−0.35 **0.70 ***11.82 ***0.16 ns0.31 ***−0.23 ***0.17 ns
Gigante2.88 ***0.42 ***−5.75 ***0.36 **0.12 ns2.49 ***−3.49 ***0.91 ***0.91 ***0.04 ns
Salama M-192.89 ***−0.10 ns−0.67 ns−0.15 ***−0.26 **−1.43 ***2.33 ***−0.12 ns−0.56 ***0.22 **
Note: DF = degree of freedom; DFL = Days to 50% flowering; NT = number of tillers/plant; PH = plant height; NPP = number of panicle/panicle; PL= panicle length; NGP = number of grains/panicle; PFG = percentage filled grains/panicle; TGW = thousand grain weight; RYMVD = rice yellow mottle virus disease; GY = grain yield; * = p < 0.05; ** = p < 0.01; *** = p < 0.001; ns, non-significant.
Table 8. Specific combining ability effects for agronomic traits and RYMVD reaction among 45 crosses assesed in three sites in Tanzania.
CrossesDFLNTPHNPPPLNGPPFGTGWRYMVDGY
Salama M-57 × IRAT 2565.17 ***−0.57 ns−3.19 ns−1.04 *0.39 ns33.23 ***4.56 **0.09 ns−1.45 ***0.56 ***
Salama M-57 × Rangimbili−2.85 **0.56 ns1.80 ns0.35 ns1.04 *11.79 ***6.31 ***−0.75 *−0.07 ns−0.15 ns
Salama M-57 × Zambia−5.89 ***0.36 ns−5.68 ns0.25 ns0.11 ns10.17 **−9.24 ***−0.00 ns0.55 ns−0.60 ***
Salama M-57 × Lunyuki2.58 *−1.38 *−6.69 ns−1.08 *−0.77 ns−24.08 ***3.65 *0.68 ns−1.04 ***0.12 ns
Salama M-57 × SARO 5−4.80 ***1.94 ***3.78 ns1.45 **0.15 ns0.08 ns7.16 ***0.73 *−0.65 ***0.21 ns
Salama M-57 × Mwangaza1.07 ns0.38 ns5.52 ns0.67 ns1.00 ns10.35 **−1,00 ns−0.45 ns0.30 ns0.07 ns
Salama M-57 × Salama M-55−3.68 ***0.91 ns−1.50 ns0.83 ns−0.40 ns−27.40 ***−11.37 ***0.14 ns2.43 ***−0.70 ***
Salama M-57 × Gigante−1.01 ns−0.14 ns2.36 ns−0.10 ns0.07 ns−1.95 ns−6.09 ***−0.96 **0.63 *−0.17 ***
Salama M-57 × Salama M-19−1.51 ns−0.75 ns1.75 ns−0.21 ns−0.39 ns−18.02 ***−0.74 **0.73 *−0.57 *−0.36 ***
IRAT 256 × Rangimbili−8.97 ***−0.27 ns−9.43 **0.23 ns−1.40 **18.11 ***11.35 ***1.11 ***−2.45 ***0.47 ***
IRAT 256 × Zambia−4.01 ***1.93 ***7.48 *1.75 ***0.24 ns6.32 *4.50 **0.02 ns−0.84 ***−0.33 ***
IRAT 256 × Lunyuki5.96 ***1.72 **−5.42 ns1.56 **−0.11 ns−0.32 ns−9.19 ***0.03 ns2.57 ***−0.12 ns
IRAT 256 × SARO 52.40 *−0.15 ns20.97 ***−0.43 ns0.68 ns−4.94 ns−1.58 ns−0.23 ns0.96 ***−0.16 ns
IRAT 256 × Mwangaza2.28 *−0.94 ns−2.04 ns−0.78 ns−0.34 ns7.02 *6.32 ***0.58 ns−1.09 ***0.42 ***
IRAT 256 × Salama M-55−7.30 ***−0.47 ns0.02 ns−0.39 ns0.16 ns−41.50 ***−17.04 ***−0.17 ns2.05 ***−0.82 ***
IRAT 256 × Gigante−7.97 ***0.42 ns1.73 ns0.40 ns−0.10 ns6.53 *−2.21 ns−0.43 ns0.24 ns0.06 ns
IRAT 256 × Salama M-191.36 ns0.08 ns2.12 ns0.53 ns−0.82 ns−17.54 ***−15.62 ***−0.24 ns3.71 ***−0.85 ***
Rangimbili × Zambia0.81 ns0.64 ns1.05 ns1.31 *−0.03 ns4.88 ns−5.12 ***−0.49 ns−0.45 ns0.14 ns
Rangimbili × Lunyuki−2.22 *−0.47 ns−3.36 ns−0.68 ns0.35 ns7.24 *0.49 ns−0.14 ns−0.04 ns−0.55 ***
Rangimbili × SARO 5−11.44 ***0.92 ns−6.40 ns0.58 ns−1.06 *−17.38 ***0.81 ns0.41 ns0.35 ns0.05 ns
Rangimbili × Mwangaza−4.07 ***−1.23 *−12.37 ***−1.00 ns−2.13 ***−7.39 *8.59 ***1.57 ***−1.70 ***−0.06 ns
Rangimbili × Salama M-554.18 ***−0.04 ns2.24 ns0.05 ns0.84 ns12.09 ***1.94 ns−0.35 ns0.43 ns0.76 ***
Rangimbili × Gigante1.02 ns−0.14 ns−1.45 ns0.01 ns−0.22 ns19.09 ***14.45 ***0.39 ns−2.37 ***0.91 ***
Rangimbili × Salama M-19−1.48 ns−0.56 ns3.08 ns−0.66 ns0.28 ns−37.42 ***−12.69 ***0.41 ns1.77 ***−0.58 ***
Zambia × Lunyuki−6.26 ***0.06 ns1.95 ns0.31 ns−0.10 ns−21.31 ***−8.99 ***−1.39 ***0.57 *−0.19 ns
Zambia × SARO 5−3.48 ***−0.20 ns10.99 **0.41 ns1.34 **−5.65 ns−0.07 ns0.33 ns0.96 ***−0.08 ns
Zambia × Mwangaza−5.78 ***−0.21 ns0.67 ns0.01 ns−0.51 ns−15.11 ***7.88 ***−0.68 *−1.09 ***0.26 *
Zambia × Salama M-553.31 ***−1.49 **−9.25 *−1.50 **−0.34 ns8.30 **2.74 ns0.07 ns0.05 ns0.34 ***
Zambia × Gigante−6.36 ***0.65 ns2.51 ns0.49 ns0.08 ns−8.97 ***−1.90 ns0.14 ns−0.43 ns−0.00 ns
Zambia × Salama M-19−15.86 ***1.27 **−0.48 ns0.09 ns−0.60 ns−24.12 ***−4.65 **−0.84 *0.38 ns−0.56 ***
Lunyuki × SARO 54.15 ***0.32 ns1.01 ns0.37 ns0.60 ns13.53 ***−6.44 ***1.16 ***1.38 ***0.05 ns
Lunyuki × Mwangaza−0.80 ns−0.10 ns−2.97 ns−0.58 ns−0.09 ns17.69 ***1.74 ns1.34 ***−0.68 ***0.41 ***
Lunyuki × Salama M-55−1.55 ns0.58 ns1.49 ns0.61 ns−0.68 ns−6.45 *0.49 ns0.41 ns0.46 ns−0.13 ns
Lunyuki × Gigante−1.39 ns−0.79 ns4.24 ns−0.68 ns0.25 ns4.50 ns8.81 ***0.15 ns−0.68 **0.13 ns
Lunyuki × Salama M-19−2.22 *−0.35 ns−5.42 ns−0.77 ns−1.08 *−7.42 **2.42 ns0.51 ns−0.54 *0.22 **
SARO 5 × Mwangaza6.81 ***0.78 ns5.39 ns0.65 ns0.72 ns−16.27 ***0.79 ns−1.61 ***−0.29 ns0.15 ns
SARO 5 × Salama M-55−15.28 ***−0.65 ns−13.22 ***−0.38 ns−0.34 ns7.88 *11.45 ***−0.86 **−3.15 ***0.28 *
SARO 5 × Gigante6.06 ***0.36 ns−8.54 **0.01 ns−0.60 ns14.87 ***5.07 **−0.46 ns−0.29 ns0.06 ns
SARO 5 × Salama M-19−4.94 ***−0.25 ns0.33 ns0.20 ns0.59 ns−6.38 *2.03 ns−0.77 *−0.15 ns−0.14 ns
Mwangaza × Salama M-55−1.57 ns0.47 ns4.43 ns0.28 ns−0.15 ns−25.81 ***−20.16 ***−0.55 ns3.13 ***−0.69 ***
Mwangaza × Gigante−0.57 ns0.52 ns9.53 *0.08 ns1.21 *−13.47 ***−14.83 ***−0.64 ns2.32 ***−0.24 ***
Mwangaza × Salama M-19−5.73 ***−0.91 ns2.54 ns−0.66 ns0.83 ns−2.78 ns0.49 ns0.55 ns−0.200.46 ***
Salama M-55 × Gigante−0.82 ns−0.36 ns4.70 ns−0.56 ns−0.34 ns11.27 ***7.01 ***0.27 ns−0.54 *−0.69 ***
Salama M-55 × Salama M-19−11.98 ***0.81 ns2.51 ns0.55 ns0.23 ns4.26 ns−1.41 ***−0.03 ns−0.73 **−0.69 ***
Gigante × Salama M-190.35 ns−0.79 ns−0.39 ns−0.80 ns0.42 ns25.75 ***14.20 ***0.20 ns−0.87 ***0.85 ***
Note: DF = degree of freedom; DFL = Days to 50% flowering; NT = number of tillers/plant; PH = plant height; NPP=number of panicle/panicle; PL = panicle length; NGP = number of grains/panicle; PFG = percentage filled grains/panicle; TGW = 1000 grain weight; RYMVD = rice yellow mottle virus disease reaction; GY = grain yield; * = p < 0.05; ** = p < 0.01; *** = p < 0.001; ns, non-significant.
Publisher’s Note: MDPI stays neutral with regard to jurisdictional claims in published maps and institutional affiliations.

