Abstract
This paper contributes to the literature on sustainable consumption by in-depth analysis of the factors affecting the probability of 57 different practices of proenvironmental behavior (PEBs) in Russia. The set of studied PEBs includes not only popular energy-saving and waste-management practices but also more circular patterns of plastic consumption, shopping, and city mobility. To study real and potential barriers to greening consumer behavior models, we conducted a survey of 623 respondents using a questionnaire developed based on a comparative analysis of similar studies conducted in other countries. The processing of the survey results was carried out using nonparametric statistics due to the absence of a normal distribution of the sample for most of the studied characteristics. The results of the study revealed that the main barriers to sustainable consumption in Russia are the lack of appropriate infrastructure as well as a lack of knowledge. Infrastructural barriers in some situations makes sustainable consumer behavior impossible or inconvenient (in this case, preference is given to other types of consumption), or in some cases necessitates spending additional time and money (then sustainable consumer behavior is not completely denied but practiced less often).
1. Introduction
Circular Economy (CE) describes an economic system based on business models for reusing, recycling, and recovering materials in the production and consumption of goods, works, and services. The transition to the circular economy is necessary to maximize each process’s performance in the life cycle of goods or services. The concept of CE opens new radical changes in consumption patterns and lifestyles. Implementing the idea of a circular economy requires rethinking the value chain, a conscious consumer approach, and using new business models such as sharing platforms to extend the life of a product [1]. This principle of improving the economy implies that the global production system is designed to have a no waste concept. All useful elements taken from the environment can be reused and waste from one production chain is the starting material for building another one. In contrast to the economy of the linear type, this stimulates the consumer to change items of consumption always to replace them with newer ones. When the economy transitions according to the circular type, it is essential to extend the life cycle of products as long as possible by the following cycles: (1) reuse, (2) remanufacturing, (3) recycling, (4) disposal [2]. At the same time, the more a product is in the first cycles, the cheaper it is to produce in general than when the product goes for disposal immediately after use (the traditional linear model of the production system).
The European Development Plan for a Circular Economy is one of the best-developed practical guidelines for the transition in today’s economic environment to the new, more sustainable patterns of production and consumption. The European plan considers the formation of sustainable consumption as one of the priority areas of the circular economy [3].
The transition to the concept of a circular economy requires not only the restructuring of production chains but also the reformatting of many logistic, informational, and managerial links, as well as a change in consumer behavior models [4,5]. The lack of technology and infrastructure readiness to support consumer behavior patterns can inhibit the introduction of proecological consumer behavior patterns. The sustainability of the ecological infrastructure (“eco” -infrastructure) and the living environment as socioecological subsystems necessary for a person is achieved by the ability to adapt in a changing world. By “eco” -infrastructure, we mean a complex of natural, natural-anthropogenic and artificial objects and systems that provide conditions for preserving the human environment. The “eco” infrastructure includes elements of traditional infrastructure (natural resources, all mining systems, waste disposal systems, energy, transport, etc.). Many elements of traditional infrastructure must be environmentally stable in order to be included as components of the “eco” infrastructure that a person must carry out in accordance with ethics and environmental regulation. However, modern world literature in the field of sustainable development shows that it is cultural and economic barriers that have the most significant impact on which of the practices of proecological behavior are spread and which are not [6,7,8].
Consumer demand is a powerful incentive to create new and transformative industries to increase environmental and social responsibility. However, consumers’ readiness for such a radical change in traditional patterns should be formed gradually with the transition from simple resource conservation and waste management practices to more complex ones.
Information on the barriers of proenvironmental conduct in a different cultural, economic, and professional context is scattered across the body of literature [9,10,11,12]. However, as far as we know, no previous research has investigated the problem of the barriers of proenvironmental behavior in the context of circular economy development in Russia. This country is only in the beginning of its way to the circular economy but has a comparatively high level of environmental awareness in some groups of consumers and strong cultural traditions in sustainable consumption of food and clothes [13].
Most scholars recognize that environmental awareness is the first important step in the adoption of proenvironmental behavior [14,15]. At the same time, some authors argue that there is still a gap between environmental awareness and proenvironmental behavior and rely on behavioral cost concept in explaining the obstacles of sustainable consumption [14,16]. Since there are no consistent government policies in supporting sustainable consumption in Russia, it is possible to assume that behavioral cost of proenvironmental behavior is high in this country. This makes Russia an interesting case to study both from empirical and theoretical points of view.
The purpose of this paper is to assess barriers of proenvironmental behavior associated with the transition towards a more circular daily practice of energy and water consumption, waste management, city mobility, and shopping in Russia. The study contributes to the literature by bringing new empirical evidence of consumers’ attitude toward different forms of proenvironmental behavior in Russia and the cultural influences on it.
To achieve the study’s objectives, we used a face-to-face questionnaire survey. The survey group mostly included students from the Peoples’ Friendship University of Russia (Moscow) and the Kuban State University (Krasnodar), who studies in several training areas, whose educational programs include courses in environmental management, environmental engineering, etc. This choice of respondents is explained by the fact that this category of consumers is the most informed and the most flexible in forming consumer behavior patterns.
2. Literature Review
Experts realize that the circular economy is characterized by a restorative and closed nature. In the literature, there are three key features inherent in a circular economy: first, enhanced control over natural resources and maintaining a sustainable balance of renewable resources to conserve and maintain natural capital at an inexhaustible level; second, optimization of consumption processes by developing and distributing products, components, and materials that meet the highest level of reuse; third, the identification and prevention of negative externalities of current production activities in order to improve the efficiency of economic and ecological systems [17].
For the functioning of the circular economy model, the Ellen MacArthur Foundation identifies several essential components of the transition and functioning of the circular economy of groups of activities [17]: (a) Regenerate, (b) Share, (c) Optimize, (d) Loop, (e) Exchange.
Despite the relatively recent interest in circular economics, recycled materials are being returned to manufacturing processes at much lower levels. If this system could be improved, loss of value, dependence on volatile product markets, reduced resource productivity, and externalities in the form of environmental pollution could be avoided [18]. Germany’s waste management system is one of the most advanced globally; waste disposal is carried out safely for people and the environment. However, only about 14% of the raw materials used in the industry come from processing; the rest still come from raw materials. The introduction of a circular economy is primarily an information problem.
Promoting proecological behavior in people’s daily lives is critical in the circular economy’s direction and the industrial and commercial sectors’ efforts. Therefore, this issue is relatively well studied in modern scientific literature. As evidenced by the results of numerous studies, awareness of the existence of environmental problems concern about the state of the environment is characteristic of almost all social strategy of society, regardless of gender, age, education, type of activity, etc. [19,20,21]. However, people’s environmental activity—their ability to abandon their habitual consumer behavior to take the path of more responsible behavior in everyday practices—is in its infancy [6,22,23]. There are many internal and external barriers to taking real measures to prevent them or reduce the negative impact and consequences if people are well aware of environmental problems [24]. These barriers can be due to various factors such as traditional values, lifestyles, policies, infrastructure, environmental circumstances, various cultures, and countries [5,25].
A significant amount of research addresses selecting factors that determine the choice in favor of proecological behavior. In studies on the role of the individual behavioral aspect in sustainable development, several primary determinants are highlighted that can influence an individual’s choice in favor of proecological actions. Thus, the article [26] states that a combination of social and personal moral standards positively impacts the efficient use of electricity, water, other resources, ecological consumerism, and the desire to recycle materials. A person’s attitudes and beliefs, reflecting their awareness of problems and a desire to change the situation also stimulate ecofriendly behavior, although in a less significant way. In papers [27,28], it was noted that in addition to these factors, there are several more: the so-called behavioral control, which means the ease with which an individual can put his intentions into action (the presence of monetary funds, time, opportunity); the intrinsic usefulness of environmental good and the willingness to pay for its offer. First of all, the last two parameters affect the desire to purchase environmentally friendly goods instead of conventional ones. Sustainability is based on a balanced relationship of the triple bottom line—people, profit, and planet [29].
The article [30] describes a study of proecological behavior in Canada and the United States. As a result of this study, the authors found a positive relationship between life satisfaction and proecological behavior. Life satisfaction as well as proecological behavior was predicted by more social behavior.
There was high interest in the study, which was conducted by the students of Malaysian universities. The authors of the study [31] carried out a personal assessment of proecological behavior. They assessed such qualities of a student’s character as openness, benevolence, and conscientiousness. It was found that conscientiousness was the only trait that most influenced the proenvironmental behavior (PEB). The multilevel analysis [32] showed that the relationship between self-transcendence/self-development values–proecological behavior was weaker among societies with higher cultural and socioecological constraints (for example, with lower values of self-expression and economic development). These results clarify when values can promote or inhibit proecological behavior and highlight the need to consider human interaction and context in understanding how personal factors translate into proecological behavior. The article [33] examined the impact of education on proecological behavior in Thailand’s educational institutions. The authors concluded that the higher the level of education, the more often the respondents are ready to participate in environmental actions. However, education does not have any impact on willingness to pay environmental taxes. The study [34] estimated that people who received environmental training would demonstrate 4.7 times more voluntary proenvironmental behavior than those who did not receive any training. The article [35] examined personal factors in proecological tourism behavior from a gender perspective. This study is based on a sample of 347 golfers from 16 European countries. The results confirmed the relationship between ecological habits, personal ability, and attitude to the environment. It is shown that only the interaction between personal capabilities and externally-oriented habits influence environmental attitudes.
In studies [36,37], they used the European countries’ example. The authors showed that, despite evidence of a positive influence of education on individuals’ proecological behavior, clear conclusions are impossible due to an ambiguous causal relationship. Moreover, it may be overlooked factors that force individuals to get more education and care for the environment.
The article [38] examines students’ knowledge and behavior in ecological civilization. Based on 13,404 questionnaires from 152 universities and using a polynomial logit regression model, the authors investigated the relationship between Chinese university students’ cognition and behavior. This article divides students’ ecological civilization knowledge into two parts. One of which is common sense knowledge that comes from long-term public environmental and environmental education in China. The other is the knowledge of the ecological civilization’s national strategy, which comes from the recent intense and comprehensive political advertising. This article concludes that university students with the latest knowledge are more willing to implement ecological civilizational behavior. This result illustrates the role of political propaganda in China for ecological civilization to influence its citizens’ behavior and inspires other countries to promote environmental policy and promote public environmental protection through the media.
The paper [39] examines the role of stakeholder engagement in establishing and strengthening the sustainability culture in a company transitioning toward a circular economy. The authors also emphasize that the government and universities play an active role in promoting sustainability culture.
In addition to education, energy conservation, for example, is influenced by other aspects. Thus, authors from China [40] considered factors affecting consumer behavior with energy-saving. The authors concluded that urban inhabitants are more economical in terms of energy consumption than rural inhabitants. The authors confirmed a more responsible attitude towards the environment due to improved knowledge in energy conservation and more developed consumption habits. Scientists from Sweden [41] carried out a comprehensive analysis of energy conservation factors. The authors identified the three most significant factors: age of people, type of house, and income—with the decisive factor being the type of housing. People living in private houses are more likely to save than people living in apartment buildings. Socioeconomic factors influence savings on heating more than attitude to the environment.
An interesting study was conducted [42] on procrastination on household energy-saving behavior. The author concluded that environmental awareness increases energy savings but only affects actions that do not require additional costs (lowering the house’s temperature during the absence).
One of the most common methods for studying consumer proecological behavior barriers is to conduct surveys [8]. Although this method has its significant drawbacks, which are also actively discussed in the literature (see, for example, works [7,43,44], it remains a priority tool in primary research. The goal is to obtain an overall picture of the prevalence of a particular consumer behavior model and identify the reasons for the nonproliferation of other models.
3. Materials and Methods
3.1. Procedure and Participants
To study real and potential barriers to greening consumer behavior models, we conducted a survey of 623 respondents using a questionnaire developed based on a comparative analysis of similar studies conducted in other countries [6,25]. The study was launched in early 2019 on a pilot group of students (N = 100) from Kuban State University. On the stage of pilot research, a face-to-face survey method was used. A personal survey in the case of small- and medium-scale gives an opportunity to study of phenomena in a real-life context [45]. After processing the results of the pilot study and finding interesting consistent patterns, the study was extended to different age groups and regions and continued until the May of 2020.
On the second stage of survey a method of responded-driven sampling was used [46], in which one interviewer from the invited group (students) interviews several (up to 10) people at a time. It allowed us to increase the speed of the study and the size of the sample.
The procedure of responded-driven sampling led us to the following distribution of respondents by age: the majority of respondents belong to the age category from 20 to 29 years old (55%), besides 8% of respondents belongs to the category from 16 to 20 years old. This makes it possible to test the hypothesis about whether the educational process affects the respondent’s values and their attitude to the practices of proecological behavior. In addition, the sample has a reasonably well-represented age group from 30 to 39 (11%), from 40 to 49 (11%) and 50 to 59 (9%). Age categories over 60 are less represented (6%).
The distribution of respondents by involvement in the educational process is the following: 62% of respondents are high school or college students, as well as undergraduate and graduate university students. All other respondents (38%) form the category, which was called “not a student” in order to highlight that they are not involved in the education process at the time.
The distribution of respondents by economic activity is the following: 93% of respondents are economically active and only 7% are not. All working respondents are classified as economically active, regardless of whether they are employed (be it self-employed, sole proprietor, an employee at the enterprise) or students. The economically inactive group includes pensioners, housewives, persons on parental leave, or persons with disabilities. This division of respondents into groups was performed to test the hypothesis of how the availability of free time (it is believed that economically active people have less free time) affects the frequency of using various practices of proenvironmental behavior.
The distribution of respondents by region of residence is uneven. The majority live in Moscow (69%). A significant proportion of respondents live in Krasnodar (17%) and the Krasnodar region (10%). Other regions of Russia are slightly represented in the sample, which is a consequence of the research technique—the main groups were formed precisely in Moscow and Krasnodar based on two large universities. Nevertheless, 2% of respondents are representatives of other regions of the Southern Federal District (except for the Krasnodar region), 1% of respondents live in St. Petersburg, and another 1% live in other regions (Samara Oblast, Kamchatka Krai, Yuzhno-Sakhalin Oblast, etc.).
The level of education of the interviewed respondents in general can be defined as high. The majority of respondents (62%) have higher education (31%—bachelor’s level and 41%—specialist or master’s level). Another 6% of respondents have postgraduate education—postgraduate, doctoral, or residency). Sixteen percent of respondents have secondary education (6%—general and 10%—professional) and another 16% are university students.
Regarding the distribution of respondents by income level, the majority of respondents (60%) determined their income level using the following description “In general ok, but sometimes I have to save”. The share of those who defined their financial situation with the following phrase “I can satisfy all my needs and the needs of my family” is also quite large in the sample (23%). Only 1% of the respondents defined their financial situation as “I live in poverty”, 11% chose the phrase “I have to save” to describe their financial situation. Five percent of respondents found it difficult to determine their financial situation or refused to answer.
The distribution of respondents by the level of participation in environmental activities is the following: 39% of respondents participated in environmental campaigns to plant trees, clean garbage, collect wastepaper, glass containers, etc. at least once. Almost the same number of respondents did not participate in any environmental activities (38%). Six percent of respondents filed complaints about any environmental pollution, participated in collecting signatures for appeals to the authorities with demands to improve the environmental situation and another 6% made donations for environmental activities. Only 3% of respondents took part in environmental protests and only 2% participated in two or more environmental events.
3.2. Measure of Attitude to Proenvironmental Behavior
In this study, we use the concept of ecological behavior proposed by Stern [14]. He understands behavior as an interactive product of a personal value system and a set of contextual factors. Accordingly, ecological behavior is “a product of the interaction of personality characteristics (internal factors) and contextual (external) factors” [14]. Internal factors are associated with citizens’ characteristics and include environmental knowledge, environmental values, motivation, locus of control, and personal responsibility. External factors can be divided into several categories: political, economic, social, and technological. Political factors are related to the level and speed of adoption of environmental laws and standards for sustainable development. The economic factors include the state of the country’s economy as a whole, the volume and structure of environmental investments, the use of natural resources, measures to restore natural resources, and the demand for environmentally friendly products. Social factors influence environmental competence through social cultural values and traditions, the propensity to accept innovations, and change consumer behavior. External technological factors include the level of development of technologies for the treatment of discharges and emissions, disposal and recycling of waste, secondary use of raw materials, environmental research, research in the field of alternative energy, etc.
As noted above, the questionnaire consisted of three parts. The first part of the questionnaire has fixed data internal factors of the respondents.
The second part of the questionnaire aimed to determine the respondents’ attitudes on environmental responsibility issues (general environmental self-awareness). We asked the respondents to answer whether they believe that they can improve their city’s environment and indicate the types of environmental measures they took part in at least once. The third part of the questionnaire aimed to assess the frequency and reasons for applying (or not applying) practices of proenvironmental behavior in energy conservation, water conservation, waste management, and reducing the use of disposable products and mobility.
In compiling a list of proenvironmental behaviors, we used a variation of the questionnaire proposed by Lee, Kurisu and Hanaki [6]. We chose this study as a prototype for the following reasons: firstly, it contains a large list of possible practices of proenvironmental behavior (includes 58 practices); secondly, it has already been used by other scientists as a basis for international comparisons [25], which allows us to further (when conducting a more extensive study) compare the results obtained for Russia with the results of other countries. It should be noted that from the entire list of 58 practices of proenvironmental behavior, some are almost unknown in modern Russian society. Nevertheless, they were included in the study to identify possible patterns of behavior transmitted from generation to generation as a way of lean housekeeping. Several practices were excluded from the list due to Russia’s inability to use a contradiction to cultural or legal norms. Instead, several new energy-saving practices have been added. In general, our set of PEBs is 90% similar to the set of Lee, Kurisu, and Hanaki [6].
The selected 57 patterns in our study were divided into six groups: (1) patterns in the field of energy conservation; (2) patterns in the field of water conservation; (3) patterns in the field of waste management; (4) patterns that can be arbitrarily called “against plastic” (reducing the use of disposable tableware, packaging, etc.); (5) shopping patterns; (6) urban mobility patterns. This division is explained by the fact that some groups of patterns (for example, in the field of energy efficiency) have been actively promoting at the state level for more than ten years, while others (for example, deciding in favor of purchasing more environmentally friendly goods) have not yet been stimulated. The list of patterns, divided into groups, is presented in Table 1

Table 1.
Proenvironmental patterns of consumers’ behavior.
When answering the question of how often respondents practice each of the 57 models of proenvironmental behavior, one could choose the answer options “never”, “rarely”, “often”, or “always”, which, when processed, were translated into a scale from 1 to 4. Besides, respondents were asked to choose the reasons for the application or nonapplication of these practices. Among the possible reasons for applying the practice were “Habit”, “Laziness”, “Money saving”, “Sense of duty”, “Fashion” and among the reasons for nonapplication—“Laziness”, “Time consuming”, “No consideration”, “Forget”, “Nobody doing”, “Costly”, “There are no conditions for application”, “I did not know that it was so necessary.” The choice of each of the reasons was encoded as a Boolean variable (0 or 1).
Further, the investigation for answers to research questions was carried out using descriptive and nonparametric statistics. Nonparametric tests were used in case the studied variables are not distributed normally and are measured on an ordinal scale. Research questions and methods of verification are summarized in Table 2.
Table 2.
Research questions and methods.
4. Results
The survey data showed that most Russians are interested in the environment (73%). More than half (57%) have taken part in nature conservation activity at least once. Every third respondent spoke in the affirmative on personal participation to improve the city’s environmental situation. The relatively widespread opinion among respondents about the need to develop initiatives to protect the environment and the degree of responsibility for the environment indicates the lack of necessary changes. From the point of view of the locus of control the respondents’ opinions were divided in groups, which are quite close to such a factor as responsibility and determines the measure of a person’s moral attitude towards other people and the world around him. Citizens with an internal locus of control who recognize each resident’s possibility and ability to influence the current environmental situation were 54% of respondents. On the contrary, 42% of respondents believe that an individual cannot influence the situation with the environment, thereby shifting their responsibility to the relevant social institutions, namely, the federal or local authorities. Despite these differences in answers, Russians are interested in environmental consumption and behavior issues and economic and social challenges. The study’s main focus was on determining the statistical relationships between age, involvement in the educational process, economic activity, region of residence, education level, income level, and the degree of participation in environmental activities on the frequency of application of proenvironmental behavior practices.
4.1. Statistical Relationship between the Age and Gender of the Respondent and the Frequency of Application of the Practices of Proecological Behavior
Since some age categories of respondents were less represented in the sample, we used nonparametric statistical methods for processing research results that allow working with small samples [47,48]. Calculation of nonparametric correlation coefficients Spearman (R) and tau-Kendall (K) revealed the presence of some statistically significant relationships between the age of the respondent and his attitude to various practices of proecological behavior (Table 3). As shown from the nonparametric correlation results, the older generation more often practices more than 50% of the main patterns of proecological behavior. The exception is practice P5—using stairs instead of elevators, for which there is a negative correlation with the respondent’s age, which is understandable. The highest values of nonparametric correlation coefficients were obtained in practices: P56—Flame adjustment for cooking, P53—Maintaining air pressure of the tire, P43—Not buying unnecessary products, P51—Avoiding overloading the car, P52—Reducing idling of the car, P50—Doing car checks regularly, P25—Collection and delivery of glass containers to appropriate collection points.
Table 3.
Correlations (at the p = 0.05 level) between the respondent’s age and the frequency of using the practices of proecological behavior.
Statistically significant differences in the frequency PEBs between men and women were identified with Mann–Whitney test for practices P4 “Putting hot food into refrigerator after cooling”, P50 “Doing car checks regularly”, P21 “Avoiding throwing away waste cooking oil”, P22 “Following garbage rules”, P33 “Throwing away kitchen garbage after it has dried”, P35 “Using own bag when going shopping”, P37 “Not buying over-packaged products”, P47 “Using bicycle or walking” and P49 “Joining the one day without car program”. All these PEBs are practiced more often by men than by women.
4.2. Influence of Involvement in the Educational Process on the Frequency of Application of Practices of Proecological Behavior
We tested whether education can significantly impact proenvironmental behavior, involving more efficient use of natural resources, recycling materials, and green consumerism. Conducting a series of nonparametric Mann–Whitney tests made it possible to reveal statistically significant differences: in the use of specific practices of proenvironmental behavior between respondents involved in the learning process (schoolchildren, students) and those who completed their education (Table 4).
Table 4.
Statistically significant (at the p < 0.05 level) results of the Mann–Whitney test with a grouping variable—involvement in the educational process.
Concerning the revealed, statistically significant differences between the groups of respondents receiving education and have completed their education, the second group of respondents demonstrate more conscious proecological behavior in absolutely all aspects.
4.3. The Statistical Relationship between the Grouping Variable—Economic Activity and Frequency of Application Practices Proenvironmental Behavior
Conducting a series of nonparametric Mann–Whitney tests made it possible to identify statistically significant differences in the use of some proecological behavior practices between economically active and economically inactive respondents (Table 5).
Table 5.
Statistically significant (at the p < 0.05 level) results of the Mann–Whitney test with a grouping variable—economic activity.
The revealed differences in the frequency of the use of some practices by economically active and economically inactive respondents do not confirm the original author’s hypothesis that having more free time in the absence of a permanent job can contribute to the more careful handling of all resources and the use of more labor-intensive waste management practices. On the contrary, economically active respondents demonstrate greater environmental awareness. They are more likely to practice collecting and handing over recycling wastepaper, glass containers, e-waste, drying food waste, and reusable shopping bags. In addition, economically active respondents are more competent in handling household appliances to reduce their energy consumption. At the same time, nonworking respondents more often use those practices associated with saving, first of all, financial resources. Besides, they more often use traditional household practices in cooking, which are aimed not so much at saving resources but simply correspond to the usual established order of things.
4.4. The Impact of the Region of Residence on the Frequency of Use of Practices of Proenvironmental Behavior
Given the strong uneven distribution of respondents by region of residence, to process the results of statistical testing hypotheses related to regions of residence, nonparametric statistics were also used. In addition, we tried to interpret the results as carefully as possible. The influence of the respondent’s region of residence on the frequency of application of proecological behavior practices was investigated using a series of nonparametric Kruskal–Wallis tests. Statistically significant values of the χ2-statistic are given in Table 6.
Table 6.
The results of calculating the Kruskal–Wallis statistics test the hypothesis about the influence of the region of residence on the frequency of using proecological behavior practices.
Residents of two regions of Moscow and Krasnodar took part in the survey, and the range of answers was quite comprehensive.
4.5. Effect of Educational Level on the Frequency of Usage Practices Proenvironmental Behavior
To test the hypothesis about the influence of the respondent’s education level on his attitude to various proecological practices, we calculated the nonparametric Spearman (R) and tau-Kendall (K) correlation coefficients. As a result, a weak positive statistically significant result was obtained at the p = 0.05 level for some nontrivial practices. It should be noted that Practices P23 (Garbage separation), P25 (Collection and delivery of glass containers to appropriate collection points), P27 (Collection and delivery of used batteries, light bulbs to appropriate collection points), P33 (Throwing away kitchen garbage after it has dried) from the Waste Management category, Practices P28 (Using own cup), P34 (Using receptacle instead of plastic bag) from the category “Rejection of Plastic” and Practices P38 (Buying organic products), P42 (Choosing goods with their CO2 emission in mind (carbon footprint)) from the Purchase category are relatively new for the Russian consumer and/or labor-intensive. Thus, we can talk about the positive influence of the respondent’s education level on forming a proecological consumer behavior (Table 7).
Table 7.
Correlations (at the p = 0.05 level) between the respondent’s educational level and the frequency of using proenvironmental practices.
4.6. The Impact of Income on the Frequency of Use of Practices of Proenvironmental Behavior
As a result of testing the hypothesis about the influence of the respondent’s income level on the frequency of his use of various practices of proecological behavior by calculating the Spearman and Kendall nonparametric correlations, negative correlations were revealed between the income level and the use of his own bags for shopping (P35), as well as the refusal to use personal vehicles in urban areas (P47, P48). A weak positive correlation was also found between the respondent’s income level and his use of such energy saving practices as cleaning the air conditioner filter (Table 8).
Table 8.
Correlations (at the p = 0.05 level) between the respondent’s income level and the frequency of using proenvironmental practices.
Thus, we can say that the level of income has practically no effect on the frequency of using proecological patterns of consumer behavior. The exception is urban mobility practices, where there is a negative impact of income on proecological mobility practices.
4.7. The Influence of the Level of Involvement in Environmental Activities on the Frequency of Use of Practices of Proenvironmental Behavior
The influence of the level of involvement in environmental activities (which can be interpreted as the level of environmental awareness) on the frequency of applying proenvironmental behavior was also investigated using a series of nonparametric Kruskal–Wallis tests. Statistically significant values χ2-statistics are given in Table 9.
Table 9.
The results of calculating the Kruskal–Wallis statistics to test the hypothesis about the influence of the respondent’s level of involvement in environmental activities on the frequency of using proenvironmental practices.
4.8. Results of the Analysis of Descriptive Statistics on Proenvironmental Behavior Practices
The calculation of descriptive statistics on the respondents’ assessments of the frequency of using the proposed patterns of proecological consumer behavior shows that the most popular practices across all 57 were P1 “Avoiding overloading the refrigerator”, P2 “Reducing the opening and closing of the refrigerator door”, “P4 “Putting hot food into refrigerator after cooling”, P7 “Adjusting the temperature of the air conditioner”, P8 “Turning off lights in empty rooms”, P10 “Turning off the TV when people are not watching”, P11 “Using energy saving mode or turning off when not in use”, P28 “Using own cup”, P31 “Covering the pan with a lid when cooking or boiling water” и P44 “Attempting to fix things before buying a replacement“, they have a median score of 2.7 to 3.
The least popular practices, with a median score of 1.5 to 2.1, are: P21 “Avoiding throwing away waste cooking oil”, P25 “Collection and delivery of glass containers to appropriate collection points”, P27 “Collection and delivery of used batteries, light bulbs to appropriate collection points”, P33 “Throwing away kitchen garbage after it has dried”, P34 “Using receptacle instead of plastic bag”, P42 “Choosing goods with their CO2 emission in mind (carbon footprint)”, P49 “Joining the one day without car program”, P52 “Reducing idling of the car”, P53 “Maintaining the air pressure in the tire”, P55 ”Using the dishwasher” и P57 “Using residual heat when cooking on an electric stove” (Figure 1).
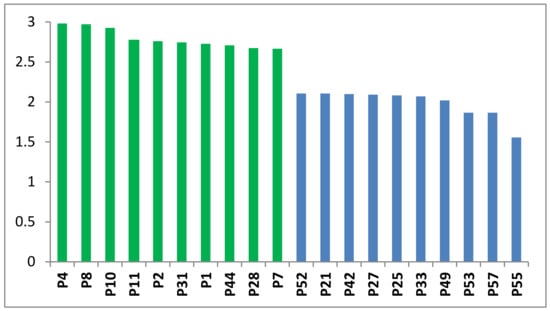
Figure 1.
Average ratings of 10 most and 10 least popular practices of proecological behavior in Russia.
The most consistent respondents from the regions rated the practices: P1 “Avoiding overloading the refrigerator”, P2 “Reducing opening and closing the door of the refrigerator”, P3 “Using a lower setting in the refrigerator compartment”, P17 “Taking short showers”, P36 “Reducing use of disposable products”, P41 “Buying ecomark-appliances” (the standard deviation is slightly more than 1). The largest scatter of assessments is observed across practices: P57 “Use of residual heat when cooking on an electric stove”, P16 “Turning off the water when washing face or brushing teeth”, P51 “Avoiding overloading the car”, P53 “Maintaining air pressure of tire”. Moscow’s respondents did not show consistency in applying practices (standard deviation is on average more than 1.0). The most considerable variation among respondents is observed for practices: P53 “Maintaining air pressure of tire”, P55 “Using the dishwasher”, P56 “Flame control when cooking on a gas stove”, P57 “Using residual heat when cooking on an electric stove” (standard deviation is on average more than 1.5). Among the groups of practices, the most popular were energy saving practices (median 2.8, average 2.6), the least popular practices for waste management (median 1.9, average 2.21) (Figure 2).
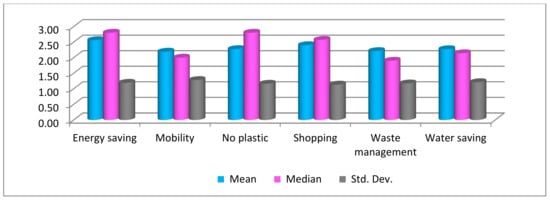
Figure 2.
Most popular groups of practices.
One of the central principles of ecological behavior is saving resources in everyday life. Research data showed that a significant proportion of citizens (46%) try to save electricity, water, and gas. Regarding people’s behavior, which can be called eco-oriented (saving resources in everyday life, separating garbage, following the norms of waste management), we can conclude that Russians rarely adhere to several pro-eco practices simultaneously, but they are used quite often separately. The most frequently chosen reason for nonapplication of proenvironmental practices of handling household waste was the answer option “There are no necessary conditions for application”, which suggests that the overwhelming majority of respondents could make them at least more commonly used with appropriate collection points for glass containers, wastepaper, old clothing, used batteries and light bulbs. However, also popular answers about the reasons for nonapplication were “I see no need”, “laziness”, “waste of time”, “forgetting”, which indicates an insufficient level of environmental self-awareness even in one of the most informed and flexible in household skills group of respondents. The identified differences are most likely explained not so much by the respondent’s income level as by other factors that may be indirectly related to the income level: cultural traditions and living conditions. More research is needed to understand better the impact of income on the frequency of using a particular behavior model.
4.9. Box and Whisker Chart Analysis Results for Proenvironmental Behavior Practices
The revealed differences were analyzed by constructing box and whisker diagrams, reflecting the median, and quartiles of 25%–75% and the maximum and minimum values of each group’s respondents’ ratings. Differences due to the discrepancy between only the quartiles of 25–75% and the discrepancy between the median estimates of only groups 4, 5, and 6 (the smallest, cannot be generated randomly) were excluded from the meaningful interpretation. In those cases, when the median values of the most numerous groups of respondents (1, 2, and 3) differed among themselves, we attempted to analyze and substantively explain the statistically significant differences revealed. In Figure 3, Figure 4, Figure 5, Figure 6, Figure 7, Figure 8, Figure 9, Figure 10, Figure 11, Figure 12, Figure 13, Figure 14, Figure 15 and Figure 16 are box and whisker diagrams with the most noticeable differences in the respondents’ assessments between groups 1—Moscow, 2—Krasnodar, 3—Krasnodar region.
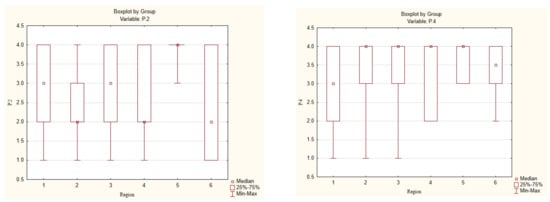
Figure 3.
Box and whisker diagrams for practices P2 (Reducing opening and closing the door of the refrigerator) and P4 (Putting hot food into the refrigerator after cooling) from the category “energy saving”.
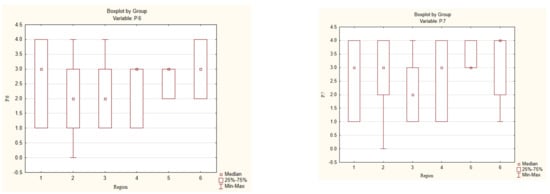
Figure 4.
Box and whisker diagrams for practice P6 (Cleaning filter of the air conditioner or cleaner) and P7 (Adjusting the temperature of the air conditioner), the category “energy saving”.
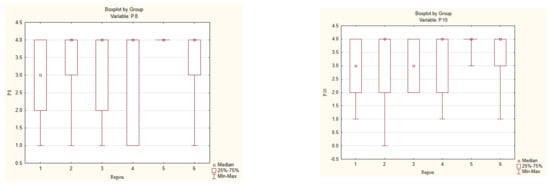
Figure 5.
Box and whisker diagrams for practice P8 (Turning off lights in empty rooms) and P10 (Turning off the TV when people are not watching), the category “energy saving”.
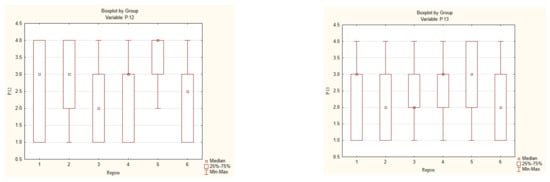
Figure 6.
Box and whisker diagrams for practice P12 (Doing ironing collectively) and P13 (Setting a lower shower temperature), the category “energy saving”.
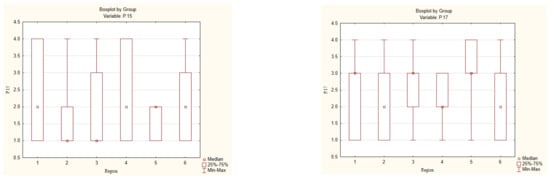
Figure 7.
Box and whisker diagrams for practice P15 (Using toothbrush cup) and P17 (Taking short showers), category—“Water saving”.
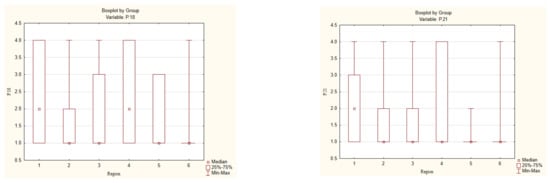
Figure 8.
Box and whisker diagrams for practice P18 (category “Water saving”) and P21 (category “Waste management”).
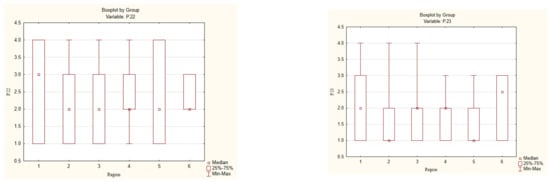
Figure 9.
Box and whisker diagrams for practices P22 (Following garbage rules) and P23 (Garbage separation), the category “Waste management”.
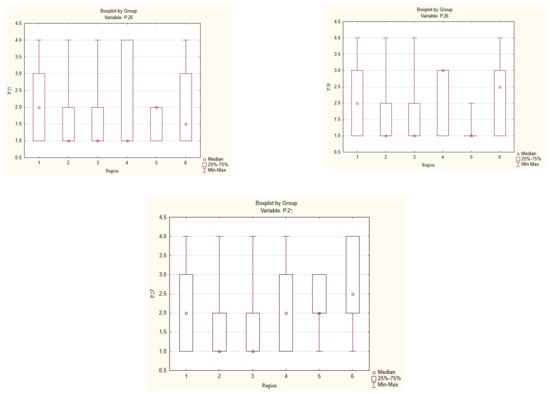
Figure 10.
Box and whisker diagrams for practices P25 (Collection and delivery of glass containers to appropriate collection points), P26 (wastepaper collection and delivery to appropriate collection points) and P27 (Collection and delivery of used batteries, light bulbs to appropriate collection points) from the category “Waste management”.
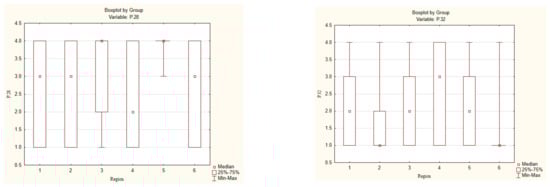
Figure 11.
Box and whisker diagrams by practices P28 (Using own cup), P32 (Composting kitchen garbage), from the categories “No plastic” and “Waste management”.
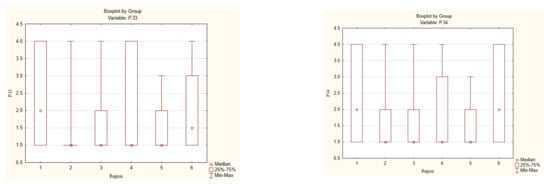
Figure 12.
Box and whisker diagrams by practices P33 (Throwing away kitchen garbage after it has dried), P34 (Using receptacle instead of plastic bag), from the categories “No plastic” and “Waste management”.
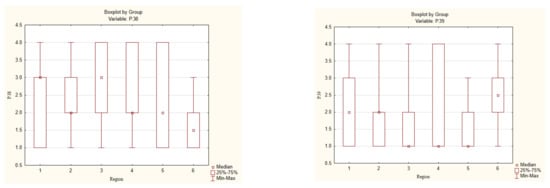
Figure 13.
Box and whisker charts by practices P38 (Buying organic products), P39 (Buying recycled goods), from category “Shopping”.
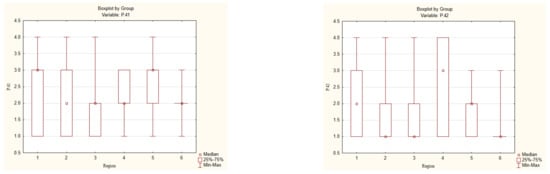
Figure 14.
Box and whisker charts by practices P41 (Buying ecomark-appliances), P42 (Choosing goods with their CO2 emission in mind (carbon footprint)), from category “Shopping”.
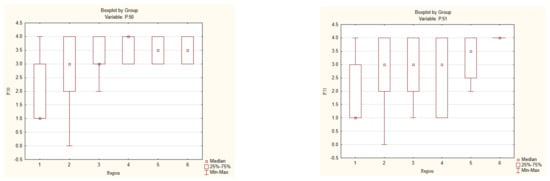
Figure 15.
Box and whisker diagrams by practices P50 (Doing car checks regularly), P51 (Avoiding overloading the car), category “Mobility”.
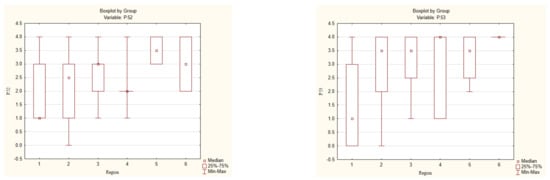
Figure 16.
Box and whisker diagrams by practices P52 (Reducing idling of the car), P53 (Maintaining air pressure of the tire), category “Mobility”.
Control over opening the refrigerator (P2): in Krasnodar, this practice is used less frequently (median 2.0, which corresponds to the answer “rarely”) than in Moscow and small towns of the Krasnodar Territory (median 3.0, which corresponds to the answer “often”). Cooling hot food before placing it in the refrigerator (P4): in Krasnodar and Krasnodar region it is used more often (median 4, which corresponds to the answer “always”) than in Moscow (median—3, which corresponds to the answer “often”) (Figure 3). Air conditioner filter cleaning (P6) is used much more frequently in Moscow (median 3, which corresponds to the answer “often”) than in Krasnodar and Krasnodar region (median 2—“rarely”). Air conditioner temperature control (P7) is more often used in large cities—Moscow and Krasnodar (median 3—“often”), and in Krasnodar region-less often (median 2—“rarely”) (Figure 4).
Lighting off in empty rooms (P8) is more commonly used in Krasnodar and Krasnodar region (median 4—“always”) than in Moscow (median 3—“often”). Switching off the TV after watching (P10) is most often used in Krasnodar (median 4—“always”), while in Moscow and Krasnodar region—less often (median 3—“often”) (Figure 5). Selective ironing (P12) is often practiced in large cities—Moscow and Krasnodar (median 3—“often”). In small towns and rural areas of the Krasnodar region, this practice of energy saving is rarely used (median 2—“rarely). Lowering the water temperature when taking a shower/washing/washing dishes (P13) is more often practiced in Moscow (median 3—“often”), while in Krasnodar and Krasnodar region this practice of energy saving is used less often (median 2—“rarely”) (Figure 6).
Using a water cup when brushing teeth (P15) is one of Russia’s least popular resource-saving practices. In Moscow (as well as in the regions that are represented by a small number of respondents), it is still used more often (median 2—“rarely”) than in Krasnodar and Krasnodar region (median 1—“never”). Shortening of shower time (P17) as a water saving practice is more often used in Moscow and small towns of the Krasnodar region (median 3—“often”) than in Krasnodar (median 2—“rarely”) (Figure 7).
Washing dishes in a basin (P18) is more commonly used in Moscow (median 2—“rarely”) than in Krasnodar and Krasnodar region (median 1—“never”). A similar situation is observed in the practice of recycling vegetable oil (P21). This situation is rather strange since it is logical to assume that such practices are more accessible to apply in the case of living in your own house and/or running a subsidiary farm, which is much more common in small towns of the Krasnodar region than in such a metropolis as Moscow (Figure 8).
Compliance with waste management standards (P22) is much more common in Moscow (median 3—“rare”) than in Krasnodar and Krasnodar region (median 2—“rare”). Judging by the assessments of respondents from regions with a low representation, it can be expected that the same situation of ignoring waste management standards is observed in other regions of Russia. The practice of sorting waste (P23) is more often used in Moscow and small towns of the Krasnodar region (median 2—“rarely”) than in Krasnodar (median 1—“never”) (Figure 9).
Collection and delivery of wastepaper, glass containers, and electronic waste occurs (P25) more often in Moscow (median 2—“rarely”) than in Krasnodar and other settlements of the Krasnodar region (median 1—“never”) (Figure 10).
The use of one’s tableware instead of disposable ones is equally often practiced in Moscow and Krasnodar (median 3—“often”) but even more often in small towns of Krasnodar region (median 4—“always”). Composting of kitchen waste is sometimes practiced in Moscow and small towns of the Krasnodar region (median 2—“rare”), in Krasnodar it does not occur at all (median 1—“never”) (Figure 11).
Such a practice of handling household waste as throwing away organic waste only after drying (P33) is sometimes observed in Moscow (median 2—“rarely”), in Krasnodar and other points of the Krasnodar region do not occur at all (median 1—“never”). The use of a container instead of a plastic bag for storing food (P34) is also more often used in Moscow (median 2—“rarely”) than in the Krasnodar region and Krasnodar (median 1—“never”) (Figure 12).
The purchase of organic products (P38) is more common in Moscow and small towns of the Krasnodar region (median 3—“often”) than in Krasnodar (median 2—“rare”). The purchase of processed goods (P39) is sometimes found in large cities—Moscow and Krasnodar but not at all in small towns of the Krasnodar region (median 1—“never”) (Figure 13).
Purchases of goods subject to ecolabeling (P41) are more likely to occur in Moscow (median 3—“often”) than in Krasnodar and Krasnodar region (median 2—“rare”). The purchase of goods taking into account the carbon footprint (P42) is still found only in Moscow (median 2—“rare”), in the Krasnodar region not found at all (Figure 14).
As for the practices that help reduce the negative impact of the car on the environment, the practice of regular technical inspection and avoidance of overloading the car (P50) is sometimes used in Krasnodar and Krasnodar region (median 2—“rarely”), in Moscow—never (median 1) (Figure 15). A similar picture is observed with a decrease in the idling of a car and tire pressure maintenance (P52). (Figure 16). In the Krasnodar region and Krasnodar, they are often used (median 2.5-3), in Moscow—never (median 1).
The respondents’ distribution by the level of participation in environmental events held by local communities, regional and federal authorities, and their initiative is shown in Figure 16. Of the most interesting differences between the behavior of respondents, the following can be noted: respondents who show their environmental activity in the form of participation in protest actions are less likely than other groups (including respondents who show their activity in other forms and respondents who do not participate in any what environmental actions) use in practice the patterns P4 (Putting hot food into the refrigerator after cooling), P11 (Using energy-saving mode or turning off when not in use) and P29 (Avoiding overvolume cooking) from the category “energy saving”, P16 (Turning off the water when washing face or brushing teeth) from the category “Water use”, P23 (Garbage separation) from the category “Waste management”, P28 (Using own cup) from the category “Refusal from plastic”, P37 (Not buying over-packaged products) and P38 (Buying organic products) from the category “Shopping”, P47 (Using bicycle or walking) and P53 (Maintaining air pressure of the tire) from the category “Mobility”. For all other practices, where differences in respondents’ behavior from different groups are revealed, this group does not differ from most others. Judging by the identified features of consumer behavior, this group of respondents cannot be classified as environmentally conscious. Their participation in protest actions is most likely motivated not by environmental considerations as by a generally negative attitude towards the authorities’ actions.
The most active respondents who took part in more than one type of environmental activities demonstrate a more frequent use of practices P4 (Putting hot food into the refrigerator after cooling) and P56 (Flame adjustment for cooking) from the category “energy saving”, P16 (Turning off the water when washing face or brushing teeth) from the category “Water use”, P28 (Using own cup) and P37 (Not buying over-packaged products) from in the category “Refusal of plastic”, P38 (Buying organic products) from the category “Purchases”, P53 (Maintaining air pressure of the tire) from the category “Mobility”. At the same time, according to other practices, such as P18 (Washing dishes using jugged water) from the category “Water use”, P23 (Garbage separation) from the category “Waste management”, P34 (Using receptacle instead of plastic bag) from the category “Avoiding plastic”, this group of respondents has the lowest or one of the lowest rates of the frequency of use. Such a spread in the frequency of using various practices of the most active respondents’ proecological behavior is most likely evidence that not all of the studied practices are realized as essential and useful. Any striking differences in the behavior of groups of respondents who have never taken part in environmental actions at all, who filed complaints or collected signatures under appeals to the authorities and who participated in tree planting, garbage collection, collection of wastepaper, glass containers, etc., was not identified. This may indicate that the respondents took part in environmental campaigns more out of solidarity, communication, charity, etc., rather than based on clear ideas about the severity of environmental problems. Another interpretation of the results obtained can be offered: it is much easier for even environmentally conscious people to take part in a one-time action than change the usual patterns of their daily consumer behavior.
5. Discussion
In the extensive literature on various proecological behavior issues, we can highlight several articles that consider various factors and barriers that affect environmental responsibility, which implies a more efficient use of natural resources. Thus, the article [27,49] noted that in addition to environmental awareness, the availability of financial resources, time, and opportunities affect the desire to purchase environmental goods. Studies [50,51,52] demonstrate that time preferences influence the valuation of PEBs even in very different cultural contexts (US and India), and people who have free time are more engaged in energy-saving proenvironmental behavior. Unlike previous research, our study did not reveal the differences in the frequency of some PEBs between the groups of economically active and inactive respondents, which can support our original hypothesis that having more free time in the absence of a permanent job can contribute to more careful handling of all resources and the use of more labor-intensive waste management practices. The exception is the pattern P8 “turning off lights in empty rooms”.
On the contrary, economically active respondents demonstrate greater environmental awareness. In a study [37] on the example of European countries, the author showed evidence of a positive influence of education on the proecological behavior of individuals. The same kind of positive correlation was recently found in [53] on the example of Peru for the PEBs, connected with plastic consumption. Our results also showed that involvement in the educational process has a positive effect on the respondent’s values and attitude towards practices. As for the revealed statistically significant differences between the groups of respondents who are receiving education and have completed their education, the second group of respondents demonstrates more conscious proecological behavior in absolutely all aspects.
Statistically significant differences in the frequency of PEBs for the variable “gender” were found only for nine PEBs, of which three PEBs belong to the mobility group and three PEBs belong to the waste-management group. This result is rather unexpected, since in other countries, for example, in Spain [54], France [55], and China [56], women demonstrate more active proecological behavior.
In the study of authors from China [40], it is shown that other aspects affect energy conservation in addition to education. The authors believe that urban residents are more economical in terms of energy consumption than rural residents. In this, the results of our study are quite consistent with the results of surveys of Chinese scientists conducted in large urban agglomerations and presented in the study [11]. Our results showed that concerning interregional differences, we could say that Moscow is a regional leader in infrastructure development and information support for more “advanced” practices of proenvironmental behavior. The application of these practices requires a certain level of environmental knowledge and specific technical equipment. In small towns and rural areas, traditional patterns of proenvironmental behavior are more often used. However, more detailed conclusions about regional differences can be made only after additional research and expansion of other regions of Russia in the sample.
Despite the fact that the obtained results cannot be directly compared with the parallel results of surveys in other countries presented in the literature, since they were obtained in different macro and micro contexts [56], it can be noted that composting kitchen waste is unpopular in Russia as much as in cities like Tokyo, Bangkok, and Seoul [25]. On the contrary, energy-saving practices are the most popular both in Russia and in all three Asian cities examined with the same methodology. In an article [41,57], the authors identified the most significant factors: age, income, and housing type. They showed that people living in private houses are more likely to save than residents of apartment buildings. The results of the study confirmed the effect of age on the frequency of practice. Namely, the older generation more often practices more than 50% of proecological behavior’s main patterns. They are more conscious about their consumption, which can be seen in many practices. However, this behavior is not associated with a decrease in economic activity and a decrease in income. On the contrary, economically active respondents are more likely to practice proenvironmental behavior than economically inactive, especially in cases where proenvironmental behavior is more costly than irresponsible consumption. The main reasons for not applying several consumer behavior patterns are either a lack of understanding of their significance or a complete lack of information about the possibility of such consumer behavior.
The selection of methods for studying barriers to consumer prosustainable behavior confirmed significant shortcomings of the questionnaire used in this study. This method is actively discussed in the literature [7,8,43]. However, when conducting primary research to obtain a general picture of the spread of a particular behavior model and identifying the reasons for the nonproliferation of other models, this method, in our opinion, remains a priority tool. It is possible to identify the main reasons for the weak operation of CE in reality. Central to the effective circular economy design is the observation that there is still a problem with information. For example, potential consumers do not know how many years they can use it when buying a supported product. If the customer can receive such information on time, this may affect his choice. There is also a distorted perception among potential customers that recycled materials are usually considered substandard. In primary markets, external effects (pollution of the environment and air) are not taken into account, which leads to unjustified price advantages of primary materials. It is necessary to increase the literacy of citizens. As the key factors that hinder environmentally sound behavior, the respondents highlight the lack of their initiative and specific environmental measures on the part of the government.
6. Conclusions
This paper contributes to the literature on sustainable consumption by in-depth analysis of the factors affecting the probability of 57 different PEBs in Russia. The advantages of our research are as follows: the set of studied PEBs includes not only popular energy-saving and waste-management practices but also more circular patterns of plastic consumption, shopping, and city mobility.
The study has revealed that involvement in the educational process (being a student) has a positive effect on the respondent’s attitude towards the most energy-saving practices. Besides, the respondents who completed their education demonstrate more conscious proenvironmental behavior in all studied areas: energy and water saving, plastic consumption, food consumption, waste management, and sustainable mobility. At the same time, the probability of PEBs practically not related to the level of income and, therefore, is not the result of intention to save money. Economically active respondents demonstrate greater environmental awareness and are more likely to practice waste collection and recycling and reusable shopping bags. In addition, economically active respondents are more competent in handling household appliances to reduce their energy consumption.
Thus, it is possible to confirm the positive externality of education-higher quality proecological behavior. Given the high cost of recycling modern waste, investment in education can be a preventive measure for improving the environment. In the short term, the effect is hardly possible, but for the regions of Russia, raising awareness and education of the population in the long term can significantly affect the level of environmental awareness.
The main reasons for not applying some sustainable behavior patterns are either a lack of understanding of their significance or a complete lack of information about the possibility of such consumer behavior. Waste management practices are the least popular. We can explain that the unpopularity of waste management practice by the underdevelopment of “eco” infrastructure, which is a barrier to the formation of proecological behavior. As a rule, respondents understand which of the patterns is correct and realize its importance, but the lack of infrastructure at the proper level does not allow using this pattern. The study showed that there are inter-regional differences. We can say that Moscow is a leader in infrastructure development and information support for more “advanced” practices of proenvironmental behavior, the use of which requires a certain level of environmental knowledge and specific technical equipment. In small towns and rural areas, traditional patterns of proecological behavior are more commonly used. However, more detailed conclusions about regional differences can be made only after additional research and expansion of other regions of Russia in the sample. The findings can be used in the educational process and social work with young people.
We realize that the obtained results cannot be directly compared with results of surveys in other countries presented in the literature, since they were obtained in different macro and micro contexts. It should be noted that the factors influencing PEB are still not clearly understood outside a high-income country. However, our major findings do not contradict with conclusions of other authors, arguing that the level of education is one of the most important factors for practicing PEBs.
As for the limitations of our study, we can point out a moderate sample size. This has prevented us from studying the regional differences in behaviors in a more detailed way. Besides the sample size limitation, our study has also neglected the role of cultural values and social norms in stimulating proenvironmental patterns of consumer’s behavior.
In our questionnaire design, we have provided questions aimed at identifying the main reasons as to why respondents do not practice PEBs. The answers to these questions should have led us to estimates of behavioral cost. However, in reality, the main reason for not using PEBs was the lack of information about its environmental importance. We will continue our study in trying to redesign the questionnaire, collecting more even samples, and using advanced methods, such as structural modelling, for processing the result of survey.
Author Contributions
Conceptualization, S.R. (Svetlana Ratner); Data curation, S.R. (Svetlana Ratner); Formal analysis, I.L.; Funding acquisition, I.L.; Investigation, S.R. (Svetlana Ratner); Methodology, S.R. (Svetlana Ratner); Project administration, I.L.; Resources, K.G., S.R. (Svetlana Revinova); Software, S.R. (Svetlana Ratner); Supervision, S.R. (Svetlana Ratner); Validation, S.R. (Svetlana Ratner), K.G. and S.R. (Svetlana Revinova); Visualization, K.G.; Writing—original draft, I.L.; Writing—review and editing, S.R. (Svetlana Ratner), K.G., S.R. (Svetlana Revinova) and I.L. All authors have read and agreed to the published version of the manuscript.
Funding
The publication has been prepared with the support of the “RUDN University Program 5-100”.
Institutional Review Board Statement
Not applicable.
Informed Consent Statement
Informed consent was obtained from all subjects involved in the study.
Conflicts of Interest
The authors declare no conflict of interest.
References
- Revinova, S.; Ratner, S.; Lazanyuk, I.; Gomonov, K. Sharing Economy in Russia: Current Status, Barriers, Prospects and Role of Universities. Sustainability 2020, 12, 4855. [Google Scholar] [CrossRef]
- Korhonen, J.; Honkasalo, A.; Seppälä, J. Circular Economy: The Concept and its Limitations. Ecol. Econ. 2018, 143, 37–46. [Google Scholar] [CrossRef]
- Ratner, S. European experience in transition to circular economy. Econ. Anal. Theory Pract. 2020, 19, 598–617. [Google Scholar] [CrossRef]
- Haas, W.; Krausmann, F.; Wiedenhofer, D.; Heinz, M. How Circular is the Global Economy? An Assessment of Material Flows, Waste Production, and Recycling in the European Union and the World in 2005. J. Ind. Ecol. 2015, 19, 765–777. [Google Scholar] [CrossRef]
- Kirchherr, J.; Piscicelli, L.; Bour, R.; Kostense-Smit, E.; Muller, J.; Huibrechtse-Truijens, A.; Hekkert, M. Barriers to the Circular Economy: Evidence From the European Union (EU). Ecol. Econ. 2018, 150, 264–272. [Google Scholar] [CrossRef]
- Lee, H.; Kurisu, K.; Hanaki, K. Influential Factors on Pro-Environmental Behaviors—A Case Study in Tokyo and Seoul. Low Carbon Econ. 2013, 4, 104–116. [Google Scholar] [CrossRef]
- Kormos, C.; Gifford, R. The validity of self-report measures of proenvironmental behavior: A meta-analytic review. J. Environ. Psychol. 2014, 40, 359–371. [Google Scholar] [CrossRef]
- Lange, F.; Dewitte, S. Measuring pro-environmental behavior: Review and recommendations. J. Environ. Psychol. 2019, 63, 92–100. [Google Scholar] [CrossRef]
- Yuriev, A.; Boiral, O.; Francoeur, V.; Paillé, P. Overcoming the barriers to pro-environmental behaviors in the workplace: A systematic review. J. Clean. Prod. 2018, 182, 379–394. [Google Scholar] [CrossRef]
- Fu, L.; Sun, Z.; Zha, L.; Liu, F.; He, L.; Sun, X.; Jing, X. Environmental Awareness and Pro-environmental Behavior within China’s Road Freight Transportation Industry: Moderating Role of Perceived Policy Effectiveness. J. Clean. Prod. 2019, 119796. [Google Scholar] [CrossRef]
- Huang, L.; Wen, Y.; Gao, J. What ultimately prevents the pro-environmental behavior? An in-depth and extensive study of the behavioral costs. Resour. Conserv. Recycl. 2020, 158, 104747. [Google Scholar] [CrossRef]
- Chwialkowska, A.; Bhatti, W.A.; Glowik, M. The influence of cultural values on pro-environmental behavior. J. Clean. Prod. 2020, 122305. [Google Scholar] [CrossRef]
- Ali, E.B.; Anufriev, V.P. Towards environmental sustainability in Russia: Evidence from green universities. Heliyon 2020, 6, e04719. [Google Scholar] [CrossRef] [PubMed]
- Stern, P. New Environmental Theories: Toward a Coherent Theory of Environmentally Significant Behavior. J. Soc. Issues 2000, 56, 407–424. [Google Scholar] [CrossRef]
- Andersson, L.; Shivarajan, S.; Blau, G. Enacting ecological sustainability in the MNC: A test of an adapted value-belief-norm framework. J. Bus. Ethics 2005, 59, 295–305. [Google Scholar] [CrossRef]
- Kaiser, F.G.; Wolfing, S.; Fuhrer, U. Environmental attitude and ecological behavior. J. Environ. Psychol. 1999, 19, 1–19. [Google Scholar] [CrossRef]
- Ellen MacArthur Foundation: Towards a Circular Economy: Business Rationale for an Accelerated Transition. Available online: https://www.ellenmacarthurfoundation.org/assets/downloads/TCE_Ellen-MacArthur-Foundation_9-Dec-2015.pdf (accessed on 15 October 2020).
- Wilts, H. The Digital Circular Economy: Can the Digital Transformation Pave the Way for Resource-Efficient Materials Cycles? Int. J. Environ. Sci. Nat. Resour. 2017, 7. [Google Scholar] [CrossRef]
- Ando, K.; Ohnuma, S.; Chang, E. Comparing normative influences as determinants of environmentally conscious behaviours between the USA and Japan. Asian J. Soc. Psychol. 2007, 10, 171–178. [Google Scholar] [CrossRef]
- Ando, K.; Ohnuma, S.; Anke, B.; Matthies, E.; Sugiura, J. Determinants of Individual and Collective Pro-Environmental Behaviors: Comparing Germany and Japan. J. Environ. Inf. Sci. 2010, 38, 21–32. [Google Scholar]
- Schultz, P.W. Knowledge, Information, and Household Recycling: Examining the Knowledge-Deficit Model of Behavior Change. In New Tools for Environmental Protection: Education, Information, and Voluntary Measures; The National Academic Press: Washington, DC, USA, 2012; pp. 67–82. [Google Scholar]
- Aoki, Е.; Kurisu, K.H.; Nakatani, J.; Hanaki, K. Current State and Interregional Comparison of Citizen’s Environmental Behavior by 47 Prefectures. Jpn. J. Jsce 2010, 38, 17–26. [Google Scholar]
- Cordano, M.; Welcomer, S.; Scherer, R.; Pradenas, L.; Parada, V. A Cross-Cultural Assessment of Three Theories of Pro-Environmental Behavior. Environ. Behav. 2010, 43, 634–657. [Google Scholar] [CrossRef]
- Li, D.; Zhao, L.; Ma, S.; Shao, S.; Zhang, L. What influences an individual’s pro-environmental behavior? A literature review. Resour. Conserv. Recycl. 2019, 146, 28–34. [Google Scholar] [CrossRef]
- Phuphisith, S.; Kurisu, K.; Hanaki, K. A comparison of the practices and influential factors of pro-environmental behaviors in three Asian megacities: Bangkok, Tokyo, and Seoul. J. Clean. Prod. 2020, 253, 119882. [Google Scholar] [CrossRef]
- Moon, M.A.; Habib, M.D.; Attiq, S. Analyzing the Sustainable Behavioral Intentions: Role of Norms, Beliefs and Values on Behavioral Intentions. Pak. J. Commer. Soc. Sci. 2015, 9, 524–539. [Google Scholar]
- Yadav, R.; Pathak, G. Determinants of Consumers’ Green Purchase Behavior in a Developing Nation: Applying and Extending the Theory of Planned Behavior. Ecol. Econ. 2017, 134, 114–122. [Google Scholar] [CrossRef]
- Setyawan, A.; Noermijati, N.; Sunaryo, S.; Aisjah, S. Green product buying intentions among young consumers: Extending the application of theory of planned behavior. Probl. Perspect. Manag. 2018, 16, 145–154. [Google Scholar] [CrossRef]
- Gallagher, V.; Hrivnak, M.; Valcea, S.; Mahoney, C.; LaWong, D. A comprehensive three-dimensional sustainability measure: The ‘missing P’ of ‘people’—A vital stakeholder in sustainable development. Corp. Soc. Responsib. Environ. Manag. 2018, 25, 772–787. [Google Scholar] [CrossRef]
- Schmitt, M.; Aknin, L.; Axsen, J.; Shwom, R. Unpacking the Relationships Between Pro-environmental Behavior, Life Satisfaction, and Perceived Ecological Threat. Ecol. Econ. 2018, 143, 130–140. [Google Scholar] [CrossRef]
- Dalvi-Esfahani, M.; Alaedini, Z.; Nilashi, M.; Samad, S.; Asadi, S.; Mohammadi, M. Students’ green information technology behavior: Beliefs and personality traits. J. Clean. Prod. 2020, 257, 120406. [Google Scholar] [CrossRef]
- Chan, H. When do values promote pro-environmental behaviors? Multilevel evidence on the self-expression hypothesis. J. Environ. Psychol. 2020, 71, 101361. [Google Scholar] [CrossRef]
- Chankrajang, T.; Muttarak, R. Green Returns to Education: Does Schooling Contribute to Pro-Environmental Behaviours? Evidence from Thailand. SSRN Electron. J. 2015. [Google Scholar] [CrossRef]
- Donmez-Turan, A.; Kiliclar, I. The analysis of pro-environmental behaviour based on ecological worldviews, environmental training/ knowledge and goal frames. J. Clean. Prod. 2020, 279, 123518. [Google Scholar] [CrossRef]
- López-Bonilla, J.; Reyes-Rodríguez, M.; López-Bonilla, L. Interactions and Relationships between Personal Factors in Pro-Environmental Golf Tourist Behaviour: A Gender Analysis. Sustainability 2019, 12, 332. [Google Scholar] [CrossRef]
- Gaspar, R. Understanding the Reasons for Behavioral Failure: A Process View of Psychosocial Barriers and Constraints to Pro-Ecological Behavior. Sustainability 2013, 5, 2960–2975. [Google Scholar] [CrossRef]
- Meyer, A. Does education increase pro-environmental behavior? Evidence from Europe. Ecol. Econ. 2015, 116, 108–121. [Google Scholar] [CrossRef]
- Wang, R.; Qi, R.; Cheng, J.; Zhu, Y.; Lu, P. The behavior and cognition of ecological civilization among Chinese university students. J. Clean. Prod. 2020, 243, 118464. [Google Scholar] [CrossRef]
- Salvioni, D.; Almici, A. Transitioning Toward a Circular Economy: The Impact of Stakeholder Engagement on Sustainability Culture. Sustainability 2020, 12, 8641. [Google Scholar] [CrossRef]
- Ding, Z.; Wang, G.; Liu, Z.; Long, R. Research on differences in the factors influencing the energy-saving behavior of urban and rural residents in China–A case study of Jiangsu Province. Energy Policy 2017, 100, 252–259. [Google Scholar] [CrossRef]
- Martinsson, J.; Lundqvist, L.; Sundström, A. Energy saving in Swedish households. The (relative) importance of environmental attitudes. Energy Policy 2011, 39, 5182–5191. [Google Scholar] [CrossRef]
- Lillemo, S. Measuring the effect of procrastination and environmental awareness on households’ energy-saving behaviours: An empirical approach. Energy Policy 2014, 66, 249–256. [Google Scholar] [CrossRef]
- Kaiser, F.; Merten, M.; Wetzel, E. How do we know we are measuring environmental attitude? Specific objectivity as the formal validation criterion for measures of latent attributes. J. Environ. Psychol. 2018, 55, 139–146. [Google Scholar] [CrossRef]
- Ratner, S.; Iosifov, V. Eco-management and eco-standardization in Russia: The perspectives and barriers for development. J. Environ. Manag. Tour. 2017, 8, 247–258. [Google Scholar] [CrossRef]
- Yin, R. Case Study Research and Applications: Design and Methods; Sage Publications: Thousand Oaks, CA, USA, 2018. [Google Scholar]
- Heckathorn, D. Respondent-driven sampling: A new approach to the study of hidden populations. Soc. Probl. 1997, 44, 174–199. [Google Scholar] [CrossRef]
- Ratner, S.; Zaretskaya, M. Forecasting the Ecology Effects of Electric Cars Deployment in Krasnodar Region (Russia): Learning Curves Approach. J. Environ. Manag. Tour. 2018, 9, 82–94. [Google Scholar] [CrossRef]
- Bol’shakov, A.A.; Karimov, R.N. Metody Obrabotki Mnogomernyh Dannyh i Vremennyh Ryadov: Ucheb. Posobie dlya Vuzov. M.: Goryachaya Liniya—Telekom; Hotline —Telekom: Moscow, Russia, 2007. [Google Scholar]
- Kadic-Maglajlic, S.; Arslanagic-Kalajdzic, M.; Micevski, M.; Dlacic, J.; Zabkar, V. Being engaged is a good thing: Understanding sustainable consumption behavior among young adults. J. Bus. Res. 2019, 104, 644–654. [Google Scholar] [CrossRef]
- Qiu, Y.; Colson, G.; Grebitus, C. Risk preferences and purchase of energy-efficient technologies in the residential sector. Ecol. Econ. 2014, 107, 216–229. [Google Scholar] [CrossRef]
- Newell, R.G.; Siikamki, J. Individual time preferences and energy efficiency. Am. Econ. Rev. Pap. Proc. 2015, 105, 196–200. [Google Scholar] [CrossRef]
- Fuerst, F.; Singh, R. How present bias forestalls energy efficiency upgrades: A study of household appliance purchases in India. J. Clean. Prod. 2018, 186, 558–569. [Google Scholar] [CrossRef]
- Fuhrmann-Riebel, H.; D’Exelle, B.; Verschoor, A. The role of preferences for pro-environmental behaviour among urban middle class households in Peru. Ecol. Econ. 2021, 180, 106850. [Google Scholar] [CrossRef]
- Casaló, L.; Escario, J.; Rodriguez-Sanchez, C. Analyzing differences between different types of pro-environmental behaviors: Do attitude intensity and type of knowledge matter? Resour. Conserv. Recycl. 2019, 149, 56–64. [Google Scholar] [CrossRef]
- Bradley, G.L.; Babutsidze, Z.; Chai, A.; Reser, J.P. The role of climate change risk perception, response efficacy, and psychological adaptation in pro-environmental behavior: A two nation study. J. Environ. Psychol. 2020, 68, 101410. [Google Scholar] [CrossRef]
- Ling, M.; Xu, L. Relationships between personal values, micro-contextual factors and residents’ pro-environmental behaviors: An explorative study. Resour. Conserv. Recycl. 2020, 156, 104697. [Google Scholar] [CrossRef]
- Binder, M.; Blankenberg, A.; Guardiola, J. Does it have to be a sacrifice? Different notions of the good life, pro-environmental behavior and their heterogeneous impact on well-being. Ecol. Econ. 2020, 167, 106448. [Google Scholar] [CrossRef]


Publisher’s Note: MDPI stays neutral with regard to jurisdictional claims in published maps and institutional affiliations. |
© 2020 by the authors. Licensee MDPI, Basel, Switzerland. This article is an open access article distributed under the terms and conditions of the Creative Commons Attribution (CC BY) license (http://creativecommons.org/licenses/by/4.0/).