Article

Using Mobiles to Monitor Respiratory Diseases

1
Department of Computer Science and Engineering, American University of Sharjah, Sharjah 26666, UAE
2
Department of Electrical Engineering, American University of Sharjah, Sharjah 26666, UAE
3
College of Medicine, University of Sharjah, Sharjah 27272, UAE
*
Author to whom correspondence should be addressed.
Informatics 2020, 7(4), 56; https://doi.org/10.3390/informatics7040056
Submission received: 7 November 2020 / Revised: 12 December 2020 / Accepted: 15 December 2020 / Published: 16 December 2020
(This article belongs to the Special Issue Feature Papers: Health Informatics)

Abstract

:
In this work, a mobile application is developed to assist patients suffering from chronic obstructive pulmonary disease (COPD) or Asthma that will reduce the dependency on hospital and clinic based tests and enable users to better manage their disease through increased self-involvement. Due to the pervasiveness of smartphones, it is proposed to make use of their built-in sensors and ever increasing computational capabilities to provide patients with a mobile-based spirometer capable of diagnosing COPD or asthma in a reliable and cost effective manner. Data collected using an experimental setup consisting of an airflow source, an anemometer, and a smartphone is used to develop a mathematical model that relates exhalation frequency to air flow rate. This model allows for the computation of two key parameters known as forced vital capacity (FVC) and forced expiratory volume in one second (FEV1) that are used in the diagnosis of respiratory diseases. The developed platform has been validated using data collected from 25 subjects with various conditions. Results show that an excellent match is achieved between the FVC and FEV1 values computed using a clinical spirometer and those returned by the model embedded in the mobile application.

1. Introduction

Different factors such as smoking, genetics, and infections may lead to serious respiratory and lung diseases [1]. Chronic obstructive pulmonary disease (COPD) and asthma are among the most common lung diseases, with COPD being the third leading cause of death in the world [2]. COPD symptoms increase in severity with time, leading to the narrowing of the airways and, hence, a noticeable difficulty in breathing. Typically, the symptoms that COPD patients experience include chest tightness, chronic coughing, and dyspnea, among several others. Smoking is considered to be one of the leading factors behind COPD causes. Similarly, asthma is a chronic lung disease that narrows and inflames the airways, which causes different symptoms such as dyspnea, episodic cough, chest tightness, shortness of breath, and recurring periods of wheezing. The exact cause of asthma is not known yet, but several factors such as heredity and atopy may contribute to its occurrence [3].
One of the most common pulmonary function tests is spirometry, which is used to measure lung function, especially the amount and speed of inhaled and exhaled air. In cases of respiratory diseases such as COPD and asthma, which are chronic and progressive diseases, patients should pay attention to the progress and changes in the symptoms and undergo regular checkups by performing the spirometry test in order to avoid exacerbating the disease. Unfortunately, these tests are expensive and time and resource consuming. An alternative solution is to adopt a cost-effective mobile Health (mHealth) approach to diagnose and manage respiratory diseases; mHealth is one aspect of eHealth that is pushing the limits of traditional healthcare. It is expected that mHealth will be part of many healthcare related activities due to the following advantages [4]:
  • It can eliminate the need of regular tests and hence reduce the cost of medical care and consequently provide healthcare for people with low income;
  • It can reach patients in even the most remote locations;
  • It can increase the reach and efficiency of healthcare;
  • It empowers the patients because smartphones can help patients monitor their disease at home. Furthermore, it can be used as a tool for patients to manage appointments, renew prescriptions, or view medical records;
  • Doctors are increasingly using smartphones, allowing them to access medical materials. They can also reach patients in rural areas through remote diagnostics and information alerts;
  • Remotely monitoring hospital patients or the elderly can free up much needed capacity in hospitals and nursing homes.
The work in this paper discusses the steps taken to design, implement, and test a mobile application that can be used to diagnose both respiratory illnesses: COPD and asthma. The proposed system processes data collected using the built-in micro-electro-mechanical systems (MEMS) microphone in smartphones in an attempt to mimic the working of a typical spirometer, and accordingly perform equally reliable spirometry tests. The idea is to make use of the pervasiveness of smartphones and introduce cost-effective clinic-like tests at home. The rest of the paper is organized as follows: Section 2 presents background on asthma and COPD diseases, and reviews related research. Section 3 discusses the methodology followed in this work. The experimental work carried out is described in Section 4. Section 5 presents and discusses the mobile application. Results are discussed in Section 6, and the paper is concluded in Section 7.

2. Background and Related Work

Spirometry is a standard tool for diagnosing, staging, and managing COPD and asthma [5]. During the test, the patient blows as hard as possible into a tube connected to a device. The device will measure how much and how fast the patient can breathe air.
Most spirometers display two spirograms, a volume-time curve and a flow-volume loop, and provide one or more of the following commonly measured parameters [4,5]:
  • Forced vital capacity (FVC): The volume of air that can be expired after a maximum inspiration;
  • Forced expiratory volume in one second (FEV1): Volume of air expelled in the first second of a forced expiration;
  • Forced expiratory flow 25–75% (FEF 25–75): Average expiratory flow rate in the middle part of a forced expiration;
  • FEV1/FVC: This is the ratio of the vital capacity that is expired in the first second of maximal expiration;
  • Peak expiratory flow (PEF): Maximal expiratory flow rate achieved.
Pulse oximetry is another tool used to assist patients with the management of their disease. Pulse oximetry measures oxygen saturation of hemoglobin in arterial blood (SpO2), and it can provide an early warning of dangerous hypoxemia [6] and is a complementary tool to spirometry.
According to the global initiative for obstructive lung disease (GOLD) [7], COPD diagnosis should be considered for an individual over age 40 that experiences one or more of the following indicators:
  • Dyspnea that is progressive (worsens over time);
  • Chronic cough that may be intermittent and may be unproductive;
  • Chronic sputum production;
  • History of exposure to risk factors such as tobacco smoke, smoke from home cooking, heating fuels, and occupational dusts and chemicals;
  • Family history of COPD.
In case the patient is likely to have COPD based on the above indicators, spirometry is conducted for confirmation. If the post bronchodilator ratio FVC/FEV1 is less than 0.7, this confirms that the patient has COPD. COPD assessment is required to determine its severity according to FEV1% predicted. FEV1% predicted is defined as FEV1% of the patient divided by the average FEV1% in the population for any person of similar age, sex, and body composition. Furthermore, by using the pulse oximetry with COPD patients, an SpO2 of 92% or less should prompt referral for further investigation and perhaps the need for long-term oxygen therapy [7,8]. Asthma diagnosis is based on medical and family history, physical examination, and lung function test. For the lung function test, one of the most common tests is of course spirometry. In case of asthma, the patient should undergo basic spirometry tests to find the FEV1 and FVC measurements. When the FEV1/FVC ratio is less than 0.7, the patient should continue with the checkup phase and perform a bronchodilator challenge test by inhaling an asthma drug (bronchodilator such as albuterol) to open air passages. After that, the patient repeats the spirometry test, and the FEV1 and FVC measurements are recorded again. Finally, if there is more than a 12% increase in FEV1 or a 200 mL increase in FVC, the patient is diagnosed as having asthma. Asthma severity will be assessed depending on symptoms and FEV1% predicted.
Some research has been carried out to explore the use of mobile platforms as a vehicle for cost effective monitoring techniques. In [9], the authors discuss an intelligent portable system that assists COPD patients in managing their disease. In [10], a mobile-COPD system to assist clinicians to remotely monitor and manage COPD conditions and events is presented. Using this system, patients use mobile phones to update self-assessment and observation data relating to COPD symptoms and vital signs, such as sputum, wheezing, cough, heart rate, body temperature, etc., with the collected data being stored in a remote server. Clinicians can access a patient’s data remotely and review the patient’s information on a daily basis to assess the disease progression. Based on the clinical assessments, exacerbation of COPD can be detected at early stages. Researchers in [11] experimented by using an external microphone attached to a laptop or mobile to record breathing waveforms of the subjects. They next computed the average time duration and energy of the breathing cycle after splitting the captured breathing signal using “voice activity detection” techniques. Models to estimate FVC or lung capacity were developed with an accuracy of up to 86.24%. The authors in [12] describe a system that includes health sensors and/or an external portable spirometer communicating with a smartphone to diagnose and manage COPD. The goal of the system is to predict and detect exacerbation of COPD in order to help patients self-manage their disease to prevent hospitalization. The system consists of a mobile device that is able to collect case specific, subjective and objective, physiological, micro-spirometer, and pulse-oximeter data to alert the patient by a patient-specific interpretation of the data using probabilistic reasoning and Bayesian networks. Collected data is also sent to a central server for inspection by health-care professionals. Ref. [13] designed a wireless portable monitoring system for respiratory diseases. The proposed system consists of an oximeter sensor node and respiration-posture sensor node. Both sensor nodes are integrated with Bluetooth transmitters and a PC or cell phone that connects with the Internet. The system measures the user’s respiratory airflow, blood oxygen saturation, and body posture, allowing it to serve as both a sleep recorder and spirometer, which could be applied for remote monitoring and diagnosis of Obstructive Sleep Apnea (OSA), COPD, and asthma. Ref. [14] designed and developed a system called CHRONIOUS that offers an integrated platform that provides management and real-time assessment of the health status of the patient suffering from COPD. This is followed by a severity estimation algorithm that classifies the identified pathological situation into different levels and triggers an alerting mechanism to provide an informative and instructive message/advice to the patient and the clinical supervisor. The two primary functional blocks of the CHRONIOUS system consist of the wearable platform and the smartphone SD card, while the two secondary blocks consist of the home patient monitor (HPM) and the external devices (which contain a spirometer). Ref. [15] developed the DexterNet system, which is a wireless body sensor network (WSBN) for the prevention and management of children’s asthma. The architecture of the system consists of three layers. The first layer is the body sensor layer (BSL), which is responsible for monitoring a child’s activities, geographic location, and air pollution exposure. The second layer is the personal network layer (PNL), which is a wireless mobile device worn by the child that summarizes the sensed data and provides information feedback. Finally, the global network layer (GNL) uses a web server to provide information services that support the healthcare management of asthma cases, prevention of asthma attacks, participatory sensing, and the collection of anonymous sensor data for research into the risk factors associated with asthma. Ref. [16] designed an inexpensive external mobile device accessory (Peak Flow Meter) that records and stores the user’s PEF and graphs this data over time. Stored data could be forwarded by email to physicians to monitor the patient’s PEF. Ref. [17] developed a personal lung function monitoring device for asthma patients, which is a portable external mobile device accessory that collects spirometry, peak expiratory flow, exhaled nitric oxide, carbon monoxide, and oxygen concentration information from patients. Results are then shared with physicians remotely. Ref. [18] proposed a system framework for modeling and analyzing individual exposure to environmental triggers of asthma attacks. The system is able to retrieve an individual patient’s location data (GPS data) and environmental data (air pollution, tobacco smoke, temperature, and humidity) through sensor equipped mobile devices. By using statistical methods and efficient data analysis algorithms, the system can retrieve intelligence information from relations between asthma and various environmental conditions. Ref. [19] designed a human health monitoring mobile phone application by using a wireless nanosensor-based embedded system. In the proposed system, a nanosensor was placed in the mobile phone, and a smartphone application displays the body condition and alerts the patient to the causes of any problems and how to overcome them without the need for physician guidance. Ref. [20] developed an algorithm that continuously monitors important spirometric values such as FEV1, FVC, and PEF, so that any deviation from the safe limits will allow the system to simultaneously send a warning message to the physician’s mobile and numerical and graphical respiratory information of the subject to the web-server. The study was limited to chronic COPD and chronic restrictive pulmonary disease (CRPD). Ref. [21] used the microphone of the smartphone to record patient’s exhalations for further analysis on the smartphone and to measure lung parameters. Signal processing of the recorded signal is carried out on the cloud, and the calculated values of FVC, FEV1, and PEF lung measurements are reported to the user via a mobile application. When compared to the corresponding clinical spirometry results, the system returned a mean error of 5.1%. Another mobile application called mCOPD that uses the mobile microphone to record exhalations is discussed in [22]. Unlike the system presented in [21], here the processing is performed on the mobile itself, and the calculated values of FVC, FEV1, and PEF lung measurement are instantly reported to the user via the application. An evaluation of mCOPD in both a controlled and non-controlled experimental setup with the help of 40 subjects yielded an average FEV1/FVC deviation of 3.9% when compared to readings obtained using clinical spirometry. Stein, in [23], designed a smartphone application to be used for patients with COPD. It uses the built-in microphone and sound analysis algorithms to test lung functions and reports FEV1 and FEF 25–75% lung measurements. The application is designed to work with the distance between mouth and arm set manually to 30 cm. In [24], a platform based on mobile smart phones is discussed. It consists of an electronic stethoscope, a peak flow meter application, and a patient questionnaire. The collected data is combined with a machine learning algorithm to identify patients with asthma and COPD. All physiological data used in the study was collected using the mobile phone. Researchers in [25] investigated asthma management and ways to increase the use of Personalized Asthma Action Plans as an asthma intervention. The premise was that Asthma action plans are more likely to be used when accessible via a smartphone application due to societies increased convenience and reliance on mobile devices. With the belief that Self-management is a major factor in the treatment of asthma, in [26], a system consisting of a mobile application prototyped. The proposed system has proven to be valuable in assisting patients and their caregivers in determining the asthma control level and in promoting a closer communication between health professionals and patients.
In [27], voice and speech recordings using mobile phones are used to differentiate groups in terms of pulmonary health. The feasibility of using speech features to detect pulmonary disease is assessed. Ill and healthy subjects were differentiable with 68% accuracy; moreover, the subset of patients with the highest disease severity were detected with 89% accuracy. The use of mHealth to improve COPD care in the community is discussed in [28]. In the study, participants used an mHealth application at home to monitor COPD symptoms, review educational videos, modify the risk factors of cigarette smoking, monitor their physical activity, and learn to use inhalers optimally, as well as learn how to use an electronic action plan. In [29], a study concluded that mobile health and inhaler-based devices have great potential to revolutionize care for asthma by becoming mainstream tools to assist patients in self-monitoring and decision-making, especially patients with persistent asthma and those who have difficulty keeping symptoms under control. Ref. [30] examined the effect of a six-month, smartphone app-based self-management program for people with COPD. Participants in the experimental group received a smartphone app-based self-management program, which included exercises, education, self-monitoring of symptoms, and social support. The hypothesis is that such a program can effect behavioral change in people with COPD. The program assists patients with COPD who have frequent exacerbations, limited access to health care providers, and no opportunities for pulmonary rehabilitation.
In this work, comprehensive testing is conducted on diagnosed COPD patients, diagnosed asthma patients, smokers, and healthy individuals. The primary objective is to develop a reliable portable system to diagnose and manage the respiratory diseases COPD and asthma [31].

3. Methodology

The major tasks carried out in this research include:
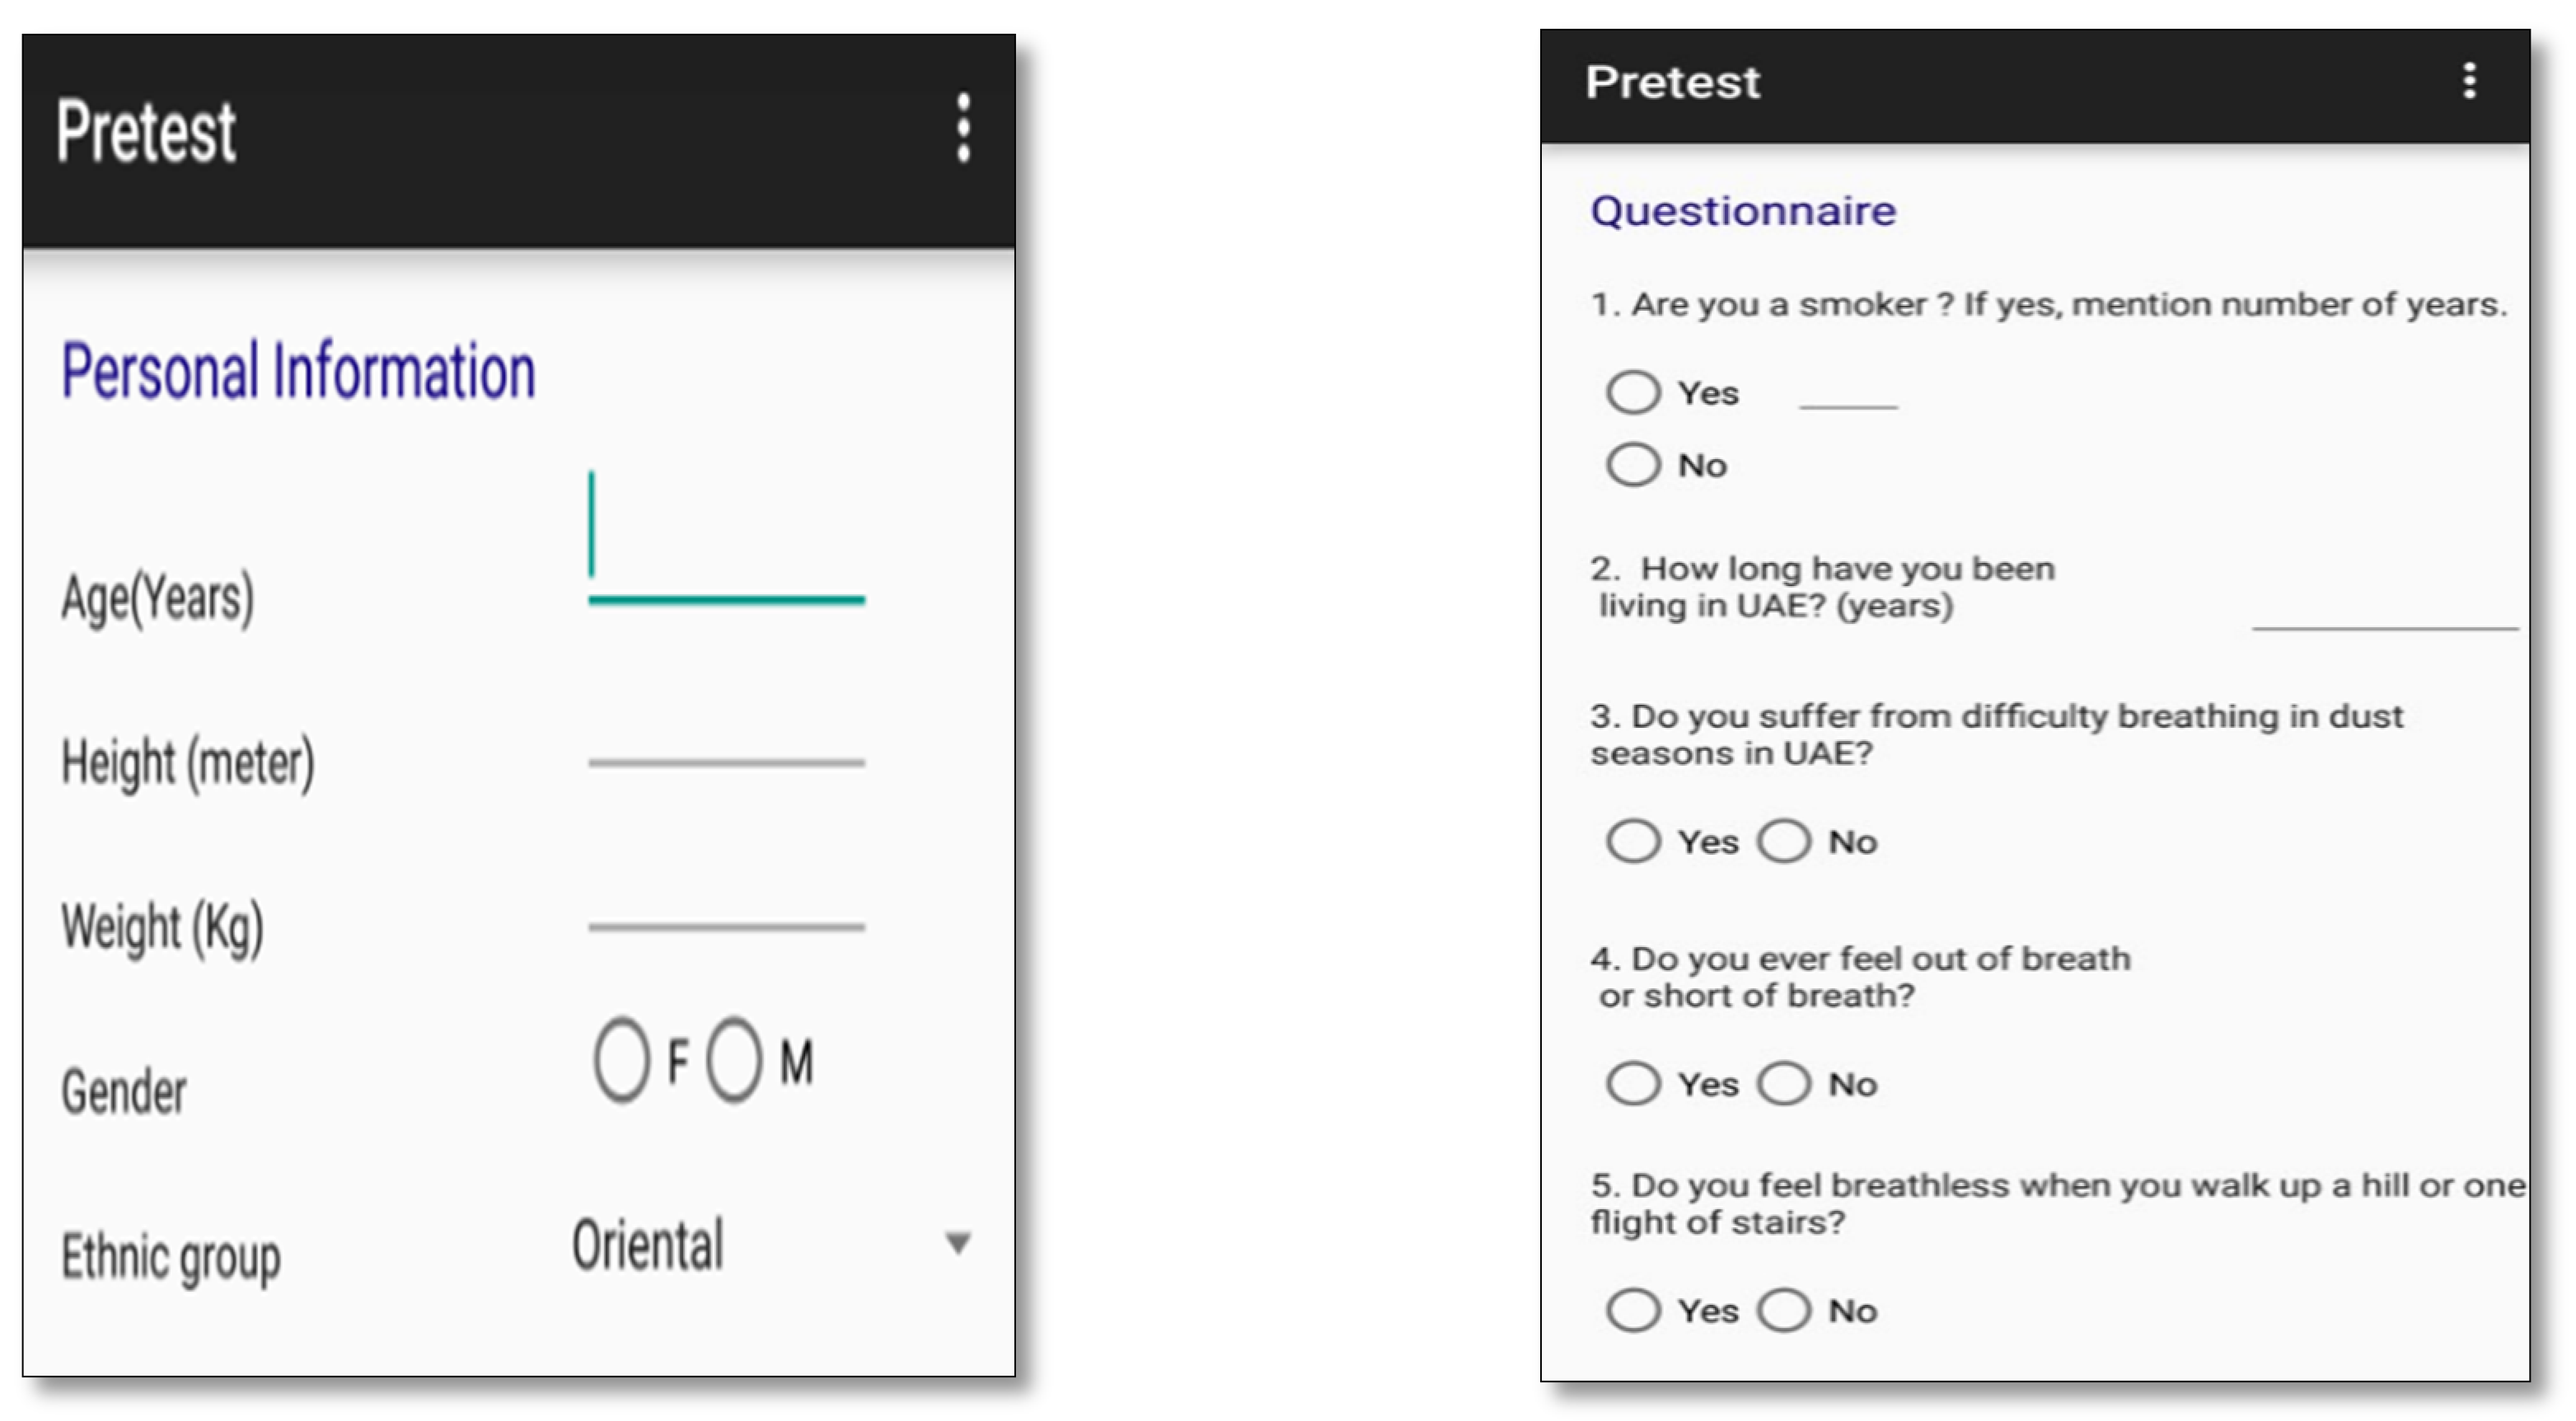
  • Developing a “Pretest Activity” tool to be used as a first indicator about the presence of respiratory disease;
  • Establishing and using appropriate techniques to extract the required physiological signals (exhalation and oxygen saturation);
  • Developing an algorithm to analyze the collected physiological signals (analyze recorded patient exhalations);
  • Developing a model that relates the frequency response of the exhalation recorded by the microphone to the actual flow rate of the exhalation;
  • Implementing an Android application that makes use of the developed model to assist in diagnosing whether a patient suffers from COPD or asthma and analyzing the severity of the disease if present;
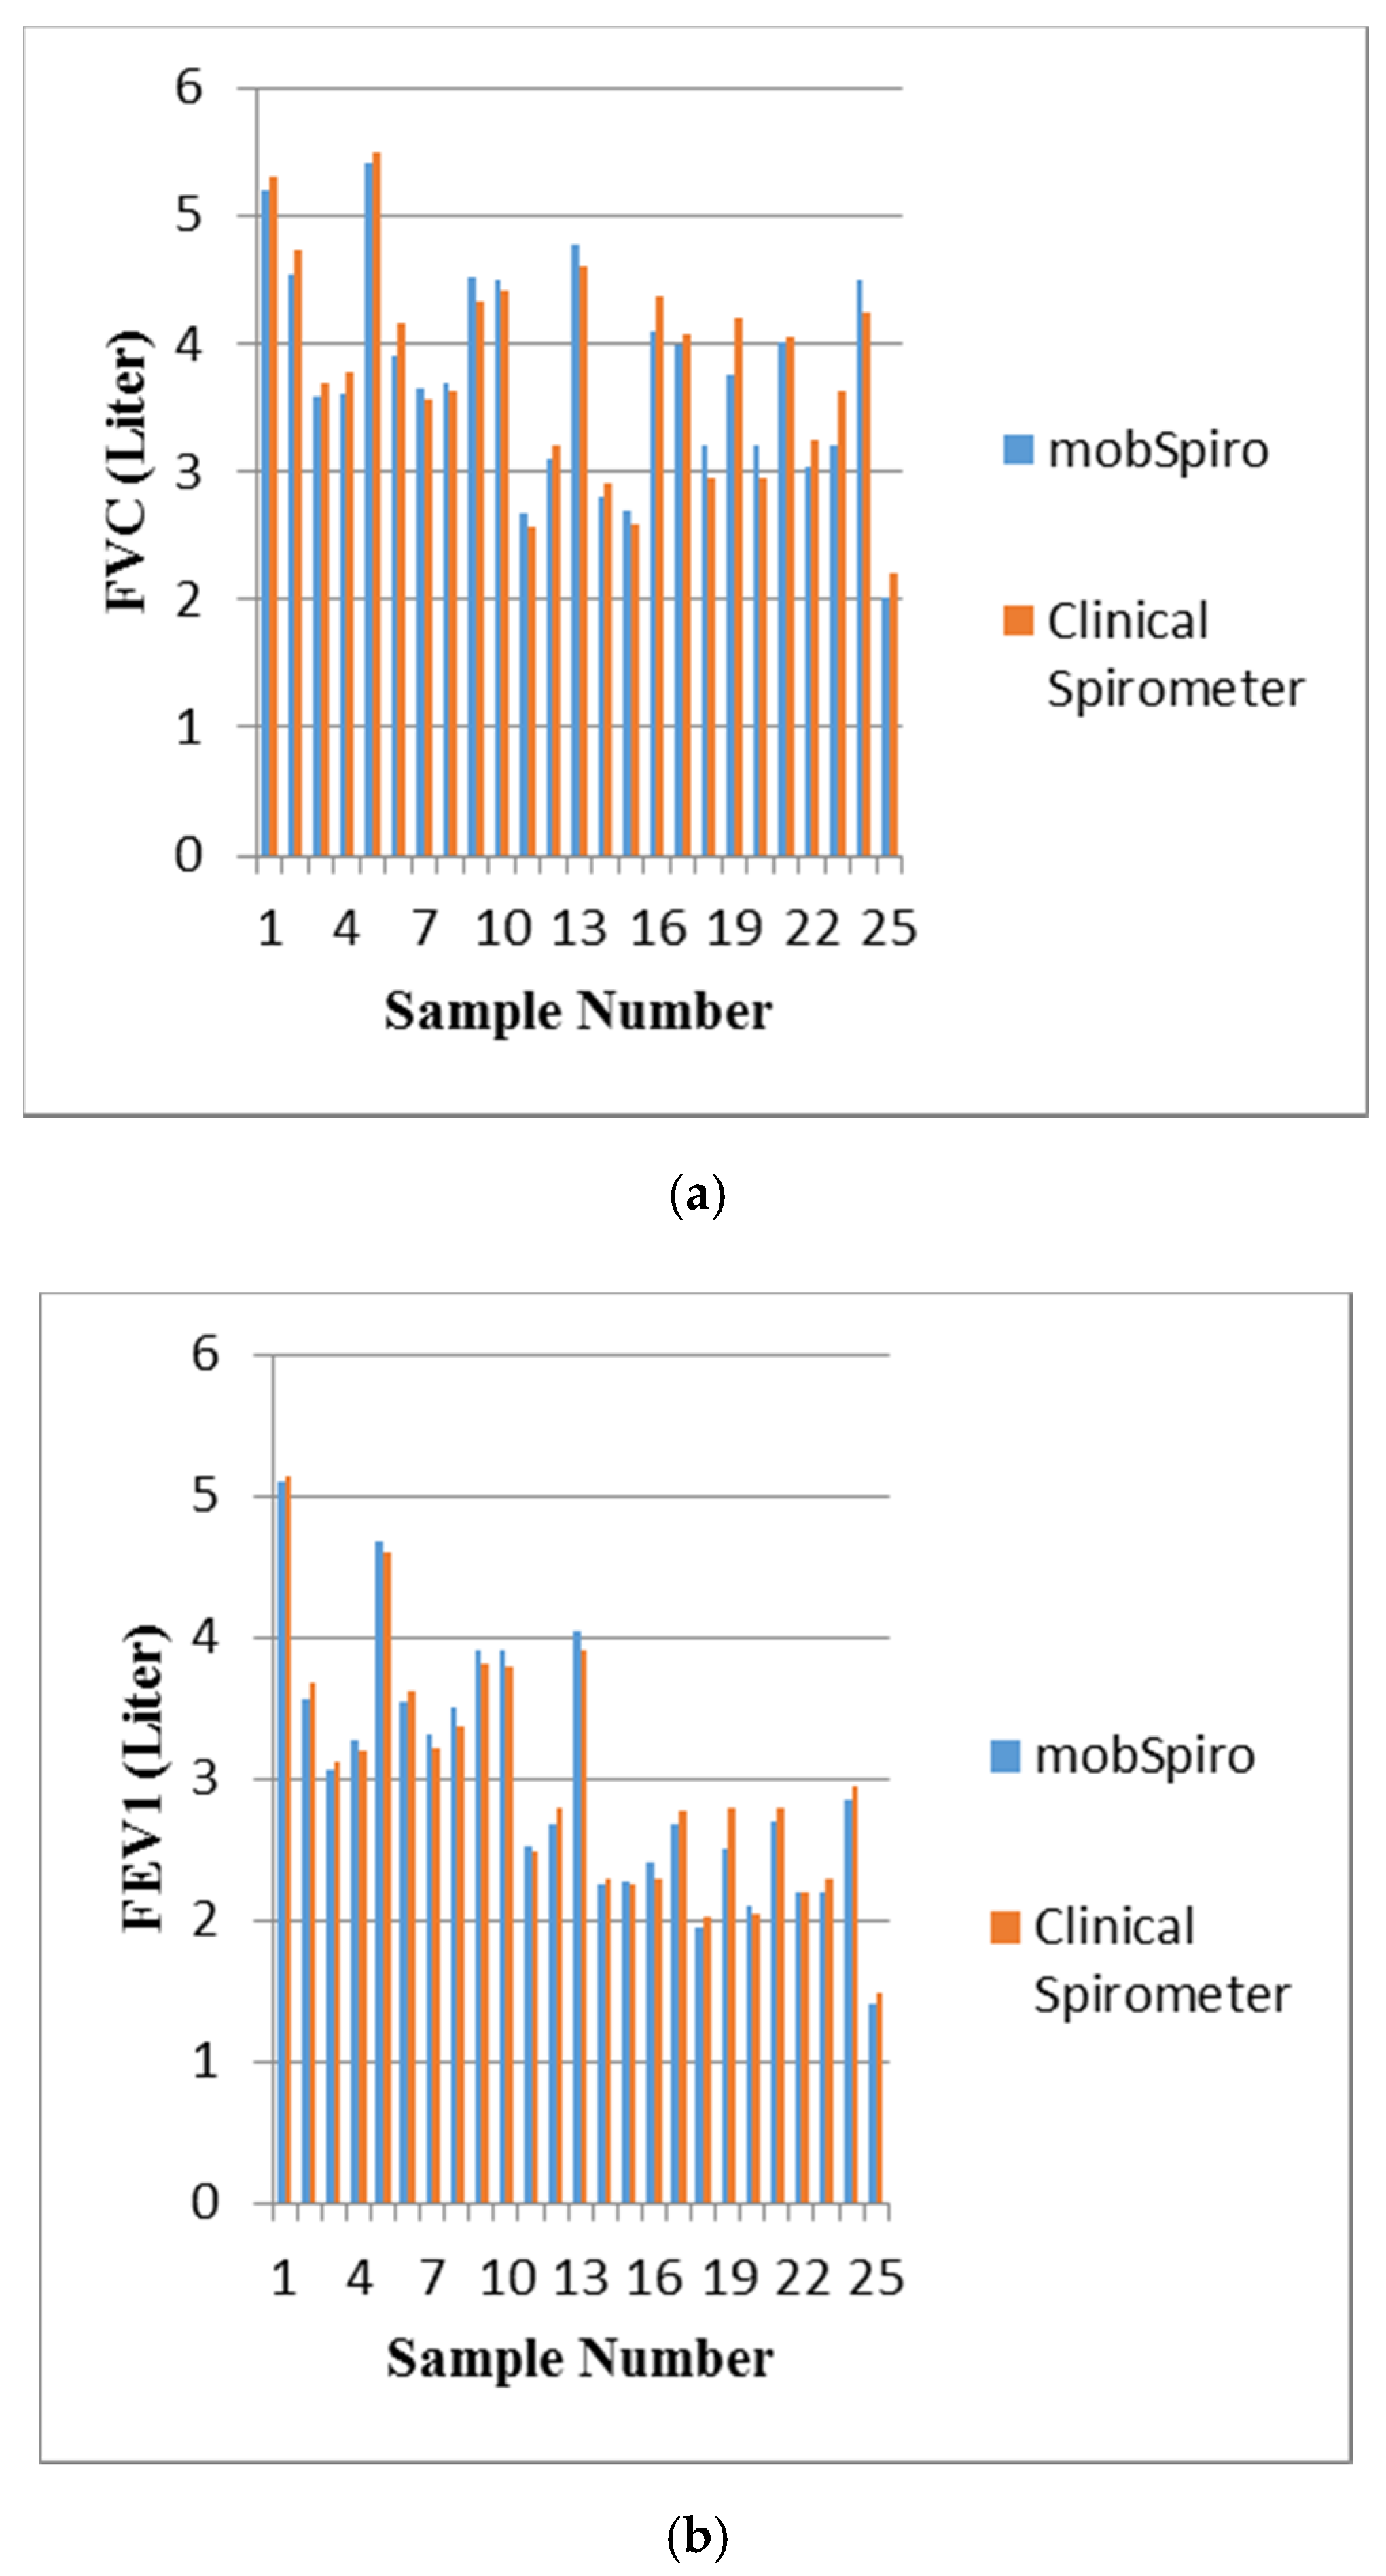
  • Assessing the reliability of the mobile application by using it to examine 25 human subjects and then comparing the results with those obtained using a spirometer.
The pretest assessment tool is a survey that can be used in conjunction with physical analysis to reach a reliable conclusion as to whether the patients have COPD or asthma. It assists in avoiding false-negatives and false-positives and helps in distinguishing asthma from COPD. The diagnosis, classification, and management of COPD and asthma require extracting lung measurements and measuring blood oxygen levels using a pulse oximeter. Lung measurements are then extracted from the analysis of the patient’s exhalation.
The developed system uses the smartphone microphone to record patient’s exhalations and stores them on a mobile SD card for further analysis. The smartphone’s built-in proximity sensors are used to adjust the distance between smartphone and patient’s mouth. The smartphone used in this work is the Samsung Galaxy S5, and the threshold of its built-in proximity sensors used in recordings is 5 cm. As per the advice of a trained Pulmonologist, a distance of 5 cm is physically suitable for sensing clear and direct exhalation, and the testing has confirmed this. A pulse oximeter is used to measure the oxygen level (SpO2) of the subject before performing the spirometry test. In general, a SpO2 of 92% or less (at sea level) suggests hypoxemia [6].
After measuring SpO2, the patient’s exhalations are recorded three times, as recommended by the GOLD pocket guide [7], and stored as wave files on the smartphone SD card. The possible range of breathing frequencies lies approximately between 100 Hz and 1200 Hz [32,33]. Signal processing is performed to extract this range of frequencies, analyze the signal, and calculate FVC and FEV1 lung measurements. Figure 1 shows the steps required to analyze the recorded exhalations and compute the FEV1 and FEVC. The resulting FEV1/FVC ratio and FEV1% are used in the diagnosis and classification stages.
The Pretest Activity results are used together with the computed FEV1/FVC ratio and FEV1% value to reach a diagnosis as follows:
  • FEV1/FVC > 0.7 and FEV1% predicted >80% with pretest possibility:
    • Patient at risk and may have asthma. Patient should thus repeat the test after exercising or during a period of breathing difficulty in order to confirm the diagnosis.
  • FEV1/VFC < 0.7 with pretest possibility:
    • Patient has respiratory disease:
      • If higher pretest possibility of asthma, then diagnose patient with asthma.
      • If higher pretest possibility of COPD, then diagnose patient with COPD.
  • SpO2 of 92% or less with FEV1/FVC < 0.7:
    • Patient will be notified of impaired respiratory function and possible need of oxygen supplementation.
Figure 2 is a flow chart illustrating the diagnosis flow of COPD and asthma.
The respiratory diseases COPD and asthma are classified into different categories according to their severity. For a diagnosed COPD, according to the GOLD pocket guide [7] there are four main categories depending on the value of FEV1% predicted: mild, moderate, severe, and very severe. The classification criterion is given in Table 1.
For a diagnosed asthma disease, the classification is based on FEV1% predicted, frequency of nighttime awakenings due to the symptoms of disease, and interference of symptoms with normal activities [34]. Asthma has four different categories: intermittent, mild persistent, moderate persistent, and severe persistent. The disease is categorized as shown in Table 2.
For example, in Table 2, if the patient performed the spirometry test and had an FEV1/FVC ratio of less than 70% and FEV1% predicted in the range of 60–80%, and if the patient suffers from minor limitation of normal activities and daily nighttime awakenings due to the disease symptoms, then severity is considered to be moderate persistent.

4. Experimental Work

This section describes the experimental set up used in this work and the basis for it. It is shown in [8,10] that the MEMS microphone in today’s mobiles can sense the direct airflow of human exhalation, and therefore allows for the recording of it as an indicative signal. In order to calculate the lung parameters FEV1 and FVC, the volumetric flow rates of the exhalation are needed. Practically, the air flow from the recorded exhalation signal cannot be directly extracted. However, the time and frequency responses of the audio signal can be extracted using mathematical processing techniques, and subsequently a model can be developed that relates characteristics of the recorded human exhalation by the mobile microphone and the actual flow rate.
The setup consists of a source of airflow, a device to measure the actual flow rate, and a mobile to record the airflow. For the source of airflow, the Dyson AM06 fan [35] is used. This is a bladeless fan that is 30 cm in height with 10 different levels of speed and is considered to be a speed-stable airflow. The Dyson AM06 uses air multiplier technology to create a powerful stream of uninterrupted airflow and is 75% quieter than its predecessors. To measure the flow rate, the AM -4201 [36] anemometer is used, which is capable of measuring flow rates ranging from 0.4 to 30.0 m/s with a resolution of 0.1 m/s. Finally, the mobile used is a Galaxy S5 Android-based smartphone manufactured by Samsung Electronics (Suwon-si, Korea). Figure 3 shows a side view of the experimental setup. The lower part of the Dyson AM06 fan is isolated in an effort to minimize possible noise at higher fan speeds. The Galaxy S5 mobile is placed on the side next to the anemometer, about 15 cm away from the Dyson AM06 fan.
In the Galaxy S5 mobile, the microphone is the small hole toward the bottom of the handset. It uses directional voice recording. In interview mode, sounds are recorded only from the frontal direction of the phone. The conversation mode in the Galaxy S5 is not suitable because it records voices from both in front of and behind the device. In this work, the subjects, while sitting down on a chair in the upright position and with the guidance of the mobile phone proximity sensor, held the mobile about 5 cm from their mouth and recorded the needed signals.
Using the setup described above, 34 wave files were recorded at different fan levels and at different times during the morning, noon, afternoon, and evening in order to increase the accuracy of the experiment. The actual flow rate is simultaneously recorded as well by using an anemometer. The 34 wave files with their corresponding flow rate values are stored in a database. Using Matlab, the recorded waveforms are analyzed in an effort to derive a relationship between flow rate (m/s) and signal characteristics in the time-domain, frequency-domain, or both, as summarized below.

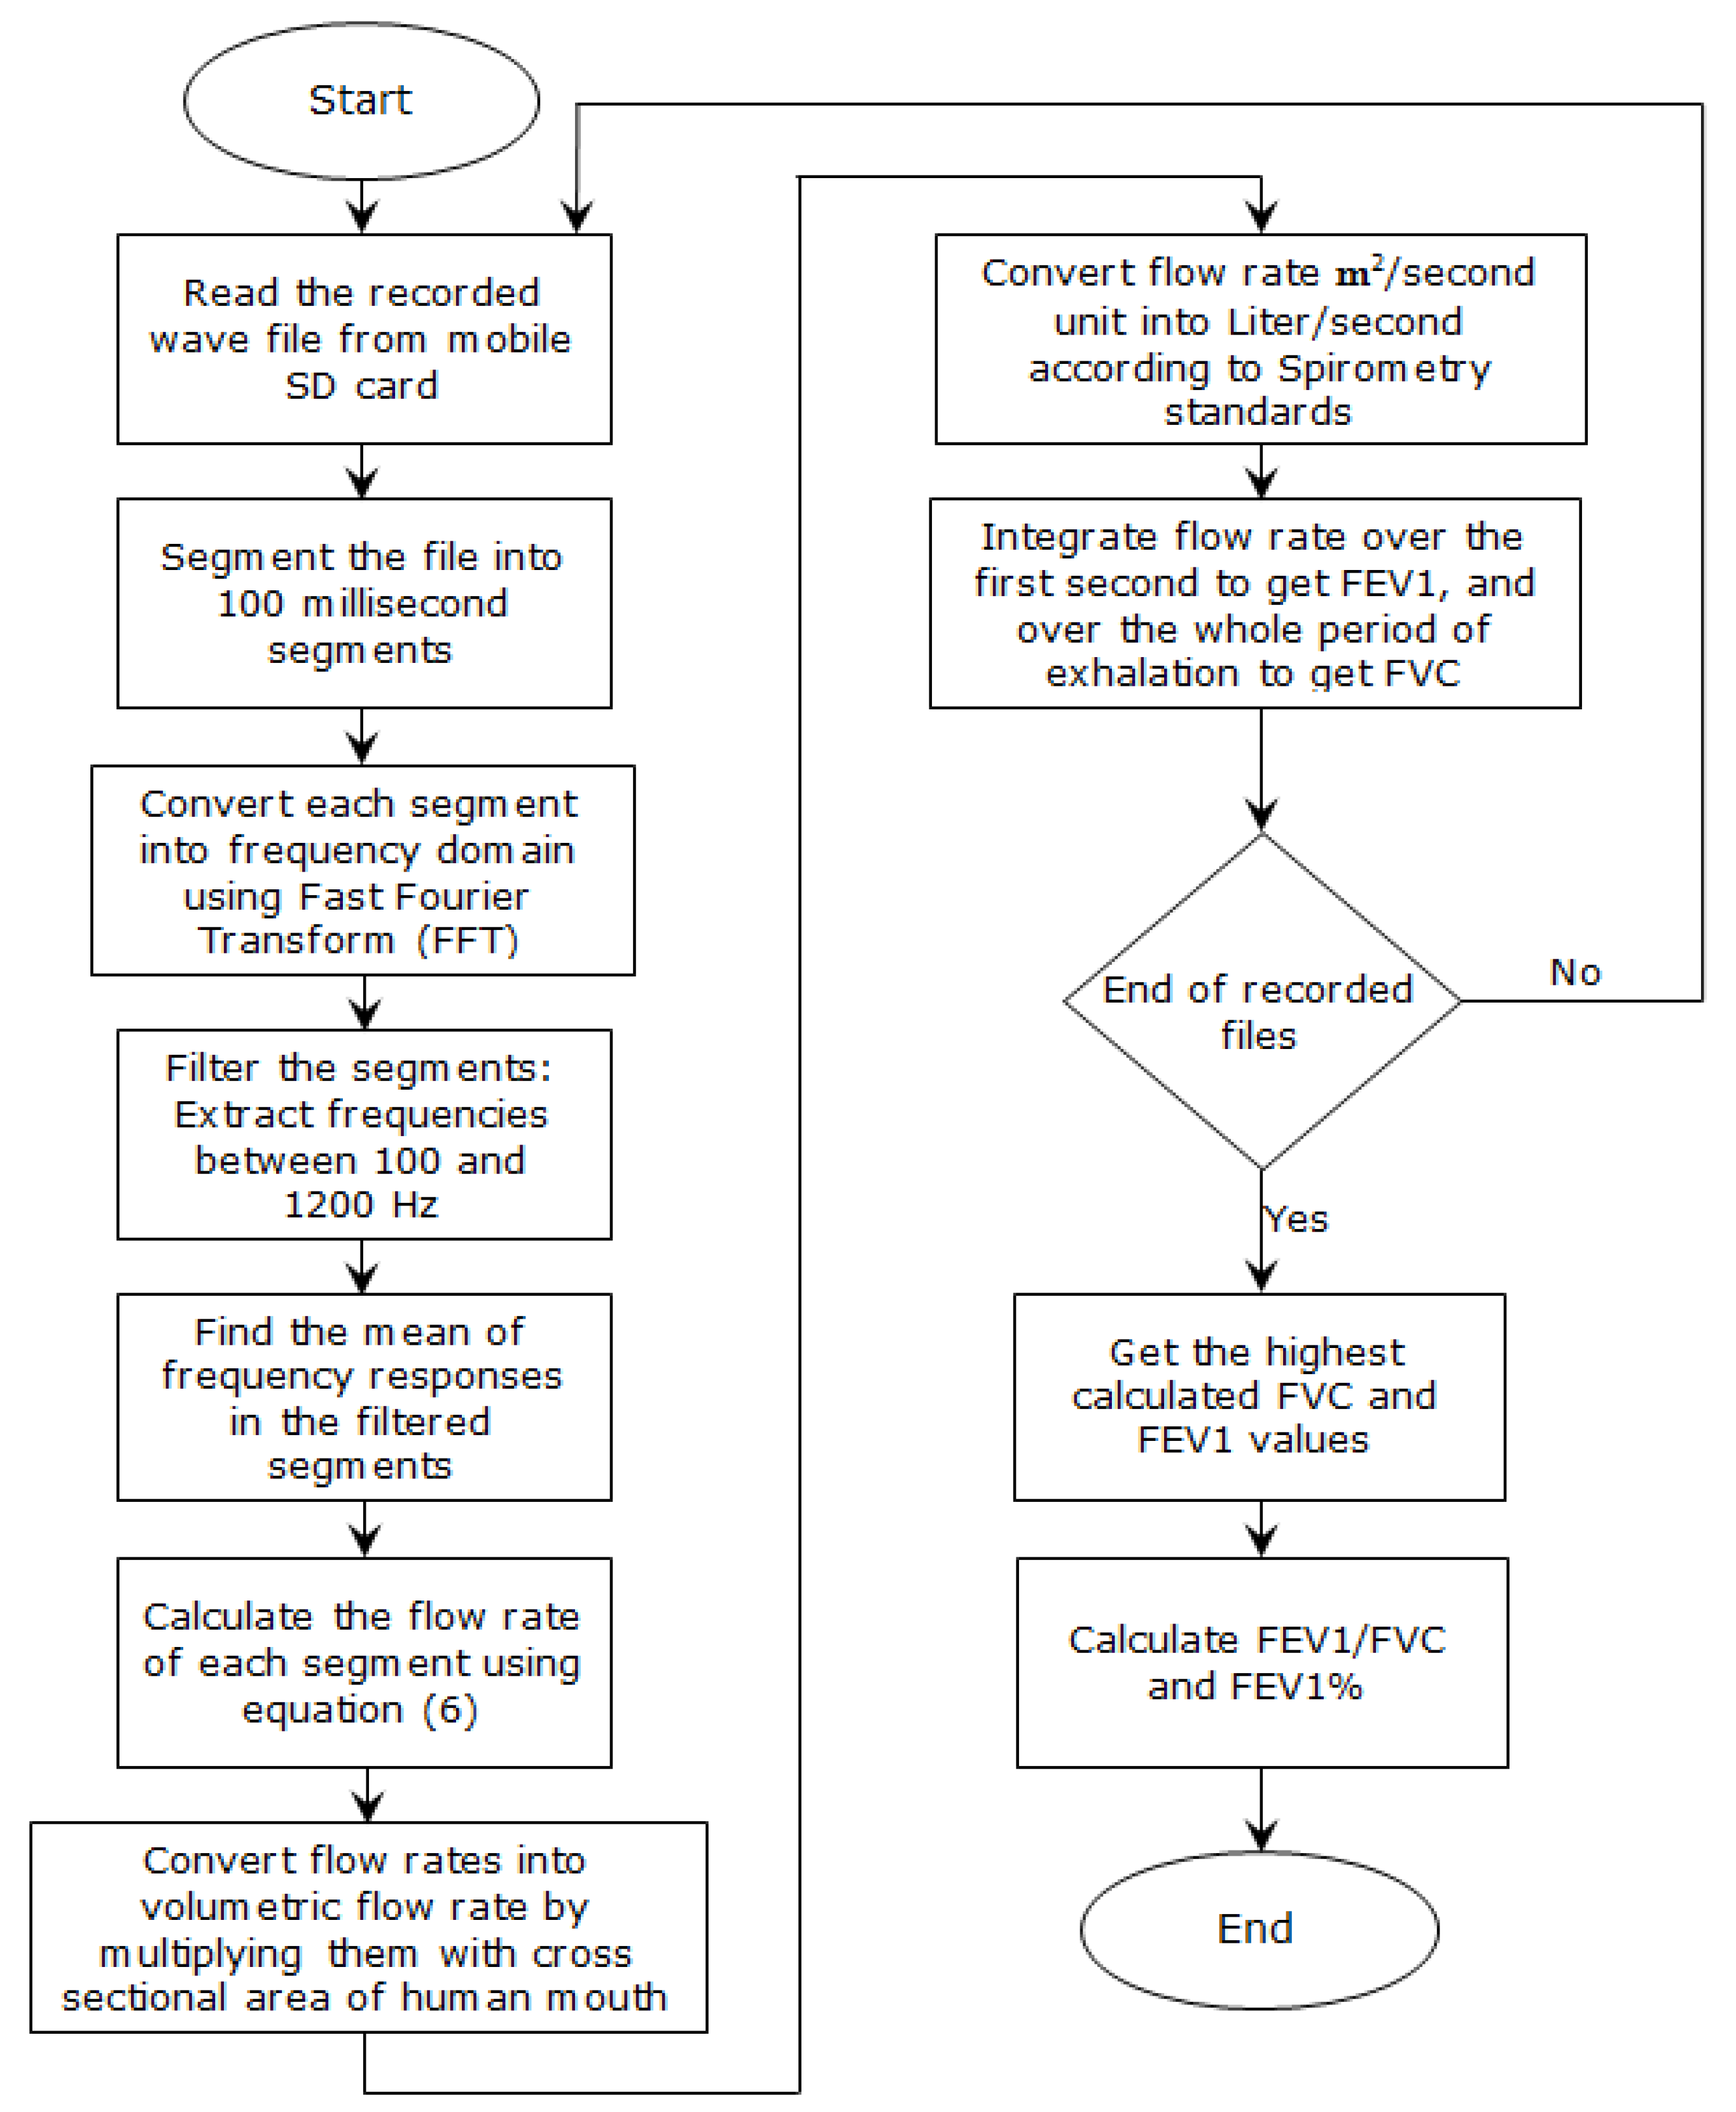
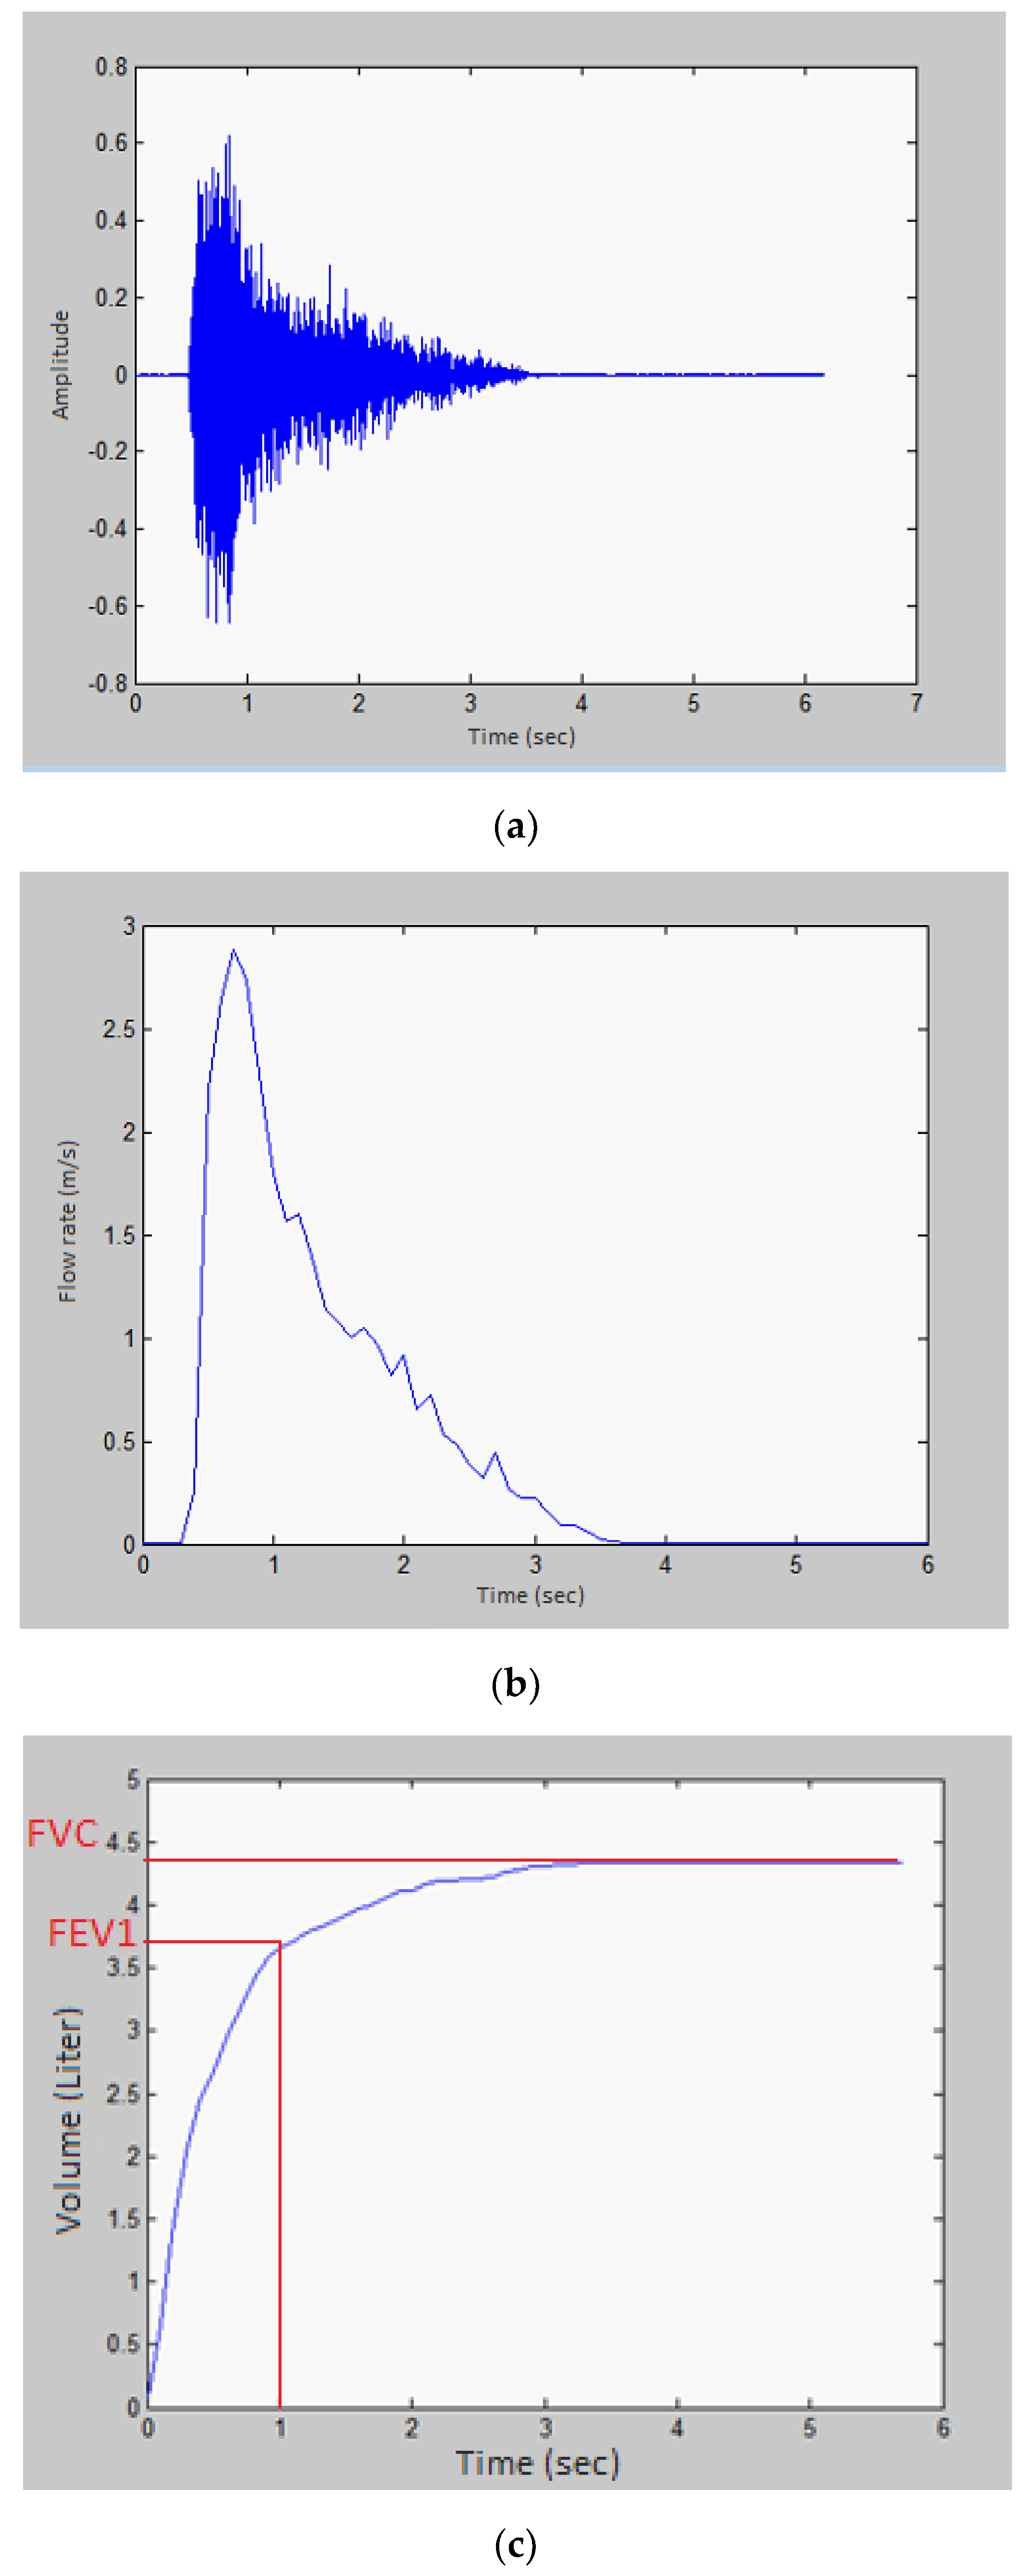
4.1. Time-Domain Analysis

To determine a relationship between signal characteristics and flow rate in the time domain, two factors are considered: root mean square (RMS) and peak value attained by the signal. For each wave file, the signal acquired is 6 s in duration, though the first 2 s are excised in order to eliminate the noise at the beginning of recording. The sampling frequency used to acquire the signal is 10 kHz. Thus, the time domain analysis is performed using 40,000 samples of the audio signal acquired with a sampling period of 0.1 ms. A Butterworth filter is then applied in order to extract frequencies between 100 Hz and 1.2 kHz [37]. Finally, the RMS and maximum value attained by the recorded signal in each file are calculated. The correlation factor between RMS values and the flow rates was 0.8803, and correlation factor between the peak values and the flow rates was 0.5938. By comparing the two correlation factors, it is clear that the RMS achieves a stronger correlation. Therefore, the RMS value is chosen to establish a relation with the flow rate in the time domain.

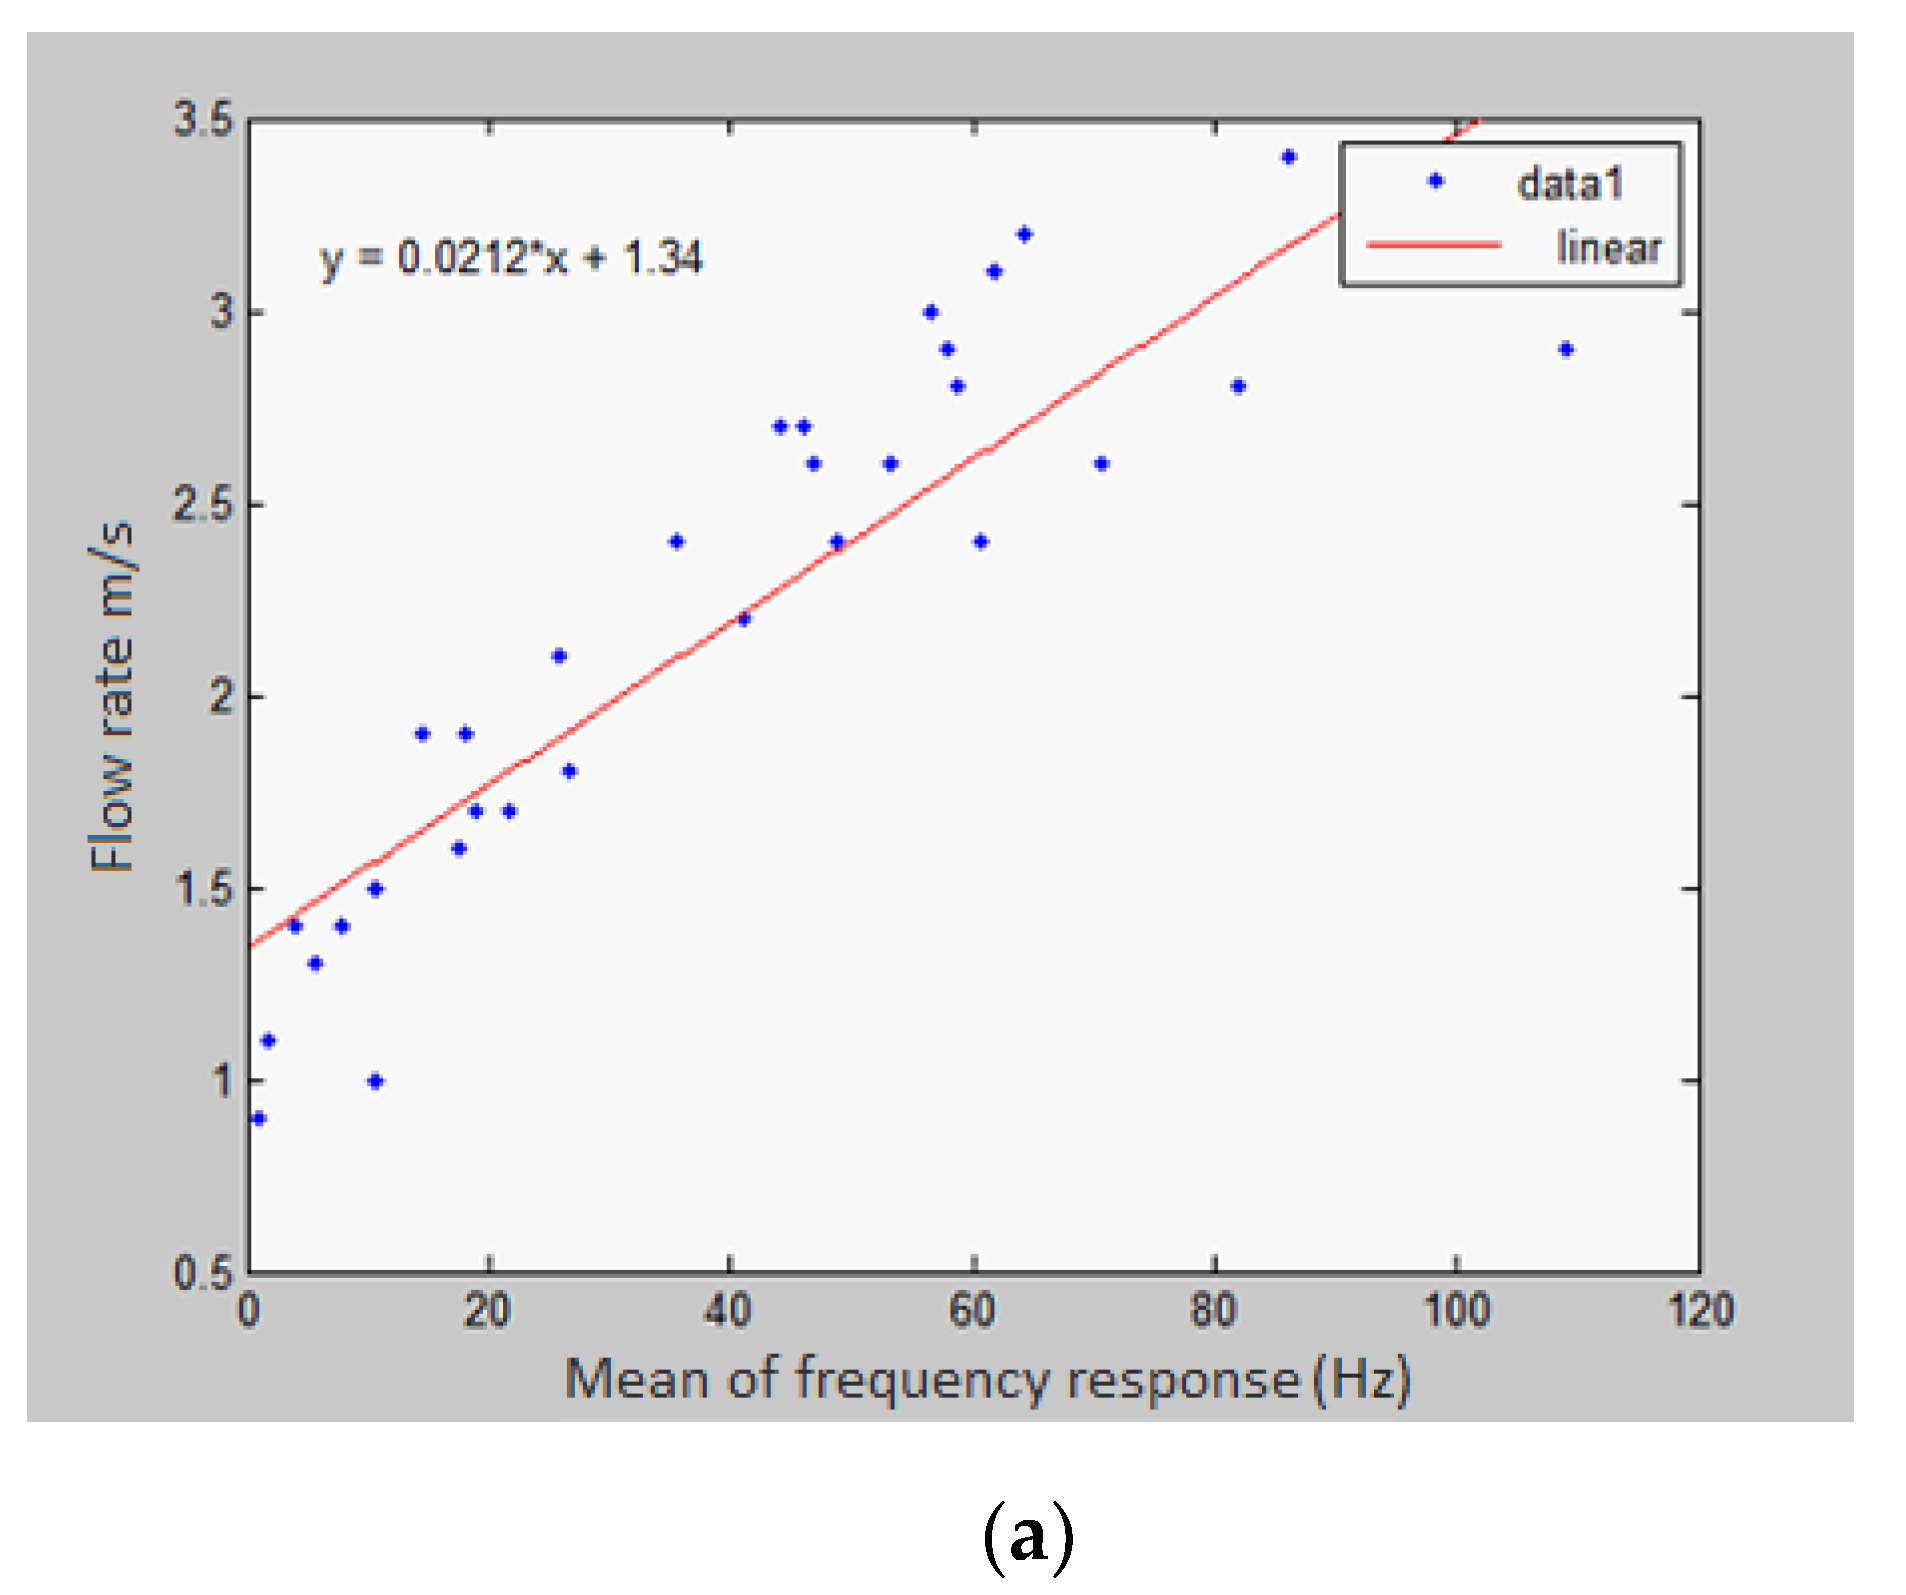
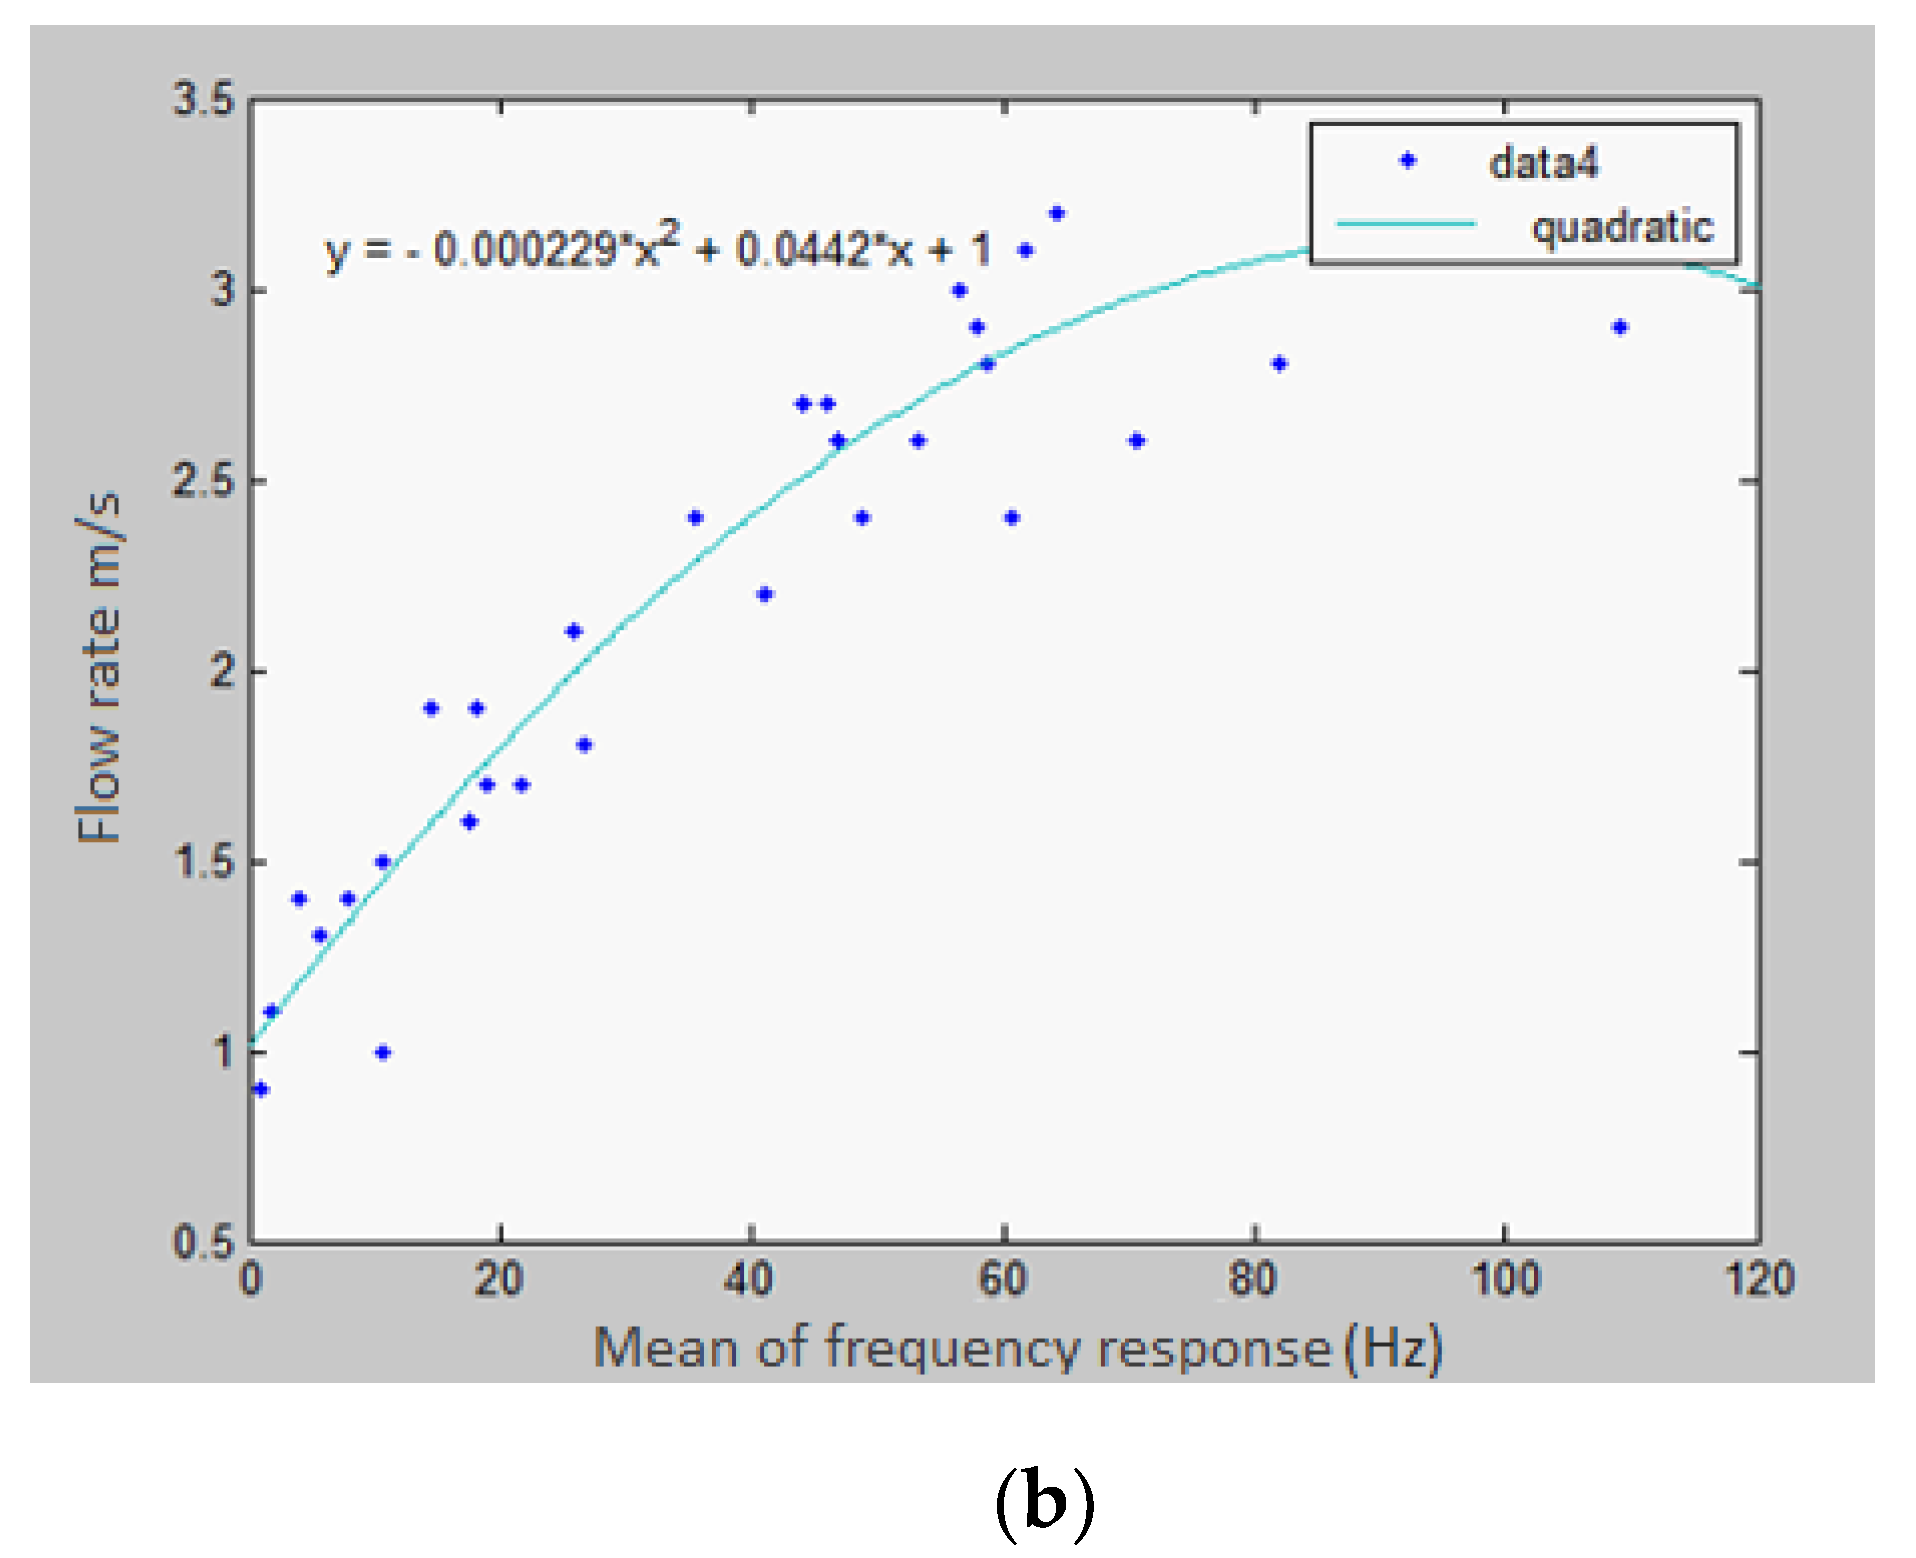
4.2. Frequency-Domain Analysis

For all wave files in the database, the first 2 s were truncated in order to eliminate any noise at the beginning of recording. Signals were next transformed from the time domain into the frequency domain using fast Fourier transform (FFT). Research indicates that human speech, lung sounds, and exhalations lie in a low frequency range below 3 kHz [38,39,40]. A filter bank is applied to the transformed signal in order to extract frequencies in the following ranges: 100–300 Hz, 300–600 Hz, 600–1200 Hz, 100–1200 Hz, 300–1200 Hz, 1–2 kHz, 1–1.5 kHz, 1.5–2 kHz, 2–3 kHz, 100 Hz–2 kHz, 100 Hz–2.5 kHz, and 100 Hz–3 kHz. Next, the mean of the frequency responses of each frequency range was calculated. For a given frequency response H(f), the mean frequency response over the frequency range [B1, B2] is computed as in Equation (1) below:
μ H = 1 B 2 B 1 | B 1 B 2 H ( f ) d f |
The sampling frequency used to acquire the signal is 10 kHz; the frequency domain analysis is performed using 40,000 samples of the audio signal acquired with a sampling period of 0.1 ms. Note that this leads to an effective frequency resolution of approximately 0.25 Hz.
Finally, the correlation factors were computed between the mean of the frequency response of each range and the actual flow rate values. The highest correlation factors (approximately 0.9) were obtained for the range of 100 Hz–3 kHz and 100 Hz–1.2 kHz. Because lung sounds are mainly below 1.2 kHz [40,41], the 100 Hz–1.2 kHz band was chosen.
By comparing the correlation factors obtained in the time domain and the frequency domain, the relationship between the frequency domain factor (which is the mean of frequency responses between 100 Hz–1.2 kHz) and the flow rate is stronger than the relation between the RMS time domain factor and the flow rate. Moreover, frequency domain analysis is preferred over time domain analysis for MEMS microphones because time domain analysis may suffer from saturation problems, whereas in the frequency domain, saturation causes spurious high frequencies that will not have a noticeable effect on the lower frequencies of interest. Therefore, the relation between the mean of frequency responses in the range 100 Hz–1.2 kHz and the flow rate was selected as the basis for deriving the relationship between the frequency responses of patient’s exhalation and the actual flow rate.
Regression analysis techniques are used to derive a relationship that relates flow rate to the mean of frequency responses between 100 Hz and 1.2 kHz. The goodness of each fitting curve is evaluated using the root-mean-square-error (RMSE) between the predicted and actual flowrate.
Different fitting techniques are investigated; however, it was found that quadratic regression provides a good model for the relationship between the flow rate and mean frequency response. The RMSE of the best quadratic regression obtained here is 0.2108. Figure 4 shows the quadratic regression relationship of the model. The model derived is described by Equation (2), below:
Y   =   0.000229   × x 2   +   0.0442   × x + 1.002
where Y is the flow rate in m/s, and x is the mean of frequency responses between 100 Hz and 1.2 kHz.
In Figure 4, the apparent decrease in the flow rate is likely due to a local fluctuation when fitting the empirical data. The observed decrease is quite small and is more likely a reflection of the stabilization of the flow rate.

5. The Mobile Application

The mobile application developed for this work is based on the model described by Equation (2) with the algorithms described in Figure 1 and Figure 2 being used as the basis for its major software modules. The mobile application was developed using the Java programming environment embedded within the Android Software Development Kit (Android SDK).
The application consists of four main activities: Pretest Activity, Sensing Activity, Diagnosis Activity, and a Report Activity. Typically, an application consists of several activities interacting with each other. Each activity is an application component with a graphical user interface (GUI) that interacts with the user.
The “Pretest Activity” consists of three parts: the collection of basic personal information, reading SpO2 value, and a questionnaire. The basic personal information includes age, height, weight, gender, and ethnic group. The SpO2 is measured via an external device. The questionnaire is used to assess the possibility of an individual having the disease. The questionnaire includes 13 basic questions about symptoms of respiratory diseases, which were collected from different respiratory diseases agency recommendations. The answers to the questionnaire are compiled and forwarded to the Diagnosis Activity to be used in the analysis and diagnosis phases. Figure 5 shows the interface for the pretest activity.
The Sensing Activity in the application takes care of physiological sample collection. In the Android environment, audio recording of exhalations is achieved using the AudioRecord class, which allows recording from the audio hardware in the mobile. Moreover, the AudioRecord class offers flexibility for programmers in choosing the formats and options of the recording. Additionally, it saves raw data in an uncompressed format, which allows the programmer to process the audio data, write to a file, and display it as a waveform.
The raw data resulting from the recording audio is saved temporarily in a wave file on the smartphone SD card. The exhalation period of an individual usually lasts for several seconds only, so the size of the resulting file is less than 1 MB. In this application, an individual repeats exhalation three times in order to increase the accuracy of the system. Therefore, the maximum required size on the SD card is less than 3 MB. The saved wave files will be read and analyzed in the Diagnosis Activity.
The Diagnosis Activity is responsible for analyzing the readings collected during the Sensing Activity and processing the information collected during the Pretest Activity. The four major tasks carried out are: analysis of Pretest Activity data, assessment of oxygen saturation, analysis of recorded exhalations, and reaching a diagnosis based on the outcomes of the implemented algorithms and model.
The Report Activity is the last screen displayed to the user, in which all the related spirometry results and recommendations are summarized. The report page contains the following:
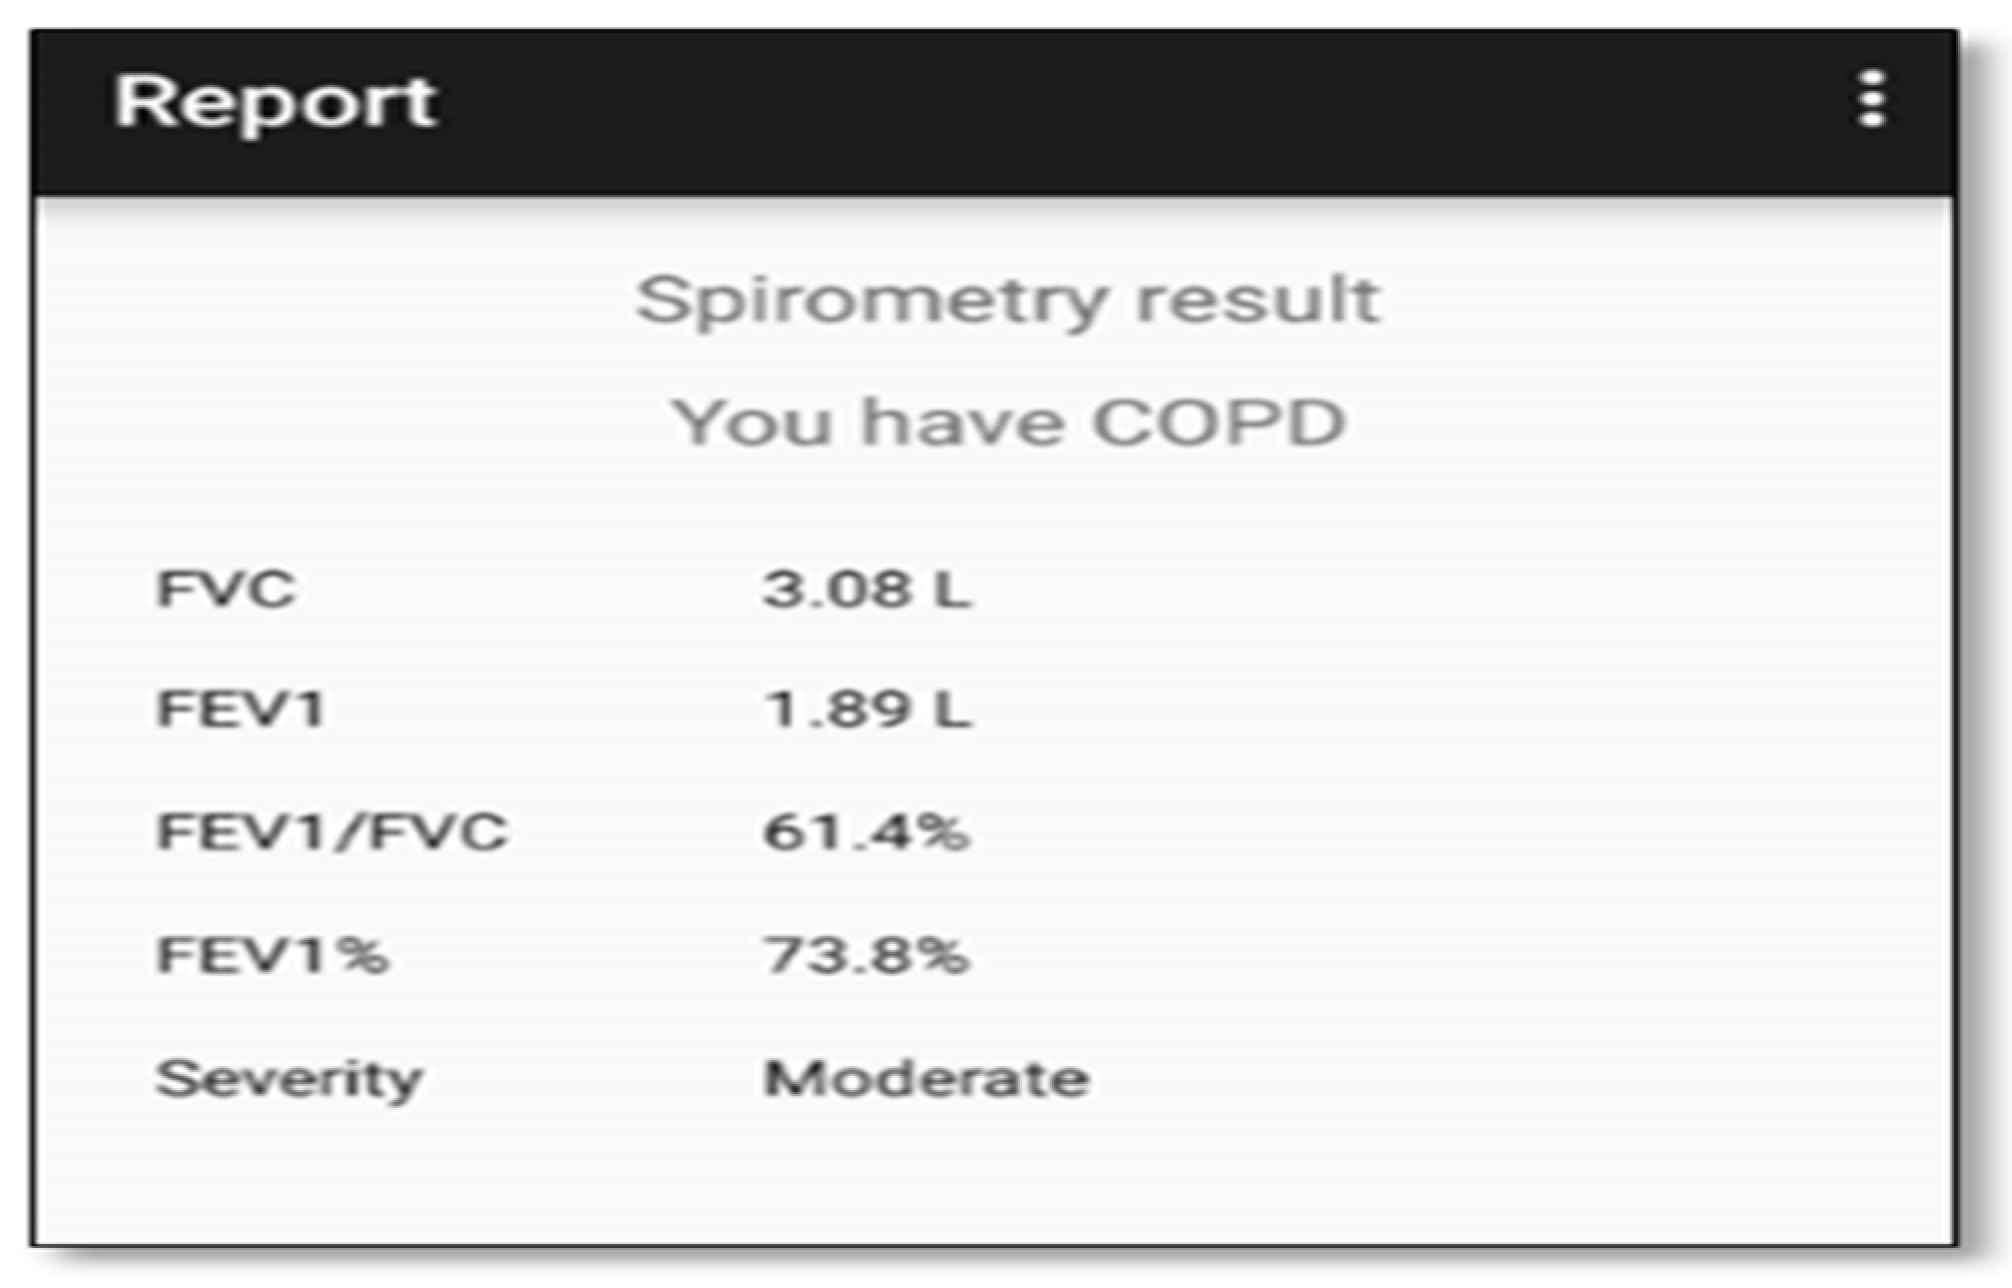
  • Spirometry parameters: FVC, FEV1, and FEV1/ FVC ratio;
  • Diagnosis result: Whether or not the user has COPD or asthma;
  • Disease severity: The level of the disease if the diagnosis is positive. COPD levels are mild, moderate, severe, and very severe, and asthma levels are mild intermittent, mild persistent, moderate persistent, and severe persistent;
  • SpO2 warning: Active in case the user suffers from a poor blood oxygenation.
Figure 6 shows a sample screen of the Report Activity.

Analysis of Human Exhalations

In this subsection, data collected from one of the subjects will be used to illustrate the process of diagnosing a respiratory disease using the mobile application. Figure 7a shows the exhalation signal for one of the samples used in this work. The X-axis represents the time in seconds and the Y-axis represents the amplitude of the signal. The steps described in the algorithms and illustrated in Figure 1 were applied to this signal in order to obtain the flow-time curve shown in Figure 7b, where the Y-axis represents the flow rate in meter/second and the X-axis represents the time in seconds. The final volume-time curve is shown in Figure 7c, where the Y-axis represents volume in liters and the X-axis represents time in seconds. The spirometry parameters FVC and FEV1 for this sample are shown in Figure 7c. As per the obtained results for this sample, the FEV1/FVC is 82%, which indicates a healthy subject.

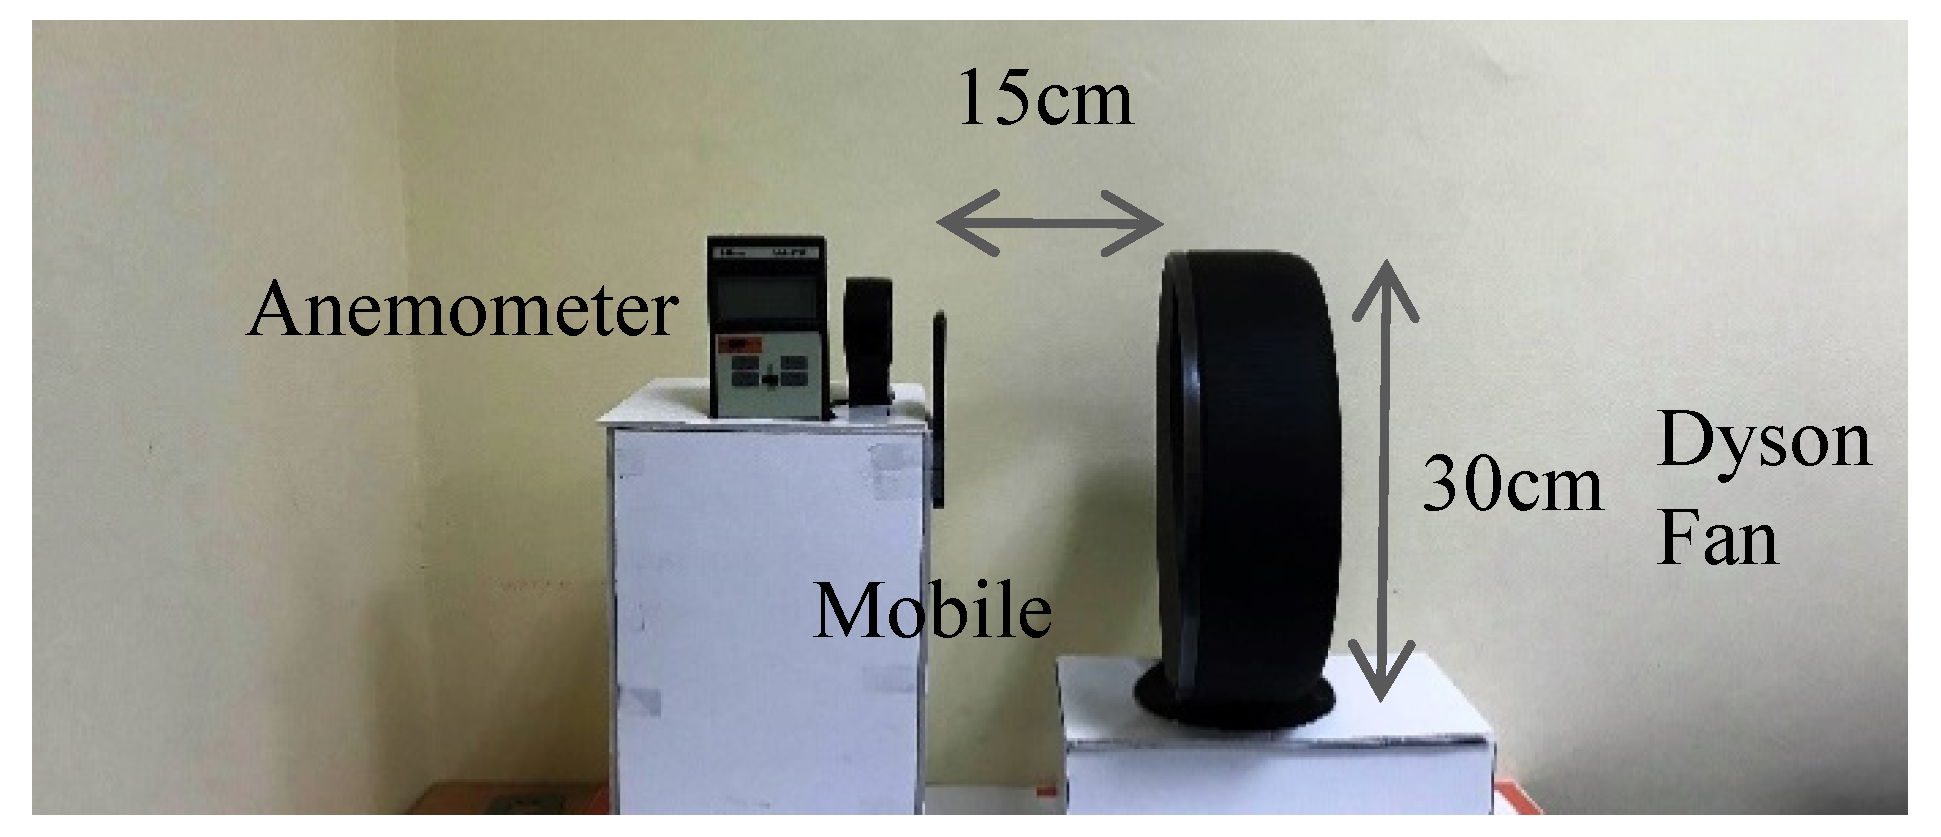
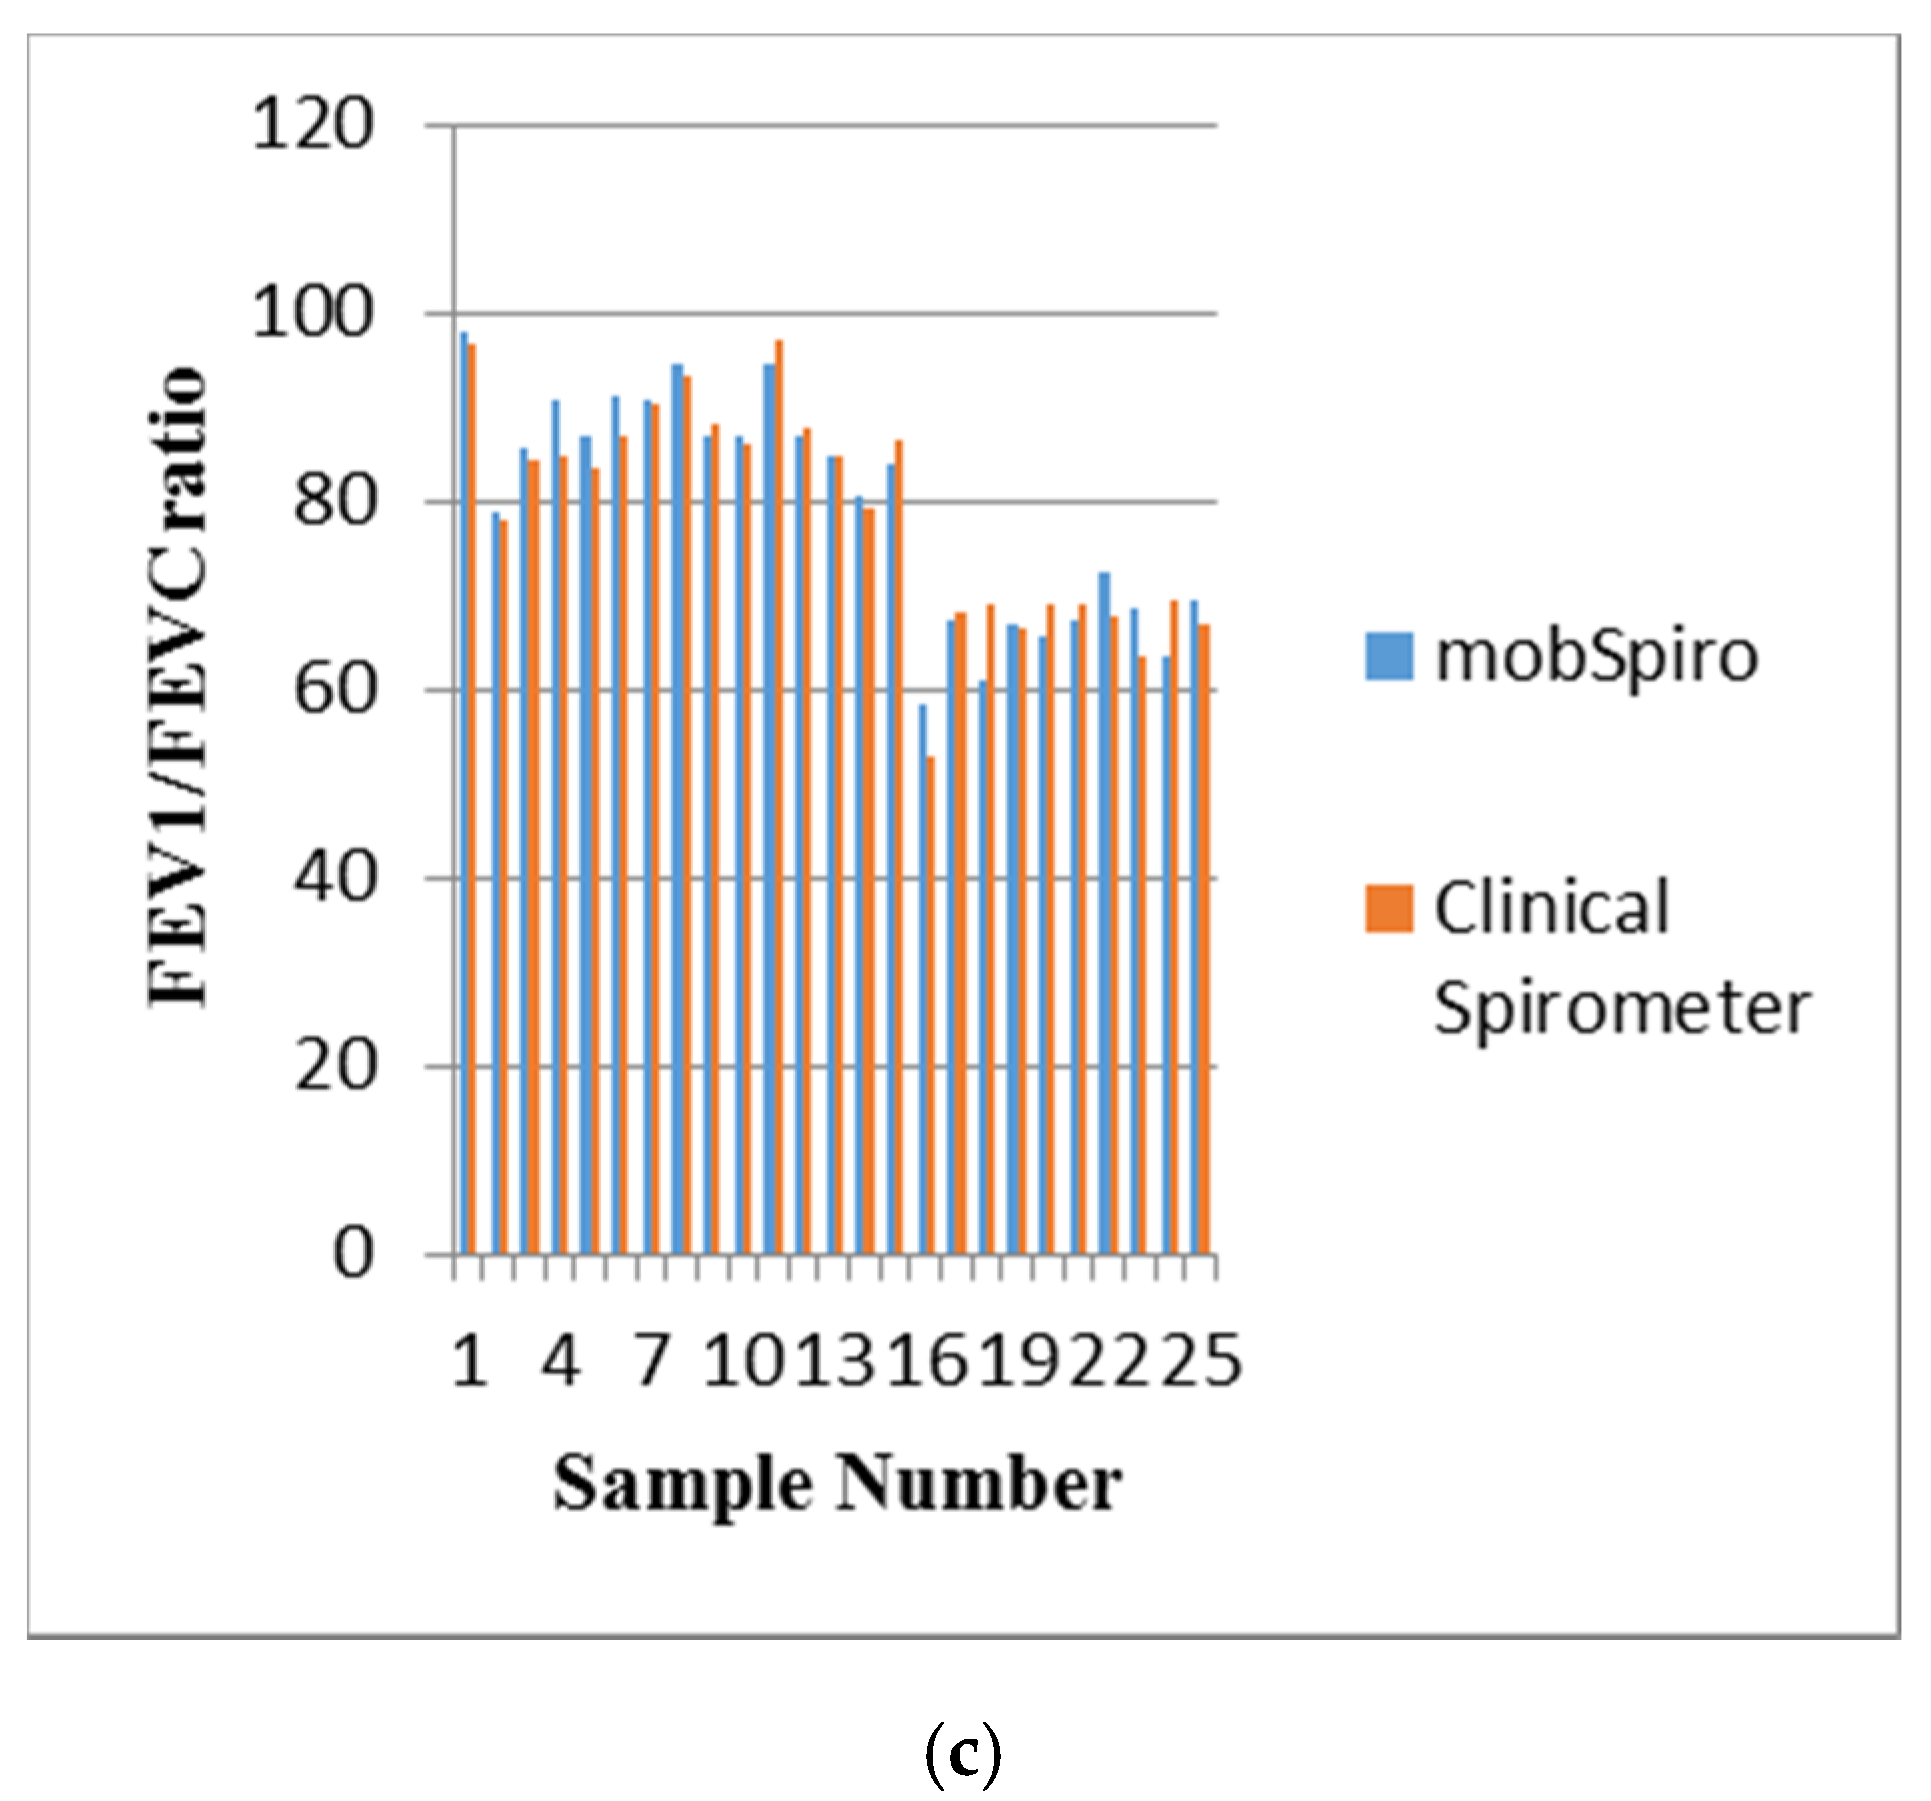
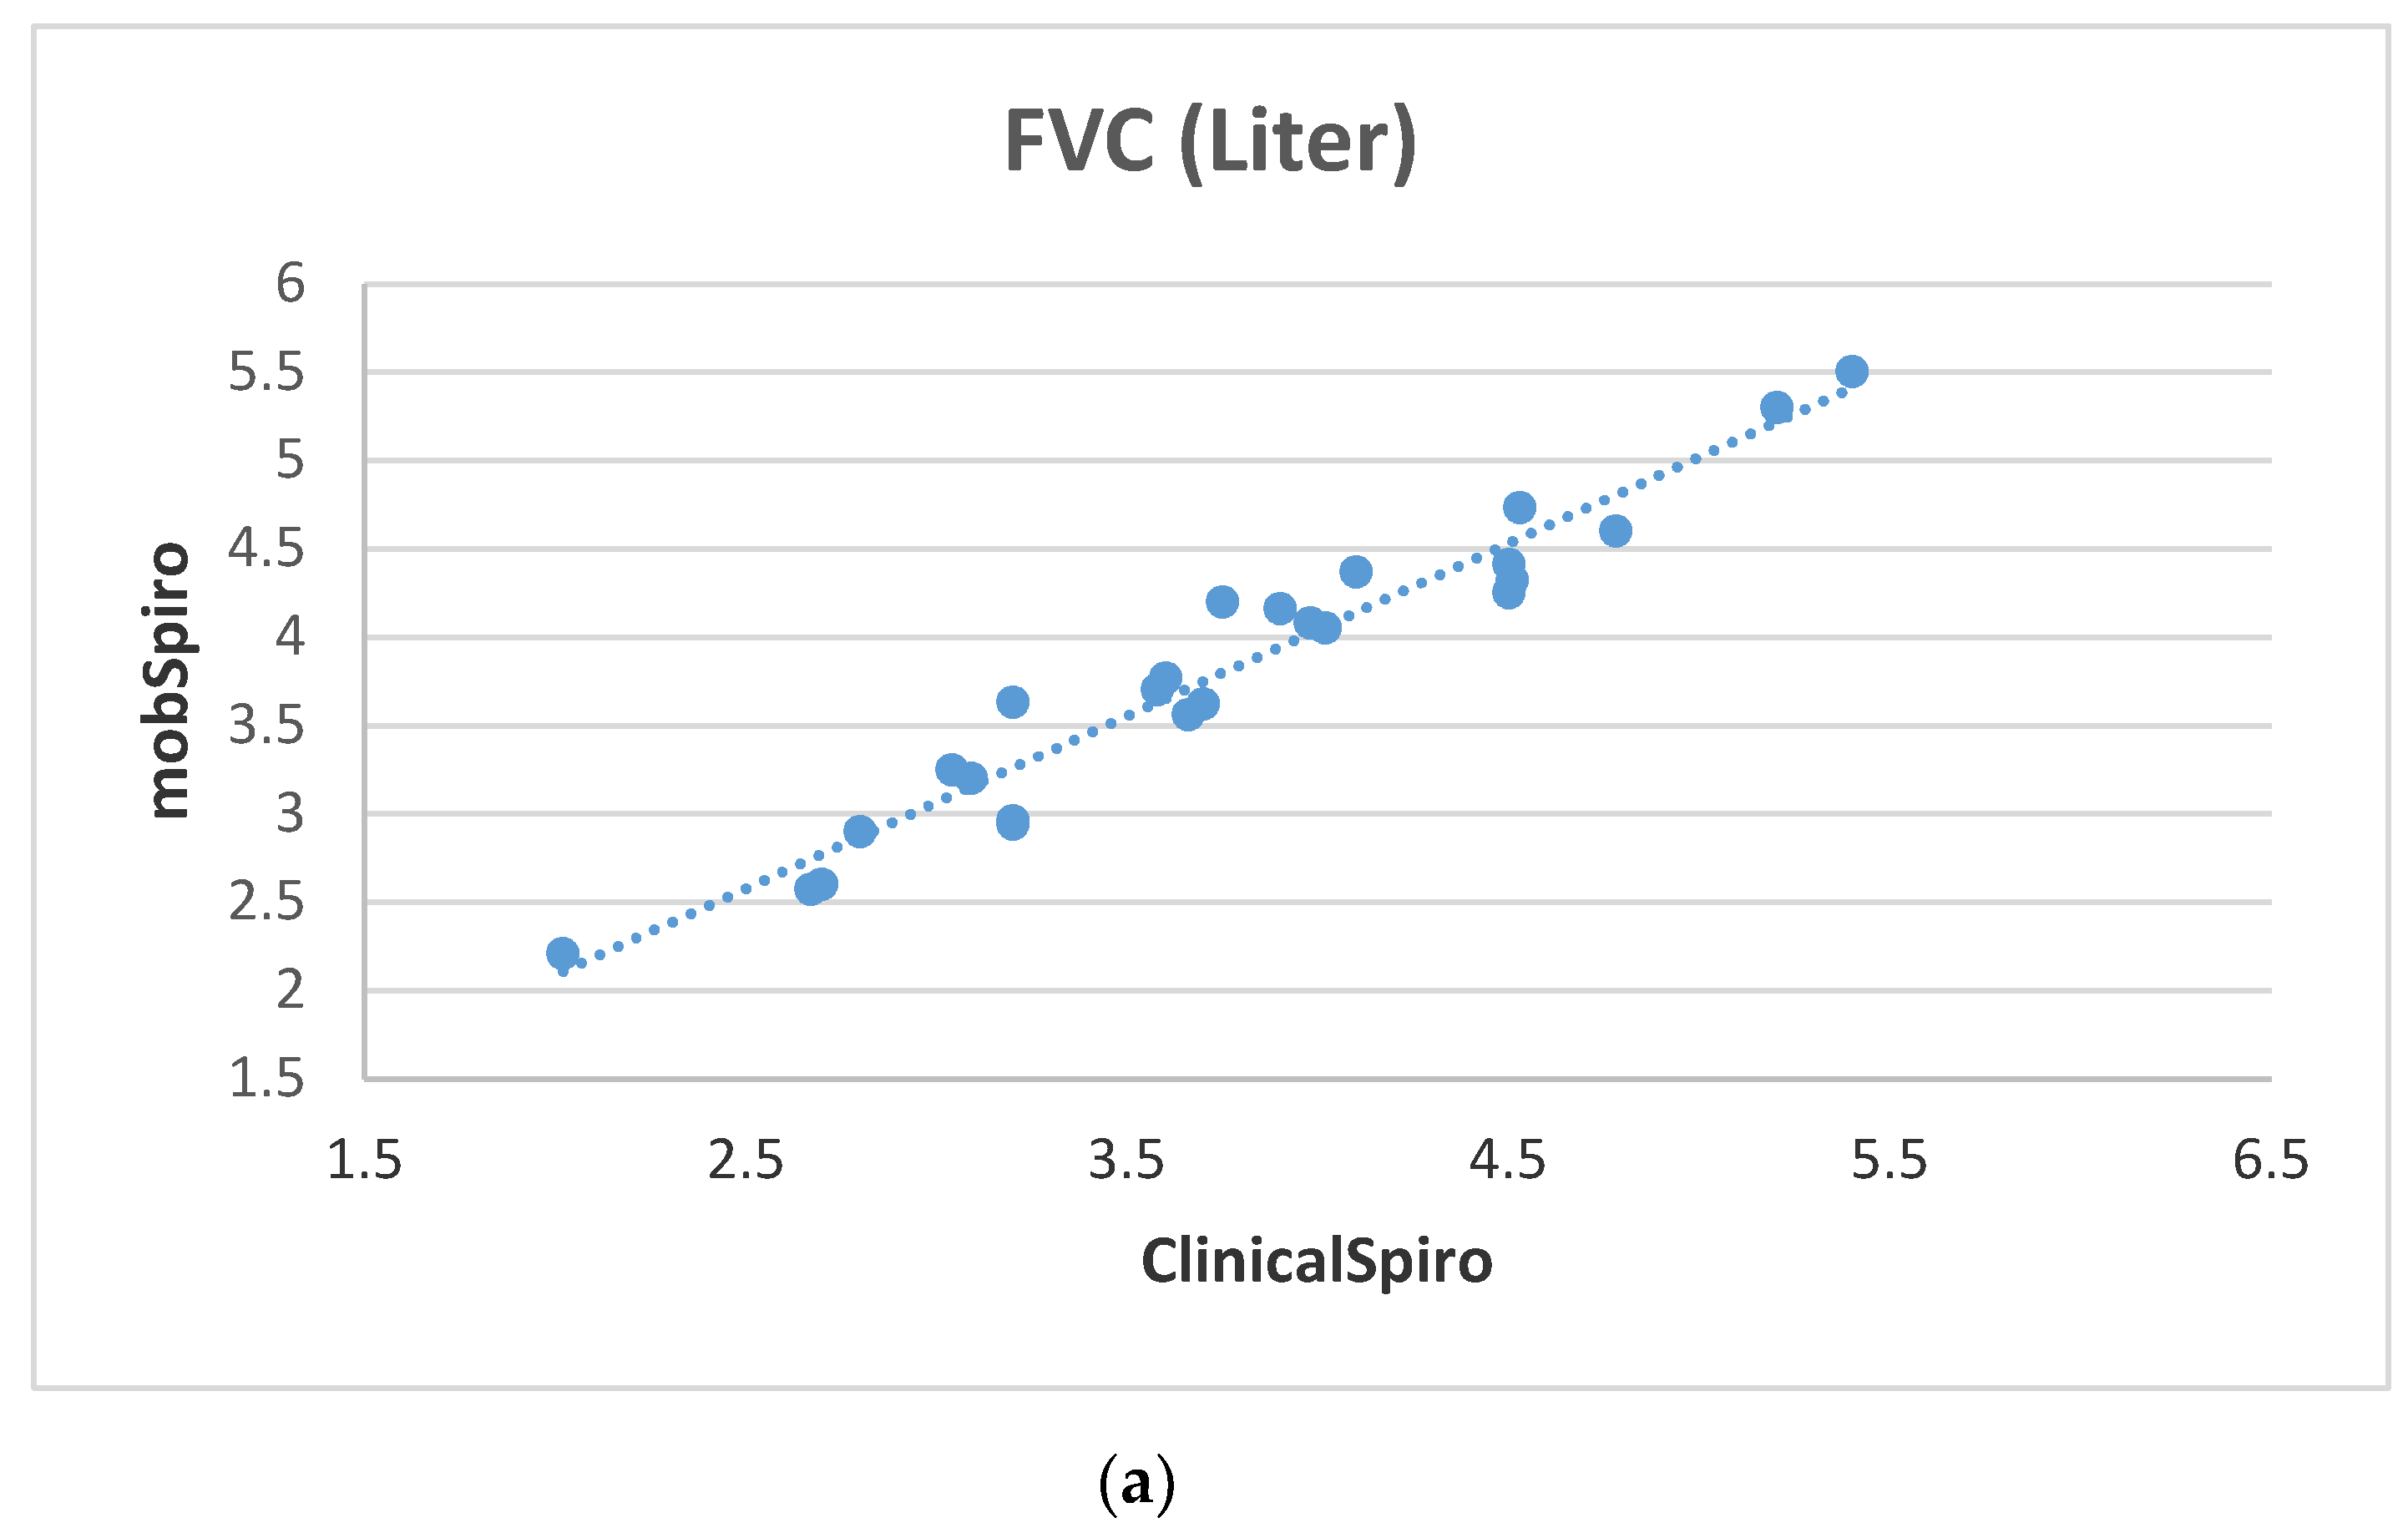
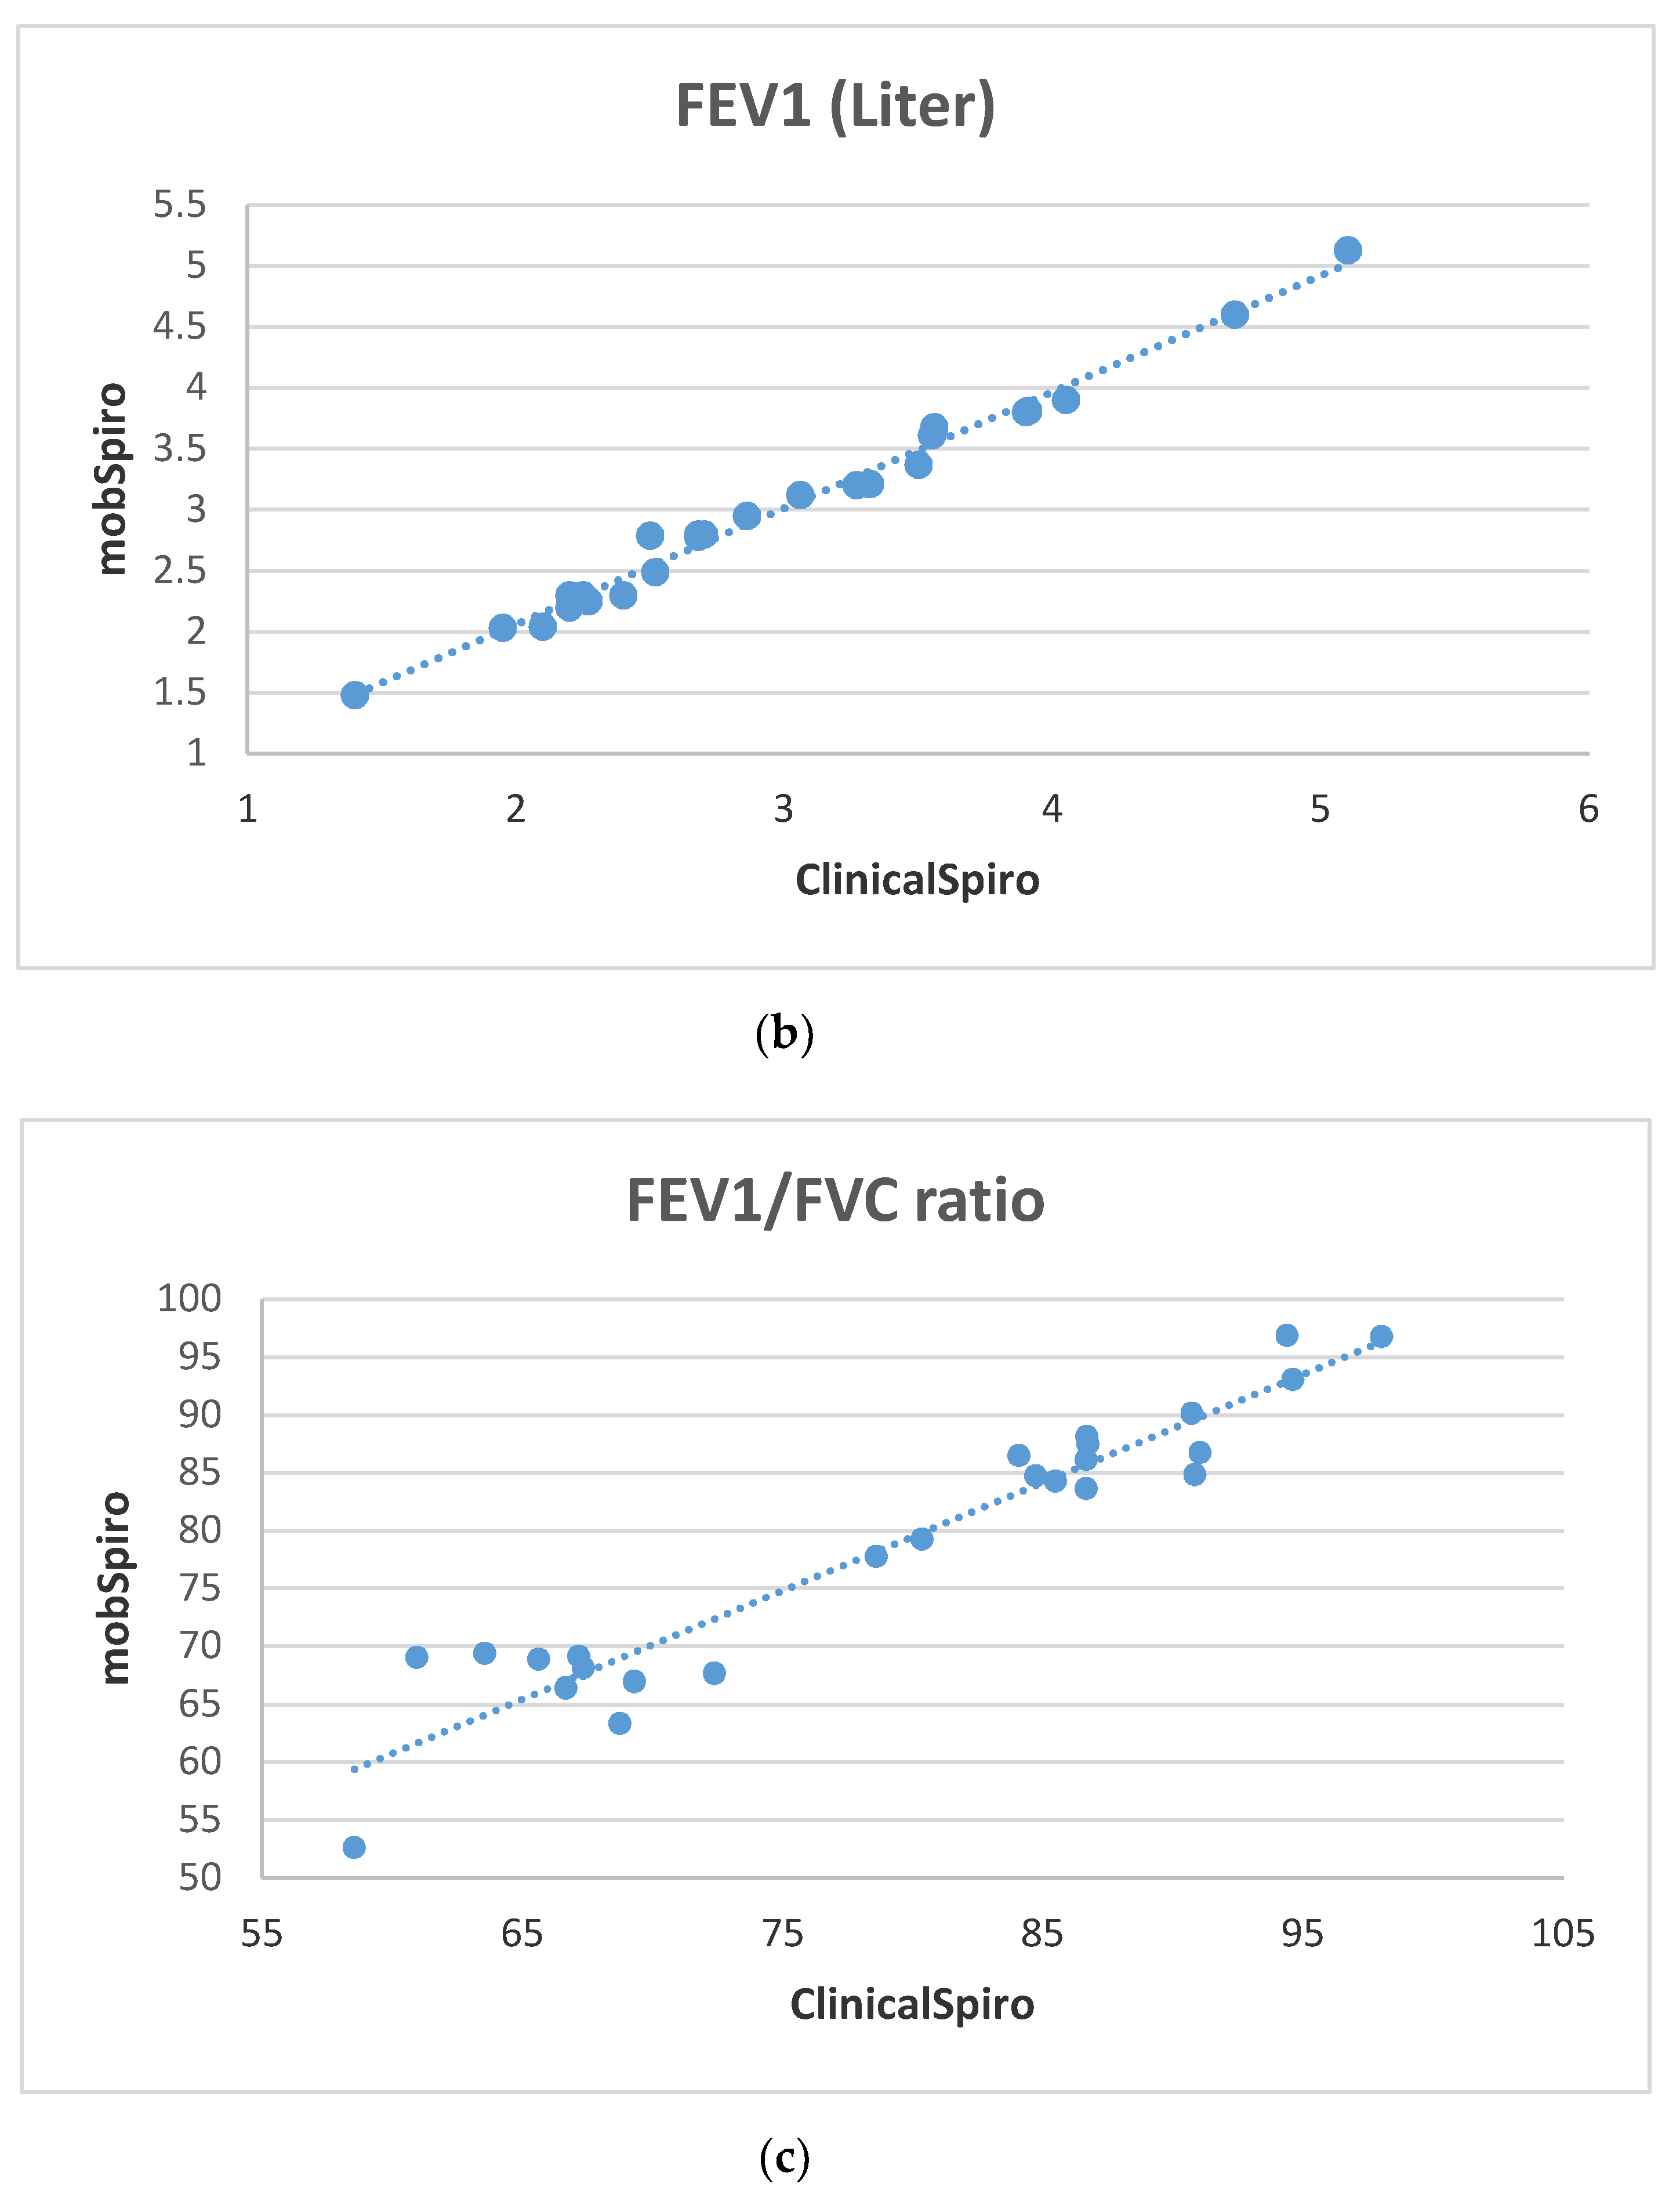
6. Samples Collection and Discussion of Results

Samples used in this work include medically diagnosed patients, at risk smokers, and healthy individuals. The variety of the samples in terms of gender, age, and health conditions helps in assessing the accuracy of the proposed system and in developing techniques for future improvements of similar applications. The subjects tested are coached on how to conduct the test correctly, and they performed the spirometry test twice: once using the mobile application on the Galaxy S5 smartphone and another time as a reference test using a clinical spirometer for comparison purposes. With their consent, patients were selected from Oriana Hospital and Al-Zahra Hospital in the city of Sharjah located in the United Arab Emirates (UAE) and placed under the supervision and guidance of pulmonologists. Smokers and healthy individuals were volunteers from the university community.
To collect data using a clinically acceptable handheld spirometer, the Spirobank-2 [42] was used. Studies conducted on Spirobank-2 and other handheld spirometers showed that their user friendliness and quality make them acceptable for the detection of COPD and Asthma [43,44,45,46]. In collecting the samples from subjects, the below protocol was followed:
  • Subjects are asked few questions about disease symptoms and family history of respiratory diseases in order to fill the Pretest Activity;
  • Subjects are asked to measure their SpO2 using an external oximeter;
  • Subjects are asked to perform spirometry on a handheld spirometer or clinical spirometer (for hospital subjects);
  • Subjects are asked to perform spirometry using the mobile application by assuming a comfortable position while sitting down and using the proximity sensor to place the mouth at a distance of 5cm from the mobile microphone followed by a deep inhalation and blowing as hard as possible on the mobile. This activity is repeated three times.
A sample of 25 subjects with varied health conditions is used to test the application. The average age of the subjects is 35 years and their ages range from 10 to 66 years. Ten subjects are patients already diagnosed with asthma and COPD, five subjects are smokers with symptoms of respiratory diseases, and ten subjects are healthy with no symptoms. Convincing subjects at hospitals and clinics to volunteer for this work was a serious obstacle.
The implementation of the algorithm described in Figure 1 that was used to obtain the lung parameters requires specifying a constant that represents the cross sectional area of a typical human mouth. This is required to convert the flow rate into volumetric flow rate in order to find the lung parameters. The patient during spirometry test blows hard, and the cross sectional area of mouth opening during blowing is the required constant in this case. Practically, this constant cannot be exactly the same for different people because this constant depends on several factors such as gender, age, and body composition. These constants were estimated by considering the cross-sectional area of three subjects in each group and then finding the average cross sectional area. The estimated area used for females is 0.000855 m2 and 0.001 m2 for males.

Diagnosis Outcomes

The three parameters, FVC, FEV1, and the FEV1/FVC ratio, are computed using standard spirometry and by using the mobile application. The graphs of Figure 8 show the differences in FVC, FEV1, and FEV1/FVC ratio, respectively, between the clinical spirometer and the mobile application for all subjects. From the data, the calculated mean percent error between FVC data using the mobile application and the clinical spirometer is about 4.6%, the mean percent error between FEV1 data from the mobile application and the clinical spirometer is about 3.1%, and the mean percent error between FEV1/FVC ratio data from the mobile application and the clinical spirometer is approximately 3.5%. The correlation graphs of Figure 9 show a linear relationship between the variables of the spirometer and the mobile application.
Table 3 shows the diagnosis results of the mobile application and the clinical diagnosis for a subset of patients with the IDs 16 to 25. IDs 1 to 15 in this work are reserved for smokers and healthy subjects, and they all showed a negative diagnosis for COPD and asthma by both the MobSpiro application and the clinical spirometer. Hence, they are not included in Table 3.
All patients were diagnosed correctly by the mobile application except for one patient (subject 19). Subject 19 was diagnosed with Moderate COPD by the mobile application, but was clinically diagnosed with Moderate Persistent Asthma. It may be noted that the mobile application depends on FEV1/FVC ratio, FEV1%, and the pretest possibility in diagnosis and classification of disease. On the other hand, clinical diagnosis also depends on FEV1/FVC ratio, FEV1%, symptoms and history, but it may also depend on a chest radiograph or the post bronchodilator test. In some cases, the chest radiograph or the post bronchodilator test could be the only differentiator between asthma and COPD, which unfortunately cannot be included in the system implemented here.

7. Conclusions

Chronic obstructive pulmonary disease (COPD) and asthma are chronic lung diseases that are characterized by coughing, wheezing, chest tightness, and shortness of breath. Severity levels of COPD disease range from mild, moderate, and severe to very severe, depending on specific lung measurements. For asthma, severity level ranges from mild intermittent, mild persistent, and moderate persistent to severe persistent. Spirometry remains the golden standard for diagnosing and staging COPD and is the recommended test for asthma diagnosis and monitoring. Traditional methods of diagnosing and monitoring COPD and asthma require either buying a dedicated portable spirometer or regularly visiting a physician, which is considered time consuming and expensive. Due to the ever increasing computing power of smartphones and their penetration of all facets of daily living, a design was implemented that takes advantage of the built-in sensors in the smartphone to extract and analyze physiological signals in order to diagnose, stage, and monitor COPD and asthma diseases.
Following a review of published literature in respiratory diseases and the methods by which they are diagnosed and managed, a discussion was presented on the design and development phases of a mobile application that is able to read the physiological signals of a patient using built-in sensors and analyze the collected data to diagnose, stage, and monitor the disease.
The developed smartphone application performed as expected in the recording of patient exhalation and extracting lung function measurements and in analyzing the collected data solely on the smartphone. A sample of 25 subjects with varied medical backgrounds was recruited to test the application. The obtained results indicated that 96% of the tested cases were correctly diagnosed. The mean percent error between, FVC, FEV1, and FEV1/FVC ratio as measured using the clinical spirometer and as computed using the mobile application was 3.5%, 4.6%, and 3.1%, respectively. These results prove the effectiveness of the proposed system when compared to the clinical spirometer and emphasize the role that smartphones may play in healthcare in the future.
In the future, the authors plan to tackle the monitoring and diagnosis problem using machine learning techniques. This approach has been explored with promising results [47,48,49,50,51] and, hence, there is a keen interest to further study and assess its advantages and limitations compared to the approach presented both in this paper and in others. Additionally, the proposed mobile-based approach is in line with the expected applications of smart-health in the smart-cities of the future, where technologies such as the Internet of Things will dominate [52,53].

Author Contributions

Conceptualization, A.S. and F.A.; data curation, F.Z.; investigation, F.Z. and A.S.; methodology, F.Z.; project administration, A.S. and F.A.; resources, H.M. and B.M.; software, F.Z.; supervision, A.S., F.A., H.M., and B.M.; validation, F.Z.; writing—original draft, F.Z.; writing—review and editing, A.S. and F.A. All authors have read and agreed to the published version of the manuscript.

Funding

This research received no external funding.

Conflicts of Interest

The authors declare no conflict of interest.

References

  1. Cheng, S.; Mohammed, T.L. Diffuse smoking-related lung disease: Emphysema and interstitial lung disease. Semin. Roentgenol. 2015, 50, 16–22. [Google Scholar] [CrossRef] [PubMed]
  2. Cavaillès, A.; Brinchault-Rabin, G.; Dixmier, A.; Goupil, F.; Gut-Gobert, C.; Marchand-Adam, S.; Meurice, J.-C.; Morel, H.; Person-Tacnet, C.; Leroyer, C.; et al. Comorbidities of COPD. Eur. Respir. Rev. Off. J. Eur. Respir. Soc. 2013, 22, 454–475. [Google Scholar] [CrossRef] [PubMed]
  3. Asthma Cases Continue to Rise in U.S., Affecting Millions U.S. News & World Report. 2012. Available online: http://health.usnews.com/health-news/news/articles/2012/05/15/asthma-cases-continue-to-rise-in-us-affecting-millions (accessed on 7 November 2020).
  4. Society, A.T. Standards for the diagnosis and care of patients with chronic obstructive pulmonary disease (COPD) and asthma. Am. Rev. Respir. Dis. 1987, 136, 225–244. [Google Scholar]
  5. Coates, A.L.; Graham, B.L.; McFadden, R.G.; McParland, C.; Moosa, D.; Provencher, S.; Road, J.; Canadian Thoracic Society. Spirometery in primary care. Can. Respir. J. 2013, 20, 13–21. [Google Scholar] [CrossRef]
  6. Wukitsch, M.W.; Petterson, M.M.T.; Tobler, D.R.; Pologe, J.A. Pulse oximetry: Analysis of theory, technology, and practice. J. Clin. Monit. 1988, 4, 290–301. [Google Scholar] [CrossRef]
  7. Vestbo, J.; Hurd, S.S.; Agusti, A.; Jones, P.; Vogelmeier, C.; Anzueto, A.; Barnes, P.J.; Fabbri, L.M.; Martinez, F.J.; Nishimura, M.; et al. Global strategy for the diagnosis, management, and prevention of chronic obstructive pulmonary disease. Am. J. Respir. Crit. Care Med. 2013, 187, 4. [Google Scholar] [CrossRef]
  8. Lahdenoja, O.; Pankaala, M.; Koivisto, T.; Hurnanen, T.; Iftikhar, Z.; Nieminen, S.; Knuutila, T.; Saraste, A.; Kiviniemi, T.; Vasankari, T.; et al. Atrial fibrillation detection via accelerometer and gyroscope of a smartphone. IEEE J. Biomed. Health Inform. 2018, 22, 1. [Google Scholar] [CrossRef]
  9. Finkelstein, J.; Wood, J. Mobile eLearning platform for interactive patient education. In Proceedings of the International Conference on Mobile, Hybrid, and On-line Learning, Cancun, Mexico, 1–7 February 2009; pp. 23–27. [Google Scholar]
  10. Ding, H.; Moodley, Y.; Kanagasingam, Y.; Karunanithi, M. A mobile-health system to manage Chronic Obstructive Pulmonary Disease patients at home. Annu. Int. Conf. IEEE Eng. Med. Biol. Soc. 2012, 2012, 2178–2181. [Google Scholar]
  11. Abushakra, A.; Faezipour, M. Lung capacity estimation through acoustic signal of breath. In Proceedings of the IEEE 12th International Conference on Bioinformatics & Bioengineering, Larnaca, Cyprus, 11–13 November 2012; pp. 386–391. [Google Scholar]
  12. Van der Heijden, M.; Lucas, P.J.F.; Lijnse, B.; Heijdra, Y.F.; Schermer, T.R.J. An autonomous mobile system for the management of COPD. J. Biomed. Inform. 2013, 46, 458–469. [Google Scholar] [CrossRef]
  13. Cao, Z.; Zhu, R.; Que, R.Y. A Wireless portable system with microsensors for monitoring respiratory diseases. IEEE Trans. Biomed. Eng. 2012, 59, 3110–3116. [Google Scholar]
  14. Bellos, C.C.; Papadopoulos, A.; Rosso, R.; Fotiadis, D.I. Identification of COPD patients’ health status using an intelligent system in the CHRONIOUS wearable platform. IEEE J. Biomed. Health Inform. 2014, 18, 731–738. [Google Scholar] [CrossRef] [PubMed]
  15. Seto, E.Y.W.; Giani, A.; Shia, V.; Wang, C.; Yan, P.; Yang, A.Y.; Jerrett, M.; Bajcsy, R. A wireless body sensor network for the prevention and management of asthma. In Proceedings of the IEEE International Symposium on Industrial Embedded Systems, Lausanne, Switzerland, 8–10 July 2009; pp. 120–123. [Google Scholar]
  16. Bumatay, A.; Chan, R.; Lauher, K.; Kwan, A.M.; Stoltz, T.; Delplanque, J.-P.; Kenyon, N.J.; Davis, C.E. Coupled mobile phone platform with peak flow meter enables real-time lung function assessment. IEEE Sens. J. 2012, 12, 685–691. [Google Scholar] [CrossRef]
  17. Kwan, A.M.; Fung, A.G.; Jansen, P.A.; Schivo, M.; Kenyon, N.J.; Delplanque, J.-P.; Davis, C.E. Personal Lung Function Monitoring Devices for Asthma Patients. IEEE Sens. J. 2015, 15, 2238–2247. [Google Scholar] [CrossRef]
  18. Bae, W.D.; Alkobaisi, S.; Narayanappa, S.; Liu, C. A mobile data analysis framework for environmental health decision support. In Proceedings of the 9th International Conference on Information Technology: New Generations (ITNG), Las Vegas, NV, USA, 16–18 April 2012; pp. 155–161. [Google Scholar]
  19. Kumar, K.D. Human health monitoring mobile phone application by using the wireless nanosensor based embedded system. In Proceedings of the International Conference on Information Communication and Embedded Systems (ICICES), Chennai, India, 21–22 February 2013; pp. 889–892. [Google Scholar]
  20. Bagchi, S.; Chattopadhyay, M. Real-time monitoring of respiratory diseases of distantly located elderly impaired patients. In Proceedings of the 6th International Conference on Sensing Technology (ICST), Kolkata, India, 18–21 December 2012; pp. 146–150. [Google Scholar]
  21. Larson, E.C.; Goel, M.; Boriello, G.; Heltshe, S.; Rosenfeld, M.; Patel, S. SpiroSmart: Using a microphone to measure lung function on a mobile phone. ACM Conf. Ubiquitous Comput. 2012, 280–289. [Google Scholar] [CrossRef]
  22. Xu, W.; Huang, M.-C.; Liu, J.J.; Ren, F.; Shen, X.; Liu, X.; Sarrafzadeh, M. mCOPD: Mobile phone based lung function diagnosis and exercise system for COPD. In Proceedings of the 6th International Conference on Pervasive Technologies Related to Assistive Environments, Rhodes, Greece, 29–31 May 2013. [Google Scholar]
  23. Stein, B. A Mobile Smart Care Platform Home Spirometry by Using the Smartphone Microphone. Master’s Thesis, Leiden University, Leiden, The Netherlands, 2013. [Google Scholar]
  24. Chamberlain, D.B.; Kodgule, R.; Fletcher, R. A mobile platform for automated screening of asthma and chronic obstructive pulmonary disease. Annu. Int. Conf. IEEE Eng. Med. Biol. Soc. 2016, 2016, 5192–5195. [Google Scholar]
  25. Isaac, N.; Sampath, N.; Gay, V. Modernizing Asthma Management: Personalized Asthma Action Plans Using a Smartphone Application. In Proceedings of the 12th International Symposium on Medical Information and Communication Technology (ISMICT), Sydney, NSW, Australia, 26–28 March 2018; pp. 1–5. [Google Scholar]
  26. Silva, T.A.; Costa, M.G.F.; Stelmach, R.; Bley, P.K.; Gutierrez, M.A.; Filho, C.F.F.C. Development of a system mobile-based to assist asthma self-management. In Proceedings of the 2018 3rd Biennial South African Biomedical Engineering Conference (SAIBMEC), Stellenbosch, South Africa, 4–6 April 2018; pp. 1–4. [Google Scholar]
  27. Nathan, V.; Vatanparvar, K.; Rahman, M.; Nemati, E.; Kuang, J. Assessment of Chronic Pulmonary Disease Patients Using Biomarkers from Natural Speech Recorded by Mobile Devices. In Proceedings of the 2019 IEEE 16th International Conference on Wearable and Implantable Body Sensor Networks (BSN), Chicago, IL, USA, 19–22 May 2019; pp. 1–4. [Google Scholar]
  28. Ding, H.; Karunanithi, M.; Ireland, D.; McCarthy, L.; Hakim, R.; Phillips, K.; Pradhan, R.; Seah, E.; Bowman, R.; Fong, K.; et al. Evaluation of an innovative mobile health programme for the self-management of chronic obstructive pulmonary disease (MH-COPD): Protocol of a randomized controlled trial. BMJ Open 2019, 9, 4. [Google Scholar] [CrossRef]
  29. Himes, B.; Leszinsky, L.; Walsh, R.; Hepner, H.; Wu, A. Mobile health and inhaler-based monitoring devices for asthma management. J. Allergy Clin. Immunol. Pract. 2019, 7, 2535–2543. [Google Scholar] [CrossRef]
  30. Park, S.K.; Bang, C.H.; Lee, S.H. Evaluating the effect of a smartphone app-based self-management program for people with COPD: A randomized controlled trial. Appl. Nurs. Res. 2020, 52, 151231. [Google Scholar] [CrossRef]
  31. Zubaydi, F.; Sagahyroon, A.; Aloul, F.; Mir, H. MobSpiro: Mobile based spirometry for detecting COPD. In Proceedings of the 2017 IEEE 7th Annual Computing and Communication Workshop and Conference (CCWC), Las Vegas, NV, USA, 9–11 January 2017. [Google Scholar]
  32. Molaie, M.; Moradi, M.H. Heart Sound Localization in Respiratory Sounds Based on Singular Spectrum Analysis and Frequency Features. ETRI J. 2015, 37, 824–832. [Google Scholar] [CrossRef] [Green Version]
  33. Kandaswamy, A.; Kumar, C.S.C.S.; Ramanathan, R.; Jayaraman, S.; Malmurugan, N. Neural classification of lung sounds using wavelet coefficients. Comput. Biol. Med. 2004, 34, 523–537. [Google Scholar] [CrossRef]
  34. Classification of Asthma. Available online: http://www.webmd.com/asthma/tc/classification-of-asthma-topic-overview (accessed on 7 November 2020).
  35. AM06 25 cm Desk Fan DYSON. Available online: http://www.dyson.com.sg/fansheaters/fans/desk/am06-10-range/am06-desk-fan-10-iron-blue.aspx (accessed on 7 November 2020).
  36. AM-4201 Digital Anemometer Lutron. Available online: http://www.lutron.com.tw/ugC_ShowroomItem_Detail.asp?hidKindID=1&hidTypeID=7&hidCatID=&hidShowID=785&hidPrdType=&txtSrhData= (accessed on 7 November 2020).
  37. Butterworth, S. On the theory of filter amplifiers. Wirel. Eng. 1930, 7, 536–541. [Google Scholar]
  38. Oliveira, A.; Marques, A. Respiratory sounds in healthy people: A systematic review. Respir. Med. 2014, 108, 550–570. [Google Scholar] [CrossRef] [Green Version]
  39. Emmanouilidou, D.; Elhilali, M. Characterization of noise contaminations in lung sound recordings. Conf. Proc. IEEE Eng. Med. Biol. Soc. 2013, 2013, 2551–2554. [Google Scholar]
  40. Mulligan, K.; Adler, A.; Goubran, R. Detecting regional lung properties using audio transfer functions of the respiratory system. In Proceedings of the 2009 Annual International Conference of the IEEE Engineering in Medicine and Biology Society, Minneapolis, MN, USA, 3–6 September 2009; pp. 5697–5700. [Google Scholar]
  41. Zaeim, H.M.; Scheffer, C.; Blanckenberg, M.; Dellimore, K. Evaluation of the use of frequency response in the diagnosis of pleural effusion on a phantom model of the human lungs. In Proceedings of the 2014 36th Annual International Conference of the IEEE Engineering in Medicine and Biology Society, Chicago, IL, USA, 26–30 August 2014; pp. 3418–3421. [Google Scholar]
  42. SpiroBank II. Available online: http://www.spirometry.com/ENG/Products/SpiroBank2.asp (accessed on 7 November 2020).
  43. Liistro, G.; Vanwelde, C.; Vincken, W.; Vandevoorde, J. Technical and functional assessment of 10 office spirometers: A multicenter comparative study. Chest 2006, 130, 657–665. [Google Scholar] [CrossRef] [PubMed]
  44. Lusuardi, M.; de Benedetto, F.; Paggiaro, P.; Sanguinetti, C.M.; Brazzola, G.; Ferri, P.; Donner, C.F. A Randomized controlled trial on office spirometry in Asthma and COPD in standard general practice: Data from spirometry in Asthma and COPD: A comparative evaluation Italian study. Chest 2006, 129, 844–852. [Google Scholar] [CrossRef] [PubMed] [Green Version]
  45. Degryse, J.-M.; Buffels, J.; Van Dijck, Y.; Decramer, M.; Nemery, B. Accuracy of Office Spirometry Performed by Trained Primary-Care Physicians Using the MIR Spirobank Hand-Held Spirometer. Respiration 2012, 83, 543–552. [Google Scholar] [CrossRef] [PubMed]
  46. Buffels, J.; Degryse, J.; Heyrman, J.; Decramer, M. DIDASCO Study Office Spirometry Significantly Improves Early Detection of COPD in General Practice. Chest 2004, 125, 1394–1399. [Google Scholar] [CrossRef]
  47. Spathis, D.; Vlamos, P. Diagnosing asthma and chronic obstructive pulmonary disease with machine learning. Health Inform. J. 2017, 25, 811–827. [Google Scholar] [CrossRef] [Green Version]
  48. Prosperi, M.; Marinho, S.; Simpson, A.; Custovic, A.; Buchan, I. Predicting phenotypes of asthma and eczema with machine learning. BMC Med. Genom. 2014, 7, S7. [Google Scholar] [CrossRef] [Green Version]
  49. Zubaidi, F. A Mobile Based Platform for Monitoring Respiratory Diseases. Master’s Thesis, American University of Sharjah, Sharjah, UAE, 2016. [Google Scholar]
  50. Goto, T.; Camargo, C.A., Jr.; Faridi, M.K.; Yun, B.J.; Hasegawa, K. Machine learning approaches for predicting disposition of asthma and COPD exacerbations in the ED. Am. J. Emerg. Med. 2018, 36, 1650–1654. [Google Scholar] [CrossRef]
  51. Gurbeta, L.; Badnjević, A.; Maksimovic, M.; Omanović-Mikličanin, E.; Sejdic, E. A telehealth system for automated diagnosis of asthma and chronical obstructive pulmonary disease. J. Am. Med. Inform. Assoc. 2018, 25, 1213–1217. [Google Scholar] [CrossRef] [PubMed] [Green Version]
  52. Zhou, L.; Du, C.; Bai, C.; Song, Y. An Internet of Things based COPD managing system: Its development, challenges and first experiences. Clin. eHealth 2019, 2, 12–15. [Google Scholar] [CrossRef]
  53. Jung, B. The Future of Connected Asthma and COPD Care: A Stepwise Approach; ONdrugDelivery Magazine: Lewes, UK, 2018; pp. 18–22. [Google Scholar]
Figure 1. Flow chart explaining how to calculate the parameters forced vital capacity (FVC) and forced expiratory volume in one second (FEV1).
Informatics 07 00056 g001
Figure 2. Diagnosis of chronic obstructive pulmonary disease (COPD) and asthma.
Informatics 07 00056 g002
Figure 3. Experimental Setup.
Informatics 07 00056 g003
Figure 4. (a) Linear Regression. (b) Quadratic regression.
Informatics 07 00056 g004aInformatics 07 00056 g004b
Figure 5. Pretest Activity Interface.
Informatics 07 00056 g005
Figure 6. Report Activity Display.
Informatics 07 00056 g006
Figure 7. Signal sample and analysis graphs. (a) Exhalation signal of the sample. (b) Flow rate vs. Time. (c) Volume vs. Time.
Informatics 07 00056 g007
Figure 8. Comparative Graphs. (a) FVC differences between mobile and real spirometer results. (b) FEV1 differences between mobile and real spirometer results. (c) FEV1/FVC ratio differences between mobile and real spirometer results.
Informatics 07 00056 g008aInformatics 07 00056 g008b
Figure 9. Correlation Graphs of mobSpiro vs ClinicalSpiro for (a) FVC, (b) FEV1, (c) FEV1/FVC.
Informatics 07 00056 g009aInformatics 07 00056 g009b
Table 1. COPD Severity Ranges.
SeverityFEV1% Predicted
Mild>=80
Moderate>=50 and <80
Severe>=30 and <50
Very severe<30
Table 2. Asthma Severity Ranges.
SeverityAge (Years)Nighttime Awakenings Interference with Normal ActivitiesFEV1% Predicted
IntermittentALL≤2 days/weekNone>80%
0–40
>=5≤2x/month
Mild persistentAll>2 days/week but not dailyMinor limitation>80%
0–41–2x/month
>=53–4x/month
Moderate persistentAllDailySome limitation60–80%
0–43–4x/month
>=5>1x/week but not nightly
Severe persistent AllThroughout the dayExtreme limitation<60%
0–4>1x/week
>=5Often 7x/week
Table 3. Diagnosis Results of the Patients.
Sample IDFEV1/FVC
Mobile App.
FEV1 % Mobile App.Pretest Possibility of COPDPretest Possibility of AsthmaClinical DiagnosisMobile App. Diagnosis
Subject 1658.595.3TrueFalseMild COPDMild COPD
Subject 1767.378.9TrueFalseModerate COPDModerate COPD
Subject 1860.998.5TrueFalseMild COPDMild COPD
Subject 1966.674.4TrueFalseModerate persistent AsthmaModerate COPD
Subject 2065.668FalseTrueModerate persistent AsthmaModerate persistent Asthma
Subject 2167.160.8FalseTrueModerate persistent AsthmaModerate persistent Asthma
Subject 2271.279.1FalseTrueModerate persistent AsthmaModerate persistent Asthma
Subject 2368.776.6FalseTrueModerate persistent AsthmaModerate persistent Asthma
Subject 2463.582.4FalseTrueIntermittent AsthmaIntermittent Asthma
Subject 2569.387.1FalseTrueIntermittent AsthmaIntermittent Asthma
Publisher’s Note: MDPI stays neutral with regard to jurisdictional claims in published maps and institutional affiliations.

