Article

Modeling and Experimental Studies on Adsorption and Photocatalytic Performance of Nitrogen-Doped TiO2 Prepared via the Sol–Gel Method

1
Department of Civil and Environmental Engineering, Case Western Reserve University, Cleveland, OH 44106, USA
2
Department of Chemistry, Case Western Reserve University, Cleveland, OH 44106, USA
3
Department of Mathematics, Applied Mathematics and Statistics, Case Western Reserve University, Cleveland, OH 44106, USA
*
Author to whom correspondence should be addressed.
Catalysts 2020, 10(12), 1449; https://doi.org/10.3390/catal10121449
Submission received: 28 October 2020 / Revised: 17 November 2020 / Accepted: 9 December 2020 / Published: 11 December 2020

Abstract

:
Nitrogen-doped TiO2 has a great potential as a photocatalyst under visible light irradiation with applications in the removal of air and water pollutants, and the treatment of bacterial contaminations. In this study, nitrogen-doped TiO2 nanoparticles were synthesized via the sol–gel method and a post-annealing heat treatment approach. The effects of annealing treatment on the photocatalyst crystalline size and degree of crystallinity were analyzed. Methylene blue dye was used as the model water contaminant for the evaluation of the photoactivity of the synthesized nitrogen-doped TiO2 nanoparticles. The degradation of methylene blue was attributed to three mechanisms, i.e., adsorption, photocatalysis, and direct light photolysis. A kinetic model was developed to distinguish the impact of these three different mechanisms on the removal of contaminants. Adsorption and photocatalysis are heterogeneous processes for removing water organic contaminants. The characterization analysis demonstrates that they are relevant to the microstructures and surface chemical compositions of nitrogen-doped TiO2 photocatalysts. The processing–structure–performance relationship helped to determine the optimal processing parameters for nitrogen-doped TiO2 photocatalyst to achieve the best performance. While we used methylene blue as the model contaminant, the generalized quantitative model framework developed in this study can be extended to other types of contaminants after proper calibration.

Graphical Abstract

1. Introduction

TiO2 as a photocatalyst has attracted extensive research interest as a promising material for eliminating air and water contaminants due to its many advantages, i.e., nontoxicity, good chemical stability, and relatively low cost [1,2,3,4,5,6,7]. However, the large bandgap of TiO2 limits its absorption spectrum to the ultraviolet range. This limitation prevents the use of TiO2 in the indoor lighting environment, since commonly used lamps, such as LEDs, fluorescent lamps, incandescent lamps, etc., emit low amount of ultraviolet light [8,9]. To extend the absorption spectrum into the visible light range, TiO2 has been modified by doping with impurity elements, e.g., nitrogen, carbon, iron [10,11,12,13,14]. The doped TiO2 has a narrower bandgap and can be responsive to the visible light excitation. Among those doped TiO2, nitrogen-doped TiO2 (N-TiO2) has been intensively studied and widely used in the environmental protection applications, including air purification and water treatment [14,15,16,17,18,19]. Figure 1 illustrates the possible mechanisms of degradation of organic contaminants in the presence of N-TiO2 photocatalysts. The N-TiO2 photocatalyst facilitates the degradation of the organic contaminants via heterogeneous processes [20,21,22]. The organic molecules are first adsorbed on the photocatalyst surfaces denoted as path 1 in Figure 1, and then degradation reaction denoted as path 2 occurs. With light irradiance, electron and hole pairs are generated in the photocatalyst, and they are further reacted with the oxygen and water in the surroundings, respectively. Superoxide anion (O2) and hydroxyl radical (·OH) are consequently produced. The generated reactive oxygen species (ROS) have a strong oxidizing ability to degrade the adsorbed organic contaminants. In addition to adsorption and photocatalysis, some organic contaminants can undergo direct photolysis under light irradiation without photocatalyst, denoted as path 3 in Figure 1. For example, tricholocarbon (TCC), a disinfectant [23], and β-blocker as a pharmaceutical ingredient [24], can be efficiently degraded via direct photolysis under sunlight. In practice, adsorption, photocatalysis, and direct photolysis occur simultaneously. The kinetics of these chemical processes are of practical importance for industrial applications. Industries are keen to speed up the reactions and promote economic growth. The knowledge of these reaction mechanisms can provide the guidelines to the materials development, reactor designs, and optimization of reaction conditions. Therefore, it is critical to elucidate the effects of these three mechanisms on the removal of organic contaminants.
The Langmuir–Hinshelwood equation is a commonly used model to explain the heterogeneous catalytic process, combining adsorption and reaction processes [25,26,27]. However, this model has limitations as it requires an equilibrium state between the adsorbate and adsorbent at all times during the reaction. In reality, adsorption and reaction are both dynamic processes. Additionally, direct photolysis by light irradiation was neglected in most reported experiments, where light sources with high intensity were used. In such cases, there could be a noticeable degradation of contaminants through the direct photolysis mechanism, but this effect is commonly incorporated in the interpretation of the photocatalysis mechanism and should be decoupled. Here, we proposed a kinetic model that combines adsorption, photocatalysis, and direct photolysis. We also carried out related experiments with respect to the model. By fitting experimental data to the proposed model, the effects of these three mechanisms on degradation of contaminants are quantitatively evaluated, and one can access their dominance in the photocatalytic experiments.
This work represents a comprehensive quantitative model for the nitrogen-doped titania (N-TiO2) nanoparticle-assisted photocatalytic degradation of organic dyes in aqueous environments. The presented model holistically considers the kinetics of critical processes involved in the photocatalytic degradation of a representative water-born organic dye contaminant, including the processes involved in dye adsorption, photolysis, and photocatalytic reactions. The generalized quantitative model framework can be extended to other types of contaminants after proper calibration. Moreover, this study experimentally investigated the effects of synthesis and processing conditions on the structural features of titania nanoparticle-based photocatalyst as well as their performance. This sheds light on the processing–structure–performance relationship in visible-light-driven N-doped TiO2 photocatalysts and will help to determine the optimal processing parameters that achieve the best performance.

2. Result and Discussion

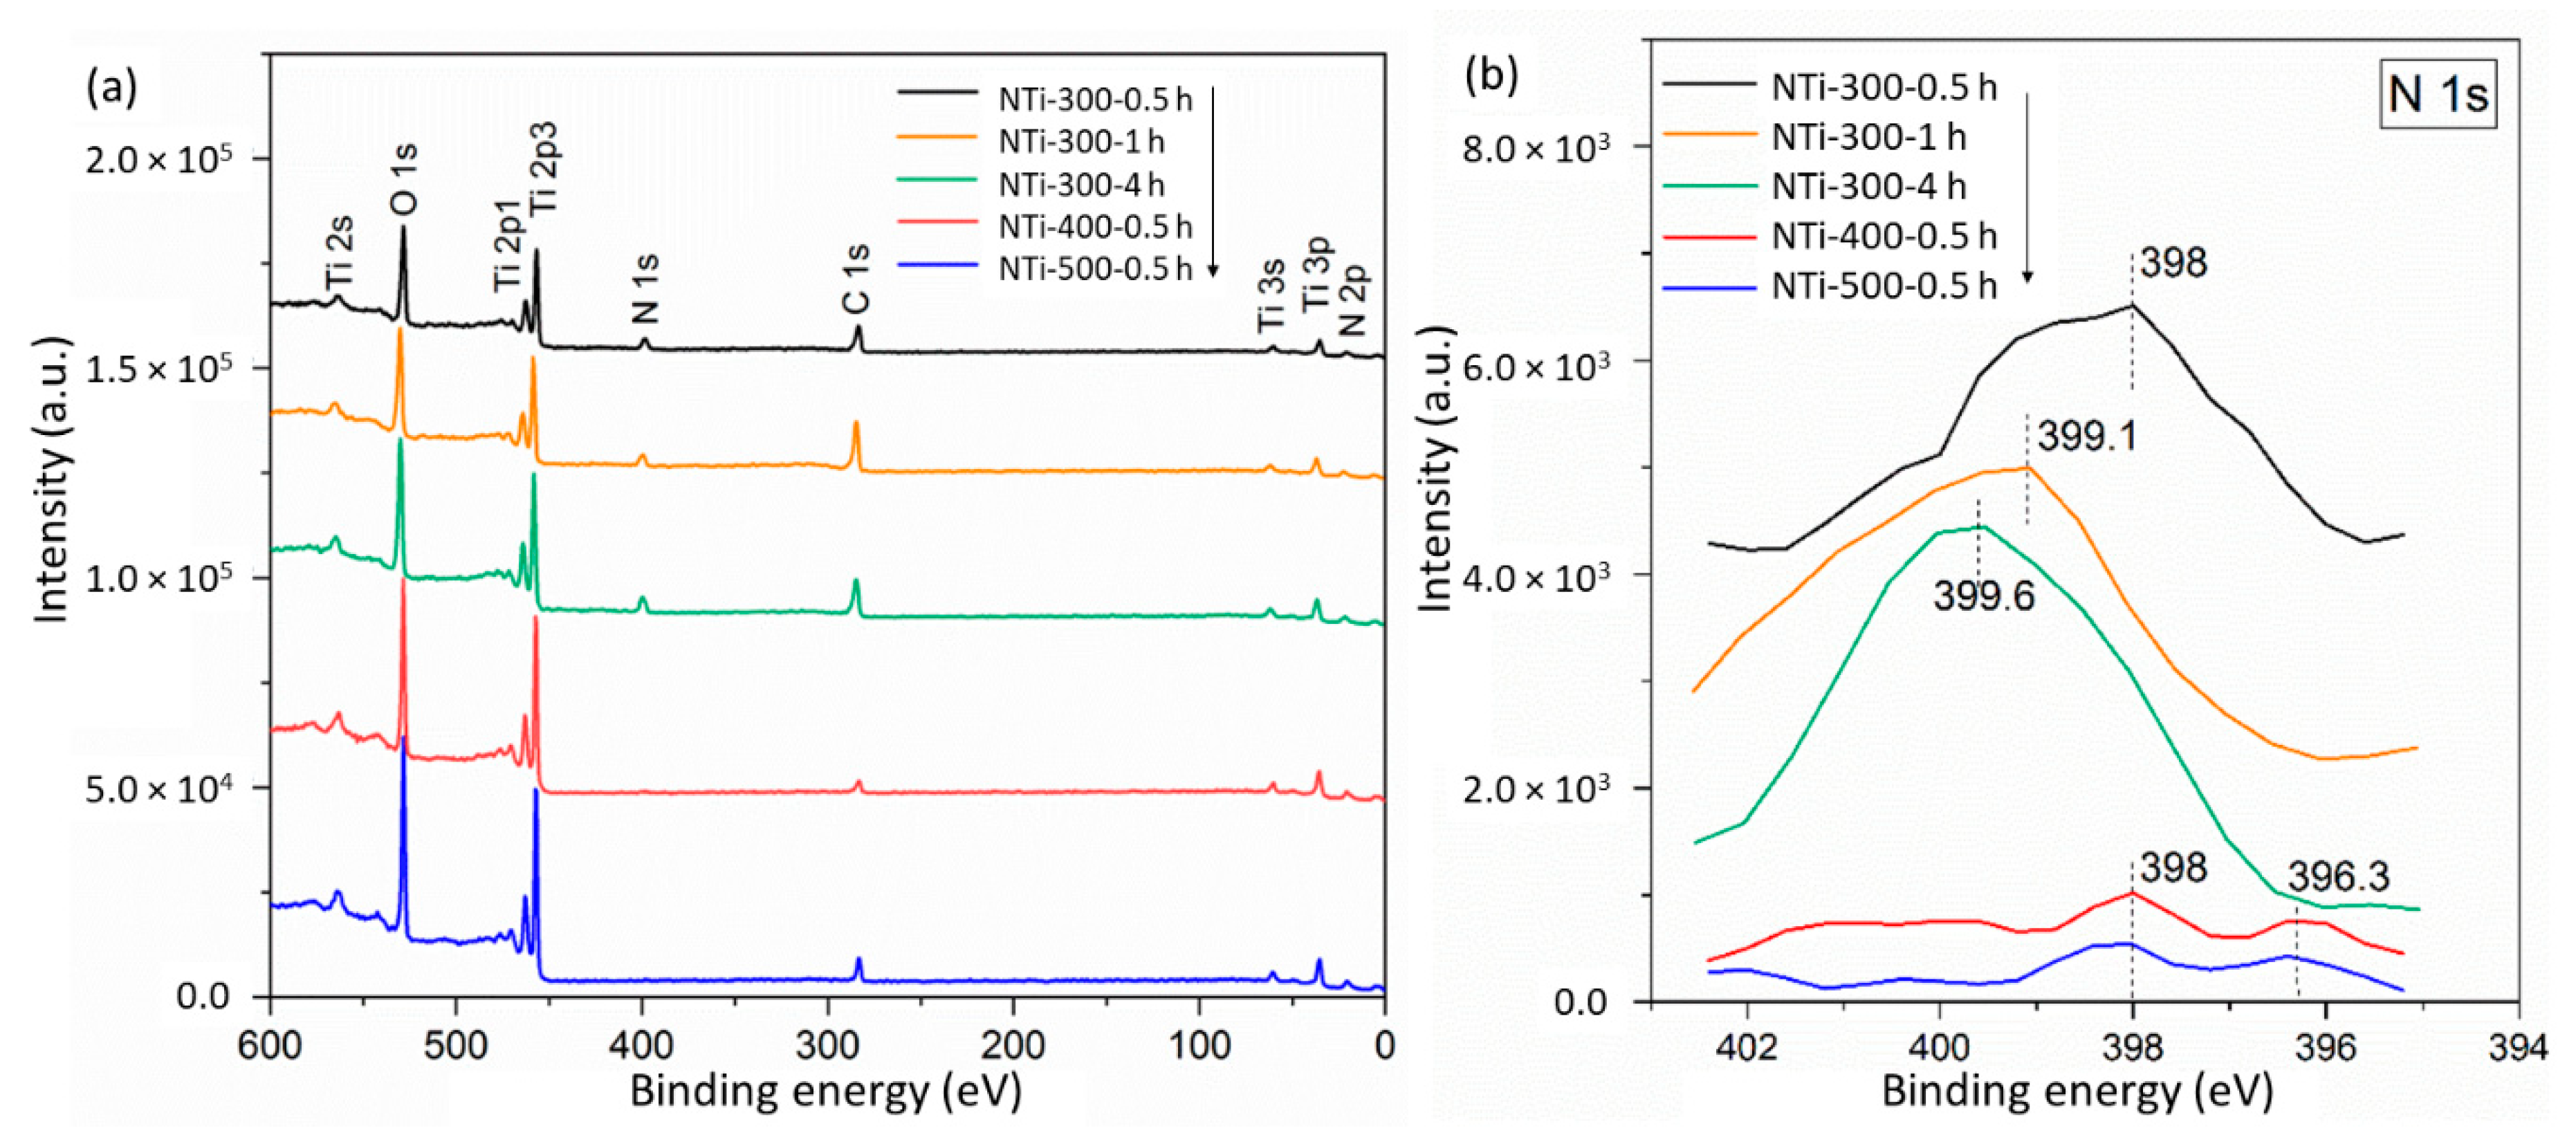
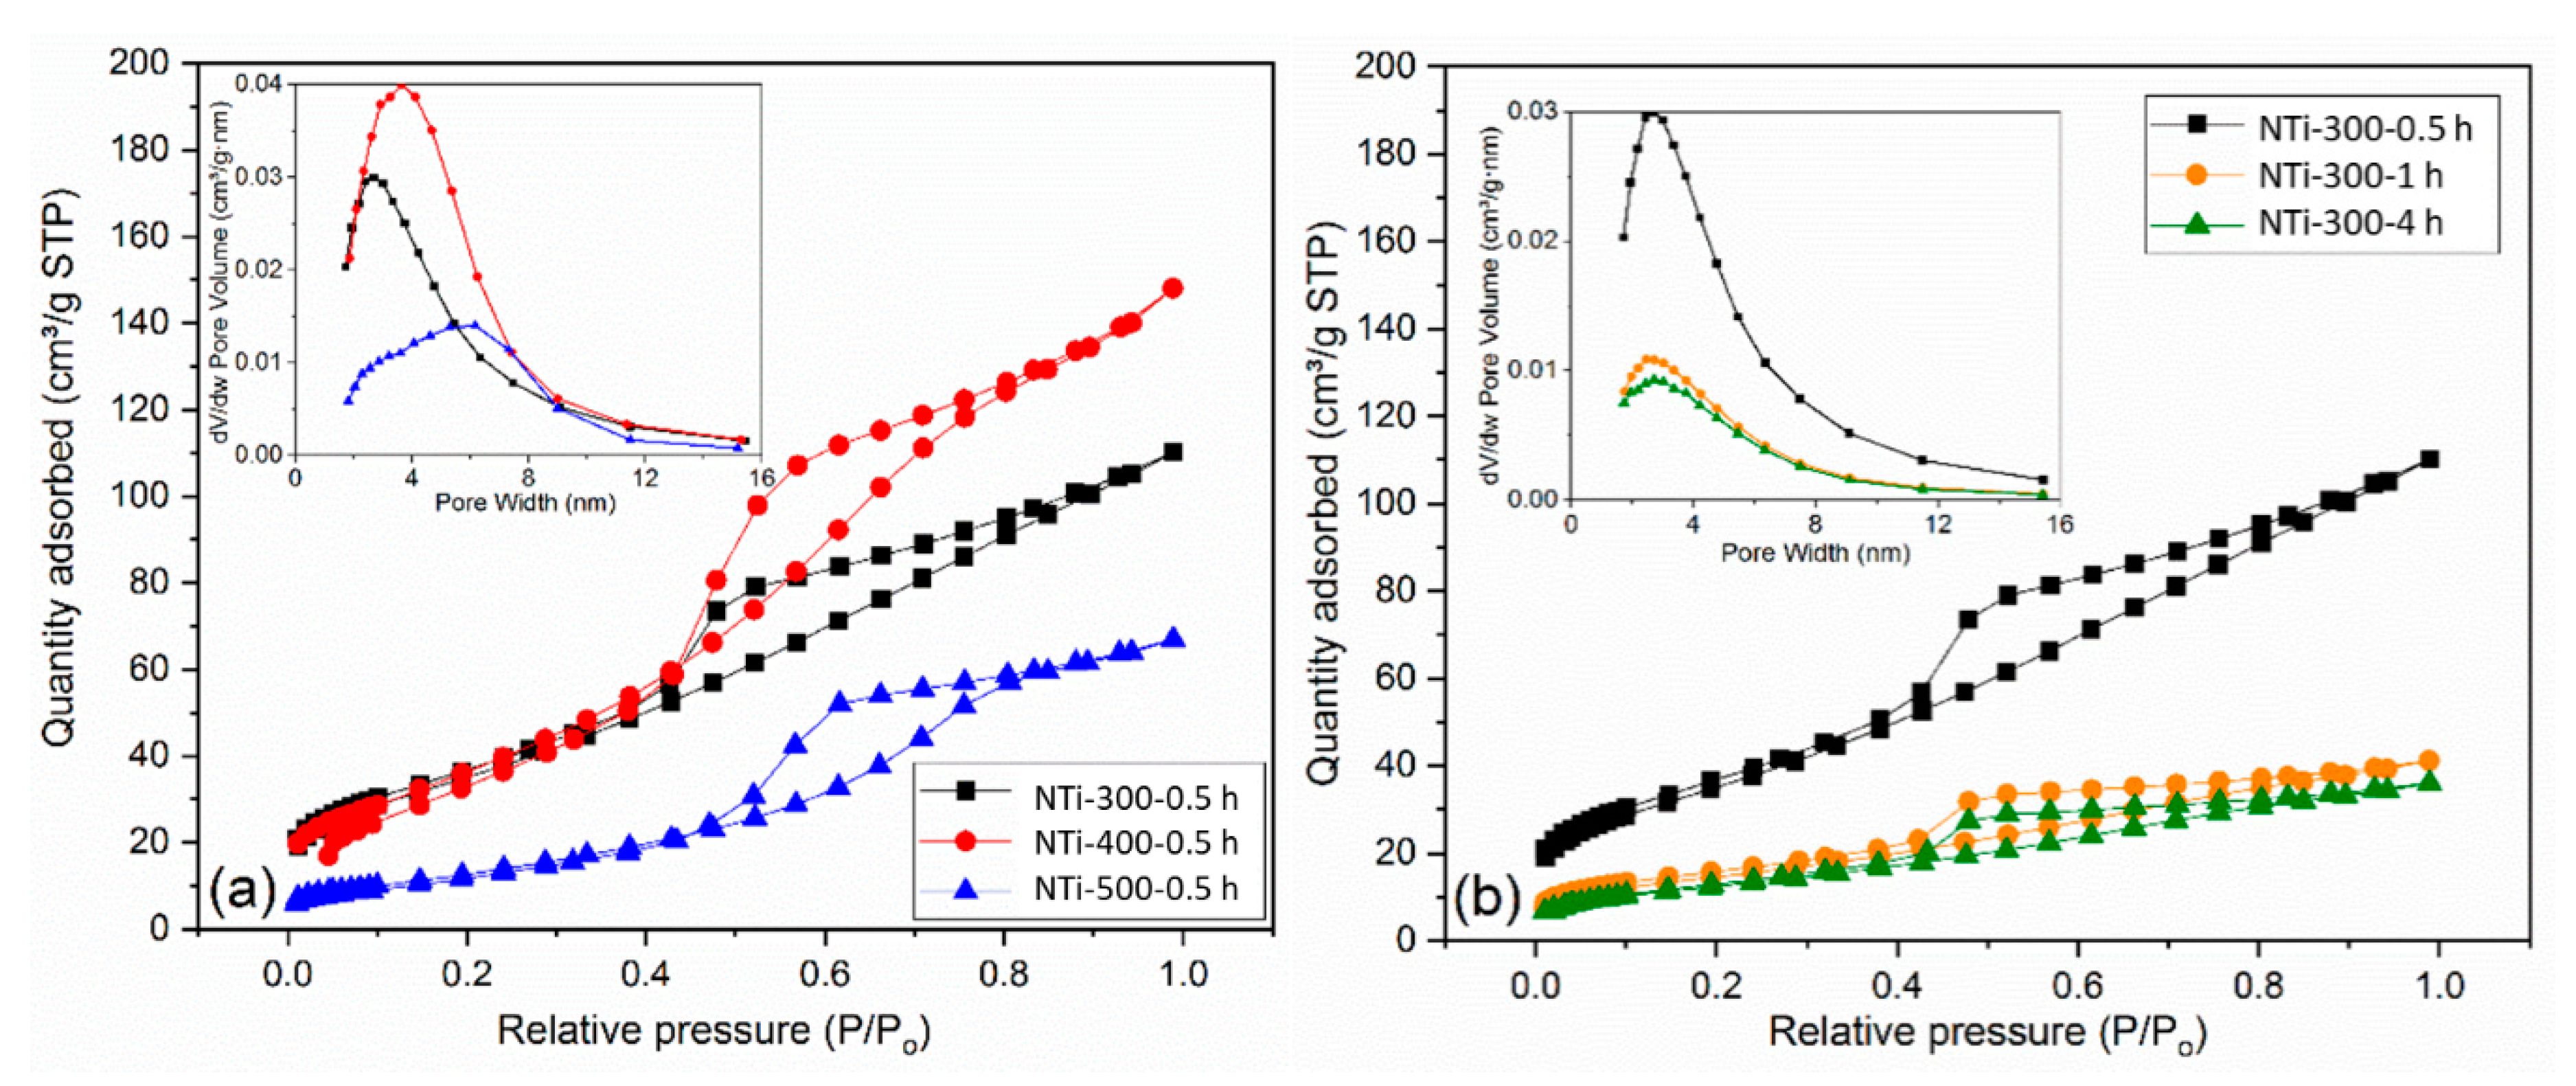
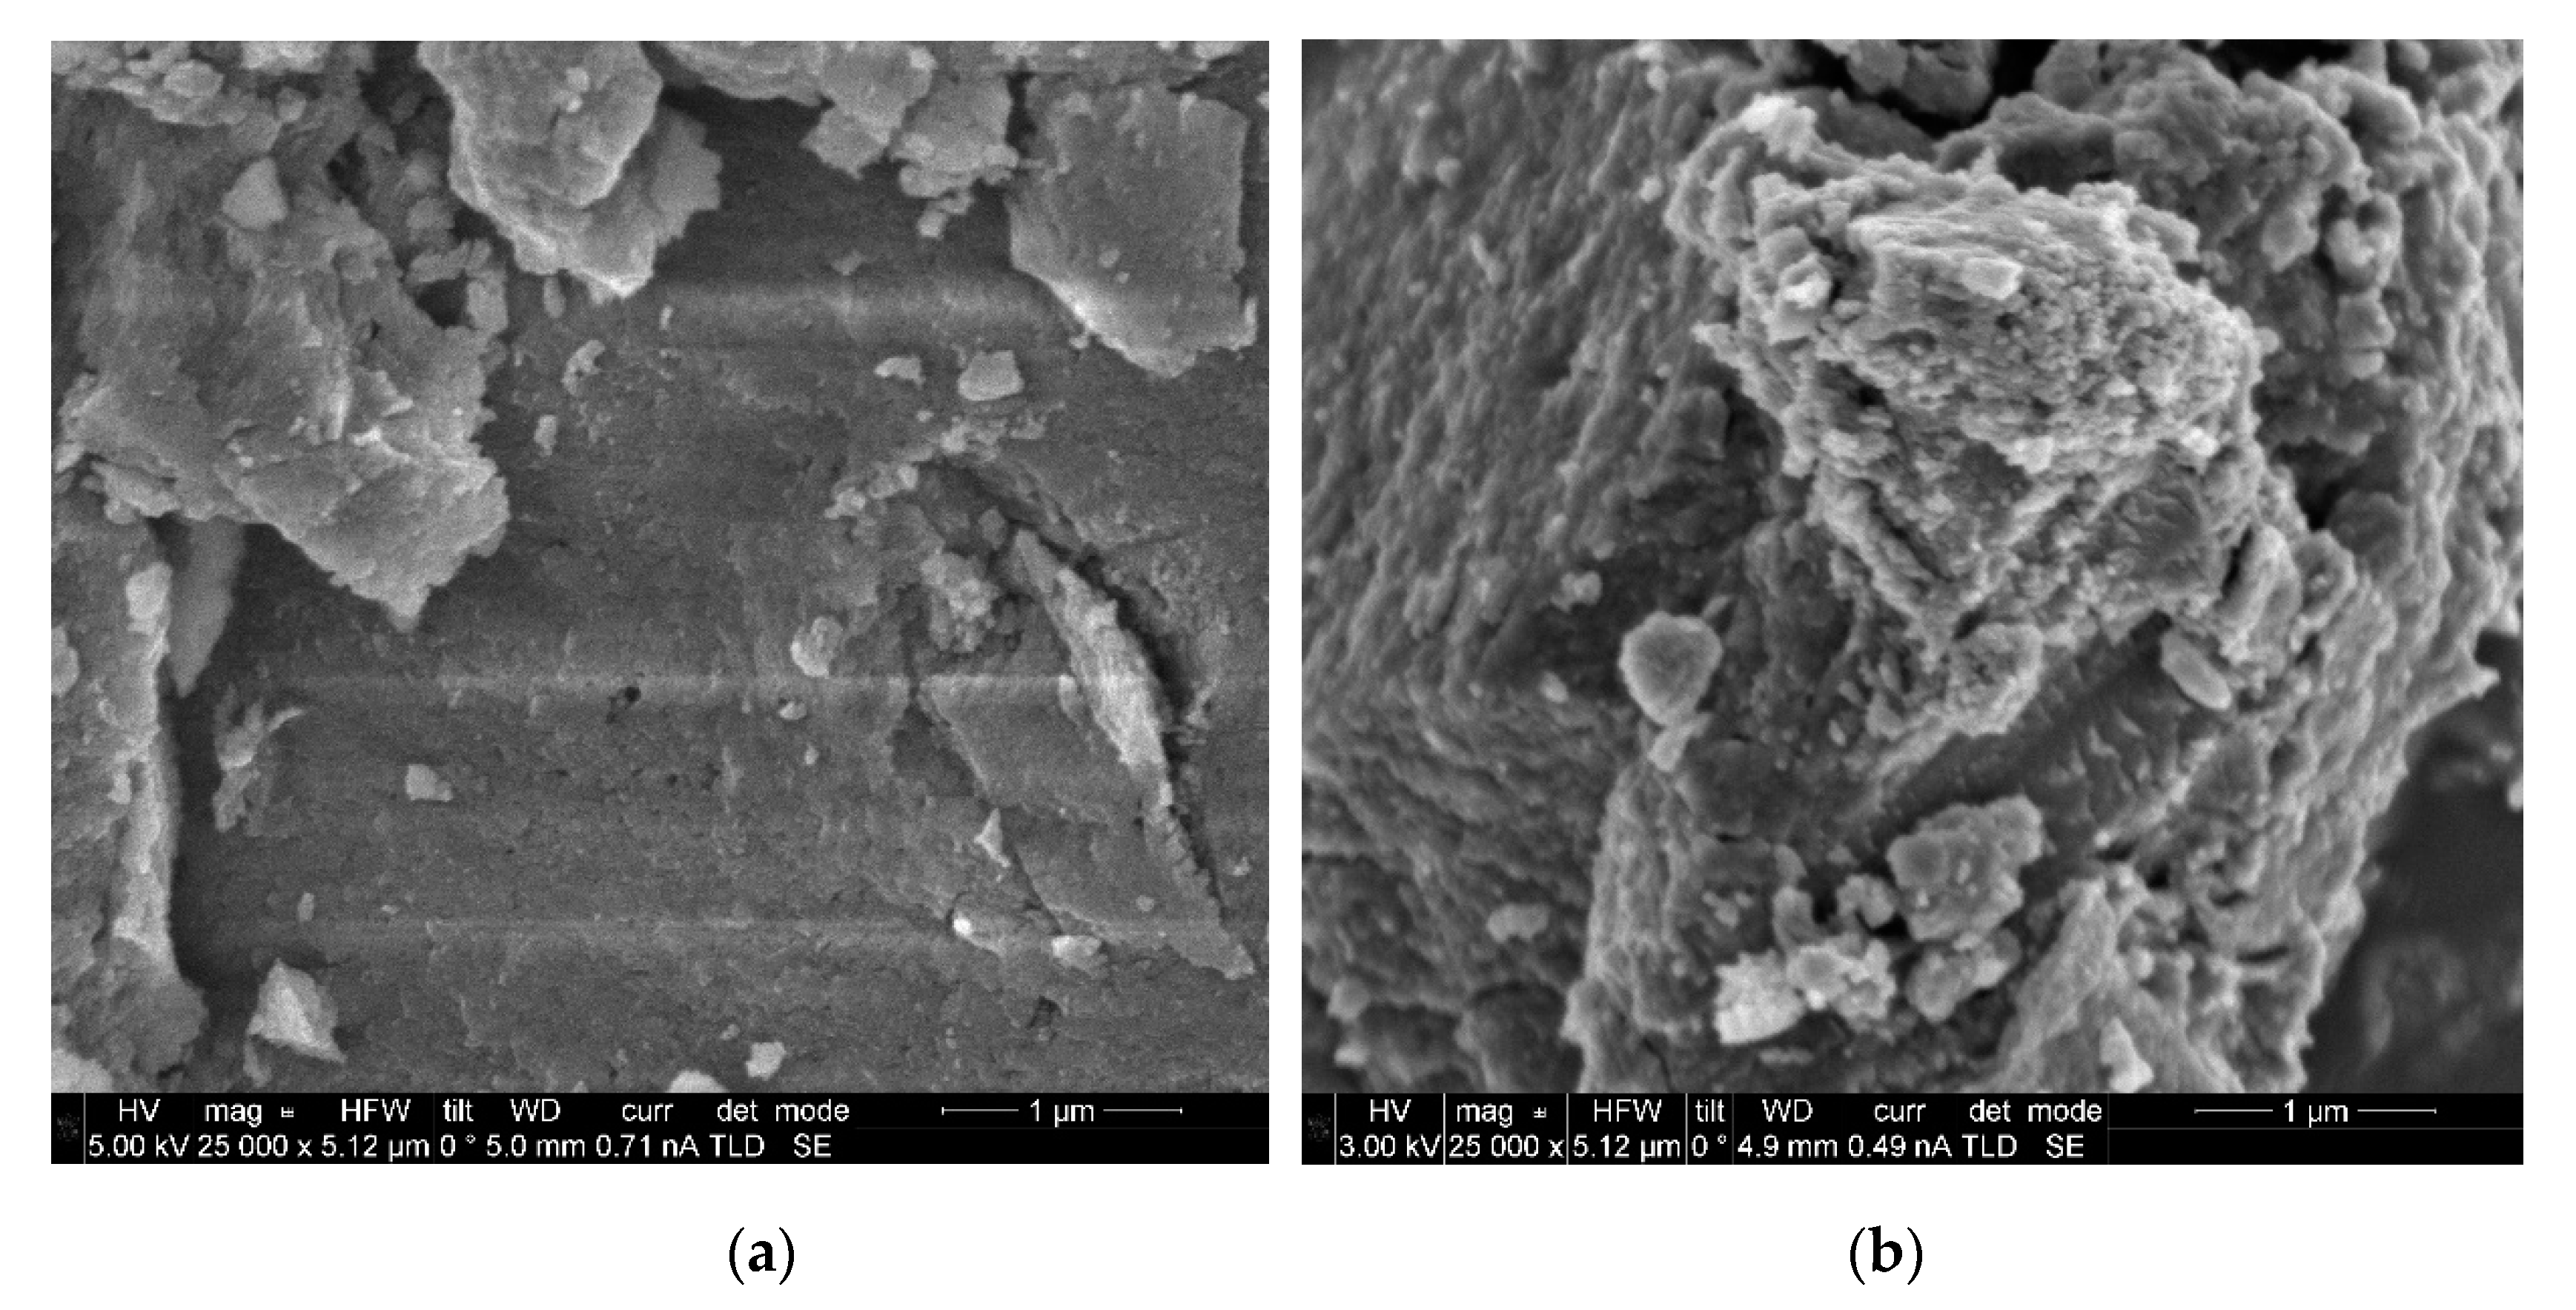
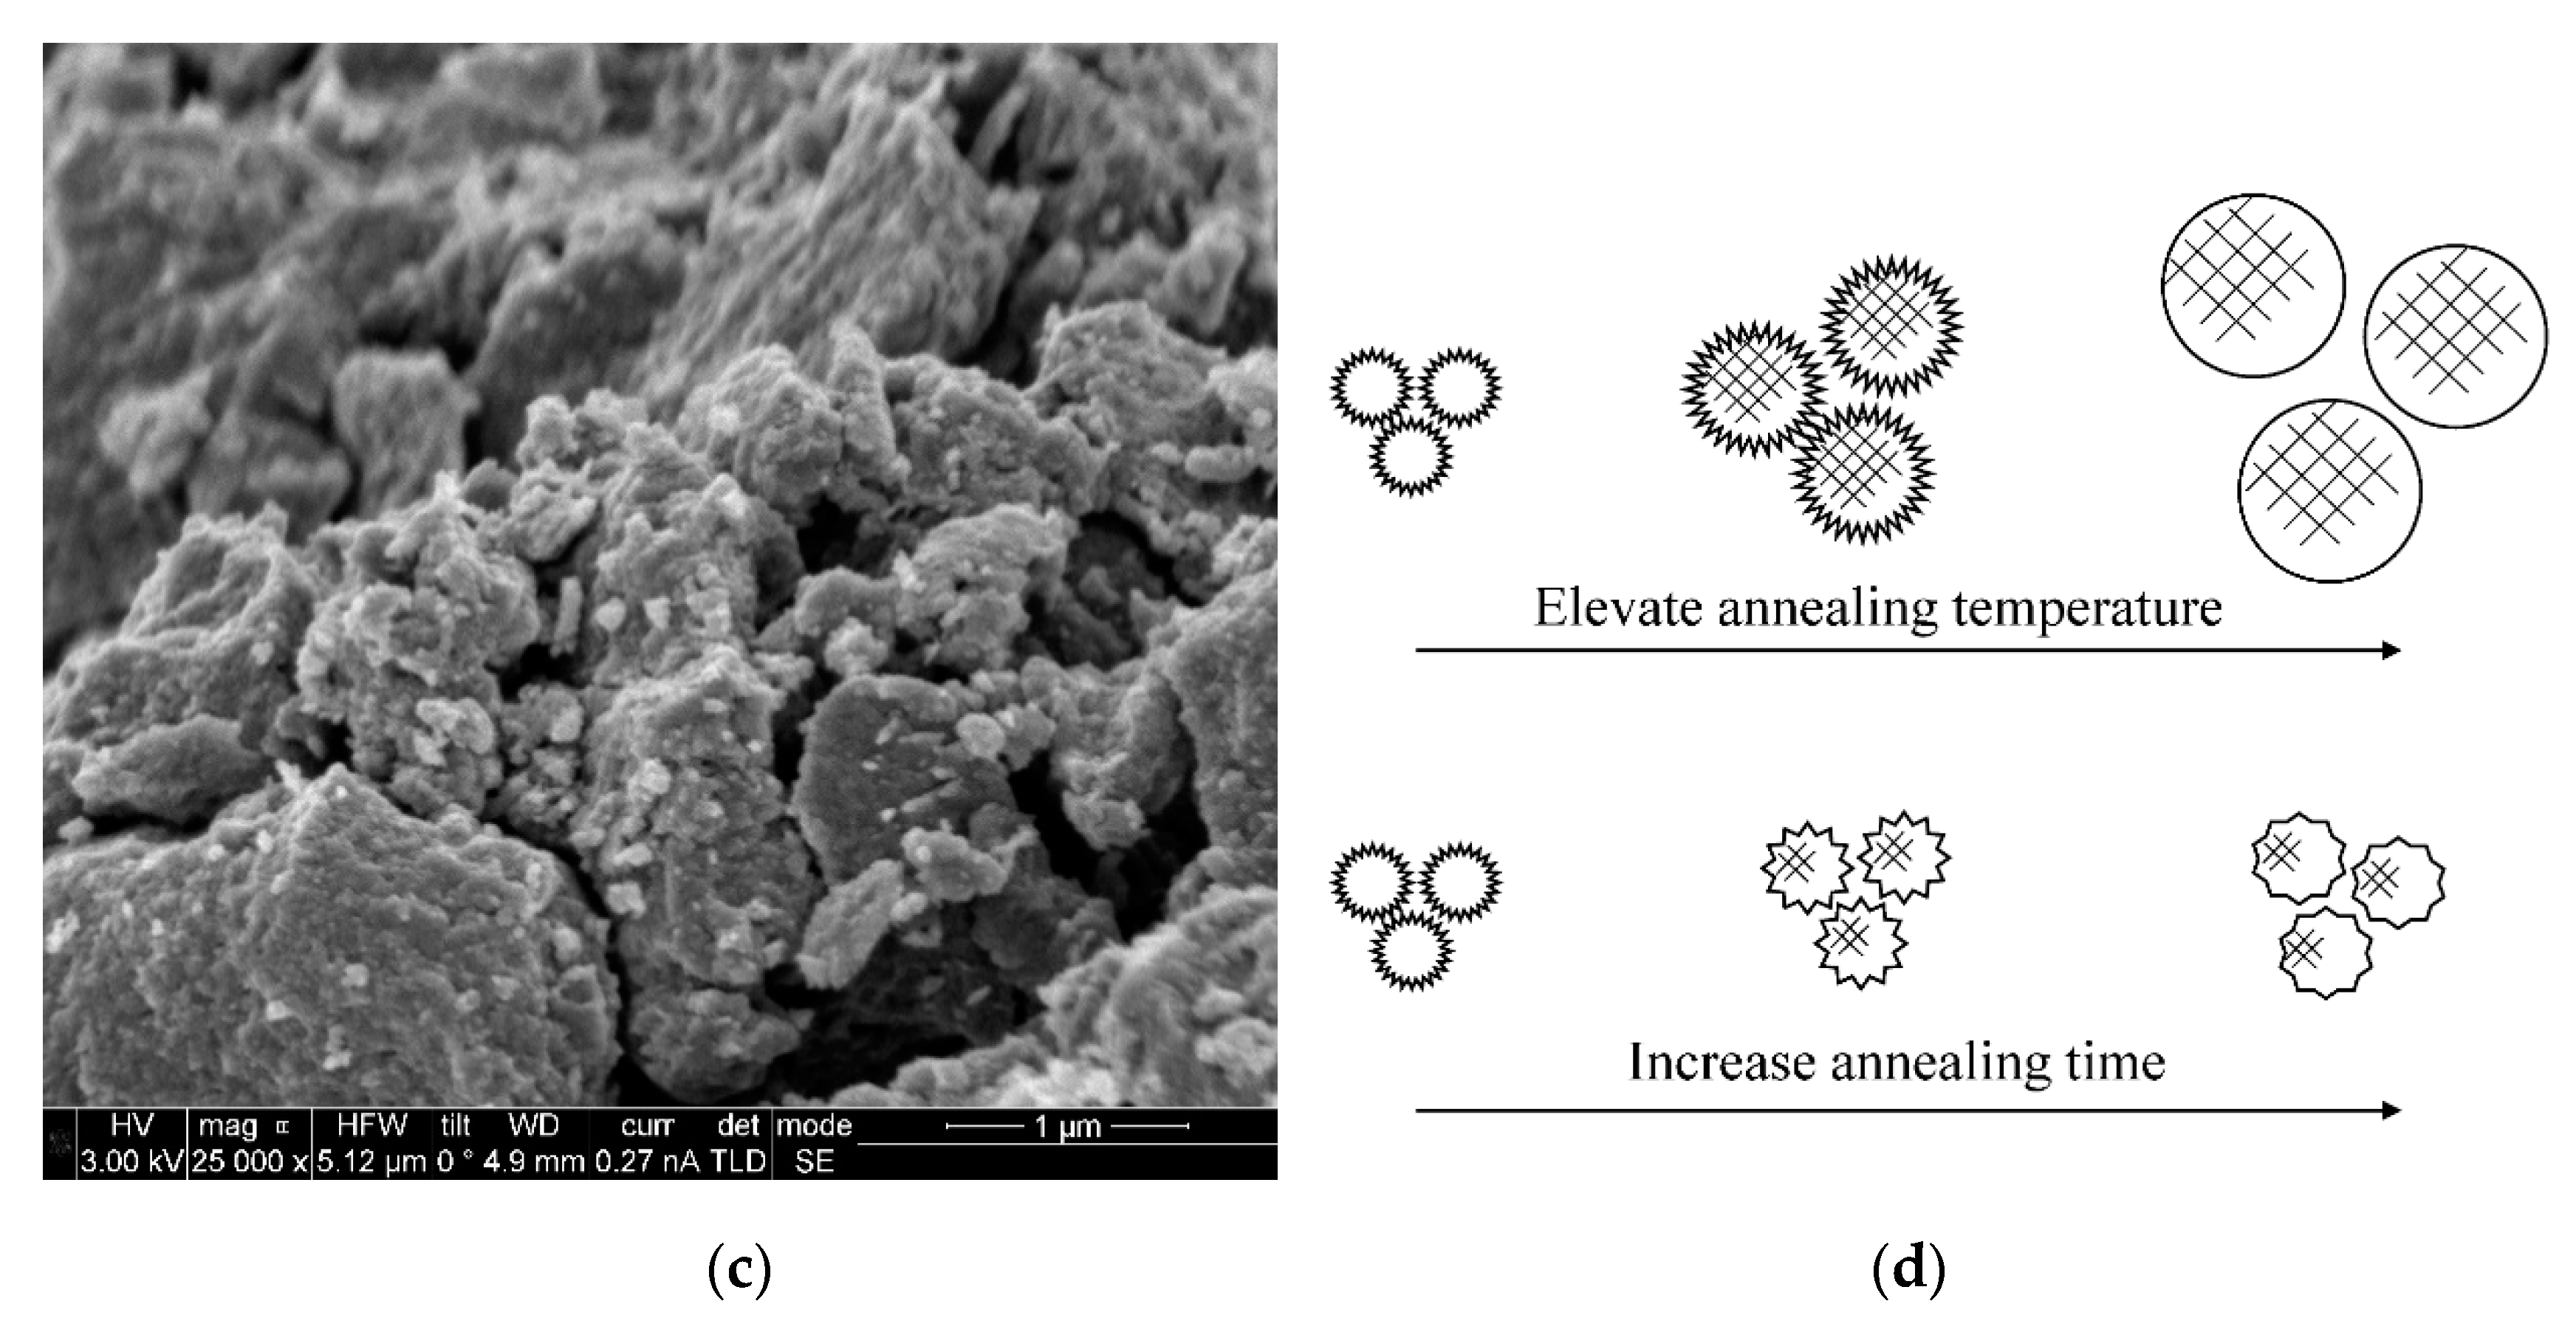
2.1. Characterization of N-TiO2 Photocatalysts

The pXRD patterns of the N-TiO2 photocatalyst annealed at different temperatures and time are shown in Figure 2. The crystallite size and degree of crystallinity were further studied. The crystallite size was estimated from the Debye–Scherrer equation:
L = K λ d · c o s θ
where L is the crystallite size, K is the crystallite shape factor, and K is usually taken as about 0.9 [28], λ is the wavelength of the X-ray, θ is the Braggs’ angle, and d is the full width at half maximum (FWHM) intensity of the pXRD peak in the unit of rad. Here, the first peak, which is the most reliable peak, was utilized in the calculation. The degree of crystallinity was estimated using Rietveld analysis that is integrated in the X-ray powder diffraction (PDXL) software:
Degree   of   crystallinity = Area   of   crystal   peaks Area   of   crystal   peaks   +   Area   of   amorphous   halo
The calculated crystallite size and degree of crystallinity are listed in Table 1. The pXRD results illustrate that as the annealing temperature increases, the crystallinity of N-TiO2 increases as well, and they show a single anatase phase. In the meantime, the crystallite size increases significantly with increased annealing temperature. This indicates that a higher temperature not only makes the grain crystallized, but also facilitates the crystallite to grow larger. However, when holding the annealing temperature at 300 °C and increasing the annealing time, the crystallinity slightly increases, but the crystallite does not grow much.
XPS was performed to analyze the chemical compositions and chemical states of the N-TiO2 powders. Figure 3a shows a comparison of the full spectra of N-TiO2 under various different annealing temperatures and time. The spectra indicate the presence of titanium, oxygen, carbon, and nitrogen elements in the three samples. The concentration of nitrogen decreases with elevated annealing temperature. This may be due to the nitrogen loss from TiO2 with a high temperature treatment.
Figure 3b reveals the N 1s spectra of five N-TiO2 photocatalysts prepared with increased annealing temperatures. For N-TiO2 annealed at 300 °C, all the three samples have a peak at a binding energy of 398 to 399.6 eV, but for NTi-400-0.5 h and NTi-500-0.5 h, they have another weaker peak at a binding energy of 396.3 eV. According to previous work [20,29], the peak between 398 and 400 eV can be attributed to the interstitial N bonding with lattice O in N-TiO2. For the peak at 396.3 eV, it comes from Ti-N bonding, which can be interpreted as substitutional N at the O lattice [20,30]. For NTi-300-0.5 h, there is a single peak at 398 eV, indicating that N is present in the N-TiO2 as interstitials. When annealed at higher temperatures, the major peak between 398 and 400 eV reduces and a second peak at 396.3 eV appears. This explains that some interstitial N is lost, and some is transformed to substitutional N during the annealing process. However, the total N content in N-TiO2, including interstitial and substitutional N, decreases with increased annealing temperature as shown in Figure 3b.
The Brunauer–Emmett–Teller (BET) surface area and Barrett–Joyner–Halenda (BJH) pore size distributions were also measured. Figure 4 shows the N2 gas adsorption–desorption isotherms of the prepared N-TiO2 photocatalysts and their corresponding pore size distributions. The BET surface area, BJH pore size, and pore volume are listed in Table 1. Figure 5a–c shows the SEM images of N-doped TiO2 annealed for 1 h under 300 °C, 400 °C, and 500 °C. With increasing annealing temperature, more crystalline particles appear in the surface of the catalyst materials.
The following observations were obtained from the experimental data via the pXRD, BET, and SEM analysis as summarized in Table 1. The effects of annealing temperature: with increasing annealing temperature, the crystallite size increases, and pore size also increases (Table 1). This implies that higher annealing temperature helps the crystalline grain size to grow. The increase of crystallite size also leads to larger intergranular pores. It was observed that the BET surface area remains similar for samples annealed at 300 °C and 400 °C. This might be due to the fact that the grain surface remains porous and unordered even though the grain grows larger and more crystalline. When the annealing temperature is increased to 500 °C, the BET surface area drops dramatically because the grains grow larger, and the grain surface becomes smooth and nonporous with high temperature treatment. The effects of annealing time: when holding the annealing temperature at 300 °C and increasing the annealing time, the BET surface area decreases, but the pore size remains similar. This implies that under the same temperature, increasing annealing time increases the degree of crystallinity but does not increase the crystallite size. As a result, more crystallized particles have a smaller surface area. Figure 5d presents the conceptual illustration of the effects of annealing temperature and annealing time on the size, crystalline morphology transformation based on the pXRD, BET, and SEM analysis. That is, increasing annealing temperature increases both the crystal size and degree of crystallinity, while increasing annealing time increases the degree of crystallinity but not the crystal size.

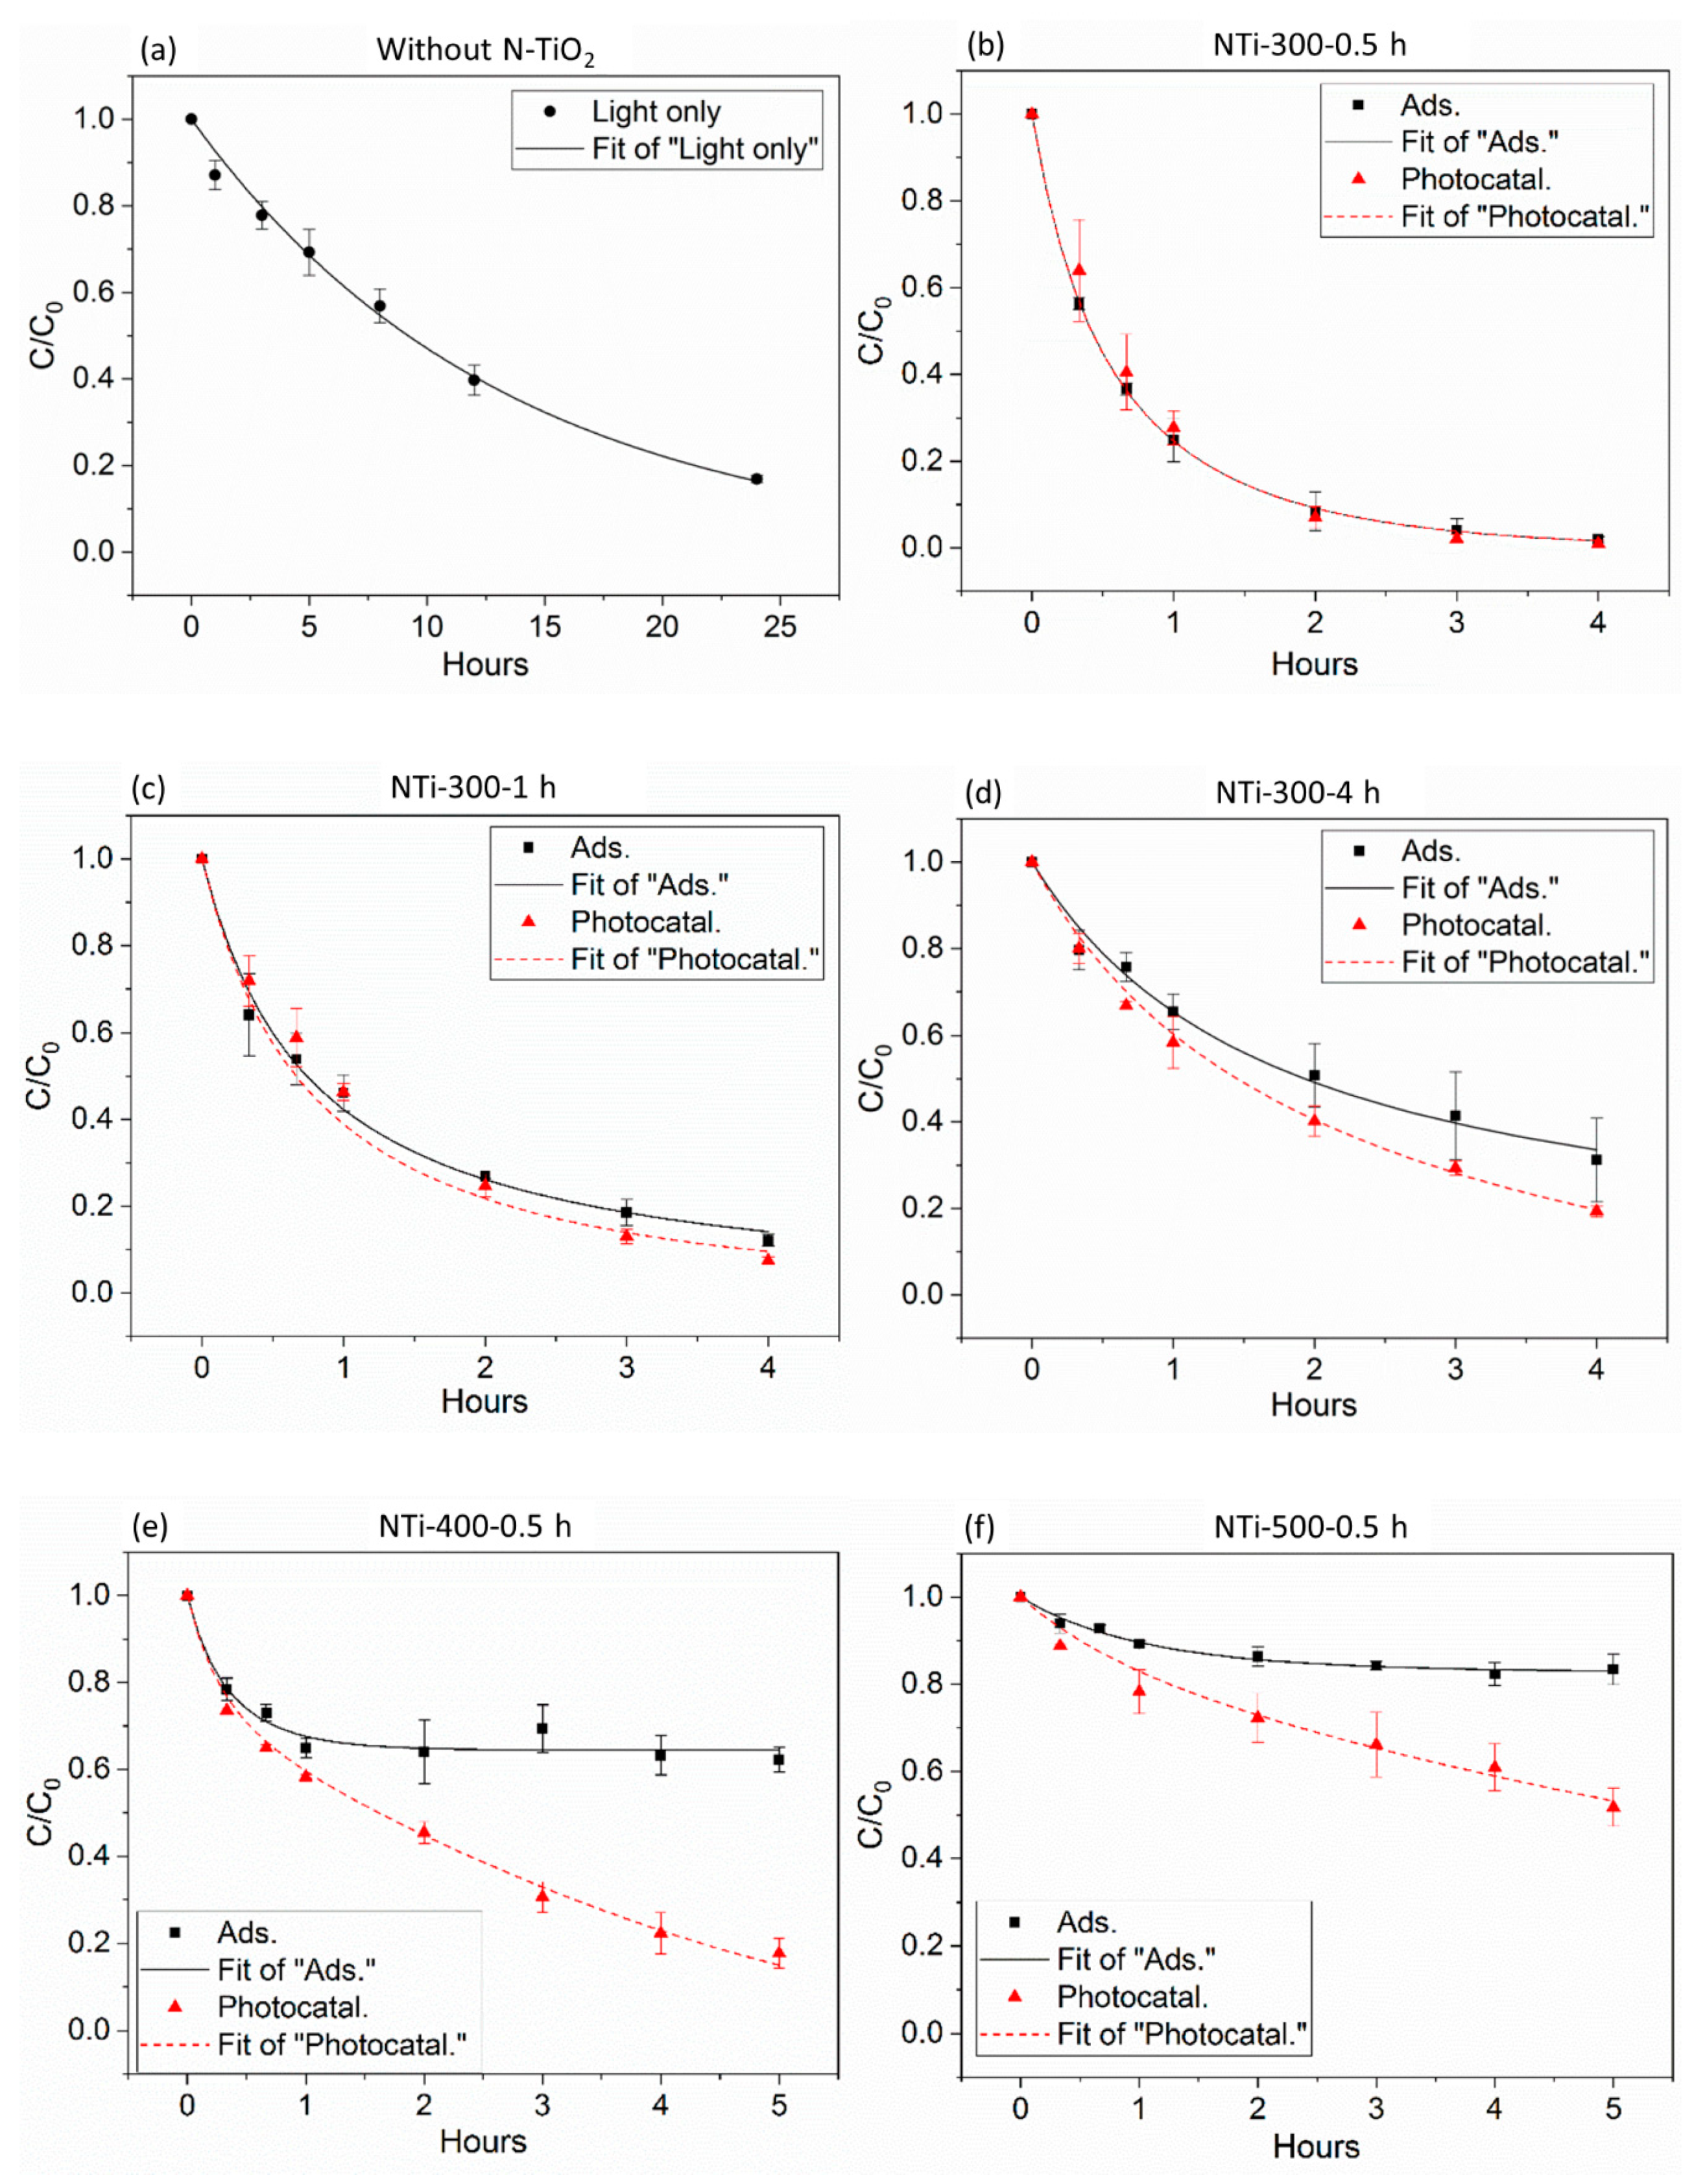
2.2. Measurement of Photocatalytic Activity and Kinetic Modeling Results

The photocatalytic activity of the N-TiO2 photocatalysts was measured with the methylene blue decomposition method, and the results are shown in Figure 6. Three experiments were carried out to measure the adsorption, photocatalysis, and direct photolysis effects. First, the photolysis rate was determined by measuring the degradation rate of methylene blue under light irradiation without N-TiO2, as shown in Figure 6a. Second, the adsorption rates of each N-TiO2 photocatalyst were measured in the dark environment, shown as black symbols in Figure 6b–f. Third, the degradation rates of methylene blue were measured with N-TiO2 photocatalysts under light irradiation, shown as red symbols in Figure 6b–f. These sets of experimental data are called “photocatalysis” but actually contain photolysis, adsorption, and photocatalytic effects.
To fit the experimental data into the kinetic model, different parameters were used in the experiments. Let us recall the meaning of rate coefficients: k1 is the adsorption rate on the photocatalyst surface, k2 is the degradation rate of the adsorbate by photocatalysis, and k3 is the photolysis rate by light irradiation. For pure photolysis rate, there are no adsorption and photocatalytic degradations, so k1 and k2 are equal to zero, and k3 can be fitted directly to experimental data. The adsorption rate k1 and total available adsorption sites CP0 of the five photocatalysts (see Figure 6) can be obtained by setting k2 and k3 as zero and fitting the adsorption experimental data to the kinetic model. After these two operations, k1, k3, and CP0 can be obtained. Finally, the photocatalytic rate k2 can be obtained from the known k1, k3, and CP0 and fitting the photocatalytic experimental data. The best-fitted parameters k1, k2, k3, and CP0 of the different N-TiO2 photocatalysts are shown in Table 2.
With increased annealing time but holding the same annealing temperature at 300 °C, the adsorption capacity, indicated by CP0, and adsorption rate, indicated by k1, both decrease as shown in Figure 6b–d and Table 2, which reveal that the adsorption effect mitigates. This can be due to increased crystallinities of N-TiO2. Holding the annealing time from 0.5 h to 4 h results in incremental crystallinity from 37% to 50%, but crystallite sizes remain stable with increased annealing time. As a result, the photocatalysts become more ordered and nonporous, which is further confirmed by the BET results. BET shows that the surface area of N-TiO2 decreases with increased annealing time. On the other hand, N-TiO2 annealed at 300 °C for a longer annealing time shows a better photocatalytic activity, indicated by k2. Actually, the adsorption and photocatalysis results as shown in Figure 6 coincide for NTi-300-0.5 h and NTi-300-1 h, which implies that the photocatalytic activities of those two photocatalysts are very limited, and the removal of the contaminants mainly comes from adsorption. With a longer annealing time, N-TiO2 photocatalysts become more crystalline and ordered, which helps the separation of electrons and holes generated by the photocatalysis reaction. Therefore, the photocatalytic activity increases with increased annealing time.
Upon holding the annealing time for 0.5 h and increasing the annealing temperatures from 300 °C to 500 °C, the adsorption effects of N-TiO2 dramatically mitigate as shown in Figure 6b,e,f and Table 2. The adsorption capacity, CP0, decreases down to a tenth, which implies fewer adsorption sites on the photocatalyst surface. This is due to higher crystallinity and larger crystallites confirmed by pXRD analysis. However, the photocatalytic activities first increase but later decrease with increased annealing temperatures, because a higher annealing temperature not only assists the crystallization of N-TiO2 but also leads to a loss of the doped nitrogen content, which weakens the visible-light-driven photocatalytic activity. Therefore, annealing at intermediate temperature, e.g., 400 °C, results in a better photocatalytic activity.
Overall, the adsorption and photocatalytic performance are relevant to the microstructure and doped nitrogen content in the N-TiO2 photocatalysts. Crystallinity and doped nitrogen amounts are two dominant factors that affect the photocatalytic activity of N-TiO2. The characteristic properties of N-TiO2 can be tuned by altering the annealing temperature and time. The annealing parameters should be appropriately selected to reach a compromise between nitrogen content and microstructure to obtain better photocatalytic activity.

3. Experimental Approach

3.1. Photocatalyst Preparation

N-TiO2 photocatalysts were synthesized via the sol–gel method as described in a previous publication [31,32]. A colorless precursor solution containing 4 mL of titanium isopropoxide (97%, Sigma-Aldrich, St. Louis, MO, USA), 20 mL ethylenediamine (99%, Strem Chemicals, Inc., Newburyport, MA, USA), and 150 mL of 1-hexanol (anhydrous, Sigma-Aldrich) was refluxed for 18 h under Ar gas environment. The yellow-colored solution was cooled to the room temperature. To adjust the OH concentration before hydrolysis, acetic acid (Fisher Scientific, Waltham, MA, USA) was added into the solution. The precursor solution needs approximately 30 mL of acetic acid to neutralize the excess ethylenediamine used during reaction, which was confirmed by a pH paper test. The resulting solutions were hydrolyzed by drop-wise adding 58 mL of distilled water. The synthesized slurries were centrifuged at 7000 rpm with 60 mL distilled water and 40 mL ethanol (100% concentration, Decon Labs, Inc., King of Prussia, PA, USA) for 10 min, respectively. The slurries were left to air dry overnight inside the fume hood and then dried in an oven set at 80 °C. After that, the samples were annealed in the air at 300 °C, 400 °C, and 500 °C for 0.5 h, 1 h, and 4 h, respectively. The annealing process was achieved in a tube furnace (Thermo Scientific Lindberg, Columbia, MD, USA). The heating rate was set as 1 °C min−1, and the cooling rate was set as 2 °C min−1. The N-TiO2 photocatalysts were obtained with different annealing temperatures and time, which are designated NTi-x-y, where x denotes annealing temperature in °C, and y represents annealing timed in h. Finally, five photocatalysts were prepared and studied: NTi-300-0.5 h, NTi-300-1 h, NTi-300-4 h, NTi-400-0.5 h, and NTi-500-0.5 h. All the reagents used in this study were used without further purification.

3.2. Photocatalyst Characterization

The concentration and chemical state of the nitrogen dopant were analyzed with a PHI Versaprobe 5000 Scanning X-ray Photoelectron Spectrometer (XPS) using a monochromatic Al Kα source operated at 45 W. The powder X-ray diffraction (pXRD) analysis was carried out with a Rigaku MiniFlex powder X-ray diffractometer using Cu-Kα radiation (wavelength is 0.154 nm). The Brunauer–Emmett–Teller (BET) specific surface area and Barrett–Joyner–Halenda (BJH) pore size distribution were measured based on N2 gas adsorption and desorption by using Micromeritics TriStar II 3020.

3.3. Measurement of Photocatalytic Activities

The photocatalytic activities of the N-TiO2 were measured by the degradation of the methylene blue aqueous solution (Sigma-Aldrich). The visible light source was a 52 W LED (Tadd, LLC, Cary, IL, USA) with the wavelength between 400 and 700 nm. The photocatalytic performance was analyzed by adding 10 mg photocatalyst powder into 25 mL of 15 mg L−1 methylene blue aqueous solution (0.4 g/L). The reaction suspension was placed 5 cm below the LED light with magnetic stirring. At each given time interval, small amounts of the samples were collected after filtering suspension with 0.22 μm syringe filter, and absorbance spectra of the solutions were measured using a Cary 60 UV-Vis spectrophotometer. The dynamic process of the photocatalyst adsorbing methylene blue was measured in the dark environment as the same step described above. To evaluate the photodegradation of methylene blue by the light only, the experiment was conducted without adding the photocatalyst.

3.4. Model of Adsorption and Photocatalysis

Degradation of water contaminant (C) under light irradiance in the presence of photocatalyst proceeds in two steps. The first step involves the adsorption of the contaminant molecules on the photocatalyst surface. The vacant adsorption sites (P) are occupied and become occupied sites (CP):
C + P C P
In the second step, the adsorbed contaminant is decomposed under the light irradiation, and thus, the occupied adsorption sites turn back to vacancy:
C P l i g h t P
In addition to the photocatalysis process, the contaminant can also be decomposed by direct light irradiation. Overall, we define three reaction rate constants in this model: (1) k1—adsorption rate on the photocatalyst surface; (2) k2—decomposition rate of adsorbed contaminant by the photocatalysis; and (3) k3—direct photolysis by light in the solution. The governing equations for describing the reaction rate of this systems yield:
d C C d t = k 1 · C C · C P k 3 · C C
d C P d t = k 1 · C C · C P + k 2 · C C P
where CC (mol m−3) is the concentration of the methylene blue, CP (mol m−3) is the concentration of unoccupied adsorption sites in the photocatalyst, and CC−P (mol m−3) is the concentration of occupied adsorption sites by methylene blue in the photocatalyst. The total adsorption sites including occupied and unoccupied sites are fixed when a certain amount of photocatalyst is added:
C C P + C P = C P 0
By substituting C in Equation (7) into Equation (6), Equation (6) can be written as:
d C P d t = k 1 · C C · C P + k 2 · ( C P 0 C P )
For better interpretation of the variables, nondimensionalization is derived by substituting CC and CP with C C * = C C C C 0 and C P * = C P C P 0 . Therefore, Equations (3) and (6) are converted to a coupled system:
d C C * d t = k 1 C P 0   C C *   C P * k 3 C C *
d C P * d t = k 1 C C 0   C C *   C P * + k 2 ( 1 C P * )
where CC* and CP* are the dimensionless concentrations of contaminant and unoccupied adsorption sites in the photocatalyst, respectively. CC0 and CP0 (mol m−3) are corresponding the initial concentrations of contaminant and adsorption sites. We used MATHEMATICA to solve system of Equations (7) and (8), and rate coefficients k1, k2, and k3 by fitting experimental data to the model solutions were estimated.

4. Conclusions

Nitrogen-doped TiO2 photocatalysts were synthesized via the sol–gel method and a post-annealing heat treatment approach. The effects of annealing temperature and annealing time are characterized for their influence on the microstructure and surface chemical composition of the fabricated photocatalysts. These characteristics are relevant to the adsorption and photocatalysis effects of the nitrogen-doped TiO2 photocatalysts. The kinetics of adsorption, photocatalysis, and direct photolysis mechanisms were measured with the methylene blue decomposition method. A kinetic model was built to distinguish the impacts of these three mechanisms on the removal of contaminants. The modeling and experimental results show that a higher annealing temperature leads not only to less adsorption, but also loss of interstitial nitrogen. Therefore, annealing temperature should be appropriately selected to reach a tradeoff between nitrogen content and microstructure facilitating catalytic performance.

Author Contributions

Conceptualization, X.Y.; methodology, Z.J., A.C.S.S., D.G., and X.Y.; validation, Z.J.; formal analysis, S.W., Y.H.T., and Z.J.; writing—original draft preparation, Z.J.; writing—review and editing, X.Y.; supervision, X.Y.; funding acquisition, X.Y. and A.C.S.S. All authors have read and agreed to the published version of the manuscript.

Funding

This work is supported by US National Science Foundation with an award number 1563238.

Acknowledgments

We would like to thank Burcu Gurkan and Yun-Yang Lee in the Department of Chemical and Biomolecular Engineering at Case Western Reserve University for helping the BET measurement.

Conflicts of Interest

The authors declare no conflict of interest.

References

  1. Ji, J.; Xu, Y.; Huang, H.; He, M.; Liu, S.; Liu, G.; Xie, R.; Feng, Q.; Shu, Y.; Zhan, Y.; et al. Mesoporous TiO2 under VUV irradiation: Enhanced photocatalytic oxidation for VOCs degradation at room temperature. Chem. Eng. J. 2017, 327, 490–499. [Google Scholar] [CrossRef]
  2. Ao, C.H.; Lee, S.C.; Yu, J.Z.; Xu, J.H. Photodegradation of formaldehyde by photocatalyst TiO2: Effects on the presences of NO, SO2 and VOCs. Appl. Catal. B Environ. 2004, 54, 41–50. [Google Scholar] [CrossRef]
  3. Jiménez-Tototzintle, M.; Ferreira, I.J.; Duque, S.D.S.; Barrocas, P.R.G.; Saggioro, E.M. Removal of contaminants of emerging concern (CECs) and antibiotic resistant bacteria in urban wastewater using UVA/TiO2/H2O2 photocatalysis. Chemosphere 2018, 210, 449–457. [Google Scholar] [CrossRef] [PubMed]
  4. Corena, J.R.A.; Bergendahl, J.A.; Hart, F.L. Advanced oxidation of five contaminants in water by UV/TiO2: Reaction kinetics and byproducts identification. J. Environ. Manag. 2016, 181, 544–551. [Google Scholar] [CrossRef] [PubMed]
  5. Dong, H.; Zeng, G.; Tang, L.; Fan, C.; Zhang, C.; He, X.; He, Y. An overview on limitations of TiO2-based particles for photocatalytic degradation of organic pollutants and the corresponding countermeasures. Water Res. 2015, 79, 128–146. [Google Scholar] [CrossRef] [PubMed]
  6. Ohama, Y.; Van Gemert, D. Application of Titanium Dioxide Photocatalysis to Construction Materials: State-of-the-Art Report of the RILEM Technical Committee 194-TDP; Springer Science and Business Media: Berlin/Heidelberg, Germany, 2011. [Google Scholar]
  7. Karácsonyi, É.; Baia, L.; Dombi, A.; Danciu, V.; Mogyorósi, K.; Pop, L.C.; Pap, Z. The photocatalytic activity of TiO2/WO3/noble metal (Au or Pt) nanoarchitectures obtained by selective photodeposition. Catal. Today 2013, 208, 19–27. [Google Scholar] [CrossRef]
  8. Quill, J.; Fedor, G.; Brennan, P.; Everett, E. Quantifying the Indoor Light Environment. Q-Lab Corporation. 2007. Available online: https://www.q-lab.com/documents/public/1e85c327-1aa2-4e87-808e-df04653e4d5e.pdf (accessed on 10 December 2020).
  9. Pimputkar, S.; Speck, J.S.; DenBaars, S.P.; Nakamura, S. Prospects for LED lighting. Nat. Photon. 2009, 3, 180–182. [Google Scholar] [CrossRef]
  10. Gascon, J.; SantaClara, J.; Oar-Arteta, L.; Van Koppen, L.; Osadchii, D.; Gascon, J.; Kapteijn, F. Photocatalytic properties of TiO2 and Fe-doped TiO2 prepared by metal organic framework-mediated synthesis. Chem. Eng. J. 2019, 360, 75–88. [Google Scholar] [CrossRef]
  11. Karafas, E.S.; Romanias, M.N.; Stefanopoulos, V.; Binas, V.; Zachopoulos, A.; Kiriakidis, G.; Papagiannakopoulos, P. Effect of metal doped and co-doped TiO2 photocatalysts oriented to degrade indoor/outdoor pollutants for air quality improvement. A kinetic and product study using acetaldehyde as probe molecule. J. Photochem. Photobiol. A Chem. 2019, 371, 255–263. [Google Scholar] [CrossRef]
  12. Wang, N.; Li, X.; Yang, Y.; Guo, T.; Zhuang, X.; Ji, S.; Zhang, T.; Shang, Y.; Zhou, Z. Enhanced photocatalytic degradation of sulfamethazine by Bi-doped TiO2 nano-composites supported by powdered activated carbon under visible light irradiation. Sep. Purif. Technol. 2019, 211, 673–683. [Google Scholar] [CrossRef]
  13. Islam, S.Z.; Nagpure, S.; Kim, D.-Y.; Rankin, S.E. Synthesis and Catalytic Applications of Non-Metal Doped Mesoporous Titania. Inorganics 2017, 5, 15. [Google Scholar] [CrossRef]
  14. Peng, X.; Wang, M.; Hu, F.; Qiu, F.; Dai, H.; Cao, Z. Facile fabrication of hollow biochar carbon-doped TiO2/CuO composites for the photocatalytic degradation of ammonia nitrogen from aqueous solution. J. Alloys Compd. 2019, 770, 1055–1063. [Google Scholar] [CrossRef]
  15. Jo, W.-K.; Kim, J.-T. Application of visible-light photocatalysis with nitrogen-doped or unmodified titanium dioxide for control of indoor-level volatile organic compounds. J. Hazard. Mater. 2009, 164, 360–366. [Google Scholar] [CrossRef]
  16. Chen, C.; Bai, H.; Chang, S.-M.; Chang, C.; Den, W. Preparation of N-doped TiO2 photocatalyst by atmospheric pressure plasma process for VOCs decomposition under UV and visible light sources. J. Nanoparticle Res. 2007, 9, 365–375. [Google Scholar] [CrossRef]
  17. Fisher, M.B.; Keane, D.A.; Fernández-Ibáñez, P.; Colreavy, J.; Hinder, S.J.; McGuigan, K.G.; Pillai, S.C. Nitrogen and copper doped solar light active TiO2 photocatalysts for water decontamination. Appl. Catal. B Environ. 2013, 130, 8–13. [Google Scholar] [CrossRef] [Green Version]
  18. Choi, H.; Antoniou, M.G.; Pelaez, M.; De La Cruz, A.A.; Shoemaker, J.A.; Dionysiou, D.D. Mesoporous Nitrogen-Doped TiO2 for the Photocatalytic Destruction of the Cyanobacterial Toxin Microcystin-LR under Visible Light Irradiation. Environ. Sci. Technol. 2007, 41, 7530–7535. [Google Scholar] [CrossRef] [PubMed]
  19. Reddy, P.A.K.; Reddy, P.V.L.; Sharma, V.M.; Srinivas, B.; Kumari, V.D.; Subrahmanyam, M. Photocatalytic Degradation of Isoproturon Pesticide on C, N and S Doped TiO2. J. Water Resour. Prot. 2010, 2, 235–244. [Google Scholar] [CrossRef] [Green Version]
  20. Asahi, R.; Morikawa, T.; Irie, H.; Ohwaki, T. Nitrogen-Doped Titanium Dioxide as Visible-Light-Sensitive Photocatalyst: Designs, Developments, and Prospects. Chem. Rev. 2014, 114, 9824–9852. [Google Scholar] [CrossRef]
  21. Schneider, J.; Matsuoka, M.; Takeuchi, M.; Zhang, J.; Horiuchi, Y.; Anpo, M.; Bahnemann, D.W. Understanding TiO2 Photocatalysis: Mechanisms and Materials. Chem. Rev. 2014, 114, 9919–9986. [Google Scholar] [CrossRef]
  22. Hashimoto, K.; Irie, H.; Fujishima, A. TiO2 Photocatalysis: A Historical Overview and Future Prospects. Jpn. J. Appl. Phys. 2005, 44, 8269–8285. [Google Scholar] [CrossRef]
  23. Trouts, T.D.; Chin, Y.-P. Direct and indirect photolysis of triclocarban in the presence of dissolved organic matter. Elem. Sci. Anthr. 2015, 3, 000050. [Google Scholar] [CrossRef]
  24. Liu, Q.-T.; Williams, H.E. Kinetics and Degradation Products for Direct Photolysis of β-Blockers in Water. Environ. Sci. Technol. 2007, 41, 803–810. [Google Scholar] [CrossRef] [PubMed]
  25. Kumar, K.V.; Porkodi, K.; Rocha, F. Langmuir–Hinshelwood kinetics—A theoretical study. Catal. Commun. 2008, 9, 82–84. [Google Scholar] [CrossRef]
  26. Coleman, H.M.; Eggins, B.R.; Byrne, J.A.; Palmer, F.L.; King, E. Photocatalytic degradation of 17-β-oestradiol on immobilised TiO2. Appl. Catal. B Environ. 2000, 24, L1–L5. [Google Scholar] [CrossRef]
  27. Yu, T.; Tan, X.; Zhao, L.; Yin, Y.; Chen, P.; Wei, J. Characterization, activity and kinetics of a visible light driven photocatalyst: Cerium and nitrogen co-doped TiO2 nanoparticles. Chem. Eng. J. 2010, 157, 86–92. [Google Scholar] [CrossRef]
  28. Holzwarth, U.; Gibson, N.W. The Scherrer equation versus the ‘Debye-Scherrer equation’. Nat. Nanotechnol. 2011, 6, 534. [Google Scholar] [CrossRef]
  29. Zhou, X.; Peng, F.; Wang, H.; Yu, H.; Yang, J. Preparation of nitrogen doped TiO2 photocatalyst by oxidation of titanium nitride with H2O2. Mater. Res. Bull. 2011, 46, 840–844. [Google Scholar] [CrossRef]
  30. Cheng, X.; Yu, X.; Xing, Z.; Yang, L. Synthesis and characterization of N-doped TiO2 and its enhanced visible-light photocatalytic activity. Arab. J. Chem. 2016, 9, S1706–S1711. [Google Scholar] [CrossRef]
  31. Zhao, Y.; Qiu, X.; Burda, C. The Effects of Sintering on the Photocatalytic Activity of N-Doped TiO2 Nanoparticles. Chem. Mater. 2008, 20, 2629–2636. [Google Scholar] [CrossRef]
  32. Qiu, X.; Burda, C. Chemically synthesized nitrogen-doped metal oxide nanoparticles. Chem. Phys. 2007, 339, 1–10. [Google Scholar] [CrossRef]
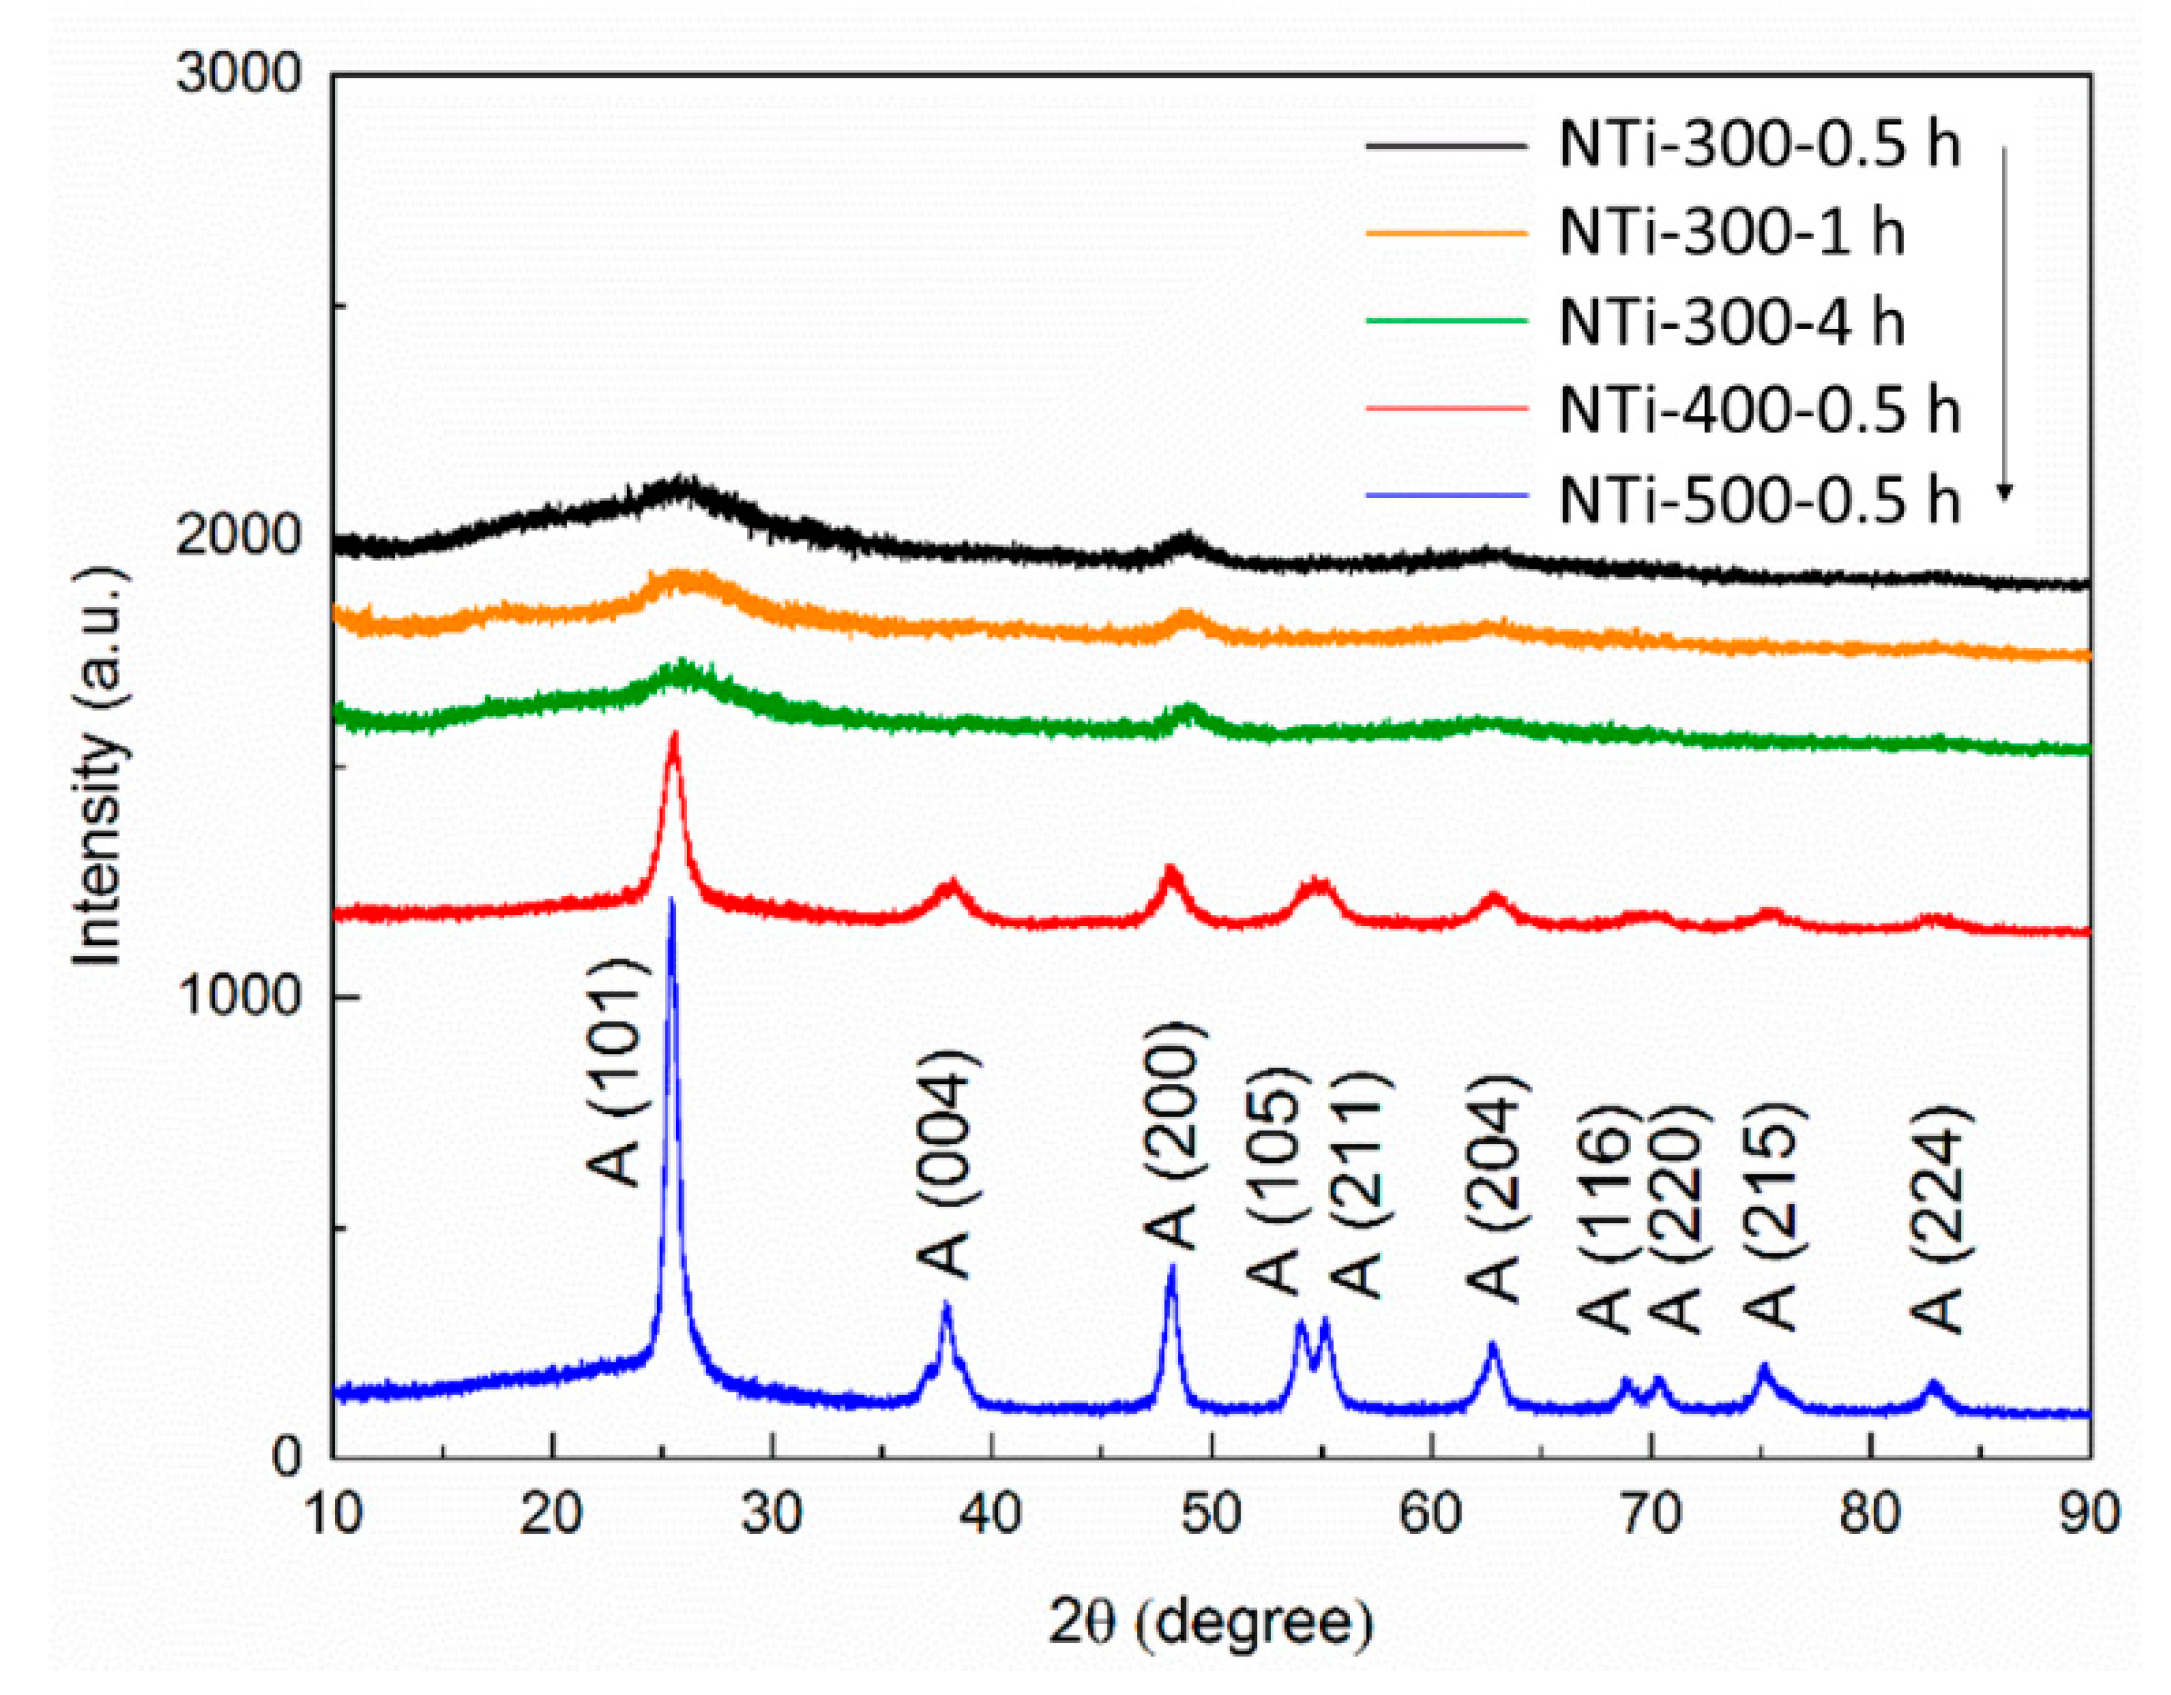
Figure 1. Schematic of the different mechanisms involved in the degradation of contaminants by N-TiO2 photocatalysts.
Catalysts 10 01449 g001
Figure 2. The pXRD spectra of the N-TiO2 photocatalysts. Black: NTi-300-0.5 h, Orange: NTi-300-1 h, Green: NTi-300-4 h, Red: NTi-400-0.5 h, Blue: NTi-500-0.5 h.
Catalysts 10 01449 g002
Figure 3. The XPS results of N-TiO2. (a) Full spectra and (b) N 1 s spectra. Black: NTi-300-0.5 h, Orange: NTi-300-1 h, Green: NTi-300-4 h, Red: NTi-400-0.5 h, Blue: NTi-500-0.5 h.
Catalysts 10 01449 g003
Figure 4. The N2 adsorption–desorption isotherms: (a) N-TiO2 with different annealing temperatures, and (b) N-TiO2 with different annealing time. Inserted in (a,b) are pore size distributions. Black: NTi-300-0.5 h, Orange: NTi-300-1 h, Green: NTi-300-4 h, Red: NTi-400-0.5 h, Blue: NTi-500-0.5 h.
Catalysts 10 01449 g004
Figure 5. (ac) SEM image of N-doped TiO2 annealed for 1 h under 300 °C, 400 °C, and 500 °C respectively. (d) Schematic illustration of the effect of annealing temperature and time on the size and morphology of N-TiO2.
Catalysts 10 01449 g005aCatalysts 10 01449 g005b
Figure 6. The adsorption and photocatalytic measurement of N-TiO2 photocatalysts. (a) Methylene blue solution without N-TiO2 irradiation by light, (b) NTi-300-0.5 h, (c) NTi-300-1 h, (d) NTi-300-4 h, (e) NTi-400-0.5 h, and (f) NTi-500-0.5 h.
Catalysts 10 01449 g006
Table 1. The crystallite size, degree of crystallinity, Brunauer–Emmett–Teller (BET) surface area, and Barrett–Joyner–Halenda (BJH) pore size of N-TiO2.
PhotocatalystsCrystallite Size (nm)Degree of Crystallinity (%)BET Surface Area (m2 g−1)Average Pore Size (nm)Pore Volume (cm3 g−1)
NTi-300-0.5 h1.8237.0132.02.60.154
NTi-300-1 h2.3746.453.92.60.054
NTi-300-4 h1.9650.946.12.70.048
NTi-400-0.5 h8.4468.3143.03.80.177
NTi-500-0.5 h13.7471.857.46.00.095
Table 2. The fitted parameters of the kinetics model k1, k2, k3, and CP0 of N-TiO2.
Photocatalystsk1 (m3 mol−1 h−1)CP0 (mol m−3)k1·CP0 (h−1)k2 (h−1)k3 (h−1)
NTi-300-0.5 h30.320.06602.0011≈00.0753
NTi-300-1 h30.120.04472.3464≈0
NTi-300-4 h14.090.03830.53960.1669
NTi-400-0.5 h79.550.01411.12170.3861
NTi-500-0.5 h25.100.00680.17070.0996
Publisher’s Note: MDPI stays neutral with regard to jurisdictional claims in published maps and institutional affiliations.

