Climate Change and Its Possible Impact in Groundwater Resource of the Kankai River Basin, East Nepal Himalaya


Abstract
1. Introduction
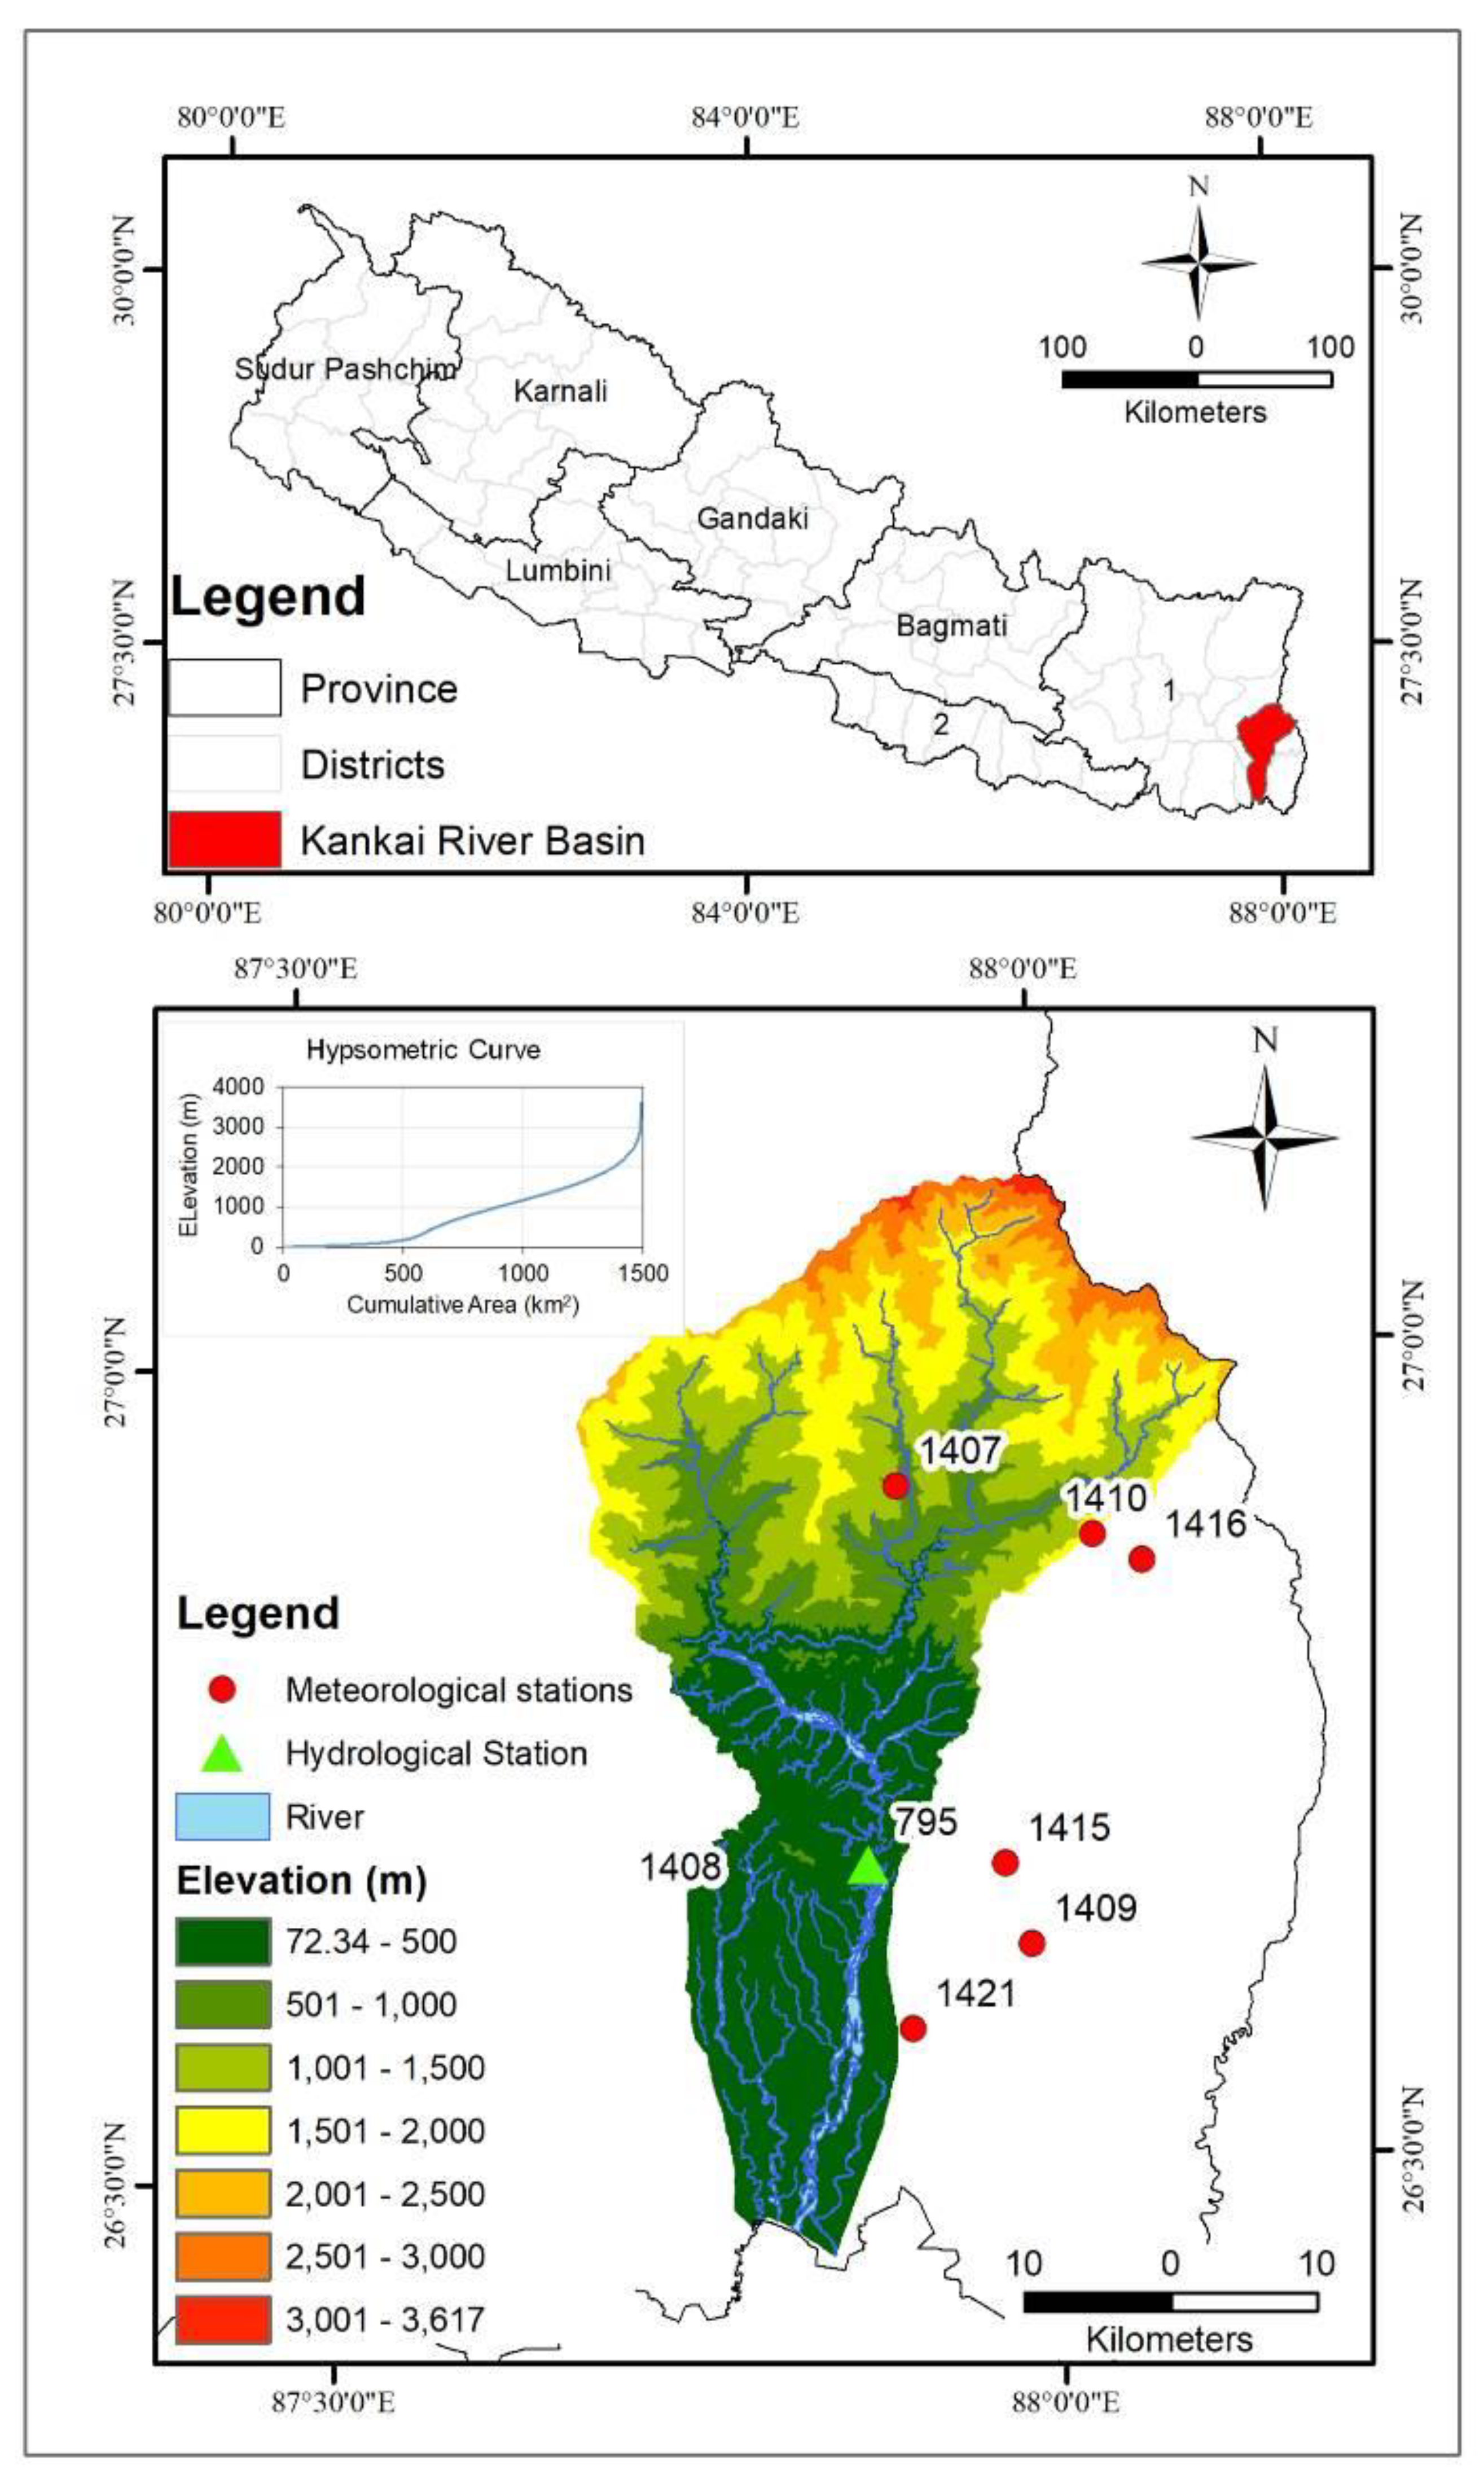
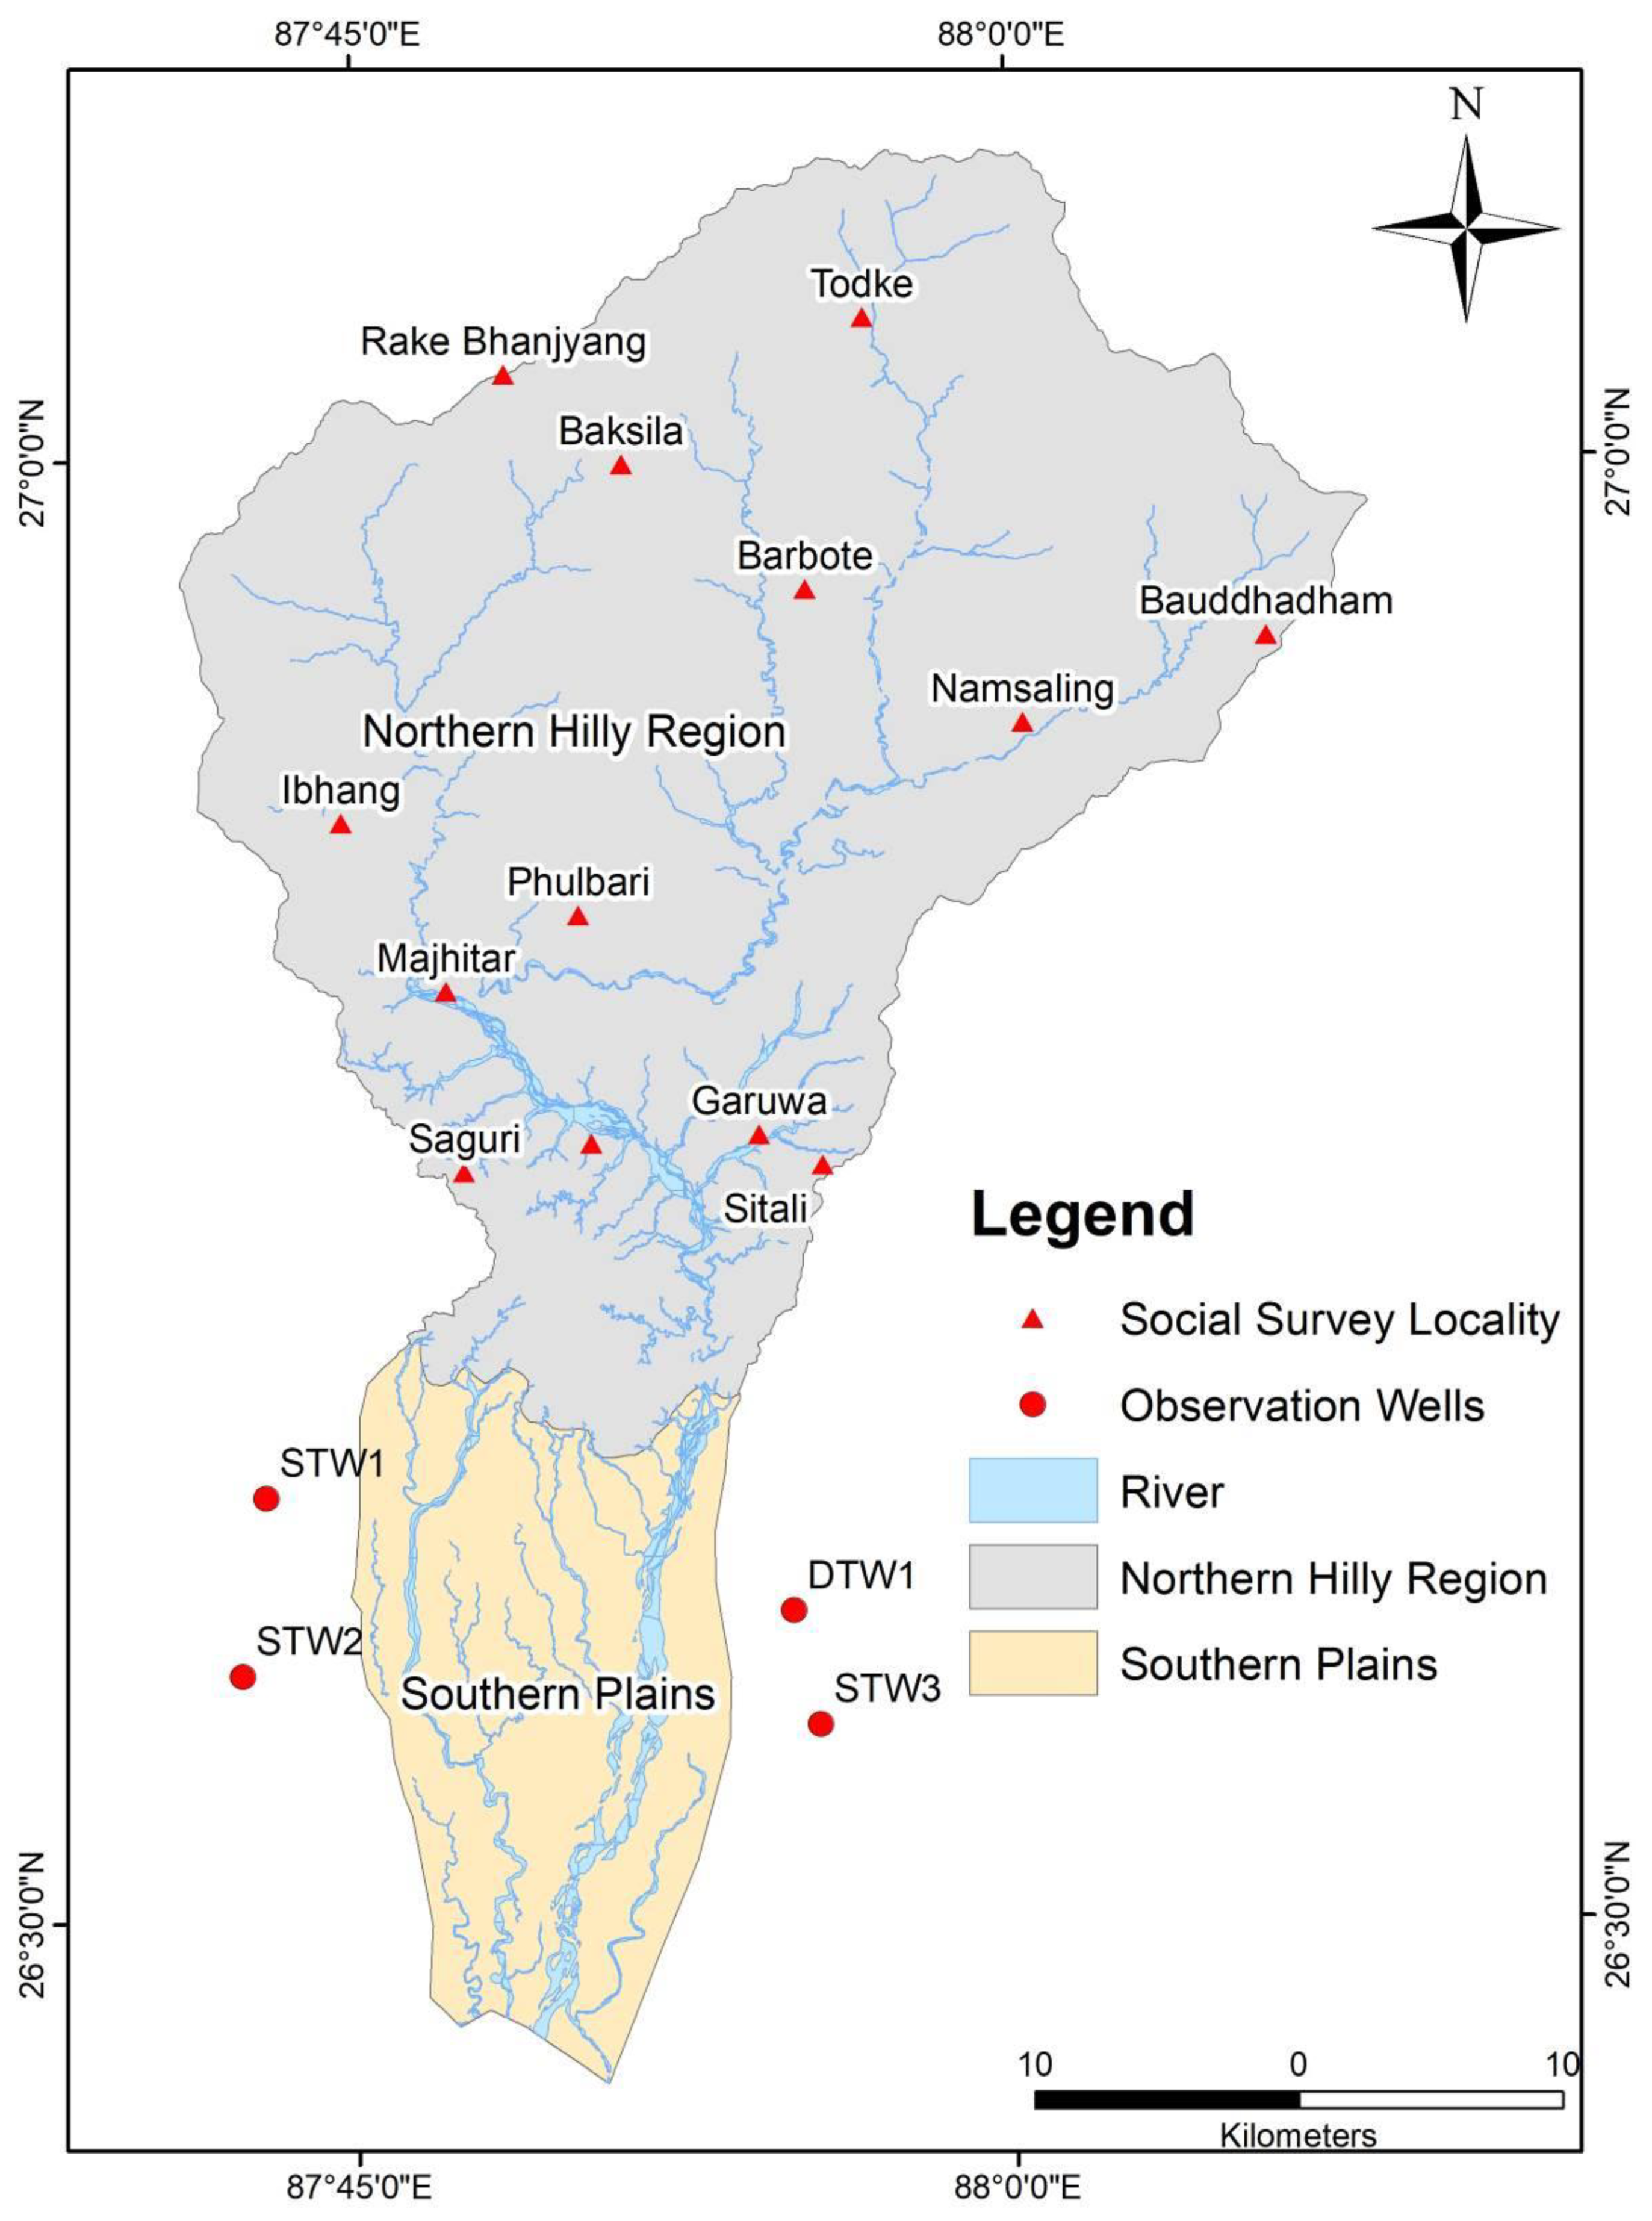
Study Area
2. Materials and Methods
2.1. Observed Hydro-Meteorological Data
2.2. Climate Change Projection
2.3. Groundwater Impact Assessment
3. Results
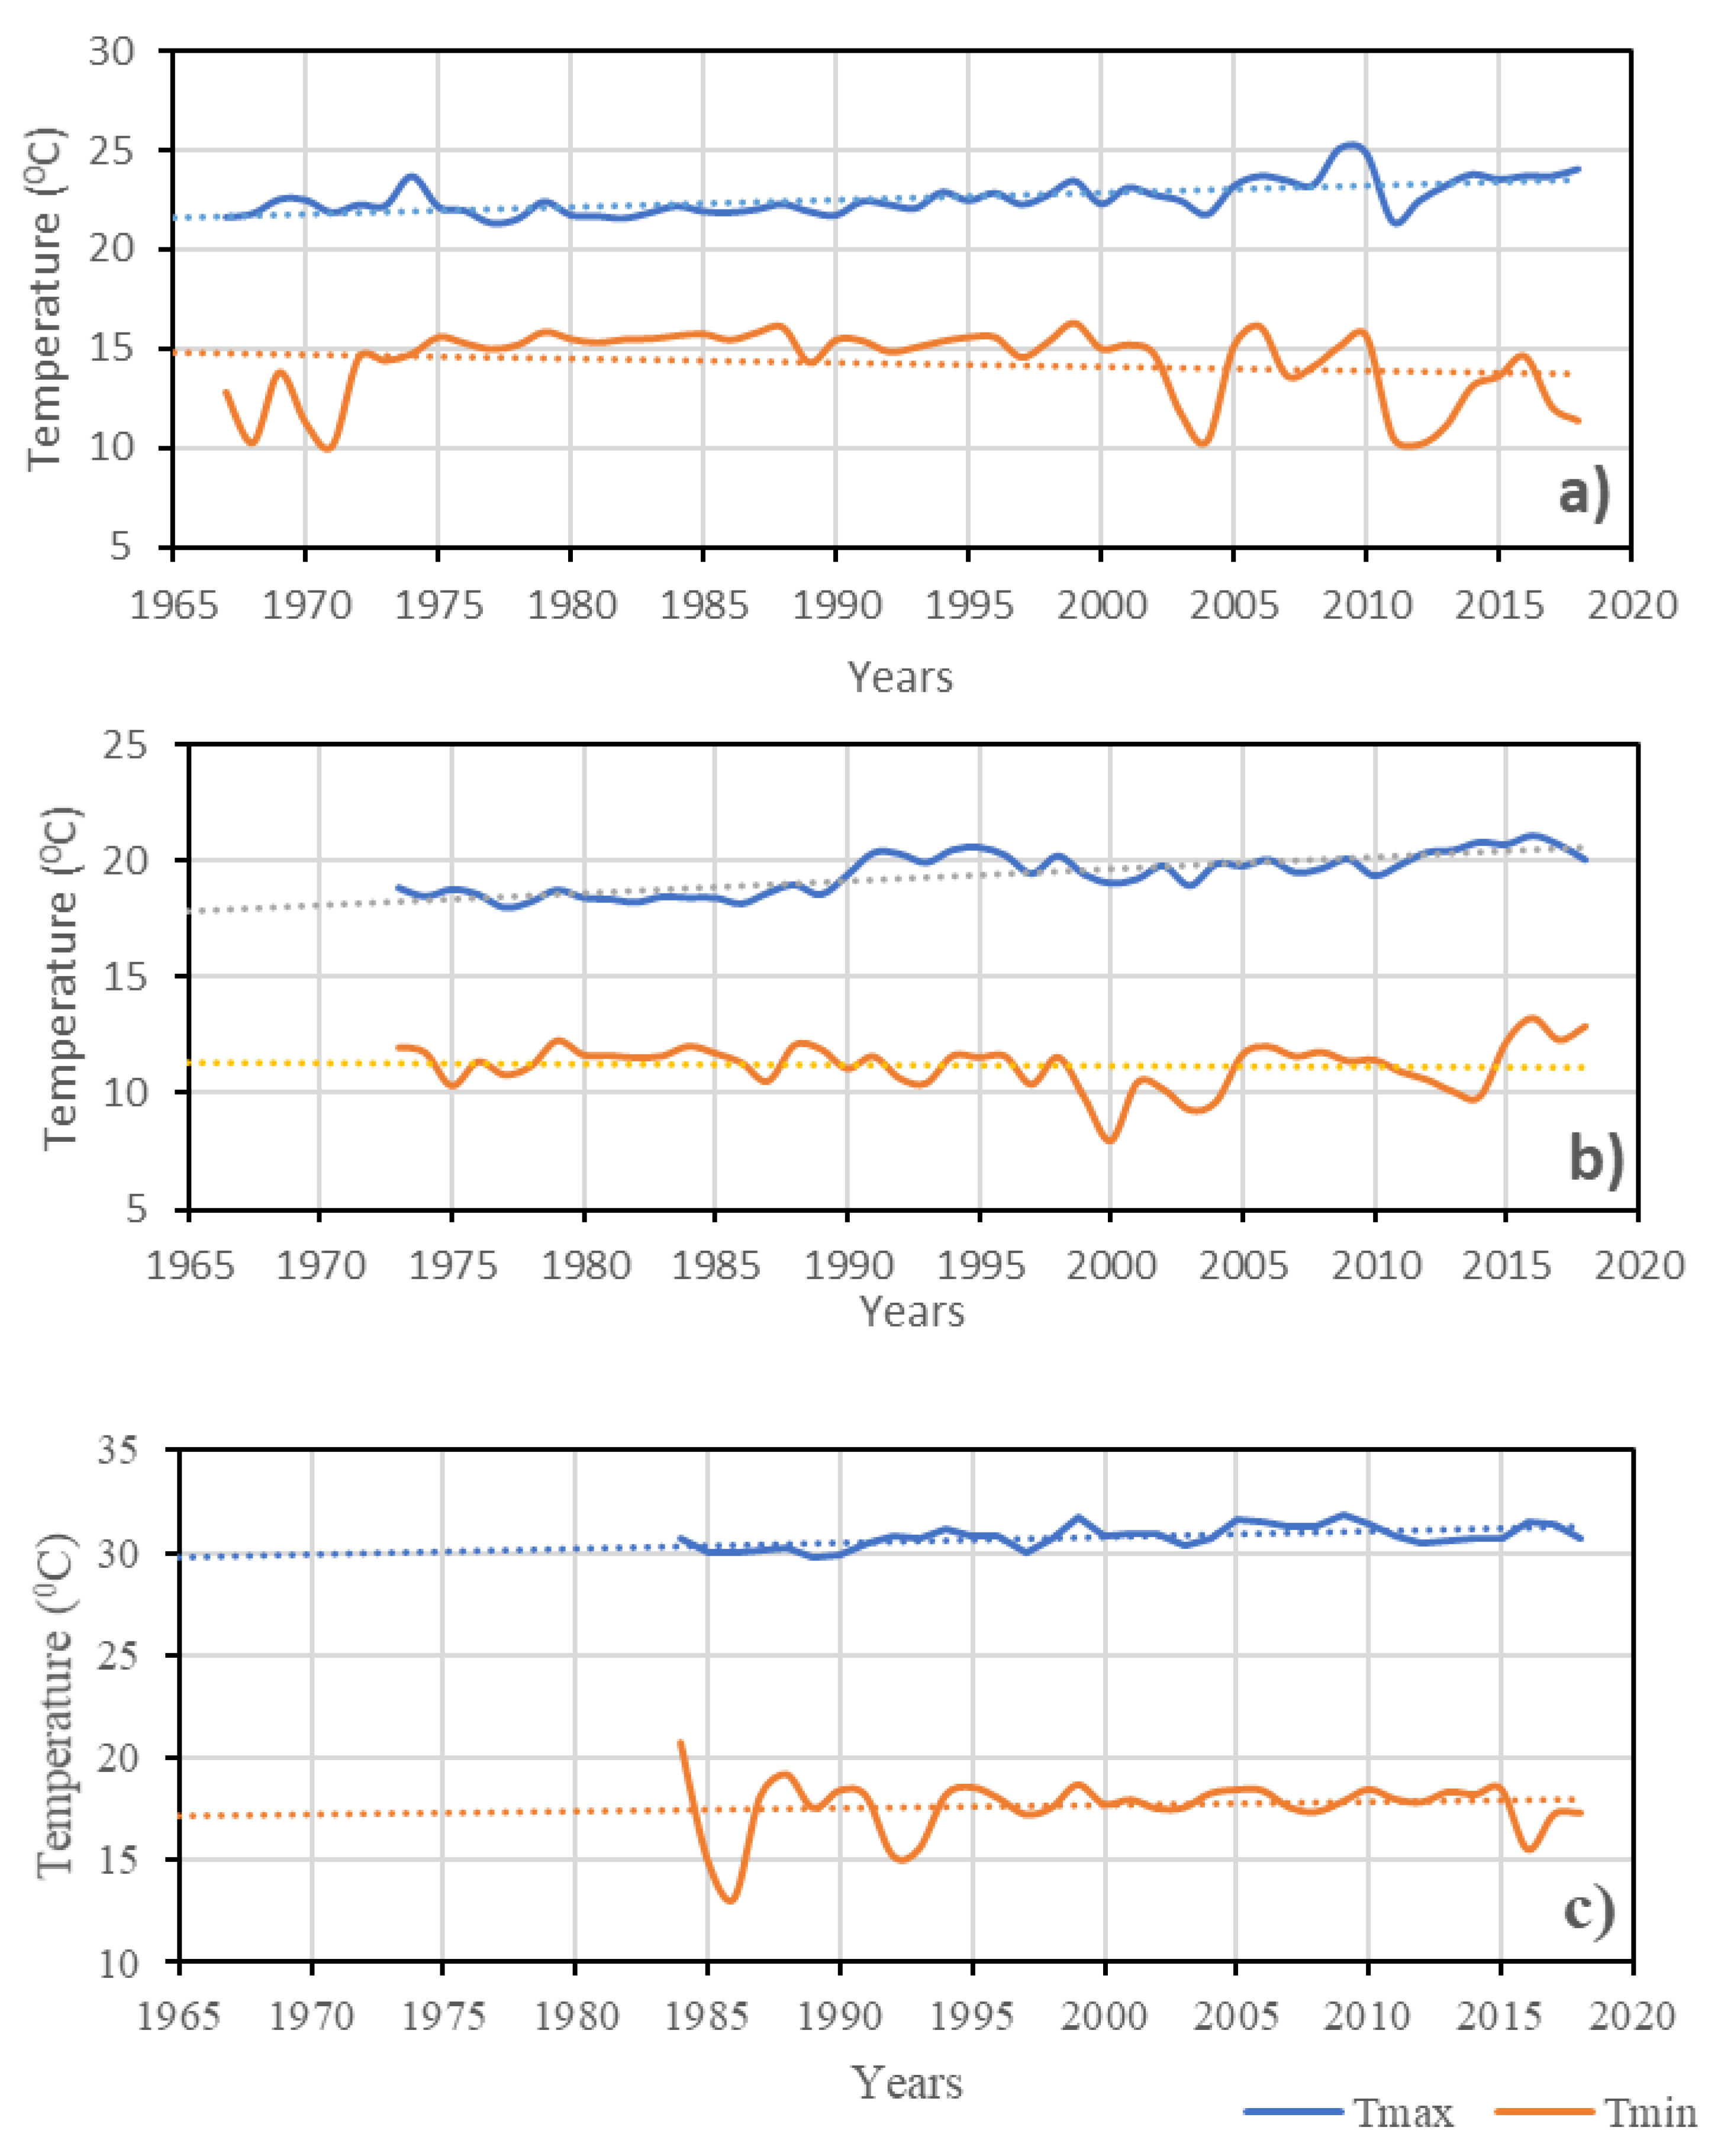
3.1. Temperature Trend Analysis
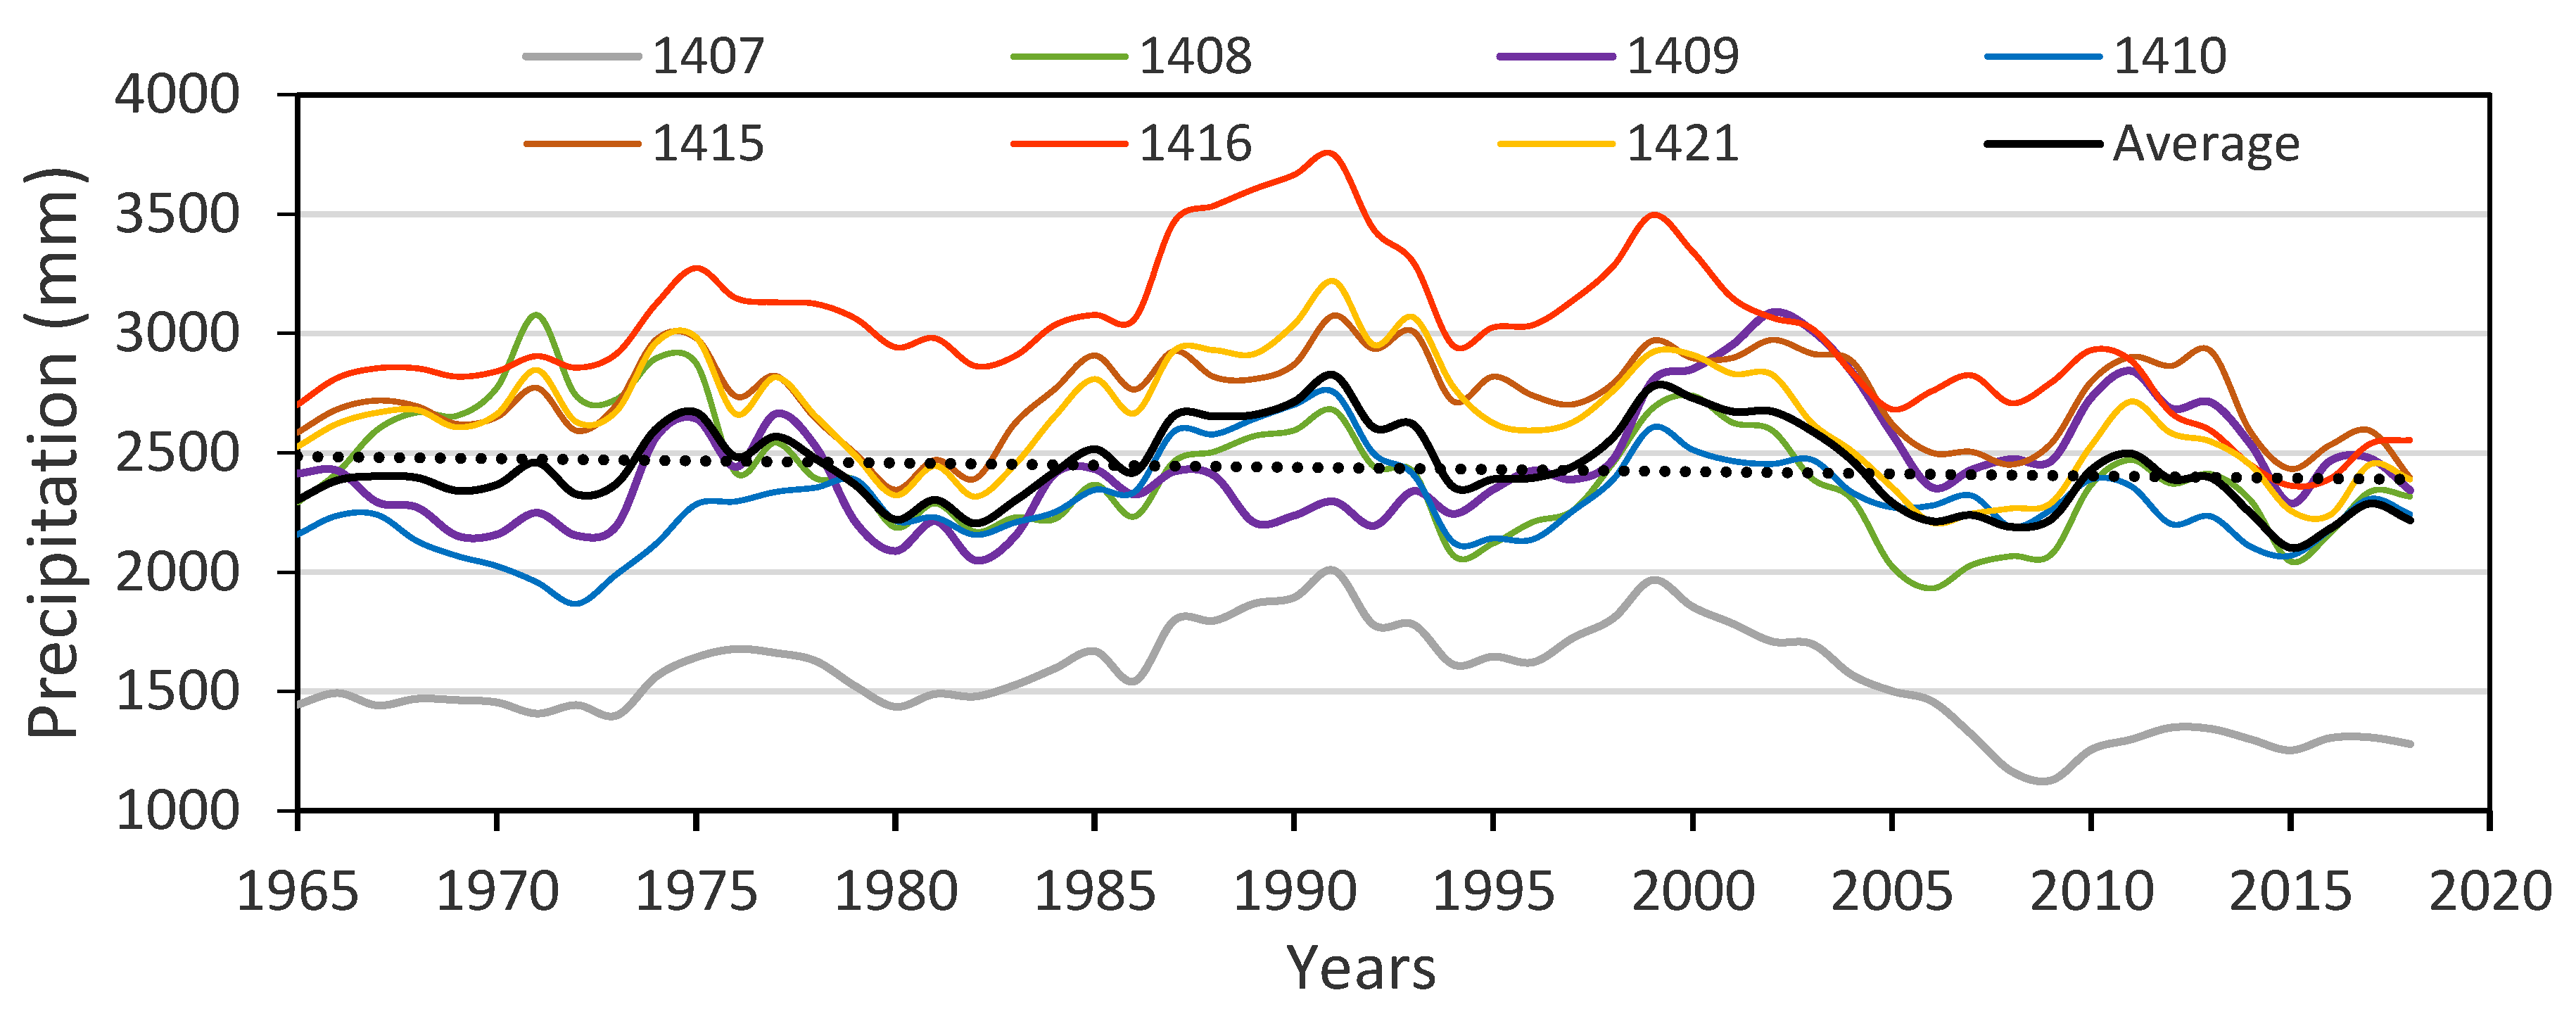
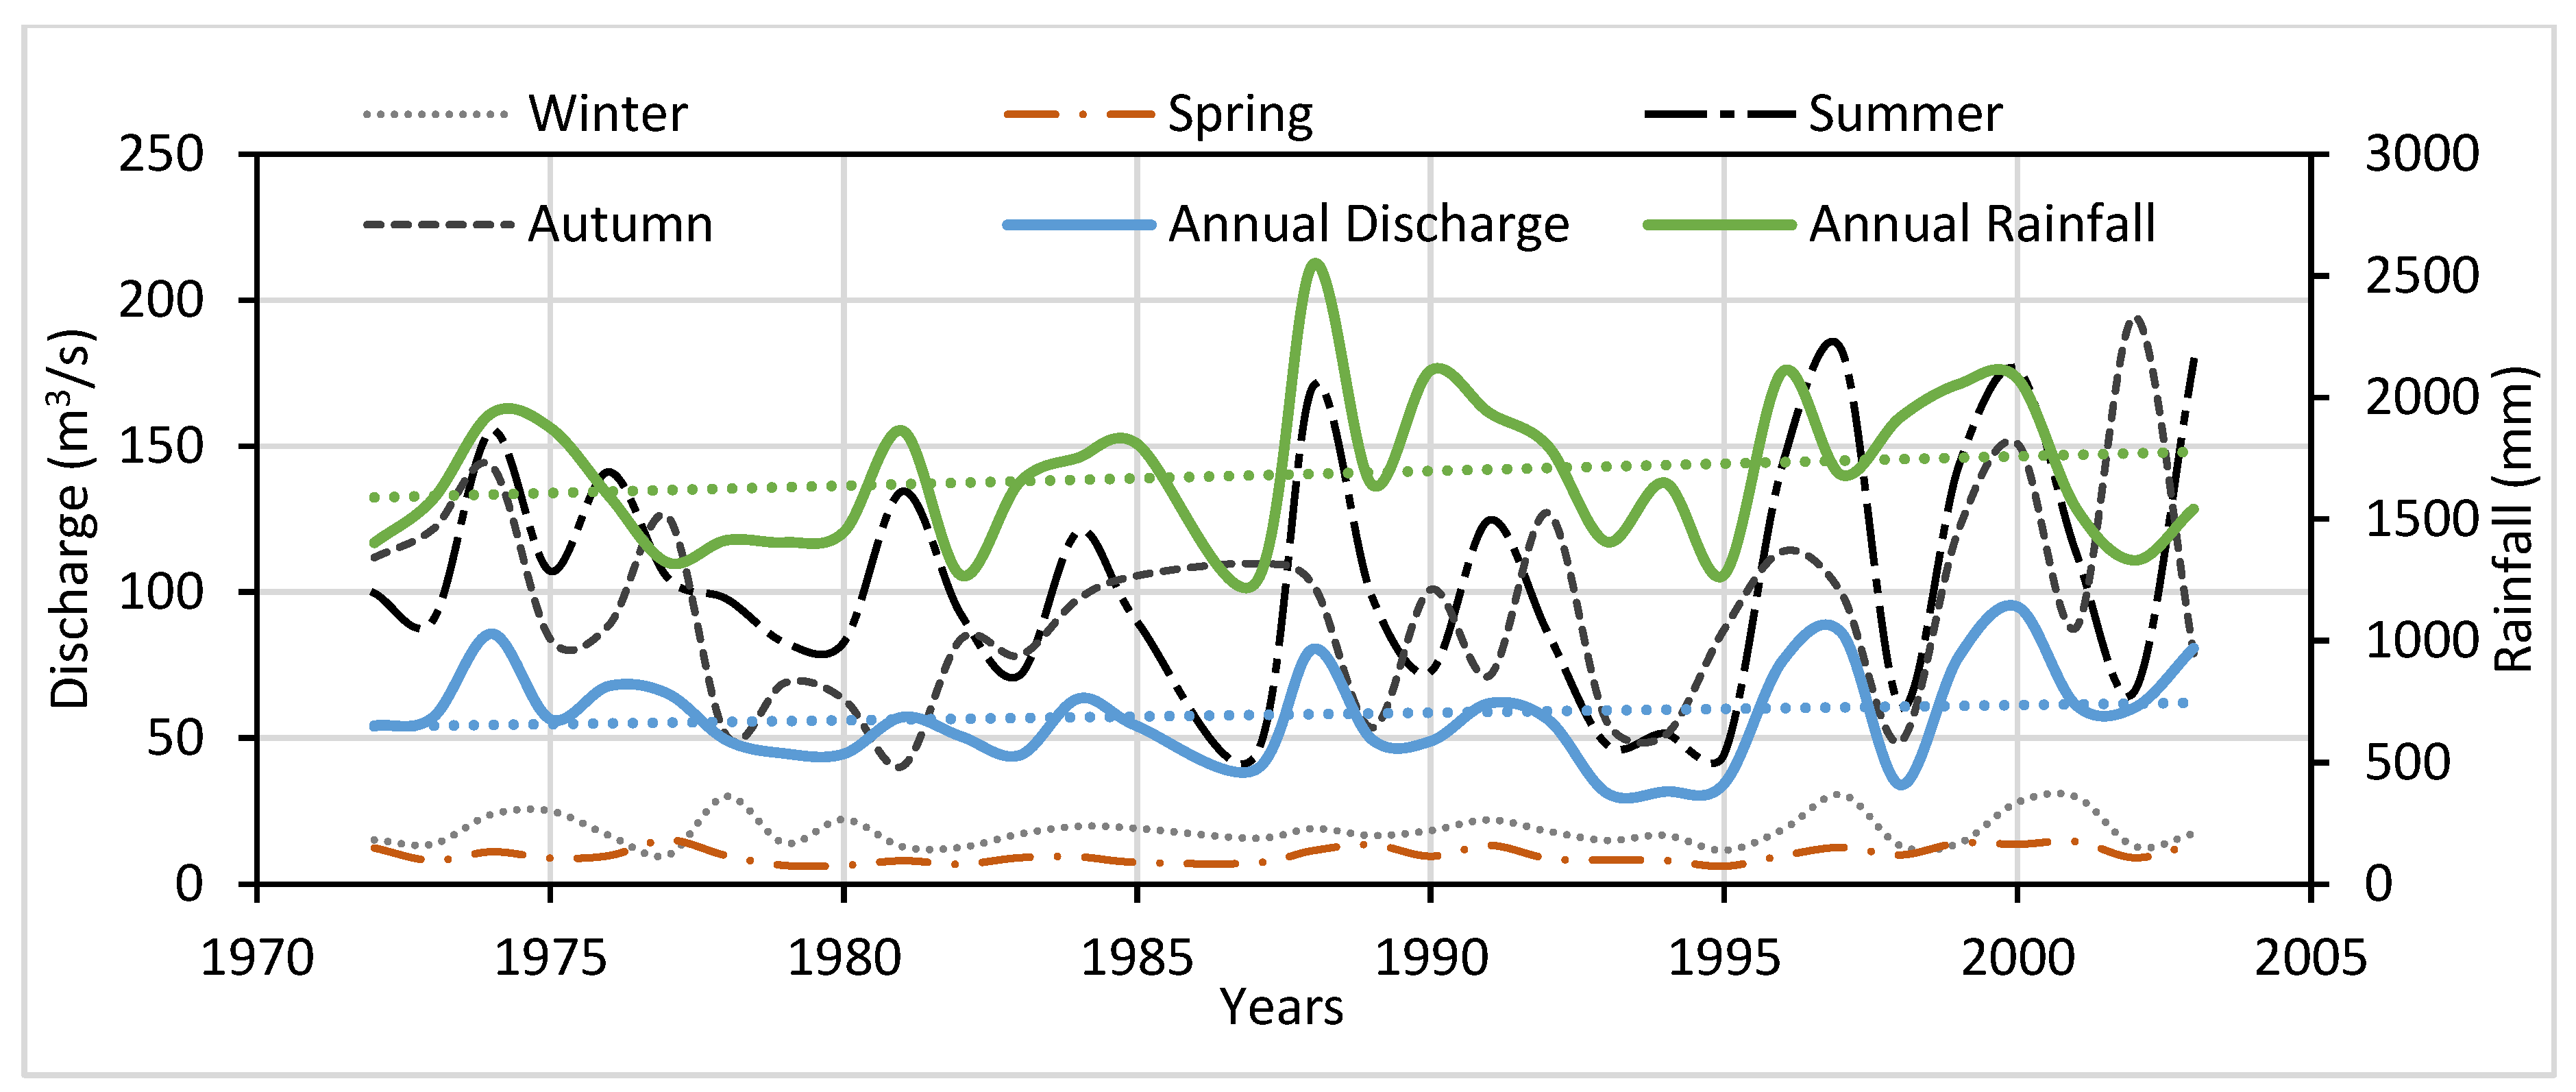
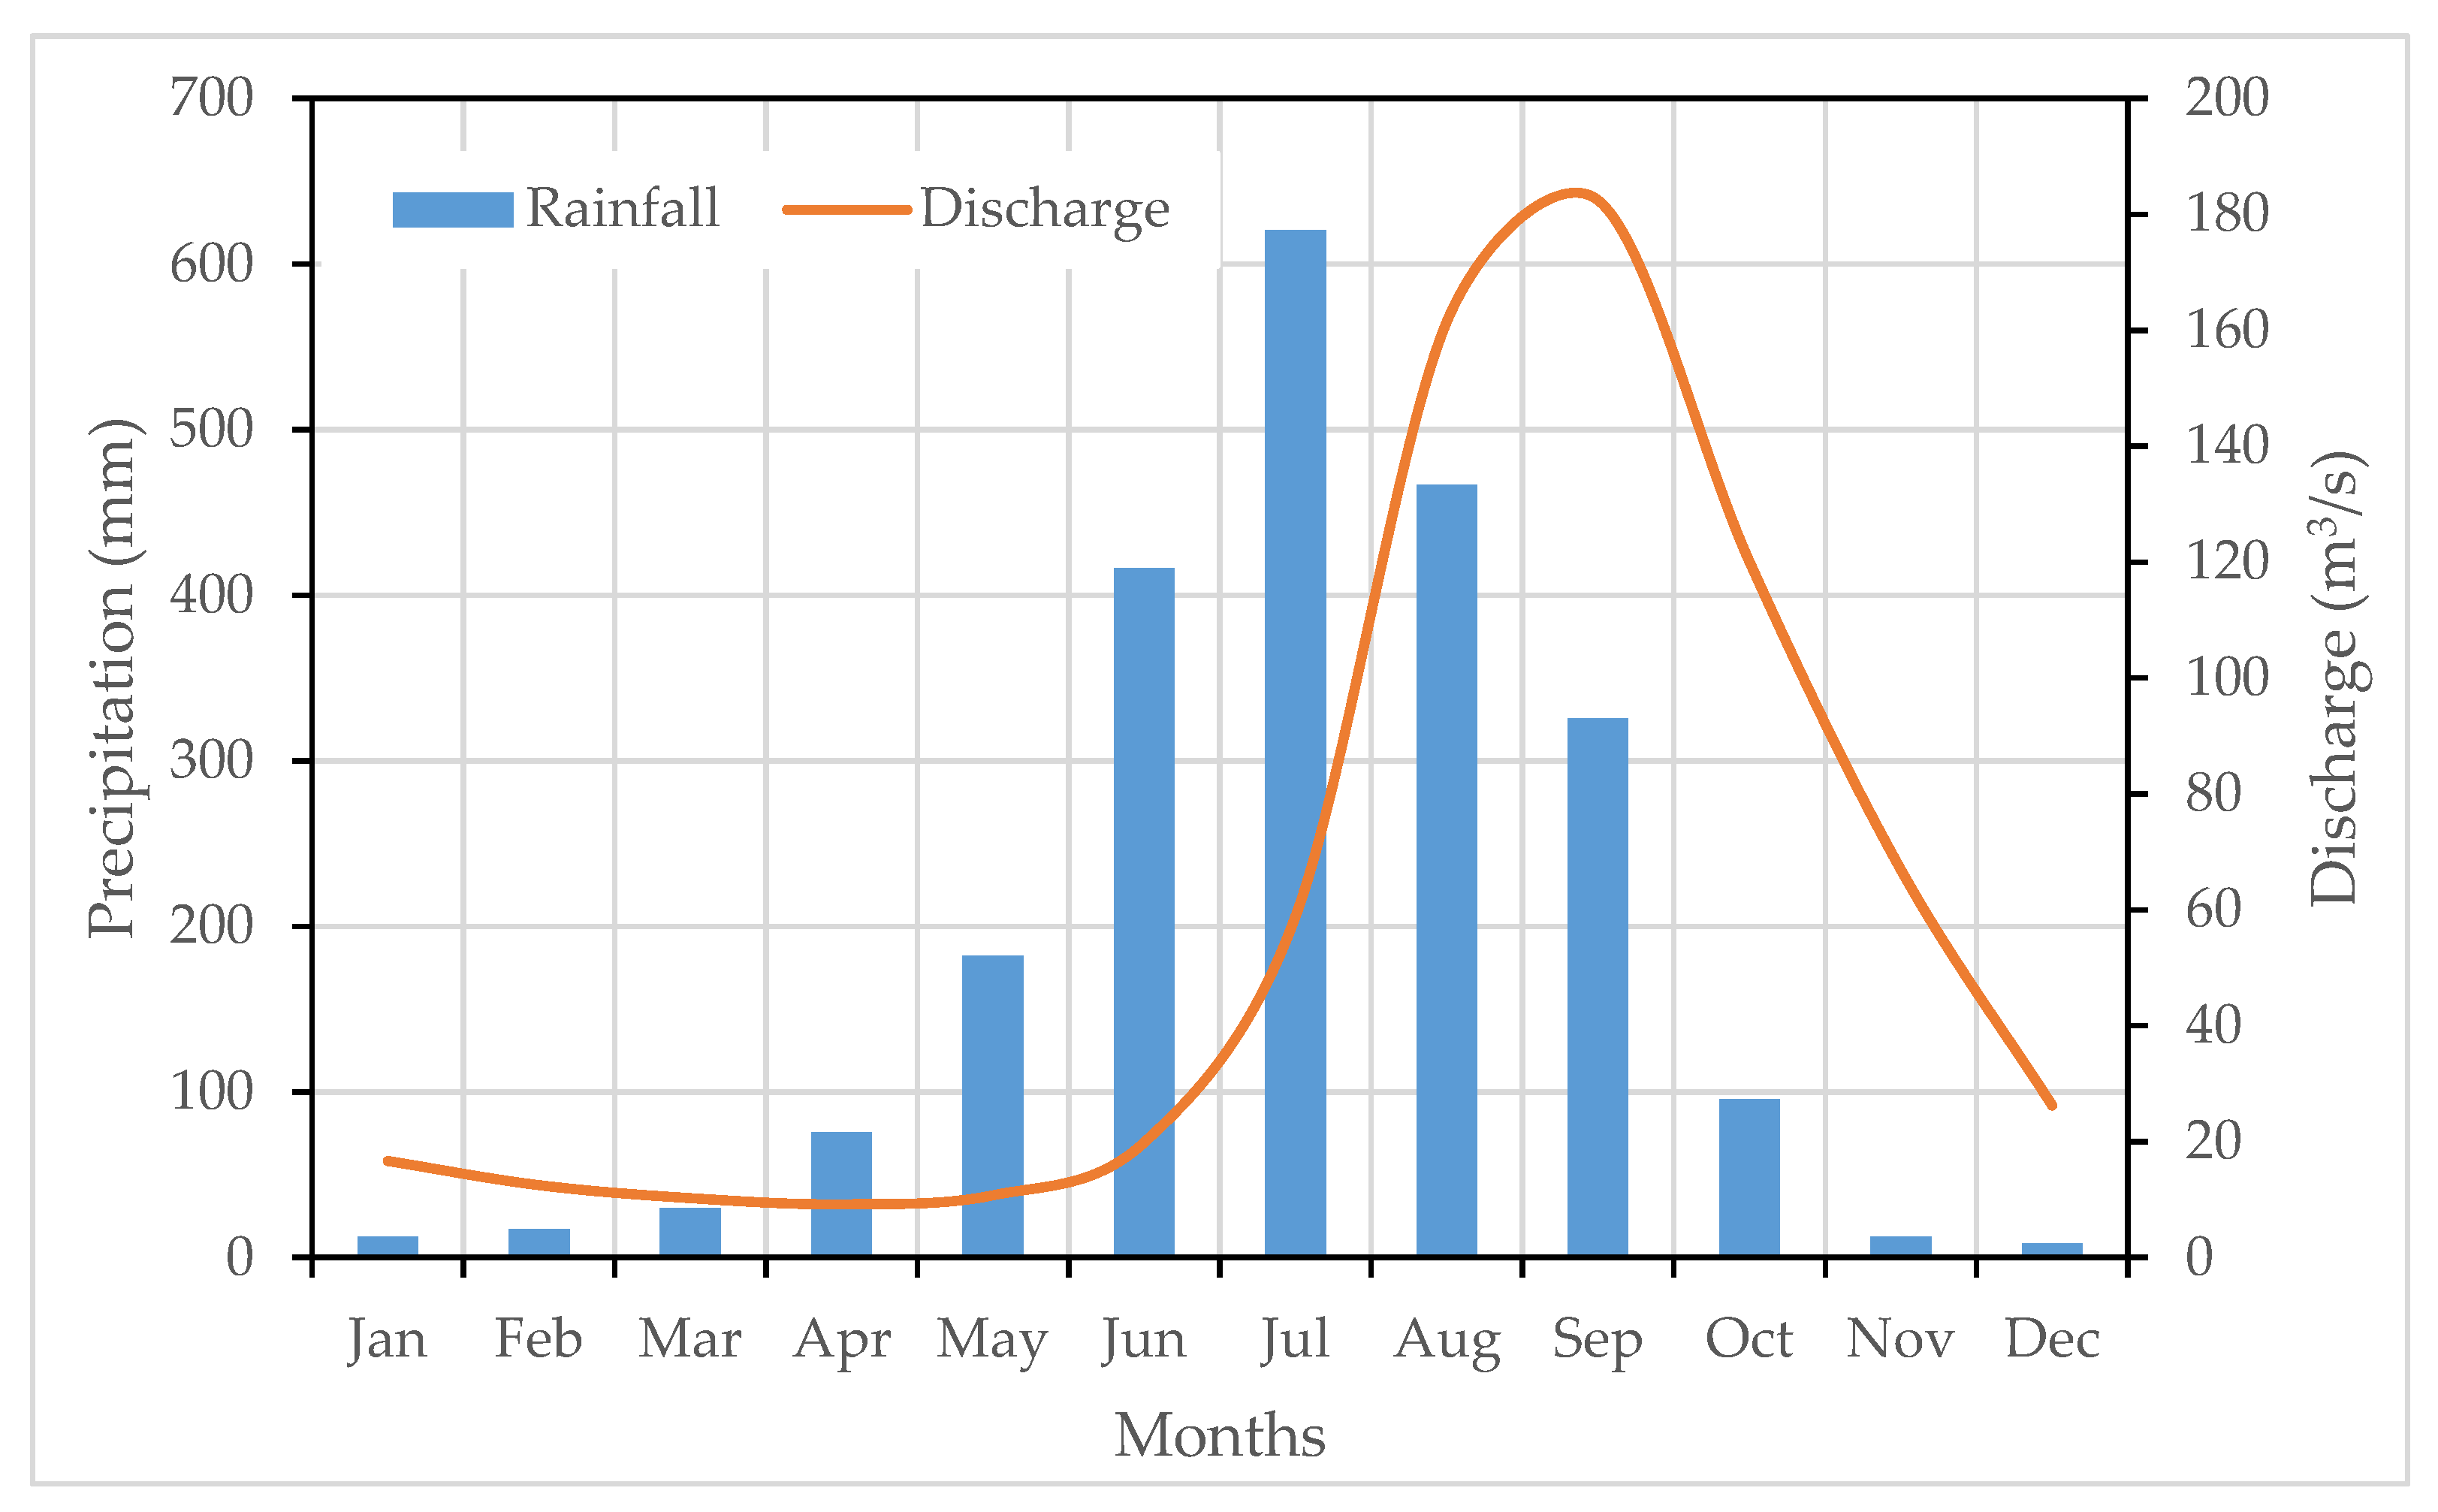
3.2. Precipitation and Discharge Trend Analysis
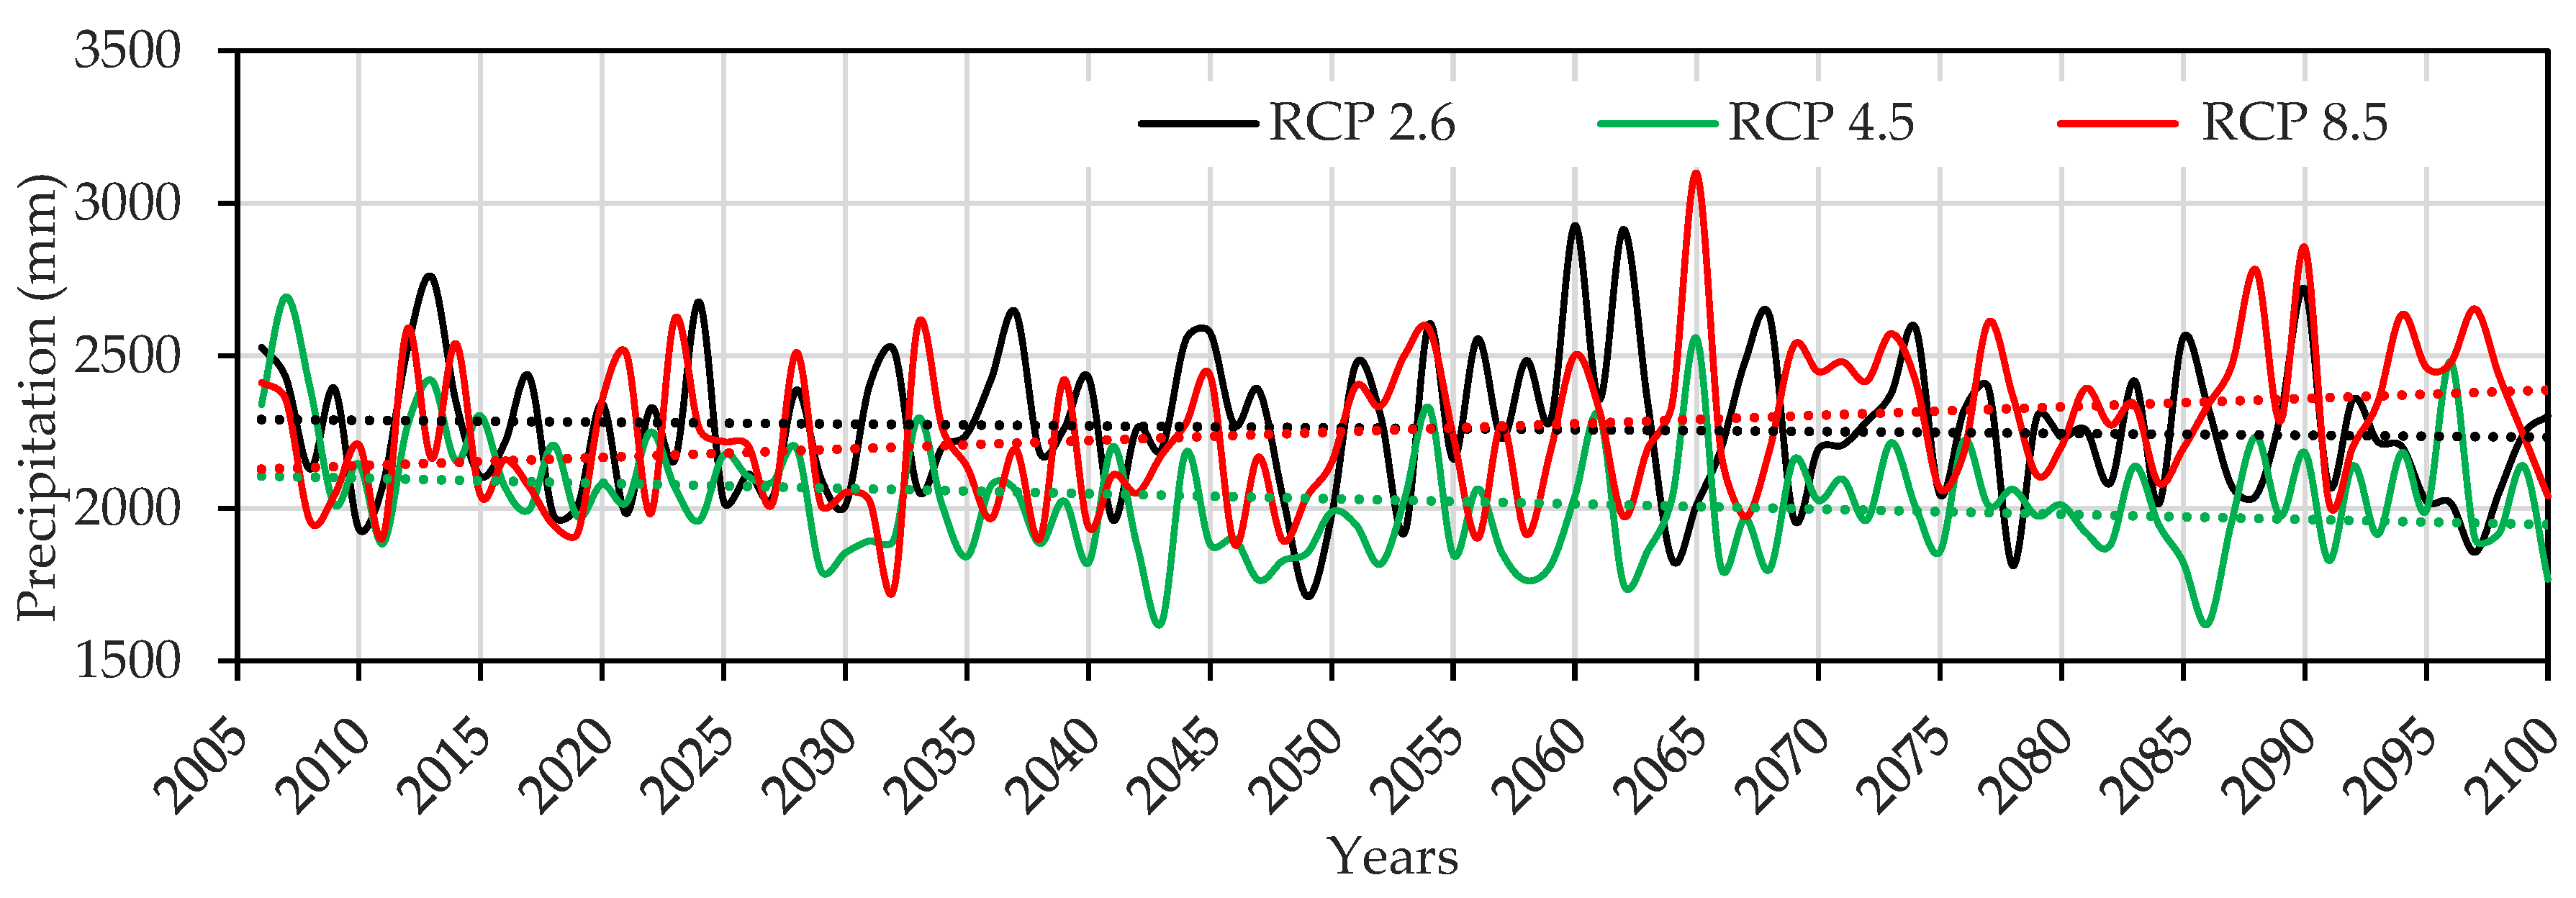
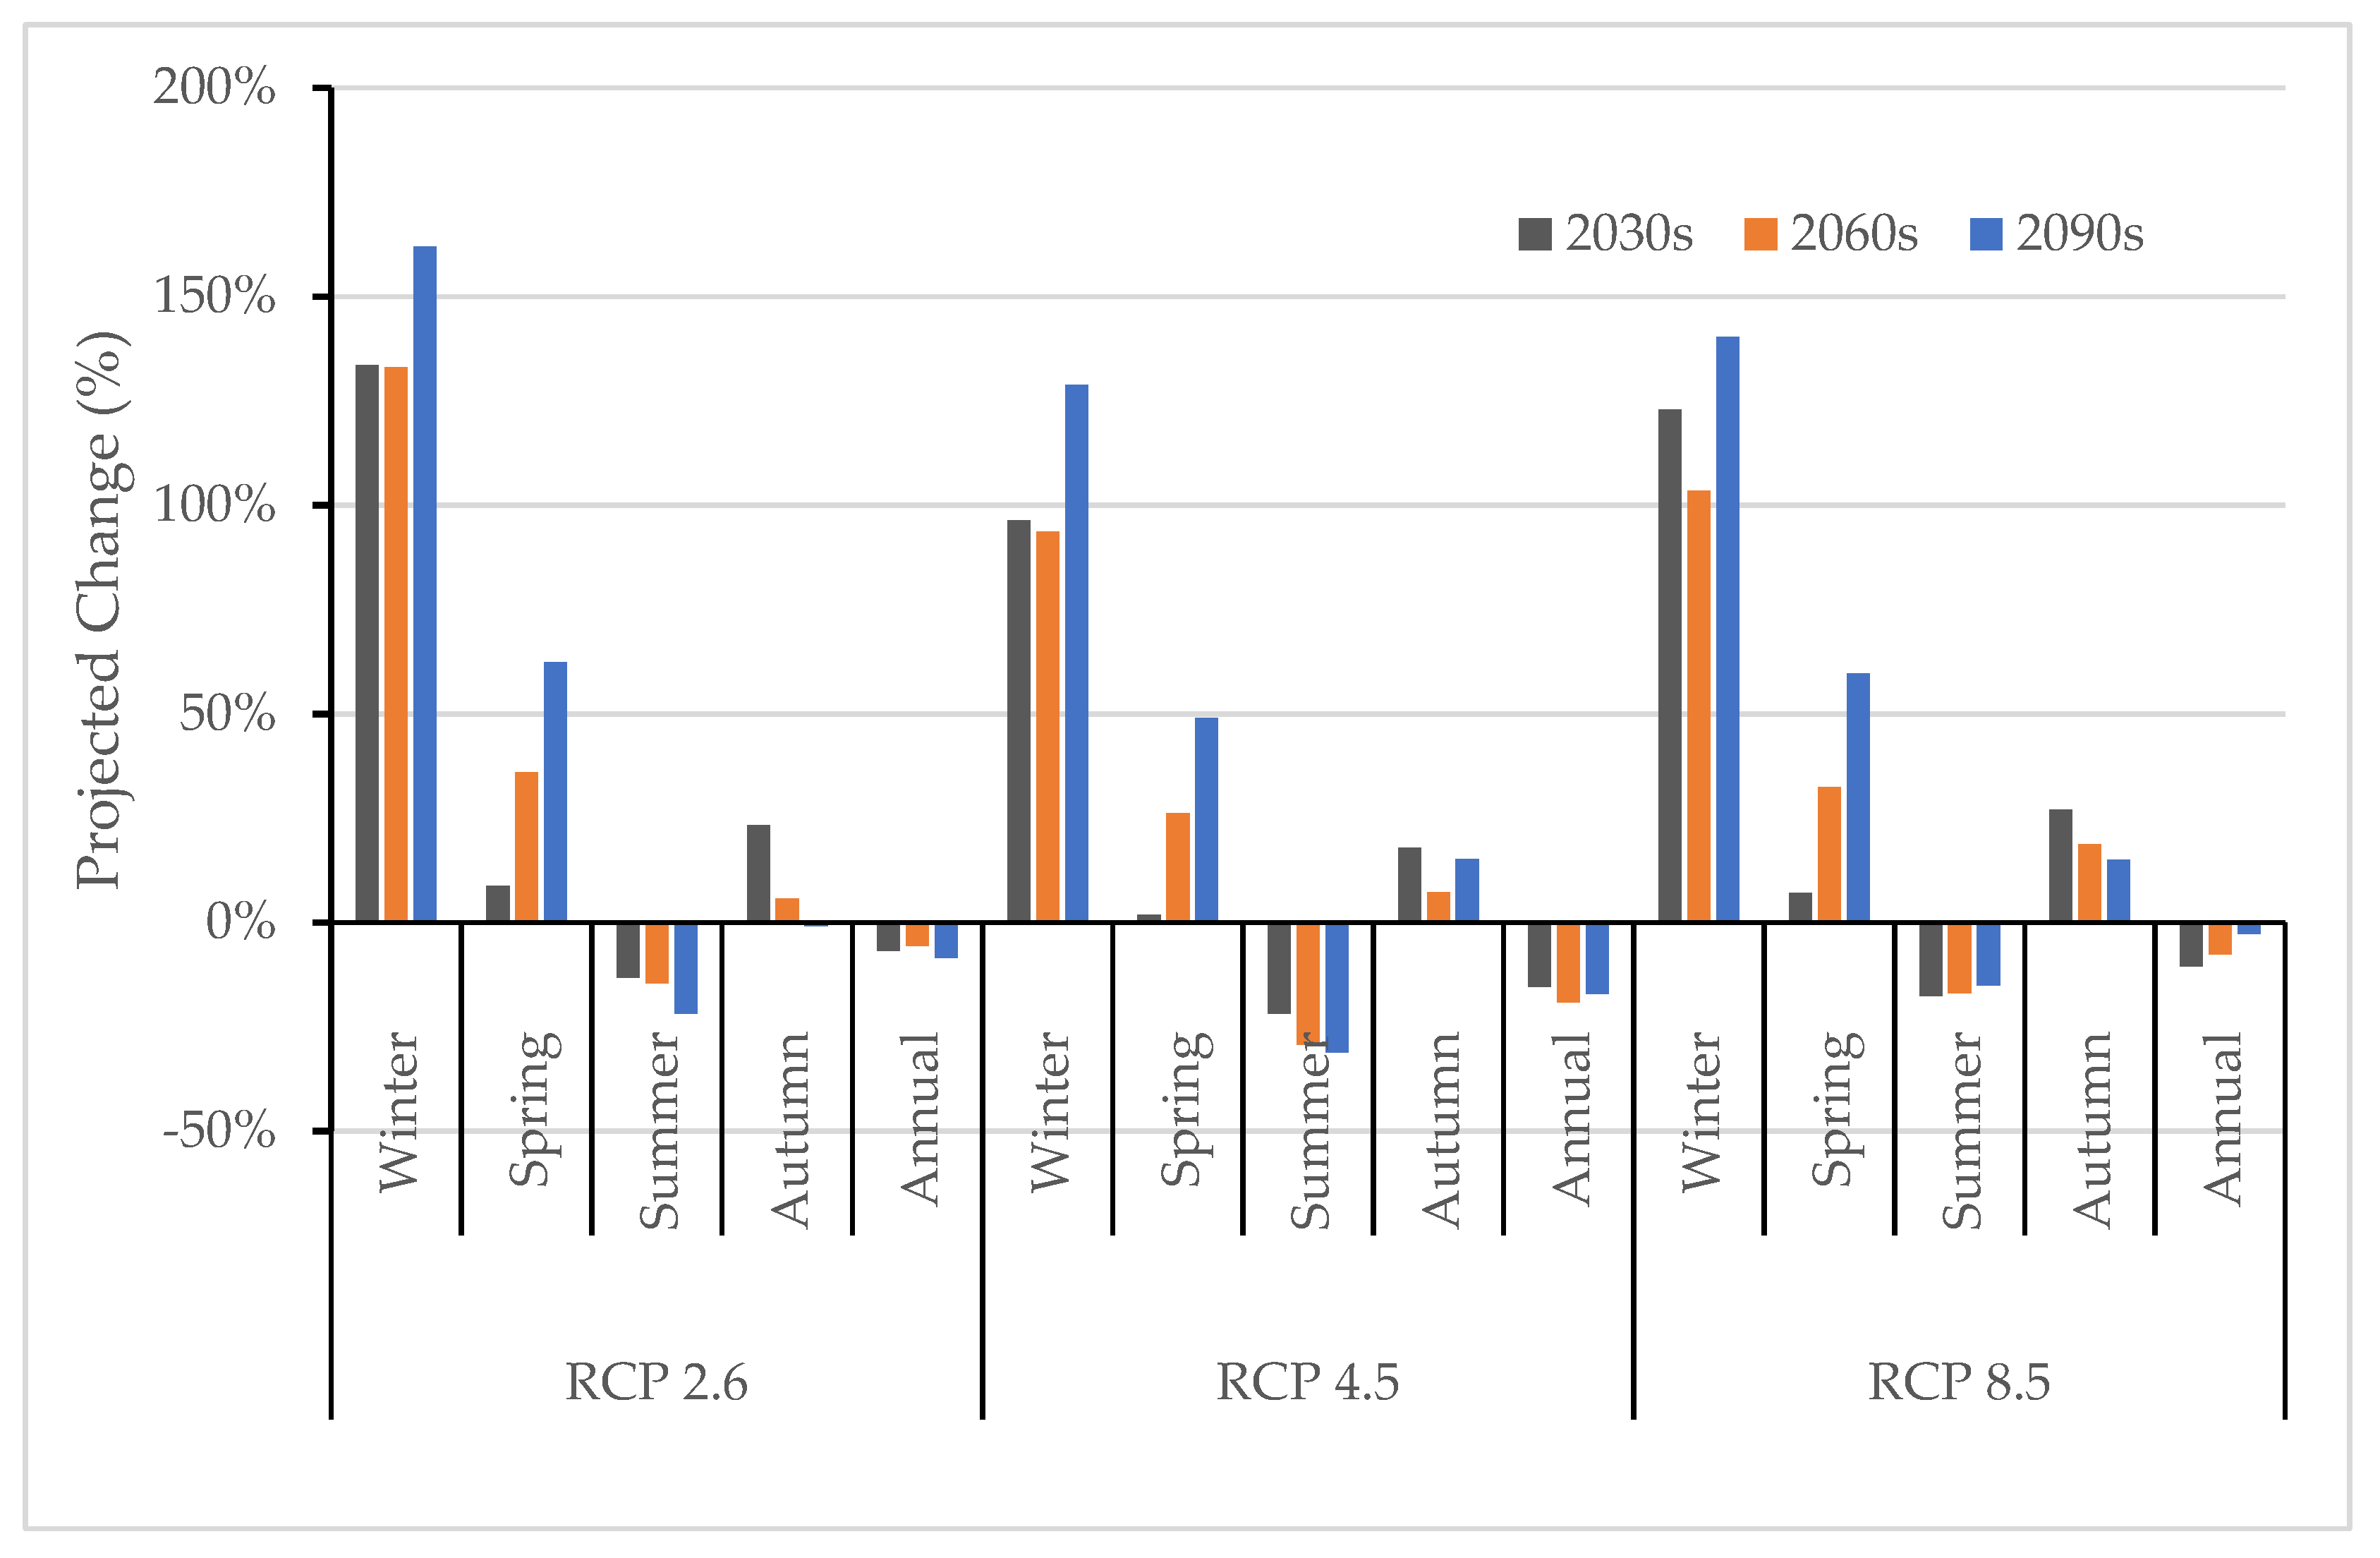
3.3. Future Precipitation Projection
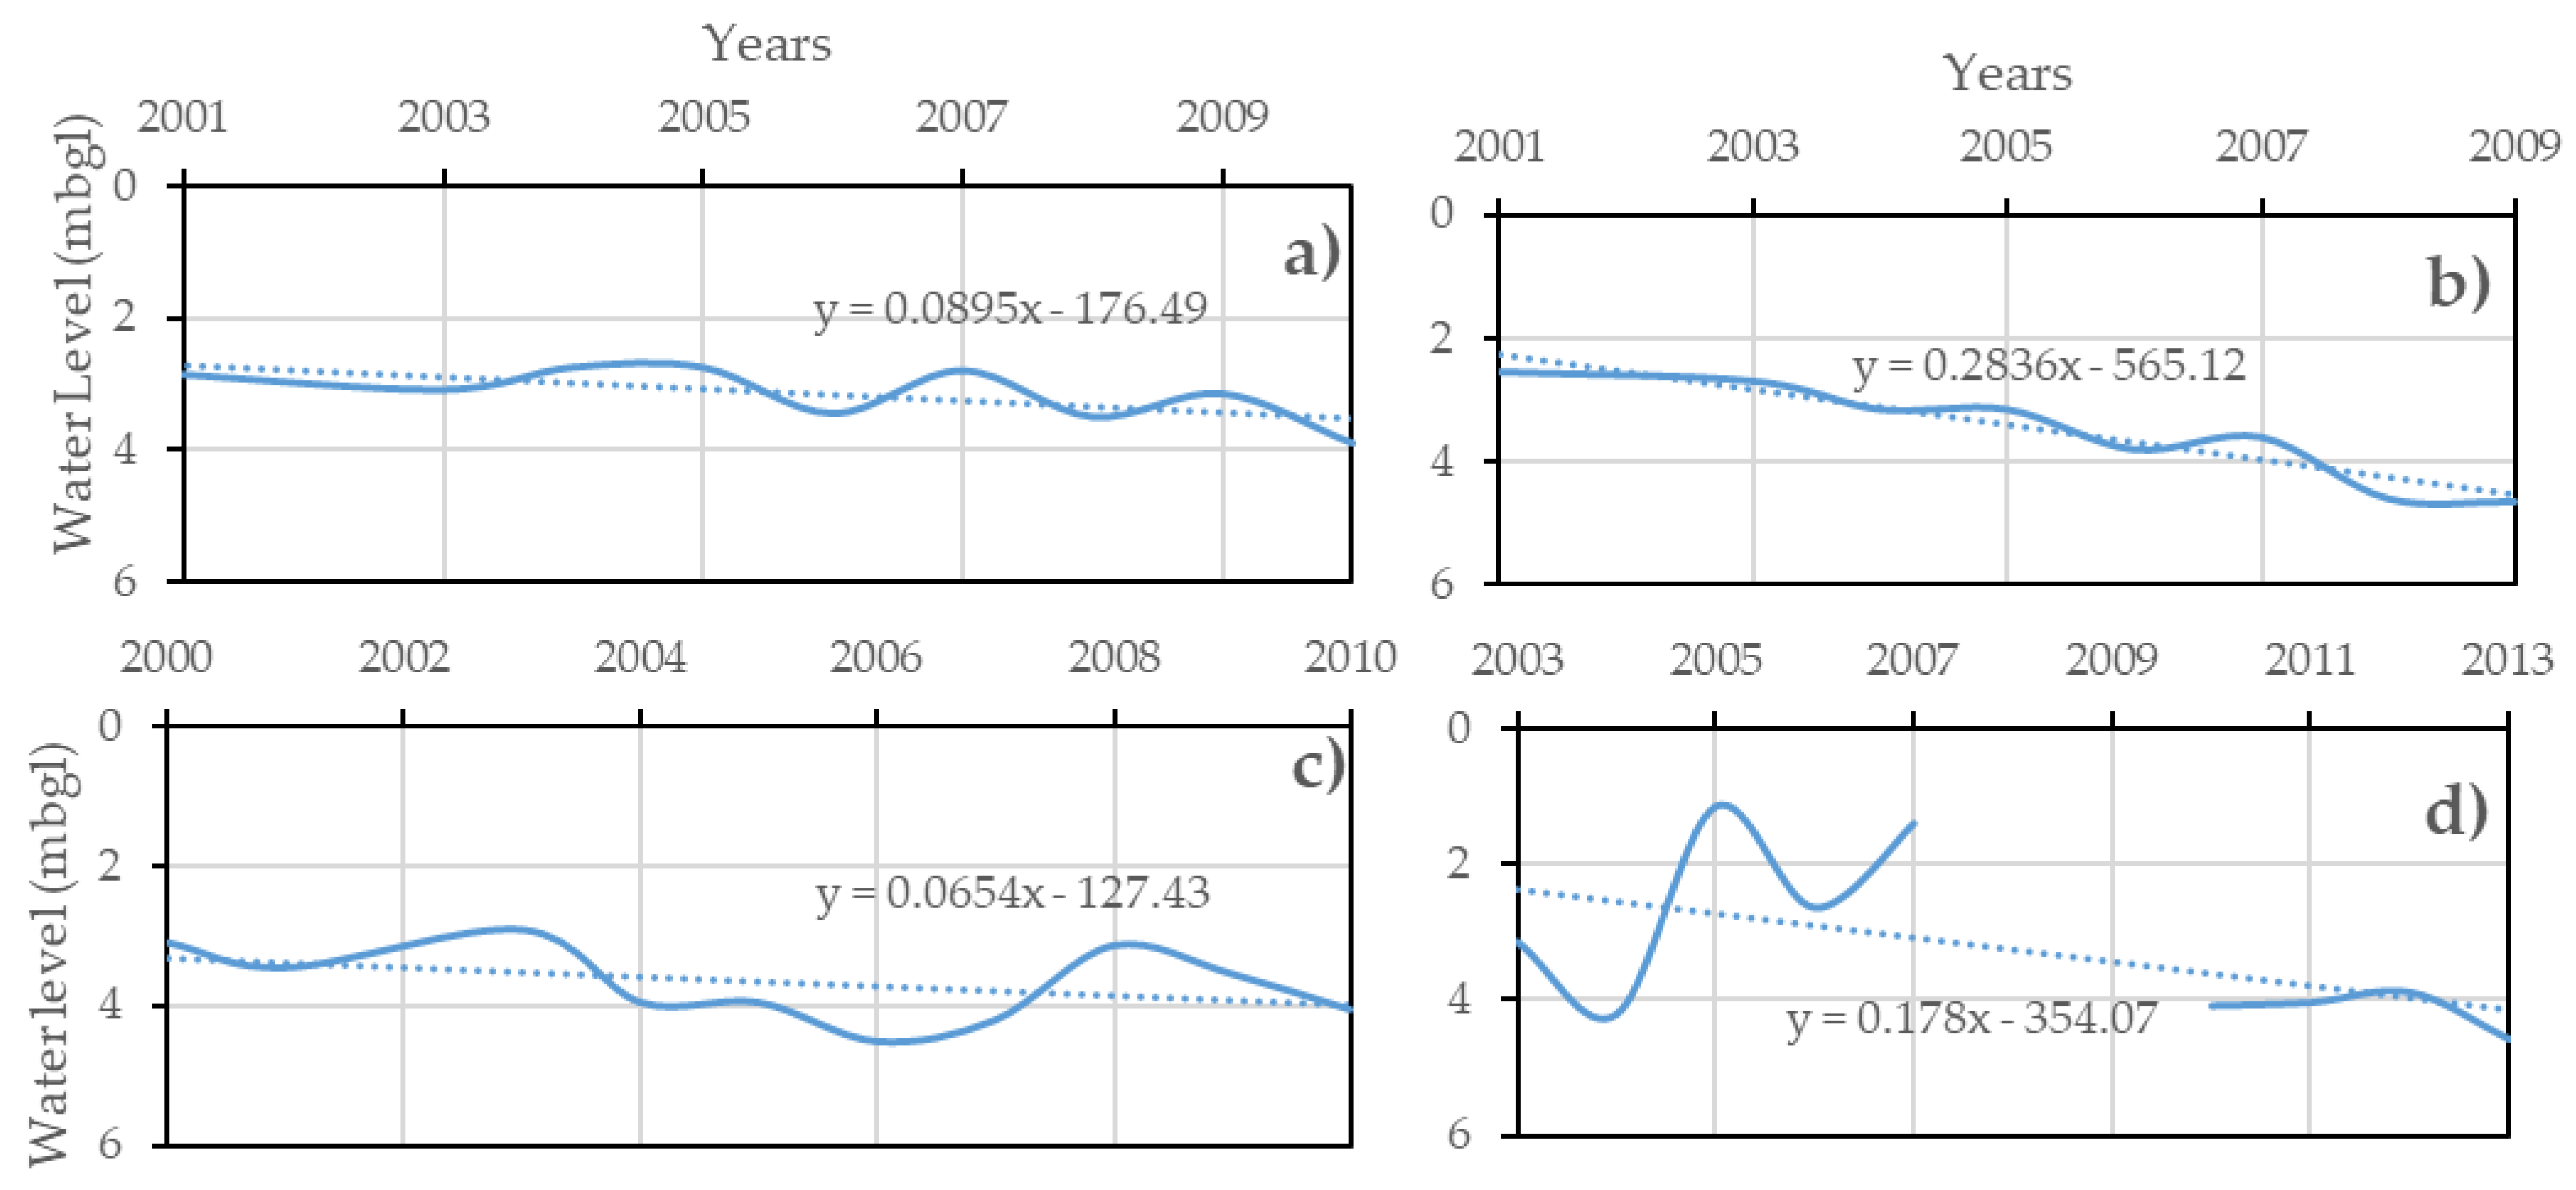
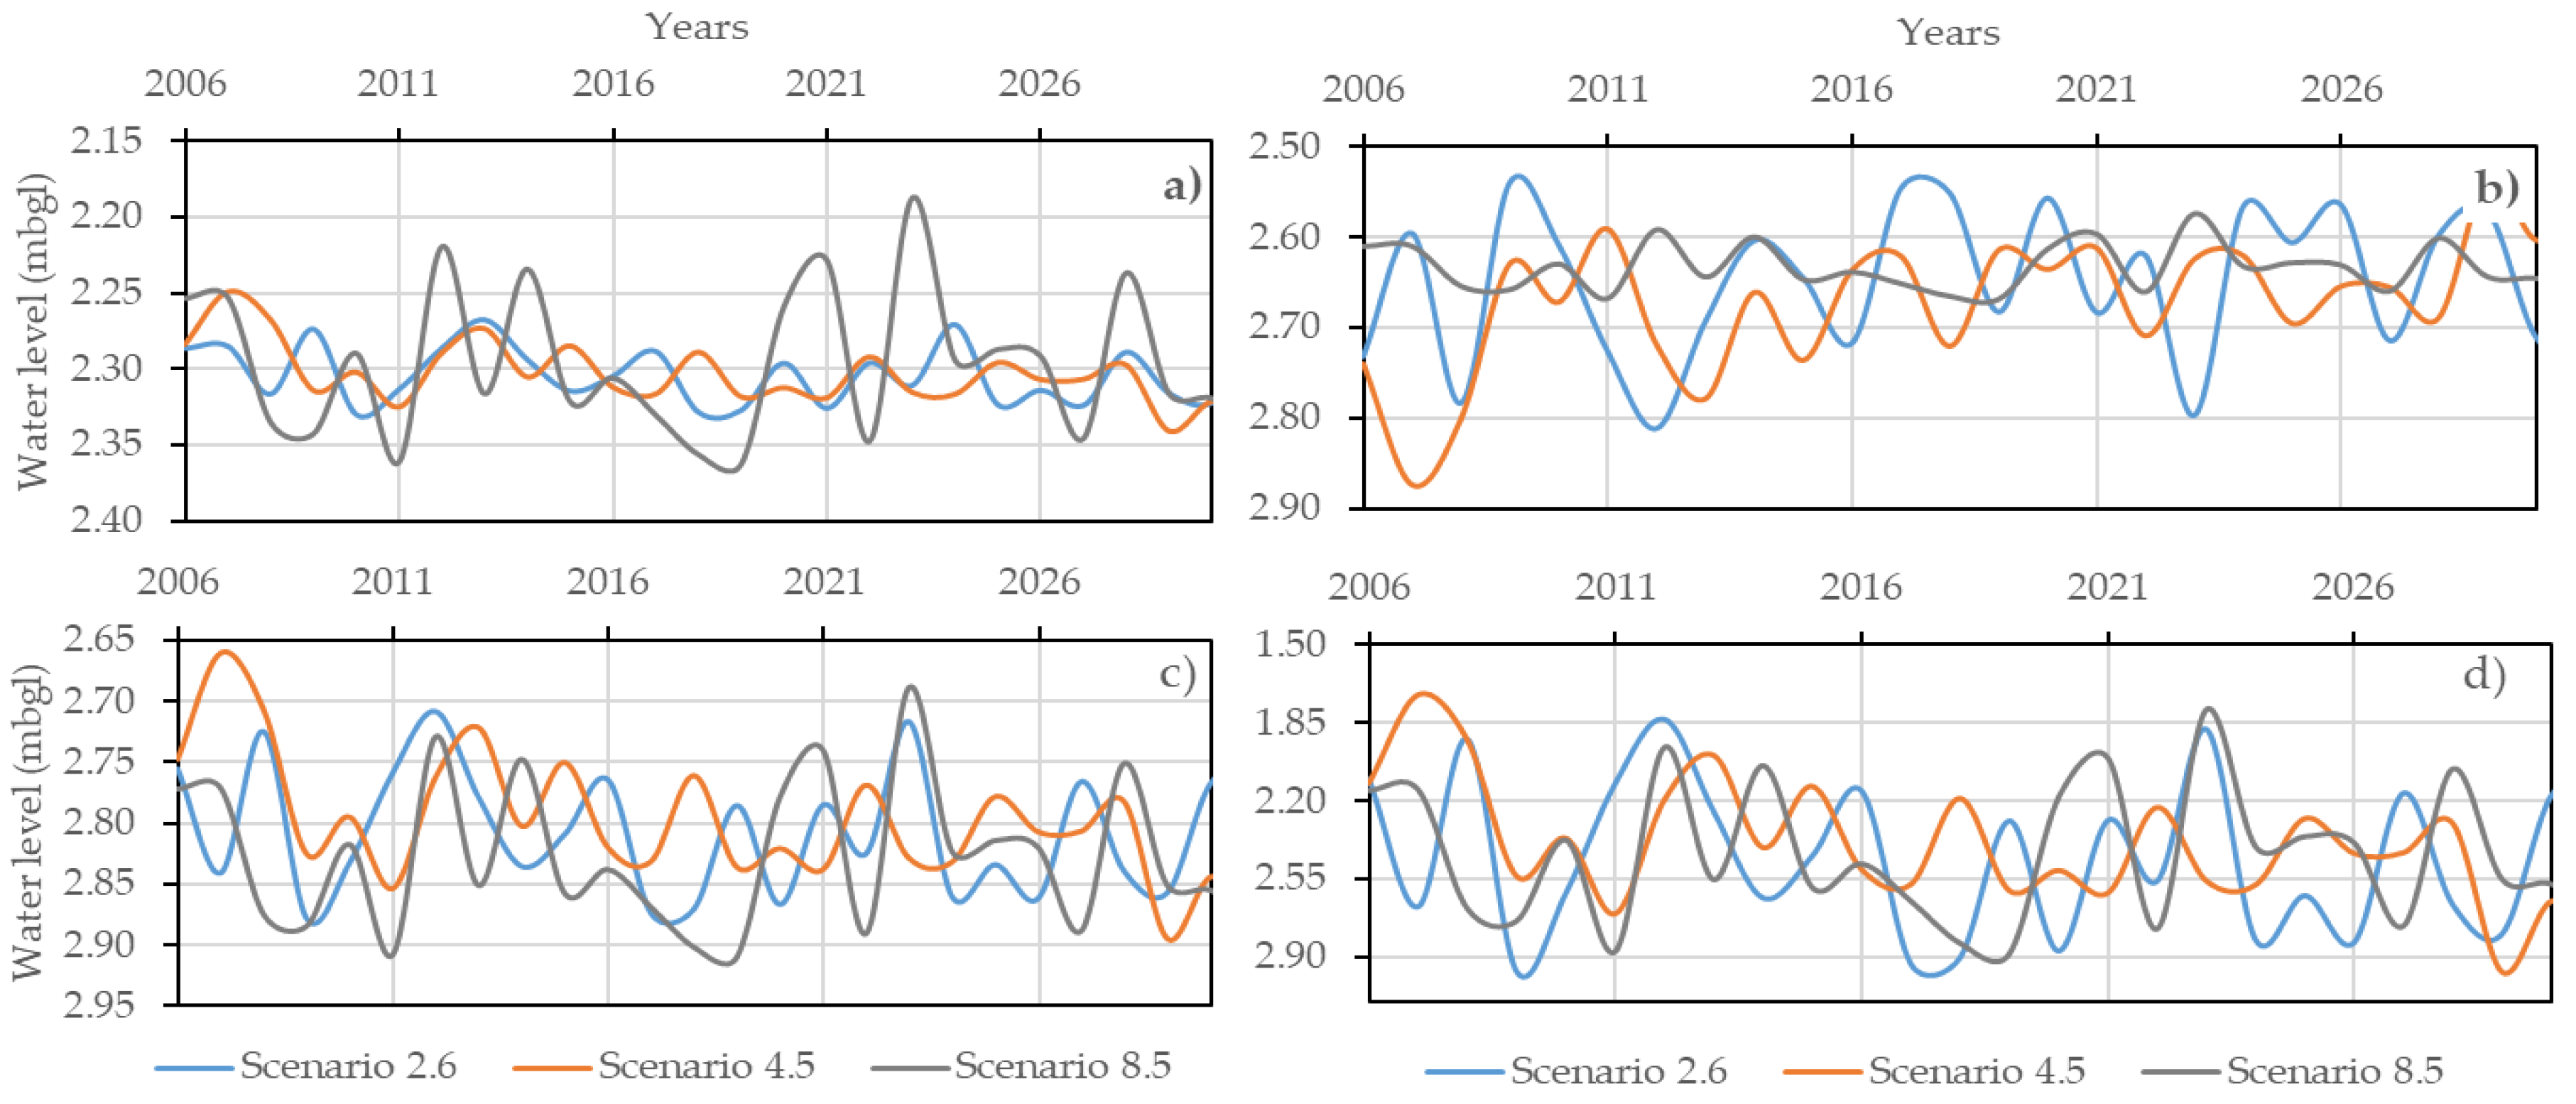
3.4. Impact on Groundwater Resources
4. Discussion
5. Conclusions
- The maximum temperature in the region is increasing and the minimum temperature is decreasing. The declining trend of minimum temperature is associated with the increasing trend of rainfall in those seasons.
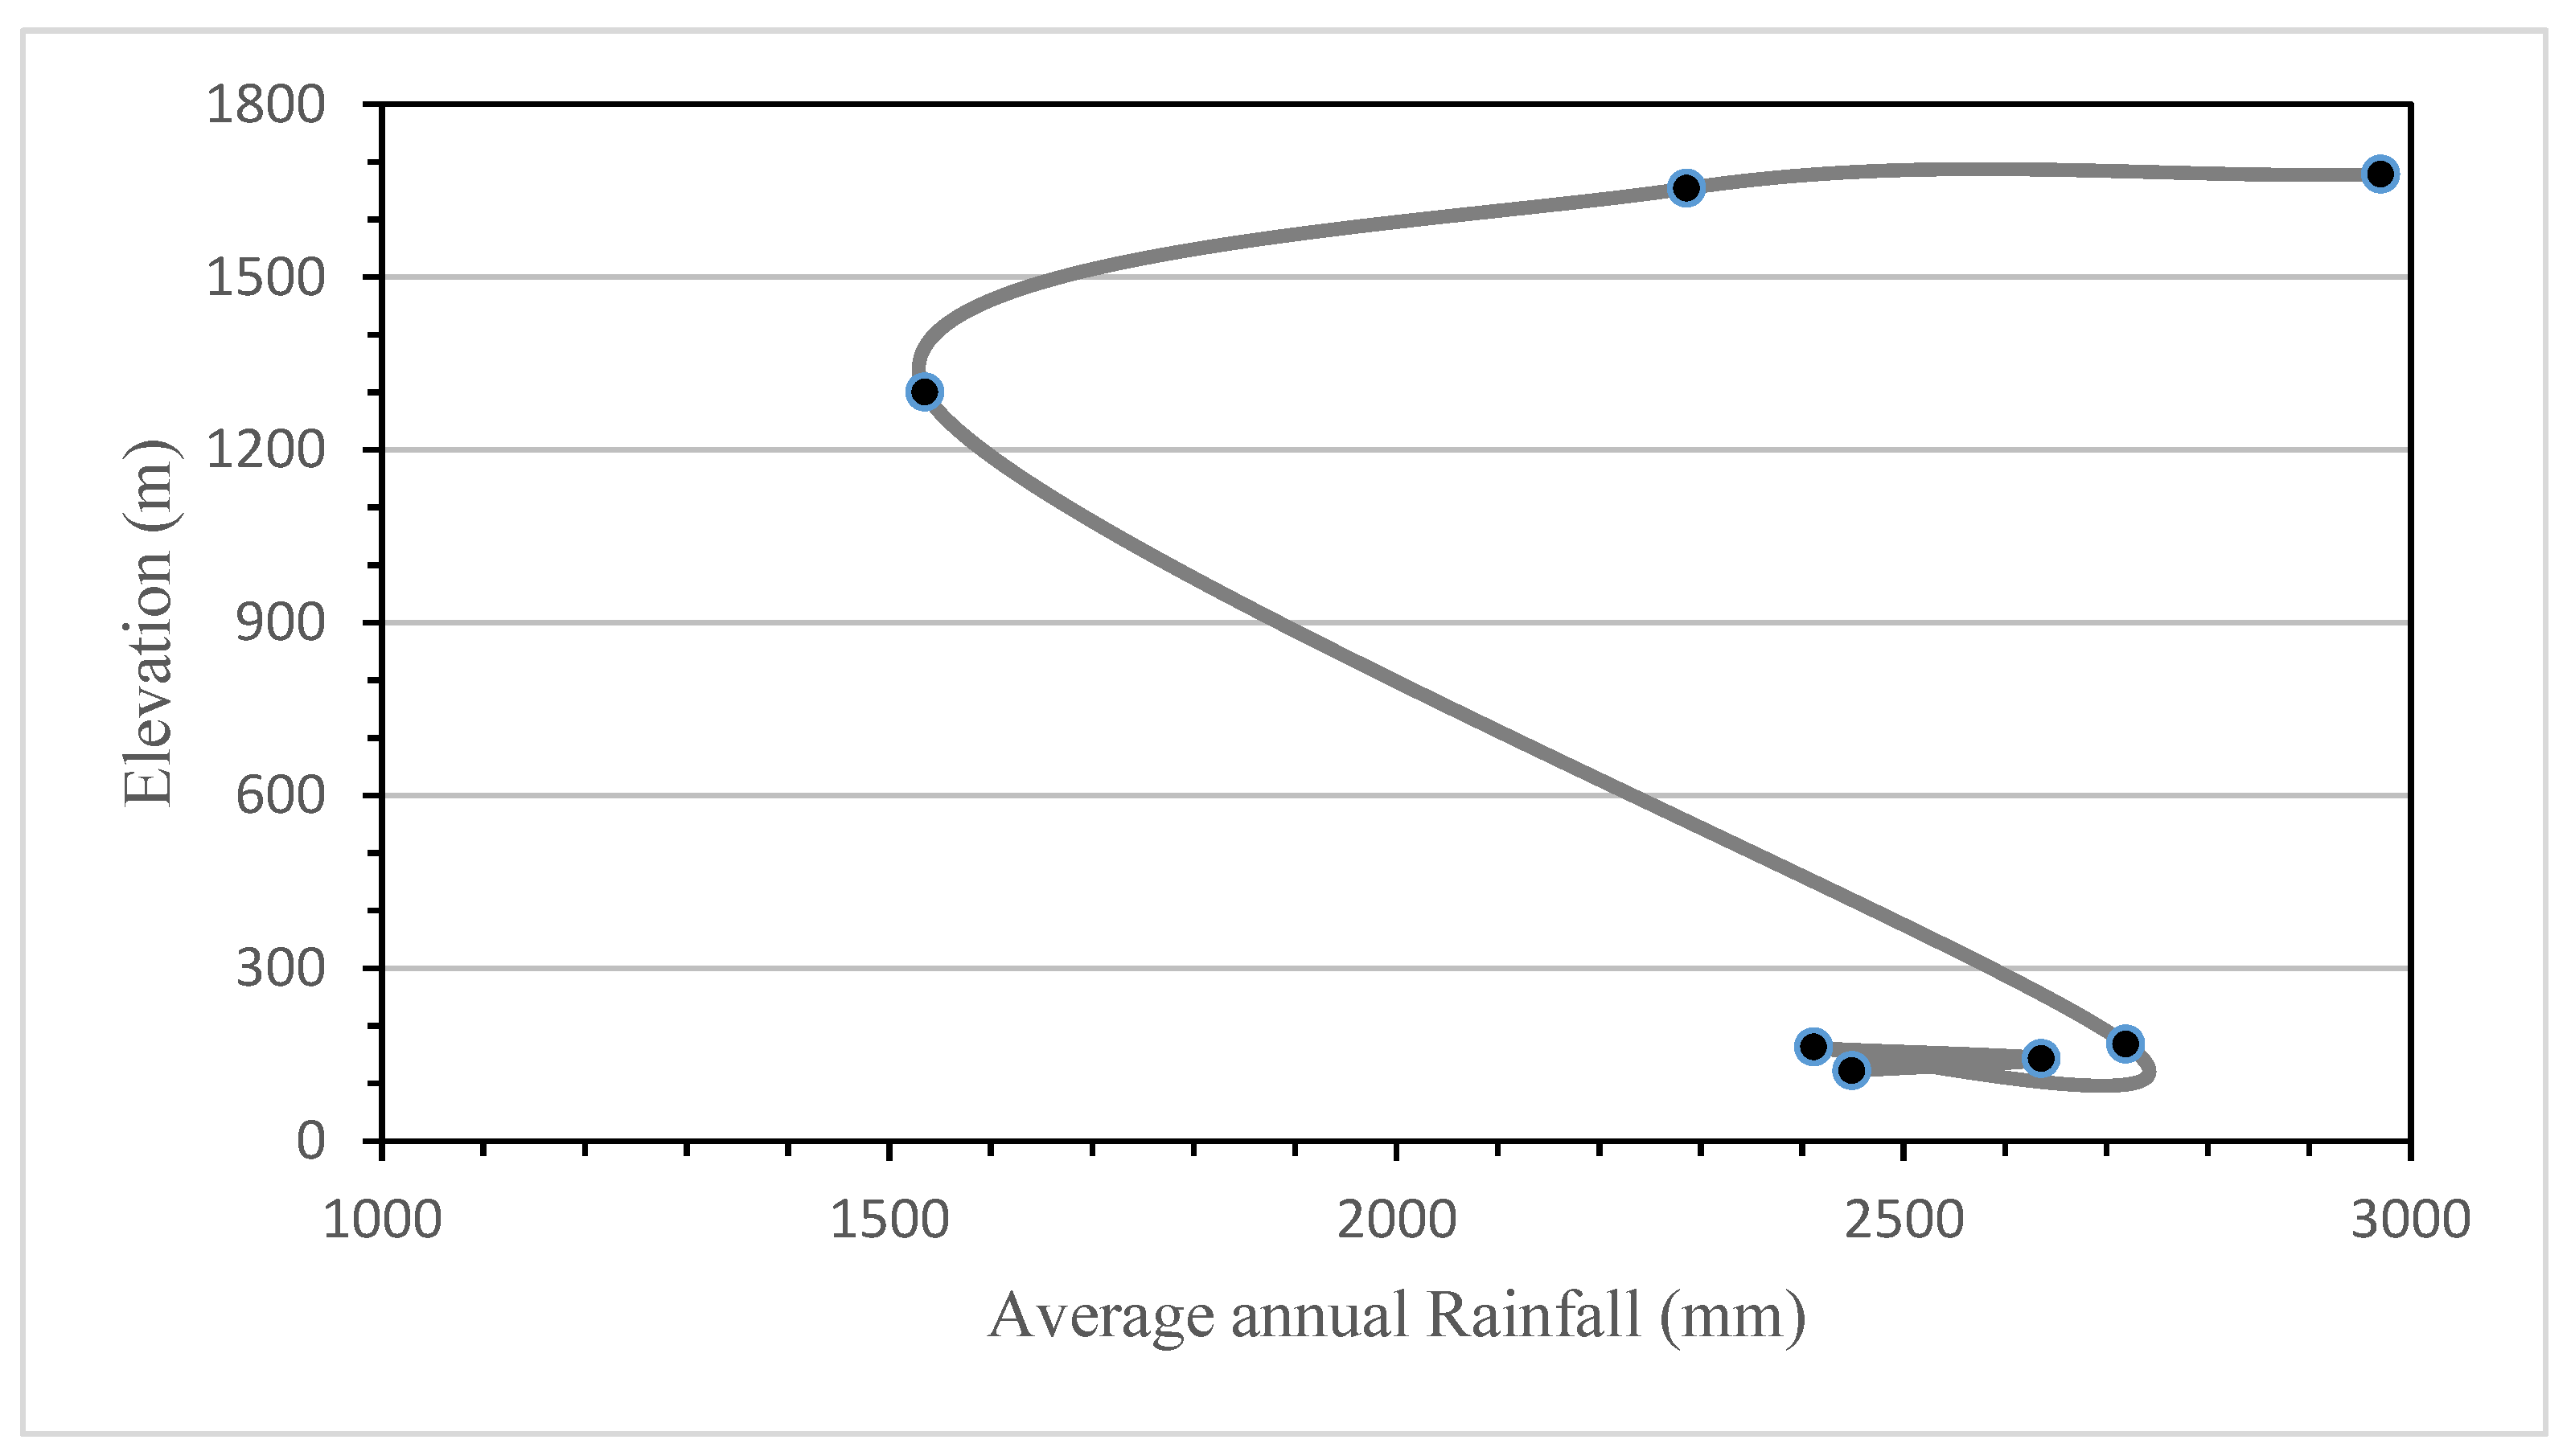
- The precipitation pattern in the region is unique and is influenced by the orographic effect. The spring precipitation is increasing and the summer is decreasing in most of the stations. The summer monsoon is getting weaker and will continue until the 2050s, when it eventually starts to increase until the 2090s, whereas the rainfall in other seasons shows varying trends but will increase in the future. The average annual rainfall is decreasing and will continue to decrease in future.
- The water availability in the region will be highly variable and at a minimum during spring, creating the condition of drought. The discharge will decrease with the decrease in annual precipitation.
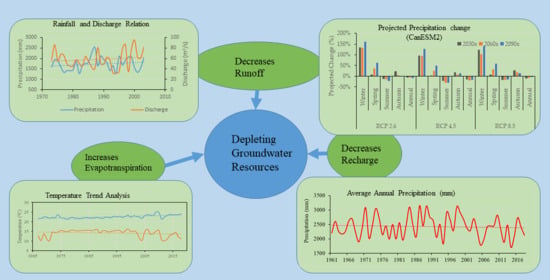
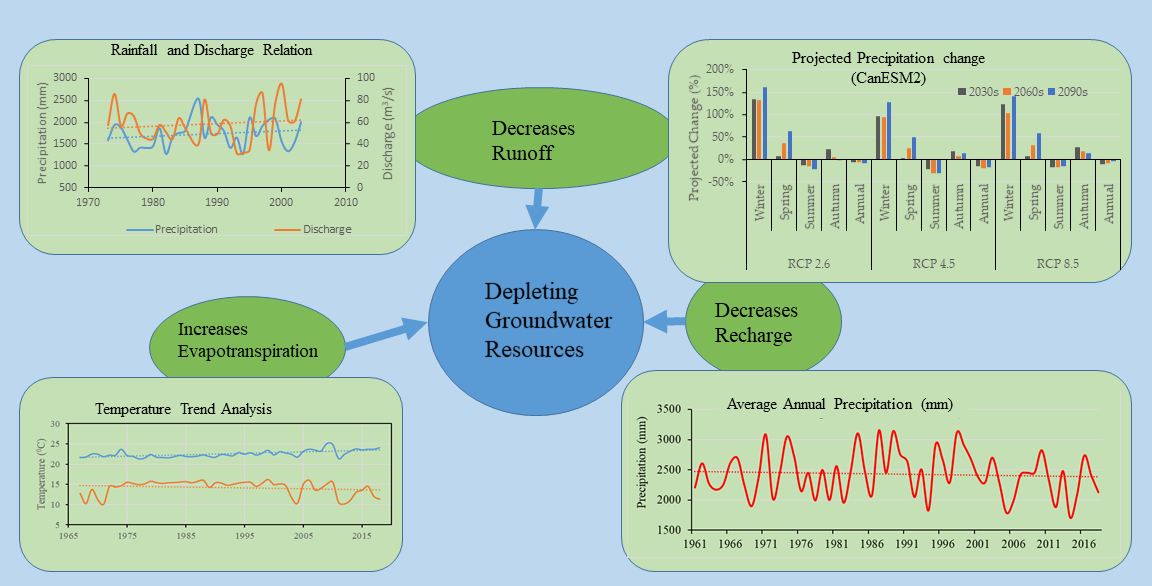
- The groundwater in the Kankai River Basin is likely to be highly influenced by climate change. The impacts could be on the decrease in recharge and runoff and increase in evapotranspiration, and this has been made evident by the observed and projected decrease in water level along with the drying of ponds and springs in the northern hilly region. These impacts will eventually influence the groundwater regime of the region and could further worsen the situation.
Author Contributions
Funding
Acknowledgments
Conflicts of Interest
References
- Houghton, E. IPCC Climate Change 1995: The Science of Climate Change. Contribution of Working Group I to the Second Assessment Report of the Intergovernmental Panel on Climate Change; Cambridge University Press: Cambridge, UK, 1996. [Google Scholar]
- Pal, A.B.; Khare, D.; Mishra, P.K.; Singh, L. Trend analysis of rainfall, temperature and runoff data: A case study of rangoon watershed in nepal. Int. J. Stud. Res. Technol. Manag. 2017, 5, 21–38. [Google Scholar] [CrossRef]
- Nepal, S. Impacts of climate change on the hydrological regime of the Koshi river basin in the Himalayan region. J. Hydro-Environ. Res. 2016, 10, 76–89. [Google Scholar] [CrossRef]
- Khatiwada, K.; Panthi, J.; Shrestha, M.; Nepal, S. Hydro-Climatic Variability in the Karnali River Basin of Nepal Himalaya. Climate 2016, 4, 17. [Google Scholar] [CrossRef]
- Khadka, D.; Babel, M.S.; Shrestha, S.; Tripathi, N.K. Climate change impact on glacier and snow melt and runoff in Tamakoshi basin in the Hindu Kush Himalayan (HKH) region. J. Hydrol. 2014, 511, 49–60. [Google Scholar] [CrossRef]
- Adhikari, T.R.; Devkota, L.P.; Shrestha, A.B. Climate change scenarios and its impact on water resources of Langtang Khola Basin, Nepal. In Proceedings of the International Association of Hydrological Sciences, Bologna, Italy, 4–6 June 2014; Volume 364, pp. 9–13. [Google Scholar]
- Bajracharya, A.R.; Bajracharya, S.R.; Shrestha, A.B.; Maharjan, S.B. Climate change impact assessment on the hydrological regime of the Kaligandaki Basin, Nepal. Sci. Total Environ. 2018, 625, 837–848. [Google Scholar] [CrossRef]
- Dragoni, W.; Sukhija, B.S. Climate change and groundwater: A short review. Geol. Soc. Lond. Spec. Publ. 2008, 288, 1–12. [Google Scholar] [CrossRef]
- Green, T.R. Linking Climate Change and Groundwater. In Integrated Groundwater Management; Jakeman, A.J., Barreteau, O., Hunt, R.J., Rinaudo, J.-D., Ross, A., Eds.; Springer International Publishing: Cham, Germany, 2016; pp. 97–141. [Google Scholar]
- Parry, M.L.; Canziani, O.F.; Palutikof, J.P.; Van Der Linden, P.J.; Hanson, C.E. IPCC Climate Change 2007: Contribution of Working Groups I, II and III to the Fourth Assessment Report of the Intergovernmental Panel on Climate Change; Cambridge University Press: Cambridge, UK, 2007. [Google Scholar]
- Beniston, M.; Diaz, H.F.; Bradley, R.S. Climatic change at high elevation sites: An overview. Clim. Chang. 1997, 36, 233–251. [Google Scholar] [CrossRef]
- Bolch, T.; Kulkarni, A.; Kääb, A.; Huggel, C.; Paul, F.; Cogley, J.G.; Frey, H.; Kargel, J.S.; Fujita, K.; Scheel, M.; et al. The state and fate of himalayan glaciers. Science 2012, 336, 310–314. [Google Scholar] [CrossRef] [PubMed]
- Shrestha, M.L. Interannual variation of summer monsoon rainfall over Nepal and its relation to Southern Oscillation Index. Meteorol. Atmos. Phys. 2000, 75, 21–28. [Google Scholar] [CrossRef]
- Yao, T.; Thompson, L.; Yang, W.; Yu, W.; Gao, Y.; Guo, X.; Yang, X.; Duan, K.; Zhao, H.; Xu, B.; et al. Different glacier status with atmospheric circulations in Tibetan Plateau and surroundings. Nat. Clim. Chang. 2012, 2, 663–667. [Google Scholar] [CrossRef]
- Shrestha, A.B.; Wake, C.P.; Mayewski, P.A.; Dibb, J.E. Maximum Temperature Trends in the Himalaya and Its Vicinity: An Analysis Based on Temperature Records from Nepal for the Period 1971–1994. J. Clim. 1999, 12, 2775–2786. [Google Scholar] [CrossRef]
- Salerno, F.; Guyennon, N.; Thakuri, S.; Viviano, G.; Romano, E.; Vuillermoz, E.; Cristofanelli, P.; Stocchi, P.; Agrillo, G.; Ma, Y.; et al. Weak precipitation, warm winters and springs impact glaciers of south slopes of Mt. Everest (central Himalaya) in the last 2 decades (1994–2013). Cryosphere 2015, 9, 1229–1247. [Google Scholar] [CrossRef]
- Babel, M.S.; Bhusal, S.P.; Wahid, S.M.; Agarwal, A. Climate change and water resources in the Bagmati River Basin, Nepal. Theor. Appl. Climatol. 2013, 115, 639–654. [Google Scholar] [CrossRef]
- Khadka, D.; Pathak, D. Climate change projection for the marsyangdi river basin, Nepal using statistical downscaling of GCM and its implications in geodisasters. Geoenvironmental Disasters 2016, 3, 15. [Google Scholar] [CrossRef]
- Singh, D.; Gupta, R.D.; Jain, S.K. Assessment of impact of climate change on water resources in a hilly river basin. Arab. J. Geosci. 2015, 8, 10625–10646. [Google Scholar] [CrossRef]
- Pervez, M.S.; Henebry, G.M. Projections of the Ganges–Brahmaputra precipitation—Downscaled from GCM predictors. J. Hydrol. 2014, 517, 120–134. [Google Scholar] [CrossRef]
- Li, H.; Xu, C.Y.; Beldring, S.; Tallaksen, L.M.; Jain, S.K. Water resources under climate change in himalayan basins. Water Resour. Manag. 2015, 30, 843–859. [Google Scholar] [CrossRef]
- Rajbhandari, R.; Shrestha, A.B.; Nepal, S.; Wahid, S. Projection of Future Climate over the Koshi River Basin Based on CMIP5 GCMs. Atmos. Clim. Sci. 2016, 6, 190–204. [Google Scholar] [CrossRef]
- Earman, S.; Dettinger, M. Potential impacts of climate change on groundwater resources—A global review. J. Water Clim. Chang. 2011, 2, 213–229. [Google Scholar] [CrossRef]
- Kundzewicz, Z.W.; Mata, L.J.; Arnell, N.W.; Doll, P.; Kabat, P.; Jimenez, B.; Miller, K.A.; Oki, T.; Sen, Z.; Shiklomanov, I.A. Freshwater Resources and their Management. In Climate Change 2007: Impacts, Adaptation and Vulnerability. Contribution ofWorking Group II to the Fourth Assessment Report of the Intergovernmental Panel on Climate Change; Parry, M.L., Canzizni, O.F., Palutokof, J.P., van der Linden, P.J., Hanson, C.E., Eds.; Cambridge University Press: Cambridge, UK, 2007. [Google Scholar]
- Taylor, R.G.; Scanlon, B.; Döll, P.; Rodell, M.; van Beek, R.; Wada, Y.; Longuevergne, L.; Leblanc, M.; Famiglietti, J.S.; Edmunds, M.; et al. Ground water and climate change. Nat. Clim. Chang. 2013, 3, 322–329. [Google Scholar] [CrossRef]
- Sophocleous, M. Climate Change: Why Should Water Professionals Care? Groundwater 2004, 42, 637. [Google Scholar] [CrossRef] [PubMed]
- Agarwal, A.; Babel, M.S.; Maskey, S. Estimating the Impacts and Uncertainty of Climate Change on the Hydrology and Water Resources of the Koshi River Basin. In Managing Water Resources under Climate Uncertainty; Springer: Cham, Switzerland, 2015; pp. 105–126. [Google Scholar] [CrossRef]
- Burhanuddin, S.N.Z.A.; Deni, S.M.; Mohamed, R.N. Revised Normal Ratio Methods for Imputation of Missing Rainfall Data. Sci. Res. J. 2016, 13, 83–97. [Google Scholar] [CrossRef]
- Suhaila, J.; Sayang, M.D.; Jemain, A.A. Revised Spatial Weighting Methods for Estimation of Missing Rainfall Data Jamaludin. Asia-Pac. J. Atmos. Sci. 2008, 22, 93–104. [Google Scholar]
- Paulhus, J.L.H.; Kohler, M.A. Interpolation of Missing Precipitation Data. Mon. Weather Rev. 1952, 80, 129–133. [Google Scholar] [CrossRef]
- Van Buuren, S. Multiple imputation of discrete and continuous data by fully conditional specification. Stat. Methods Med. Res. 2007, 16, 219–242. [Google Scholar] [CrossRef]
- Mann, H.B. Nonparametric tests against trend. Econom. J. Econom. Soc. 1945, 13, 245–259. [Google Scholar] [CrossRef]
- Kendall, M.G. Rank Correlation Methods, 4th ed.; Charles Griffin: London, UK, 1975. [Google Scholar]
- Sen, P.K. Estimates of the Regression Coefficient Based on Kendall’s Tau. J. Am. Stat. Assoc. 1968, 63, 1379–1389. [Google Scholar] [CrossRef]
- Akter, S.; Howladar, M.F.; Ahmed, Z.; Chowdhury, T.R. The rainfall and discharge trends of Surma River area in North—Eastern part of Bangladesh: An approach for understanding the impacts of climatic change. Environ. Syst. Res. 2019, 8, 1–12. [Google Scholar] [CrossRef]
- Gautam, M.R.; Acharya, K. Streamflow trends in Nepal. Hydrol. Sci. J. 2012, 57, 344–357. [Google Scholar] [CrossRef]
- Yue, S. Applicability of prewhitening to eliminate the influence of serial correlation on the Mann-Kendall test. Water Resour. Res. 2002, 38, 1–7. [Google Scholar] [CrossRef]
- Shafiq, M.; Ramzan, S.; Ahmed, P.; Mahmood, R.; Dimri, A.P. Assessment of present and future climate change over Kashmir Himalayas, India. Theor. Appl. Climatol. 2019, 137, 3183–3195. [Google Scholar] [CrossRef]
- Wilby, R.L.; Dawson, C.W. SDSM 4.2—A decision support tool for th e assessment of regional climate change impacts. In User Manual; 2007; p. 94. Available online: https://sdsm.org.uk/SDSMManual.pdf (accessed on 10 July 2020).
- Mahmood, R.; Jia, S.; Babel, M.S. Potential impacts of climate change on water resources in the kunhar river basin, Pakistan. Water 2016, 8, 23. [Google Scholar] [CrossRef]
- Teutschbein, C.; Seibert, J. Bias correction of regional climate model simulations for hydrological climate-change impact studies: Review and evaluation of different methods. J. Hydrol. 2012, 456–457, 12–29. [Google Scholar] [CrossRef]
- ICIMOD. Land Cover of Nepal 1990. Available online: https://rds.icimod.org/Home/DataDetail?metadataId=20828&searchlist=True&fbclid=IwAR26BdZmnoiDVfzNIK9m1xFbvs8fXhoR23mvV3lrqYm8LVUJPbE8OnD7OYI (accessed on 20 October 2020).
- ICIMOD. Land Cover of Nepal 2010. Available online: https://rds.icimod.org/Home/DataDetail?metadataId=9224&searchlist=True (accessed on 20 October 2020).
- Rangwala, I.; Miller, J.R. Climate change in mountains: A review of elevation-dependent warming and its possible causes. Clim. Chang. 2012, 114, 527–547. [Google Scholar] [CrossRef]
- DHM. Observed Climate Trend Analysis in the Districts and Physiographic Regions of Nepal (1971–2014); Department of Hydrology and Meteorology: Kathmandu, Nepal, 2017; ISBN 052159386. [Google Scholar]
- Dhital, Y.P.; Tang, Q.; Shi, J. Hydroclimatological changes in the Bagmati River Basin, Nepal. J. Geogr. Sci. 2013, 23, 612–626. [Google Scholar] [CrossRef]
- Kansakar, S.R.; Hannah, D.M.; Gerrard, J.; Rees, G. Spatial pattern in the precipitation regime of Nepal. Int. J. Climatol. 2004, 24, 1645–1659. [Google Scholar] [CrossRef]
- Palazzi, E.; von Hardenberg, J.; Provenzale, A. Precipitation in the Hindu-Kush Karakoram Himalaya: Observations and future scenarios. J. Geophys. Res. Atmos. 2013, 118, 85–100. [Google Scholar] [CrossRef]
- Bingyi, W. Weakening of Indian summer monsoon in recent decades. Adv. Atmos. Sci. 2005, 22, 21–29. [Google Scholar] [CrossRef]
- Zhao, H.; Xu, B.; Yao, T.; Wu, G.; Lin, S.; Gao, J.; Wang, M. Deuterium excess record in a southern Tibetan ice core and its potential climatic implications. Clim. Dyn. 2012, 38, 1791–1803. [Google Scholar] [CrossRef]
- Green, T.R.; Bates, B.C.; Charles, S.P.; Fleming, P.M. Physically Based Simulation of Potential Effects of Carbon Dioxide-Altered Climates on Groundwater Recharge. Vadose Zone J. 2007, 6, 597–609. [Google Scholar] [CrossRef]
- Chiew, F.H.S.; Mcmahon, T.A. Modelling the impacts of climate change on Australian streamflow. Hydrol. Process. 2002, 16, 1235–1245. [Google Scholar] [CrossRef]


| S. No. | Name | Type | Latitude (Deg_Min) | Longitude (Deg_Min) | Elevation (m) |
|---|---|---|---|---|---|
| 1 | Ilam Tea Estate (1407) | P, T | 26_55 | 87_54 | 1300 |
| 2 | Damak (1408) | P | 26_40 | 87_42 | 163 |
| 3 | Anarmani Birta (1409) | P | 26_38 | 87_59 | 122 |
| 4 | Himali Gaun (1410) | P | 26_53 | 88_02 | 1654 |
| 5 | Sanischare (1415) | P | 26_41 | 87_58 | 168 |
| 6 | Kanyam Tea Estate (1416) | P, T | 26_52 | 88_04 | 1678 |
| 7 | Gaida (Kankai) (1421) | P, T | 26_35 | 87_54 | 143 |
| 8 | Mainachuli (795) | D | 26_41 | 87_52 | 125 |
| Mean | CV | SD | Skewness | Kurtosis | Kendall’s Tau | p-Value | Sen’s Slope | ||
|---|---|---|---|---|---|---|---|---|---|
| 1407 Tmax | Winter | 18.1 | 0.07 | 1.29 | 1.04 | 0.55 | 0.385 | 0.02 * | 0.047 |
| Spring | 24.2 | 0.05 | 1.12 | 0.50 | 0.56 | 0.110 | 0.25 | 0.014 | |
| Summer | 25.2 | 0.04 | 1.07 | 0.54 | 1.74 | 0.452 | 0.00 * | 0.036 | |
| Autumn | 22.9 | 0.05 | 1.21 | 0.71 | 0.43 | 0.531 | 0.00 * | 0.053 | |
| Annual | 22.6 | 0.04 | 0.86 | 0.95 | 0.55 | 0.486 | 0.00 * | 0.038 | |
| 1416 Tmax | Winter | 14.5 | 0.08 | 1.10 | 0.77 | 0.28 | 0.546 | 0.00 * | 0.054 |
| Spring | 21.1 | 0.05 | 1.13 | −0.12 | −0.79 | 0.416 | 0.01 * | 0.052 | |
| Summer | 22.3 | 0.05 | 1.05 | −0.60 | −0.24 | 0.382 | 0.01 * | 0.042 | |
| Autumn | 19.8 | 0.06 | 1.28 | −0.12 | −1.03 | 0.451 | 0.00 * | 0.064 | |
| Annual | 19.4 | 0.04 | 0.88 | 0.06 | −1.27 | 0.544 | 0.00 * | 0.052 | |
| 1421 Tmax | Winter | 25.7 | 0.04 | 1.09 | 0.85 | 0.38 | 0.146 | 0.22 | 0.026 |
| Spring | 32.6 | 0.02 | 0.79 | −0.49 | 0.47 | 0.116 | 0.34 | 0.014 | |
| Summer | 33.0 | 0.02 | 0.66 | −0.48 | −0.36 | 0.550 | 0.00 * | 0.047 | |
| Autumn | 31.0 | 0.03 | 0.80 | −0.34 | −0.19 | 0.291 | 0.11 | 0.033 | |
| Annual | 30.8 | 0.02 | 0.55 | 0.08 | −0.64 | 0.365 | 0.04 * | 0.030 | |
| 1407 Tmin | Winter | 9.8 | 0.09 | 0.84 | −0.88 | 2.02 | −0.051 | 0.59 | −0.003 |
| Spring | 15.2 | 0.14 | 2.21 | −1.29 | 0.46 | −0.173 | 0.28 | −0.026 | |
| Summer | 17.8 | 0.18 | 3.15 | −1.60 | 1.23 | −0.113 | 0.49 | −0.015 | |
| Autumn | 14.1 | 0.17 | 2.36 | −0.94 | −0.12 | 0.000 | 1.00 | 0.000 | |
| Annual | 14.2 | 0.13 | 1.80 | −1.21 | 0.15 | −0.101 | 0.55 | −0.013 | |
| 1416 Tmin | Winter | 6.1 | 0.13 | 0.83 | 0.42 | −0.15 | 0.020 | 0.90 | 0.002 |
| Spring | 11.8 | 0.12 | 1.42 | −1.16 | 2.22 | −0.208 | 0.04 * | −0.031 | |
| Summer | 16.2 | 0.12 | 1.94 | −3.02 | 11.42 | −0.061 | 0.70 | −0.012 | |
| Autumn | 10.8 | 0.12 | 1.36 | −0.45 | 0.67 | 0.067 | 0.52 | 0.010 | |
| Annual | 11.2 | 0.09 | 0.98 | −0.87 | 1.63 | −0.065 | 0.69 | −0.006 | |
| 1421 Tmin | Winter | 9.7 | 0.14 | 1.39 | −1.38 | 2.19 | 0.092 | 0.45 | 0.011 |
| Spring | 18.2 | 0.11 | 2.05 | −1.70 | 2.53 | −0.055 | 0.65 | −0.007 | |
| Summer | 23.5 | 0.06 | 1.49 | −2.15 | 4.07 | 0.022 | 0.87 | 0.002 | |
| Autumn | 16.9 | 0.10 | 1.79 | −1.51 | 1.75 | −0.066 | 0.59 | −0.010 | |
| Annual | 17.7 | 0.08 | 1.36 | −1.32 | 3.52 | 0.002 | 1.00 | 0.000 |
| Statistic | Mean | CV | SD | Skewness | Kurtosis | Kendall’s Tau | p-Value | Sen’s Slope | |
|---|---|---|---|---|---|---|---|---|---|
| 1407 | Winter | 28.93 | 0.90 | 26.23 | 0.91 | −0.04 | −0.06 | 0.52 | −0.10 |
| Spring | 217.49 | 0.34 | 74.12 | 0.32 | −0.62 | 0.02 | 0.80 | 0.22 | |
| Summer | 1211.86 | 0.26 | 312.27 | 0.29 | −0.49 | −0.12 | 0.42 | −3.52 | |
| Autumn | 76.92 | 0.95 | 74.01 | 1.75 | 3.12 | 0.03 | 0.76 | 0.09 | |
| Annual | 1535.36 | 0.22 | 336.33 | 0.47 | 0.16 | −0.13 | 0.15 | −3.91 | |
| 1408 | Winter | 32.12 | 1.07 | 34.71 | 1.64 | 2.97 | −0.07 | 0.46 | −0.10 |
| Spring | 274.43 | 0.51 | 141.11 | 2.71 | 13.10 | 0.25 | 0.01 * | 2.08 | |
| Summer | 1972.32 | 0.23 | 452.06 | 0.45 | −0.82 | −0.15 | 0.09 | −5.30 | |
| Autumn | 132.46 | 0.86 | 114.93 | 1.47 | 2.27 | −0.08 | 0.53 | −0.63 | |
| Annual | 2411.32 | 0.22 | 534.86 | 0.96 | 1.80 | −0.09 | 0.31 | −4.13 | |
| 1409 | Winter | 24.97 | 1.16 | 29.26 | 1.84 | 4.24 | −0.03 | 0.77 | 0.00 |
| Spring | 259.33 | 0.45 | 117.45 | 0.31 | −0.08 | 0.27 | 0.00 * | 2.74 | |
| Summer | 2034.78 | 0.21 | 420.98 | 0.46 | −0.60 | 0.07 | 0.43 | 2.93 | |
| Autumn | 129.83 | 0.84 | 110.37 | 1.63 | 3.35 | 0.04 | 0.65 | 0.26 | |
| Annual | 2448.91 | 0.20 | 498.04 | 0.47 | −0.59 | 0.11 | 0.20 | 6.20 | |
| 1410 | Winter | 38.06 | 0.82 | 31.41 | 0.91 | 0.21 | −0.04 | 0.67 | −0.10 |
| Spring | 285.37 | 0.42 | 120.83 | 0.77 | 0.73 | 0.19 | 0.03 * | 1.89 | |
| Summer | 1857.71 | 0.17 | 313.39 | 0.16 | −0.90 | 0.00 | 0.97 | 0.08 | |
| Autumn | 104.71 | 0.86 | 91.16 | 1.36 | 1.38 | 0.00 | 0.97 | 0.03 | |
| Annual | 2286.15 | 0.15 | 338.19 | 0.07 | −0.29 | 0.09 | 0.30 | 2.84 | |
| 1415 | Winter | 29.18 | 1.06 | 31.27 | 1.82 | 4.57 | −0.11 | 0.21 | −0.19 |
| Spring | 300.18 | 0.40 | 120.22 | 1.13 | 1.33 | 0.20 | 0.03 * | 1.72 | |
| Summer | 2244.78 | 0.19 | 421.48 | −0.18 | −0.30 | −0.03 | 0.74 | −1.13 | |
| Autumn | 144.91 | 0.81 | 118.37 | 1.71 | 3.88 | 0.02 | 0.84 | 0.12 | |
| Annual | 2719.16 | 0.17 | 471.25 | −0.22 | −0.38 | 0.01 | 0.89 | 0.64 | |
| 1416 | Winter | 47.43 | 0.92 | 44.15 | 1.96 | 5.14 | −0.15 | 0.11 | −0.42 |
| Spring | 360.66 | 0.39 | 142.97 | 0.99 | 0.86 | 0.04 | 0.65 | 0.59 | |
| Summer | 2418.30 | 0.17 | 415.86 | 0.45 | −0.12 | −0.12 | 0.43 | −4.40 | |
| Autumn | 143.61 | 0.88 | 127.21 | 1.68 | 3.14 | −0.06 | 0.54 | −0.36 | |
| Annual | 2970.21 | 0.16 | 469.63 | 0.39 | 0.17 | −0.12 | 0.43 | −5.53 | |
| 1421 | Winter | 30.48 | 0.96 | 29.49 | 1.31 | 1.33 | −0.05 | 0.55 | −0.08 |
| Spring | 287.97 | 0.41 | 117.81 | 1.37 | 2.93 | 0.16 | 0.08 | 1.40 | |
| Summer | 2174.08 | 0.20 | 445.83 | 0.57 | 0.20 | −0.12 | 0.17 | −4.67 | |
| Autumn | 143.29 | 0.76 | 109.19 | 1.13 | 1.01 | −0.07 | 0.46 | −0.65 | |
| Annual | 2635.91 | 0.19 | 506.35 | 0.56 | 0.04 | −0.08 | 0.37 | −3.65 |
| Mean | SD | CV | Skewness | Kurtosis | Kendall’s Tau | p-Value | Sen’s Slope | |
|---|---|---|---|---|---|---|---|---|
| Winter | 18.39 | 5.65 | 0.30 | 0.88 | 0.00 | 0.02 | 0.89 | 0.01 |
| Spring | 10.09 | 2.70 | 0.26 | 0.39 | −1.03 | 0.22 | 0.09 | 0.10 |
| Summer | 105.69 | 41.06 | 0.38 | 0.36 | −0.77 | −0.01 | 0.95 | −0.23 |
| Autumn | 94.20 | 34.27 | 0.36 | 0.73 | 1.01 | 0.04 | 0.79 | 0.17 |
| Annual | 58.12 | 17.03 | 0.29 | 0.36 | −0.51 | 0.04 | 0.76 | 0.16 |
| Stations | Calibration Period | Validation Period | |||||
|---|---|---|---|---|---|---|---|
| Mean | SD | R2 | Mean | SD | R2 | ||
| 1407 | Observed | 132.55 | 147.77 | 0.997 | 139.01 | 156.89 | 0.92 |
| Simulated | 129.28 | 140.56 | 124.38 | 127.84 | |||
| 1408 | Observed | 209.53 | 245.84 | 0.997 | 191.24 | 218.21 | 0.96 |
| Simulated | 208.80 | 240.12 | 179.49 | 201.25 | |||
| 1409 | Observed | 194.11 | 236.70 | 0.997 | 216.11 | 261.51 | 0.92 |
| Simulated | 195.40 | 230.39 | 173.19 | 202.58 | |||
| 1410 | Observed | 190.67 | 219.99 | 0.998 | 192.39 | 223.76 | 0.98 |
| Simulated | 188.70 | 211.79 | 162.57 | 178.78 | |||
| 1415 | Observed | 226.92 | 272.53 | 0.998 | 231.63 | 274.52 | 0.98 |
| Simulated | 226.84 | 264.35 | 209.62 | 244.00 | |||
| 1416 | Observed | 256.97 | 293.94 | 0.998 | 251.44 | 290.62 | 0.98 |
| Simulated | 251.53 | 288.55 | 212.11 | 236.91 | |||
| 1421 | Observed | 226.93 | 268.65 | 0.974 | 219.21 | 260.83 | 0.94 |
| Simulated | 272.38 | 261.54 | 227.10 | 227.46 | |||
Publisher’s Note: MDPI stays neutral with regard to jurisdictional claims in published maps and institutional affiliations. |
© 2020 by the authors. Licensee MDPI, Basel, Switzerland. This article is an open access article distributed under the terms and conditions of the Creative Commons Attribution (CC BY) license (http://creativecommons.org/licenses/by/4.0/).
Share and Cite
Silwal, C.B.; Pathak, D.; Adhikari, D.; Adhikari, T.R. Climate Change and Its Possible Impact in Groundwater Resource of the Kankai River Basin, East Nepal Himalaya. Climate 2020, 8, 137. https://doi.org/10.3390/cli8110137
Silwal CB, Pathak D, Adhikari D, Adhikari TR. Climate Change and Its Possible Impact in Groundwater Resource of the Kankai River Basin, East Nepal Himalaya. Climate. 2020; 8(11):137. https://doi.org/10.3390/cli8110137
Chicago/Turabian StyleSilwal, Champak Babu, Dinesh Pathak, Drona Adhikari, and Tirtha Raj Adhikari. 2020. "Climate Change and Its Possible Impact in Groundwater Resource of the Kankai River Basin, East Nepal Himalaya" Climate 8, no. 11: 137. https://doi.org/10.3390/cli8110137
APA StyleSilwal, C. B., Pathak, D., Adhikari, D., & Adhikari, T. R. (2020). Climate Change and Its Possible Impact in Groundwater Resource of the Kankai River Basin, East Nepal Himalaya. Climate, 8(11), 137. https://doi.org/10.3390/cli8110137