Blood SIRT1 Shows a Coherent Association with Leptin and Adiponectin in Relation to the Degree and Distribution of Adiposity: A Study in Obesity, Normal Weight and Anorexia Nervosa

 ,
,  , ,
, ,  , ,
, ,
Abstract
:
1. Introduction
2. Materials and Methods
2.1. Study Design and Population
2.2. Plasma SIRT1, Adiponectin and Leptin Assay
2.3. Body Composition Assessment
2.3.1. Dual-energy X-ray absorptiometry analysis
2.3.2. Determination of Liver Adiposity
2.3.3. Echocardiographic Epicardial Fat Thickness Measurements
2.4. Data Management and Statistical Analysis
3. Results
4. Discussion
5. Conclusions
Author Contributions
Funding
Acknowledgments
Conflicts of Interest
References
- Forny-Germano, L.; De Felice, F.G.; Vieira, M. The role of leptin and adiponectin in obesity-associated cognitive decline and Alzheimer’s disease. Front. Neurosci. 2018, 12, 1027. [Google Scholar] [CrossRef] [PubMed] [Green Version]
- Lopez-Jaramillo, P.; Gomez-Arbelaez, D.; Lopez-Lopez, J.; Lopez-Lopez, C.; Martinez-Ortega, J.; Gomez-Rodriguez, A.; Triana-Cubillos, S. The role of leptin/adiponectin ratio in metabolic syndrome and diabetes. Horm. Mol. Biol. Clin. Investig. 2014, 18, 37–45. [Google Scholar] [CrossRef] [PubMed] [Green Version]
- El Ghoch, M.; Milanese, C.; Calugi, S.; Pellegrini, M.; Battistini, N.C.; Dalle Grave, R. Body composition, eating disorder psychopathology, and psychological distress in anorexia nervosa: A longitudinal study. Am. J. Clin. Nutr. 2014, 99, 771–778. [Google Scholar] [CrossRef] [PubMed] [Green Version]
- Nogues, P.; Dos Santos, E.; Jammes, H.; Berveiller, P.; Arnould, L.; Vialard, F.; Dieudonne, M.N. Maternal obesity influences expression and DNA methylation of the adiponectin and leptin systems in human third-trimester placenta. Clin. Epigenetics 2019, 11, 20. [Google Scholar] [CrossRef] [Green Version]
- Zhang, Y.; Chua, S., Jr. Leptin function and regulation. Compr. Physiol. 2017, 8, 351–369. [Google Scholar] [CrossRef]
- Asterholm, I.W.; Scherer, P.E. Enhanced metabolic flexibility associated with elevated adiponectin levels. Am. J. Pathol. 2010, 176, 1364–1376. [Google Scholar] [CrossRef]
- Achari, A.E.; Jain, S.K. Adiponectin, a therapeutic target for obesity, diabetes, and endothelial dysfunction. Int. J. Mol. Sci. 2017, 18, 1321. [Google Scholar] [CrossRef] [Green Version]
- Agra, R.M.; Fernandez-Trasancos, A.; Diaz-Rodriguez, E.; Cordero, A.; Varela-Roman, A.; Gomez-Otero, I.; Canoa, J.N.L.; Fernandez, A.L.; Martinez-Cereijo, J.M.; Gonzalez-Juanatey, J.R.; et al. Nutrients restriction upregulates adiponectin in epicardial or subcutaneous adipose tissue: Impact in de novo heart failure patients. Int. J. Med. Sci. 2018, 15, 417–424. [Google Scholar] [CrossRef]
- Nakagawa, T.; Guarente, L. Sirtuins at a glance. J. Cell Sci. 2011, 124, 833–838. [Google Scholar] [CrossRef] [Green Version]
- Bordone, L.; Motta, M.C.; Picard, F.; Robinson, A.; Jhala, U.S.; Apfeld, J.; McDonagh, T.; Lemieux, M.; McBurney, M.; Szilvasi, A.; et al. Correction: Sirt1 regulates insulin secretion by repressing ucp2 in pancreatic beta cells. PLoS Biol. 2015, 13, e1002346. [Google Scholar] [CrossRef] [Green Version]
- Khanh, V.C.; Zulkifli, A.F.; Tokunaga, C.; Yamashita, T.; Hiramatsu, Y.; Ohneda, O. Aging impairs beige adipocyte differentiation of mesenchymal stem cells via the reduced expression of Sirtuin 1. Biochem. Biophys. Res. Commun. 2018, 500, 682–690. [Google Scholar] [CrossRef] [PubMed]
- Prola, A.; Pires Da Silva, J.; Guilbert, A.; Lecru, L.; Piquereau, J.; Ribeiro, M.; Mateo, P.; Gressette, M.; Fortin, D.; Boursier, C.; et al. SIRT1 protects the heart from ER stress-induced cell death through eIF2alpha deacetylation. Cell Death Differ 2017, 24, 343–356. [Google Scholar] [CrossRef] [PubMed] [Green Version]
- Mariani, S.; di Giorgio, M.R.; Martini, P.; Persichetti, A.; Barbaro, G.; Basciani, S.; Contini, S.; Poggiogalle, E.; Sarnicola, A.; Genco, A.; et al. Inverse association of circulating sirt1 and adiposity: A study on underweight, normal weight, and obese patients. Front. Endocrinol. 2018, 9, 449. [Google Scholar] [CrossRef] [PubMed]
- Martinez-Jimenez, V.; Cortez-Espinosa, N.; Rodriguez-Varela, E.; Vega-Cardenas, M.; Briones-Espinoza, M.; Ruiz-Rodriguez, V.M.; Lopez-Lopez, N.; Briseno-Medina, A.; Turijan-Espinoza, E.; Portales-Perez, D.P. Altered levels of sirtuin genes (SIRT1, SIRT2, SIRT3 and SIRT6) and their target genes in adipose tissue from individual with obesity. Diabetes Metab. Syndr. 2019, 13, 582–589. [Google Scholar] [CrossRef] [PubMed]
- Mariani, S.; Fiore, D.; Basciani, S.; Persichetti, A.; Contini, S.; Lubrano, C.; Salvatori, L.; Lenzi, A.; Gnessi, L. Plasma levels of SIRT1 associate with non-alcoholic fatty liver disease in obese patients. Endocrine 2015, 49, 711–716. [Google Scholar] [CrossRef] [PubMed]
- Mariani, S.; Costantini, D.; Lubrano, C.; Basciani, S.; Caldaroni, C.; Barbaro, G.; Poggiogalle, E.; Donini, L.M.; Lenzi, A.; Gnessi, L. Circulating SIRT1 inversely correlates with epicardial fat thickness in patients with obesity. Nutr. Metab. Cardiovasc. Dis. 2016, 26, 1033–1038. [Google Scholar] [CrossRef] [PubMed] [Green Version]
- Perrini, S.; Porro, S.; Nigro, P.; Cignarelli, A.; Caccioppoli, C.; Genchi, V.A.; Martines, G.; De Fazio, M.; Capuano, P.; Natalicchio, A.; et al. Reduced SIRT1 and SIRT2 expression promotes adipogenesis of human visceral adipose stem cells and associates with accumulation of visceral fat in human obesity. Int. J. Obes. 2020, 44, 307–319. [Google Scholar] [CrossRef]
- Mariani, S.; Fiore, D.; Persichetti, A.; Basciani, S.; Lubrano, C.; Poggiogalle, E.; Genco, A.; Donini, L.M.; Gnessi, L. Circulating SIRT1 increases after intragastric balloon fat loss in obese patients. Obes. Surg. 2016, 26, 1215–1220. [Google Scholar] [CrossRef]
- Madeo, F.; Carmona-Gutierrez, D.; Hofer, S.J.; Kroemer, G. Caloric restriction mimetics against age-associated disease: Targets, mechanisms, and therapeutic potential. Cell Metab. 2019, 29, 592–610. [Google Scholar] [CrossRef] [Green Version]
- Mansur, A.P.; Roggerio, A.; Goes, M.F.S.; Avakian, S.D.; Leal, D.P.; Maranhao, R.C.; Strunz, C.M.C. Serum concentrations and gene expression of sirtuin 1 in healthy and slightly overweight subjects after caloric restriction or resveratrol supplementation: A randomized trial. Int. J. Cardiol. 2017, 227, 788–794. [Google Scholar] [CrossRef]
- Bordone, L.; Cohen, D.; Robinson, A.; Motta, M.C.; van Veen, E.; Czopik, A.; Steele, A.D.; Crowe, H.; Marmor, S.; Luo, J.; et al. SIRT1 transgenic mice show phenotypes resembling calorie restriction. Aging Cell 2007, 6, 759–767. [Google Scholar] [CrossRef] [PubMed]
- Obesity and Overweight Factsheet. Available online: http://www.who.int/mediacentre/factsheets/fs311/en/ (accessed on 8 April 2017).
- Watanabe, M.; Risi, R.; De Giorgi, F.; Tuccinardi, D.; Mariani, S.; Basciani, S.; Lubrano, C.; Lenzi, A.; Gnessi, L. Obesity treatment within the Italian national healthcare system tertiary care centers: What can we learn? Eat. Weight Disord. 2020. [Google Scholar] [CrossRef]
- Mariani, S.; Fiore, D.; Varone, L.; Basciani, S.; Persichetti, A.; Watanabe, M.; Saponara, M.; Spera, G.; Moretti, C.; Gnessi, L. Obstructive sleep apnea and bone mineral density in obese patients. Diabetes Metab. Syndr. Obes. Targets Ther. 2012, 5, 395–401. [Google Scholar] [CrossRef] [Green Version]
- Lonardo, A.; Mantovani, A.; Lugari, S.; Targher, G. Epidemiology and pathophysiology of the association between NAFLD and metabolically healthy or metabolically unhealthy obesity. Ann. Hepatol. 2020, 19, 359–366. [Google Scholar] [CrossRef] [PubMed]
- Dwivedi, A.K.; Dubey, P.; Cistola, D.P.; Reddy, S.Y. Association Between Obesity and Cardiovascular Outcomes: Updated Evidence from Meta-analysis Studies. Curr. Cardiol. Rep. 2020, 22, 25. [Google Scholar] [CrossRef]
- Okamura, T.; Hashimoto, Y.; Hamaguchi, M.; Obora, A.; Kojima, T.; Fukui, M. Ectopic fat obesity presents the greatest risk for incident type 2 diabetes: A population-based longitudinal study. Int. J. Obes. 2019, 43, 139–148. [Google Scholar] [CrossRef]
- Palermo, A.; Tuccinardi, D.; Defeudis, G.; Watanabe, M.; D’Onofrio, L.; Lauria, A.P.; Napoli, N.; Pozzilli, P.; Manfrini, S. BMI and BMD: The potential interplay between obesity and bone fragility. Int. J. Environ. Res. Public Health 2016, 13, 544. [Google Scholar] [CrossRef] [Green Version]
- Arboleda, S.; Vargas, M.; Losada, S.; Pinto, A. Review of obesity and periodontitis: An epidemiological view. Br. Dent. J. 2019, 227, 235–239. [Google Scholar] [CrossRef]
- Basciani, S.; Camajani, E.; Contini, S.; Persichetti, A.; Risi, R.; Bertoldi, L.; Strigari, L.; Prossomariti, G.; Watanabe, M.; Mariani, S.; et al. Very-Low-Calorie ketogenic diets with whey, vegetable or animal protein in patients with obesity: A randomized pilot study. J. Clin. Endocrinol. Metab. 2020, 105, 2939–2949. [Google Scholar] [CrossRef]
- Filippou, C.D.; Tsioufis, C.P.; Thomopoulos, C.G.; Mihas, C.C.; Dimitriadis, K.S.; Sotiropoulou, L.I.; Chrysochoou, C.A.; Nihoyannopoulos, P.I.; Tousoulis, D.M. Dietary approaches to stop hypertension (dash) diet and blood pressure reduction in adults with and without hypertension: A systematic review and meta-analysis of randomized controlled trials. Adv. Nutr. 2020, 11, 1150–1160. [Google Scholar] [CrossRef]
- Watanabe, M.; Tozzi, R.; Risi, R.; Tuccinardi, D.; Mariani, S.; Basciani, S.; Spera, G.; Lubrano, C.; Gnessi, L. Beneficial effects of the ketogenic diet on nonalcoholic fatty liver disease: A comprehensive review of the literature. Obes. Rev. 2020, 21, e13024. [Google Scholar] [CrossRef] [PubMed] [Green Version]
- Srivastava, G.; Apovian, C.M. Current pharmacotherapy for obesity. Nat. Rev. Endocrinol. 2018, 14, 12–24. [Google Scholar] [CrossRef] [PubMed]
- Wiklund, P. The role of physical activity and exercise in obesity and weight management: Time for critical appraisal. J. Sport Health Sci. 2016, 5, 151–154. [Google Scholar] [CrossRef] [Green Version]
- Castelnuovo, G.; Pietrabissa, G.; Manzoni, G.M.; Cattivelli, R.; Rossi, A.; Novelli, M.; Varallo, G.; Molinari, E. Cognitive behavioral therapy to aid weight loss in obese patients: Current perspectives. Psychol. Res. Behav. Manag. 2017, 10, 165–173. [Google Scholar] [CrossRef] [PubMed] [Green Version]
- Basciani, S.; Costantini, D.; Contini, S.; Persichetti, A.; Watanabe, M.; Mariani, S.; Lubrano, C.; Spera, G.; Lenzi, A.; Gnessi, L. Safety and efficacy of a multiphase dietetic protocol with meal replacements including a step with very low calorie diet. Endocrine 2015, 48, 863–870. [Google Scholar] [CrossRef] [PubMed]
- Nakamura, K.; Fuster, J.J.; Walsh, K. Adipokines: A link between obesity and cardiovascular disease. J. Cardiol. 2014, 63, 250–259. [Google Scholar] [CrossRef] [Green Version]
- Derosa, G.; Catena, G.; Gaudio, G.; D’Angelo, A.; Maffioli, P. Adipose tissue dysfunction and metabolic disorders: Is it possible to predict who will develop type 2 diabetes mellitus? Role of markErs in the progreSsion of dIabeteS in obese paTIeNts (The RESISTIN trial). Cytokine 2020, 127, 154947. [Google Scholar] [CrossRef]
- Terra, X.; Auguet, T.; Aguera, Z.; Quesada, I.M.; Orellana-Gavalda, J.M.; Aguilar, C.; Jimenez-Murcia, S.; Berlanga, A.; Guiu-Jurado, E.; Menchon, J.M.; et al. Adipocytokine levels in women with anorexia nervosa. Relationship with weight restoration and disease duration. Int. J. Eat. Disord. 2013, 46, 855–861. [Google Scholar] [CrossRef]
- Karageorgiou, V.; Furukawa, T.A.; Tsigkaropoulou, E.; Karavia, A.; Gournellis, R.; Soureti, A.; Bellos, I.; Douzenis, A.; Michopoulos, I. Adipokines in anorexia nervosa: A systematic review and meta-analysis. Psychoneuroendocrinology 2020, 112, 104485. [Google Scholar] [CrossRef]
- Fang, H.; Judd, R.L. Adiponectin regulation and function. Compr. Physiol. 2018, 8, 1031–1063. [Google Scholar] [CrossRef]
- Schorr, M.; Miller, K.K. The endocrine manifestations of anorexia nervosa: Mechanisms and management. Nat. Rev. Endocrinol. 2017, 13, 174–186. [Google Scholar] [CrossRef] [PubMed]
- Zhang, K.; Guo, Y.; Ge, Z.; Zhang, Z.; Da, Y.; Li, W.; Zhang, Z.; Xue, Z.; Li, Y.; Ren, Y.; et al. Adiponectin Suppresses T helper 17 cell differentiation and limits autoimmune CNS inflammation via the SIRT1/PPARgamma/RORgammat pathway. Mol. Neurobiol. 2017, 54, 4908–4920. [Google Scholar] [CrossRef] [PubMed]
- Liu, L.; Zhang, T.; Hu, J.; Ma, R.; He, B.; Wang, M.; Wang, Y. Adiponectin/SIRT1 axis induces white adipose browning after vertical sleeve gastrectomy of obese rats with type 2 diabetes. Obes. Surg. 2020, 30, 1392–1403. [Google Scholar] [CrossRef] [PubMed]
- Ramadori, G.; Fujikawa, T.; Fukuda, M.; Anderson, J.; Morgan, D.A.; Mostoslavsky, R.; Stuart, R.C.; Perello, M.; Vianna, C.R.; Nillni, E.A.; et al. SIRT1 deacetylase in POMC neurons is required for homeostatic defenses against diet-induced obesity. Cell Metab. 2010, 12, 78–87. [Google Scholar] [CrossRef] [PubMed] [Green Version]
- Sasaki, T.; Kim, H.J.; Kobayashi, M.; Kitamura, Y.I.; Yokota-Hashimoto, H.; Shiuchi, T.; Minokoshi, Y.; Kitamura, T. Induction of hypothalamic Sirt1 leads to cessation of feeding via agouti-related peptide. Endocrinology 2010, 151, 2556–2566. [Google Scholar] [CrossRef] [Green Version]
- Ramadori, G.; Lee, C.E.; Bookout, A.L.; Lee, S.; Williams, K.W.; Anderson, J.; Elmquist, J.K.; Coppari, R. Brain SIRT1: Anatomical distribution and regulation by energy availability. J. Neurosci. 2008, 28, 9989–9996. [Google Scholar] [CrossRef]
- Karczewska-Kupczewska, M.; Straczkowski, M.; Adamska, A.; Nikolajuk, A.; Otziomek, E.; Gorska, M.; Kowalska, I. Insulin sensitivity, metabolic flexibility, and serum adiponectin concentration in women with anorexia nervosa. Metabolism 2010, 59, 473–477. [Google Scholar] [CrossRef]
- Hosoi, T.; Maffei, M. Editorial: Leptin Resistance in Metabolic Disorders: Possible Mechanisms and Treatments. Front. Endocrinol. 2017, 8, 300. [Google Scholar] [CrossRef] [Green Version]
- Sasaki, T. Age-associated weight gain, leptin, and SIRT1: A possible role for hypothalamic SIRT1 in the prevention of weight gain and aging through modulation of leptin sensitivity. Front. Endocrinol. 2015, 6, 109. [Google Scholar] [CrossRef] [Green Version]
- Ardid-Ruiz, A.; Ibars, M.; Mena, P.; Del Rio, D.; Muguerza, B.; Blade, C.; Arola, L.; Aragones, G.; Suarez, M. Potential involvement of peripheral leptin/STAT3 signaling in the effects of resveratrol and its metabolites on reducing body fat accumulation. Nutrients 2018, 10, 1757. [Google Scholar] [CrossRef] [Green Version]
- Gonzalez, N.; Moreno-Villegas, Z.; Gonzalez-Bris, A.; Egido, J.; Lorenzo, O. Regulation of visceral and epicardial adipose tissue for preventing cardiovascular injuries associated to obesity and diabetes. Cardiovasc. Diabetol. 2017, 16, 44. [Google Scholar] [CrossRef] [PubMed]
- Lee, M.J.; Wu, Y.; Fried, S.K. Adipose tissue heterogeneity: Implication of depot differences in adipose tissue for obesity complications. Mol. Asp. Med. 2013, 34, 1–11. [Google Scholar] [CrossRef] [PubMed] [Green Version]
- Watanabe, M.; Caruso, D.; Tuccinardi, D.; Risi, R.; Zerunian, M.; Polici, M.; Pucciarelli, F.; Tarallo, M.; Strigari, L.; Manfrini, S.; et al. Visceral fat shows the strongest association with the need of intensive care in patients with COVID-19. Metabolism 2020, 111, 154319. [Google Scholar] [CrossRef] [PubMed]
- Mariani, S.; Di Rocco, G.; Toietta, G.; Russo, M.A.; Petrangeli, E.; Salvatori, L. Sirtuins 1-7 expression in human adipose-derived stem cells from subcutaneous and visceral fat depots: Influence of obesity and hypoxia. Endocrine 2017, 57, 455–463. [Google Scholar] [CrossRef]
- Ding, R.B.; Bao, J.; Deng, C.X. Emerging roles of SIRT1 in fatty liver diseases. Int. J. Biol. Sci. 2017, 13, 852–867. [Google Scholar] [CrossRef]
- Fruhbeck, G.; Catalan, V.; Rodriguez, A.; Gomez-Ambrosi, J. Adiponectin-leptin ratio: A promising index to estimate adipose tissue dysfunction. Relation with obesity-associated cardiometabolic risk. Adipocyte 2018, 7, 57–62. [Google Scholar] [CrossRef]


| Anorexia Nervosa | Normal Weight | Obesity | p-Value | |
|---|---|---|---|---|
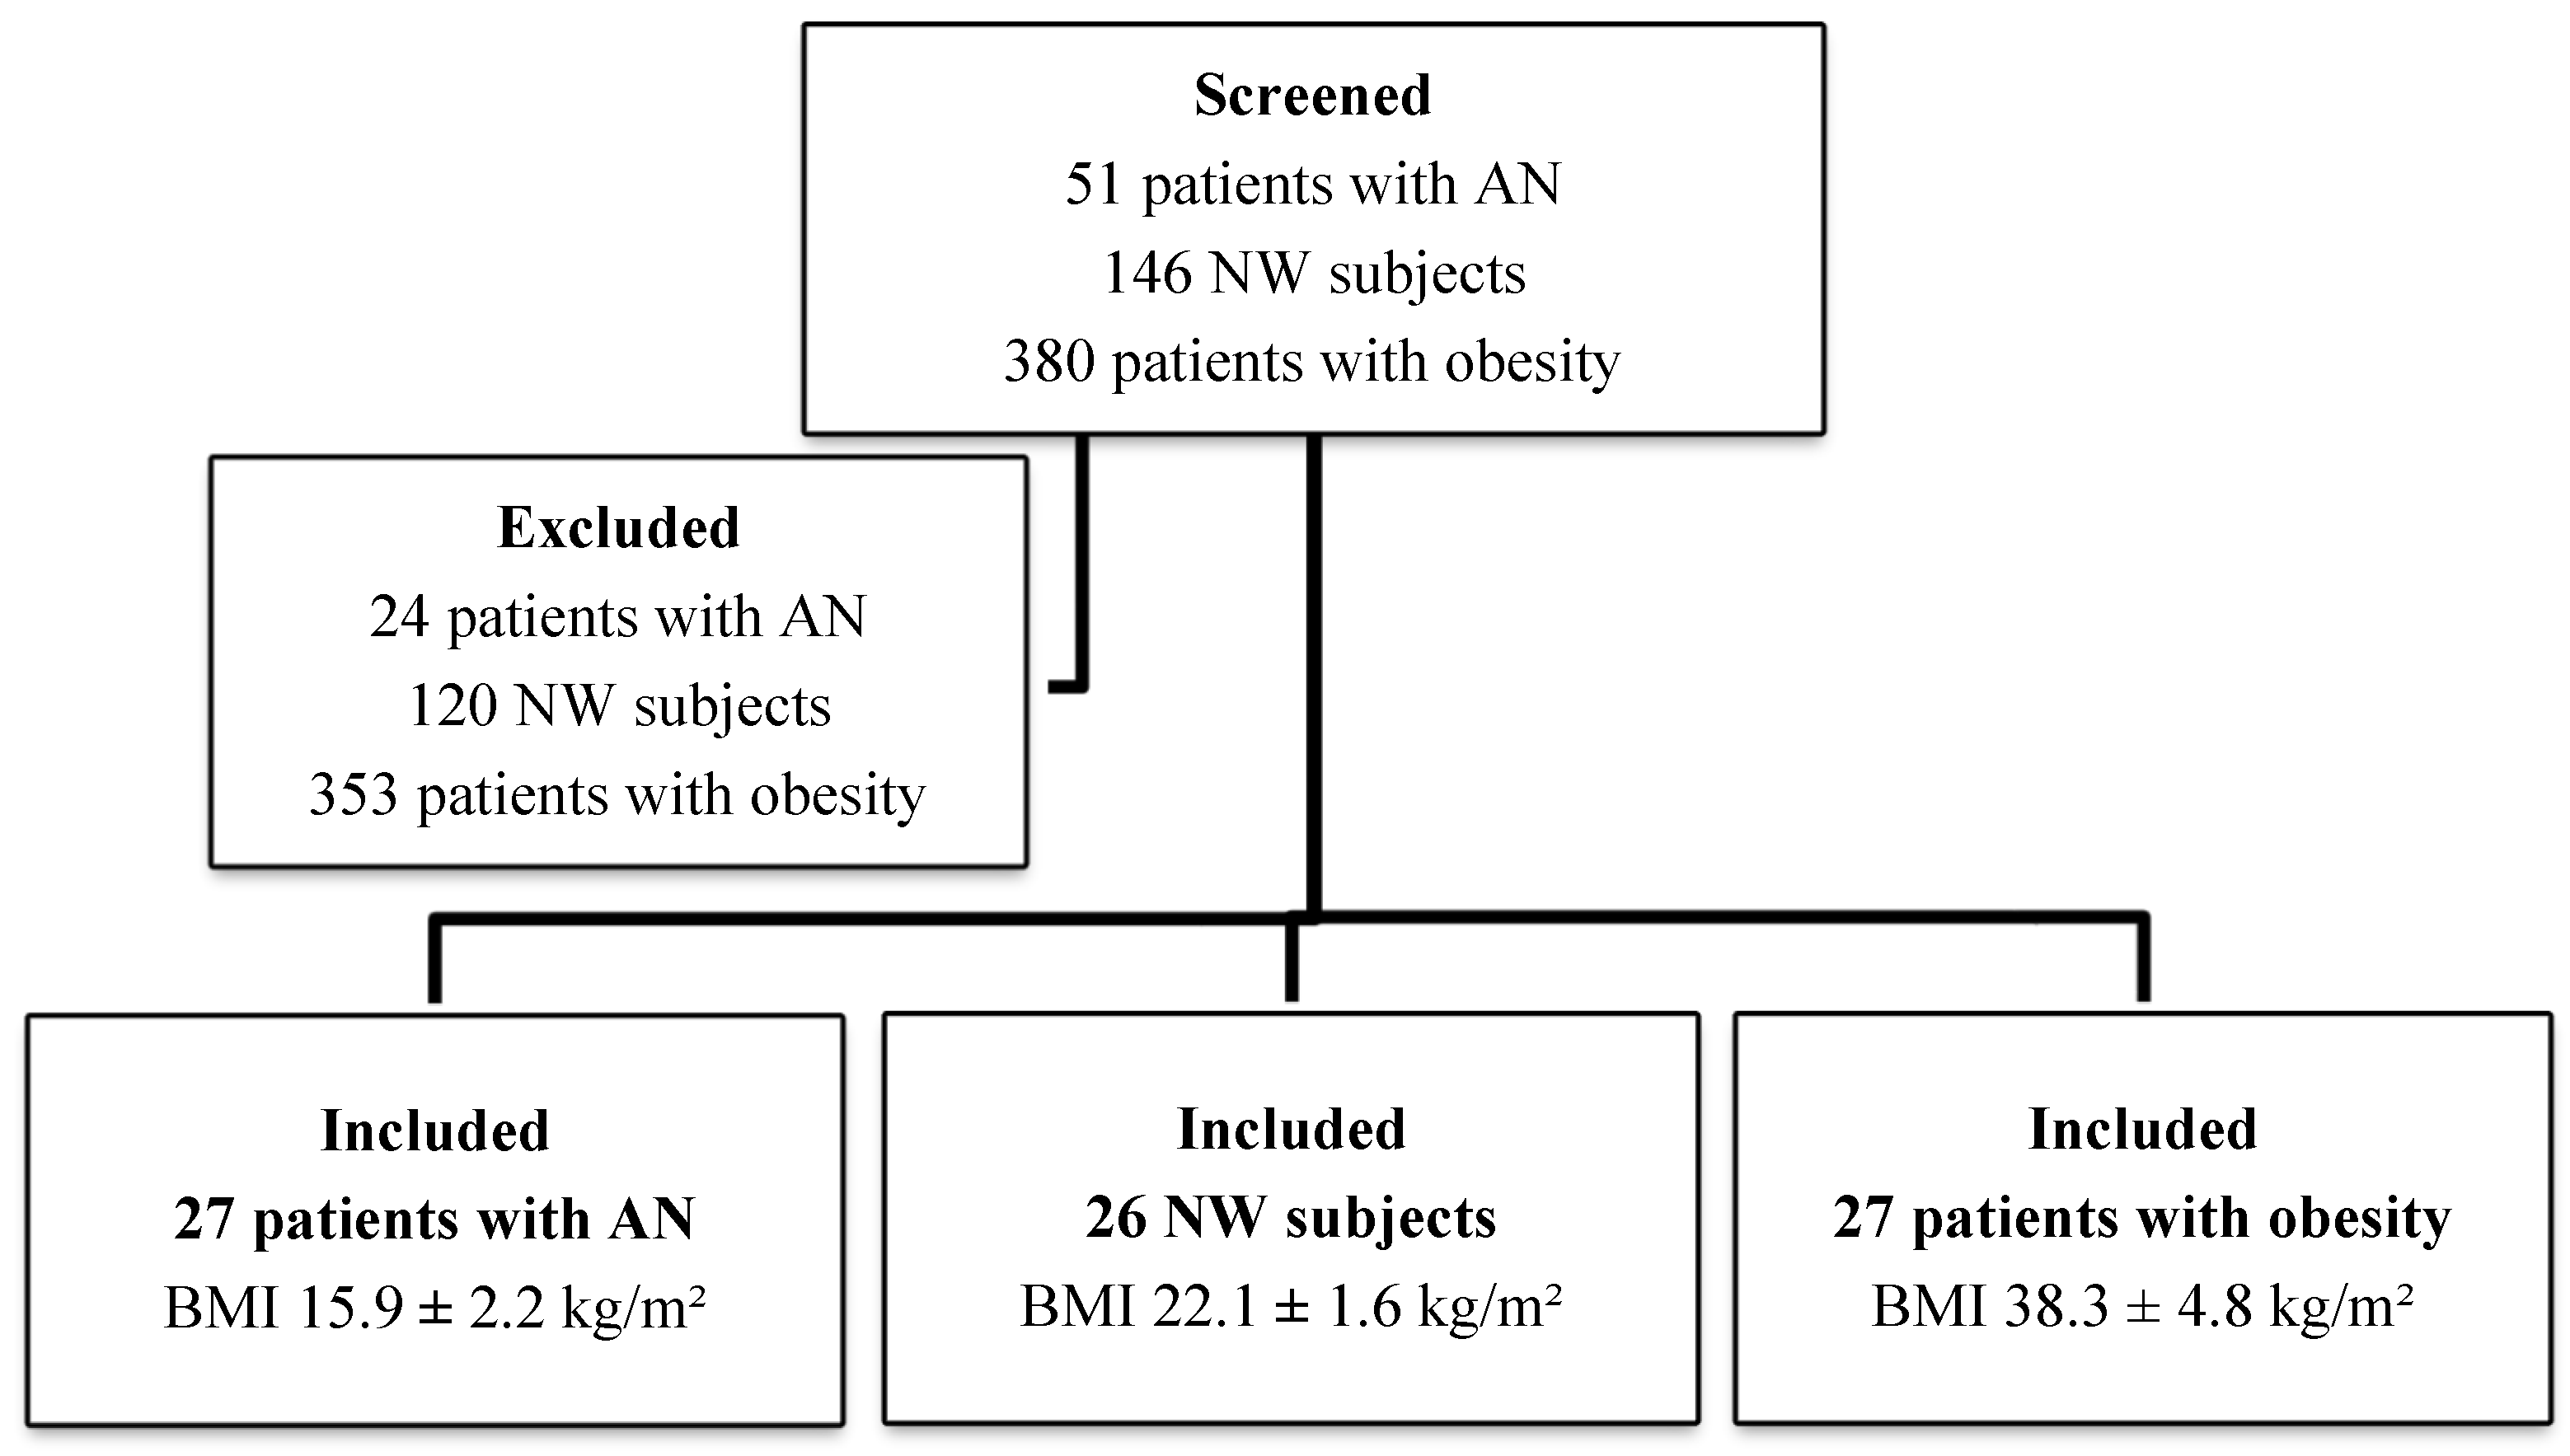
| N. subjects | 27 | 26 | 27 | - |
| Gender (male/female) | 1/26 | 7/19 | 3/24 | - |
| Age (years) | 26.9 ± 12.2 | 29.5 ± 8.1 | 36.7 ± 12.4 | <0.005 |
| Weight (kg) | 42.8 ± 8.7 | 64.8 ± 8.6 | 103 ± 16.25 | <0.005 |
| BMI (kg/m2) | 15.9 ± 2.2 | 22.1 ± 1.6 | 38.3 ± 4.8 | <0.005 |
| Plasma markers of adiposity | ||||
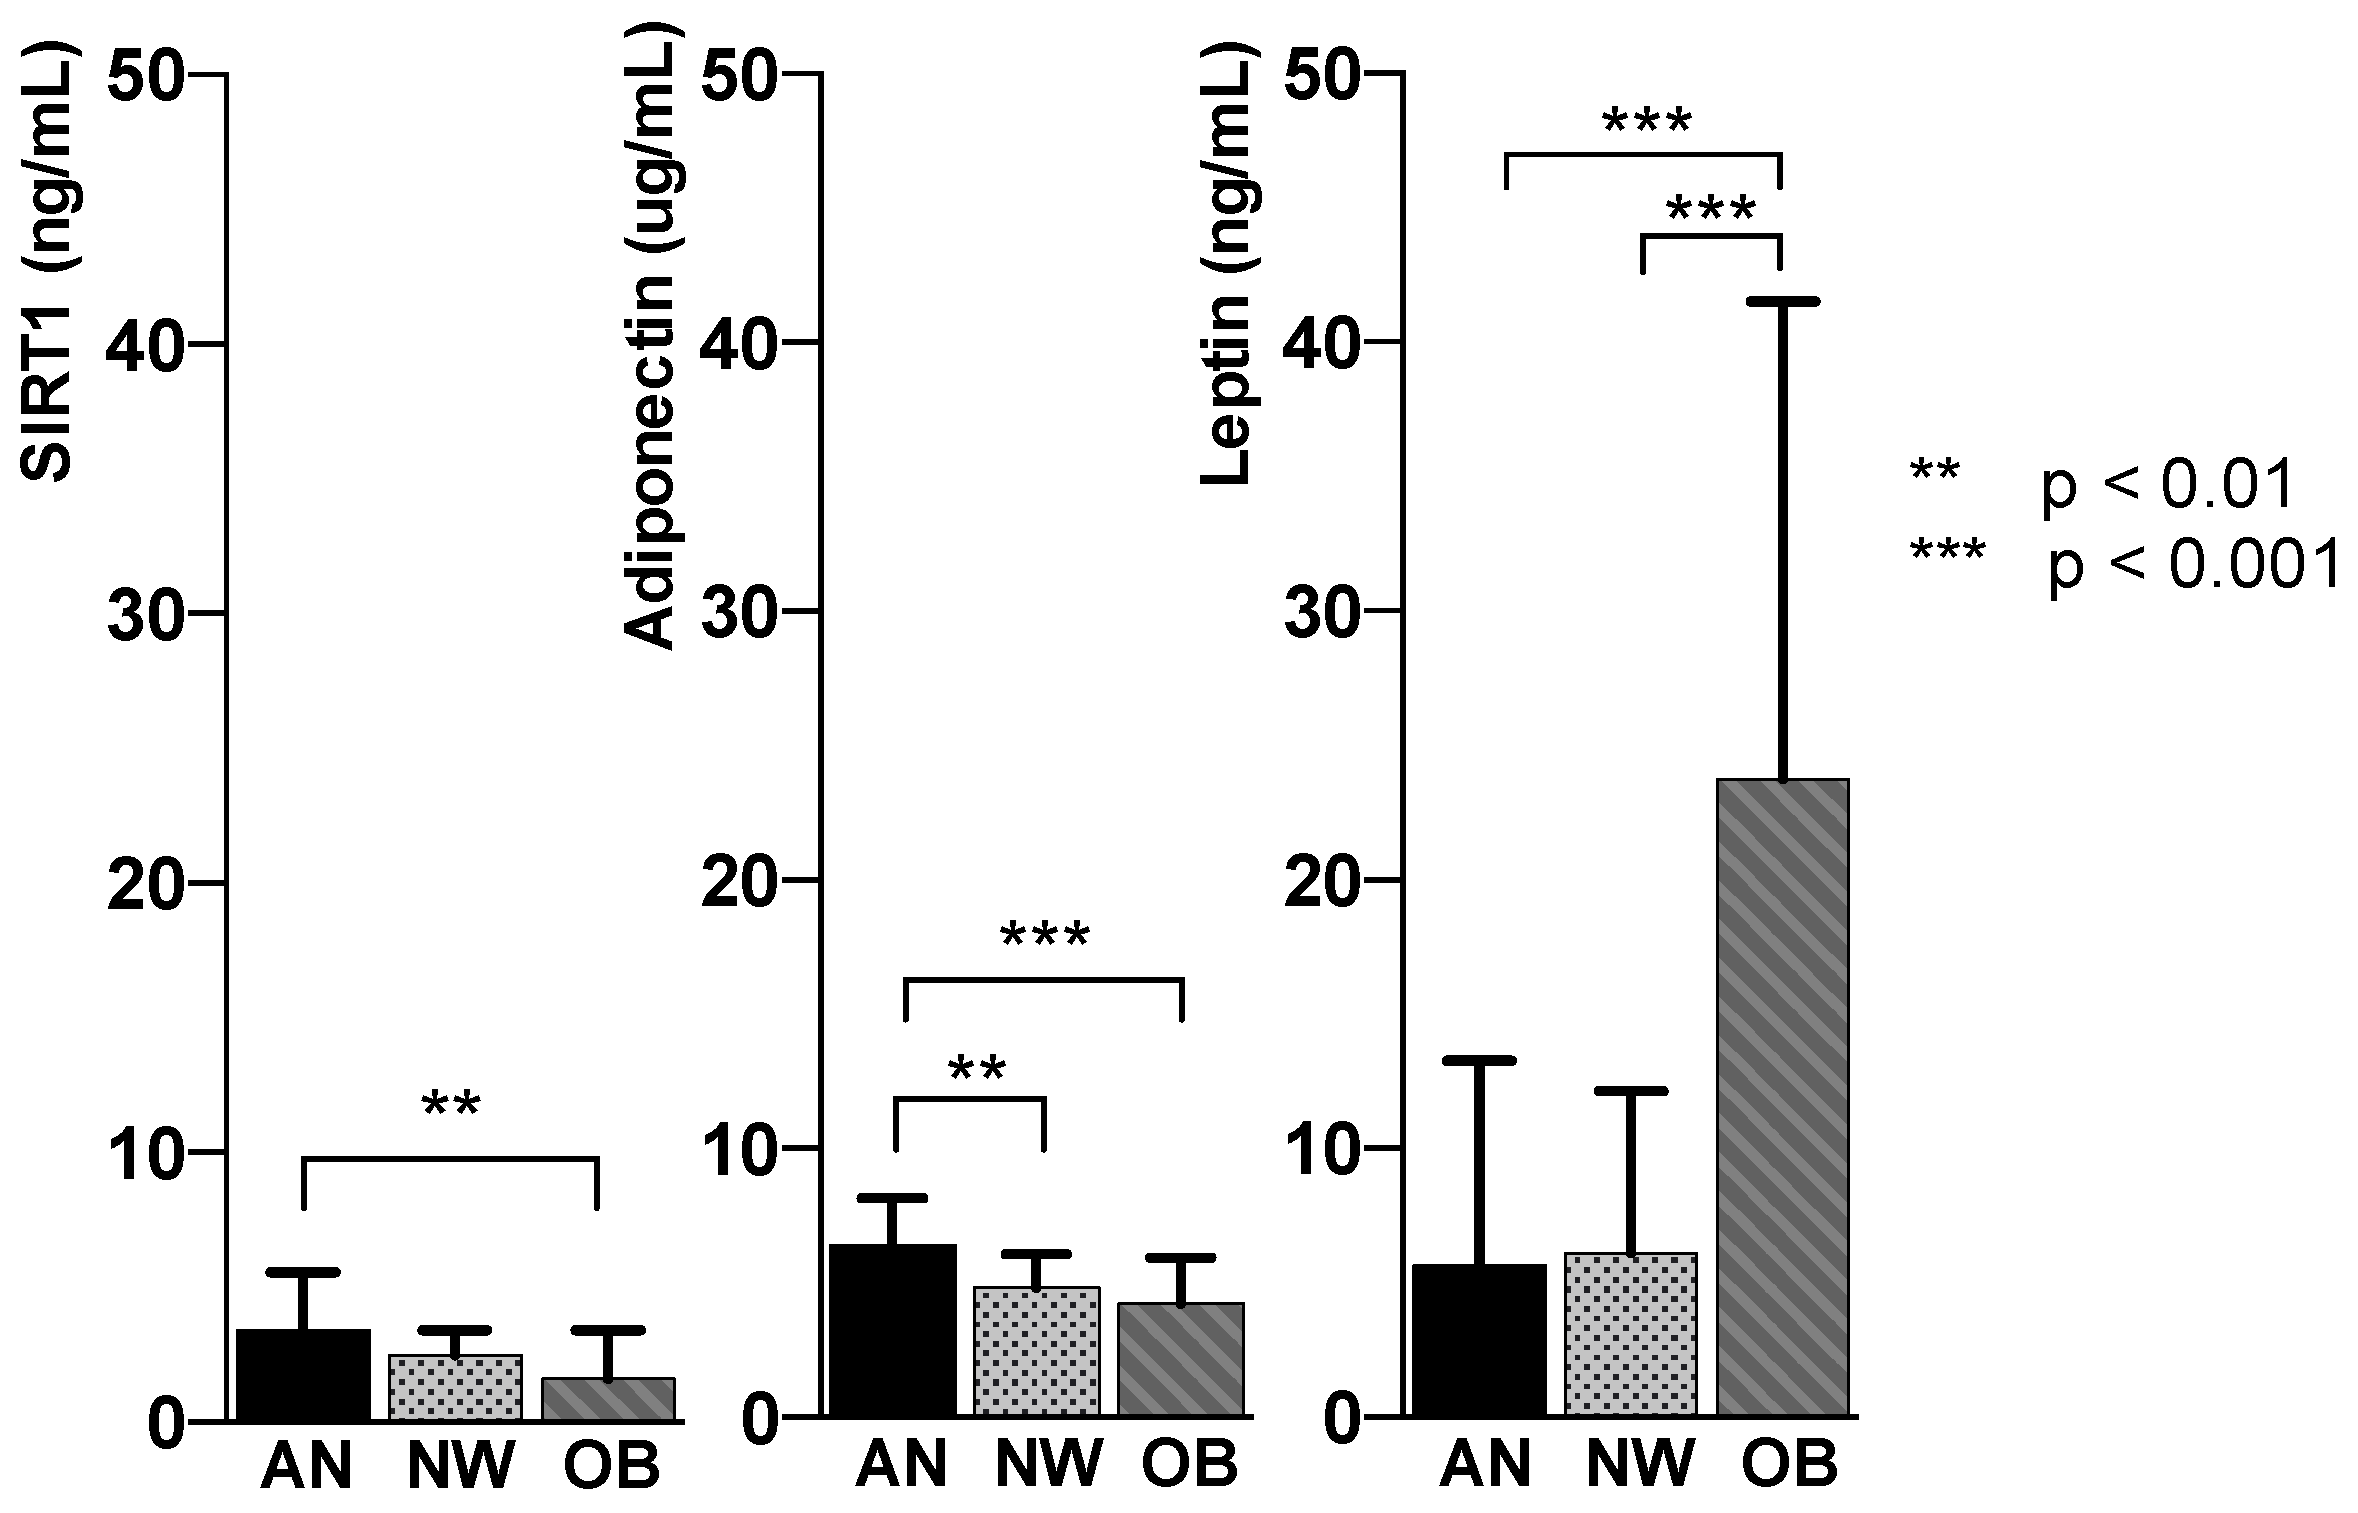
| SIRT1 (ng/mL) | 3.39 ± 2.2 | 2.47 ± 0.9 | 1.60 ± 1.8 | <0.005 |
| Adiponectin (µg/mL) | 6.39 ± 1.7 | 4.82 ± 1.3 | 4.3 ± 1.7 | <0.005 |
| Leptin (ng/mL) | 5.63 ± 7.6 | 6.13 ± 6.0 | 23.75 ± 17.7 | <0.005 |
| Districts of adiposity | ||||
| Total FM (%) | 17.41 ± 6.9 | 27.04 ± 6.2 | 41.04 ± 4.1 | <0.005 |
| Trunk FM (%) | 12.3 ± 6.1 | 22.7 ± 6.7 | 39.1 ± 4.2 | <0.005 |
| Abdominal VAT (g) | 83.2 ± 62.6 | 223.8 ± 102.6 | 575.6 ± 226 | <0.005 |
| EFT (mm) | 4.0 ± 0.7 | 6.5 ± 0.7 | 8.2 ± 0.7 | <0.005 |
| Liver Steatosis (degrees) * | ||||
| Absent | 3 (11%) | 21 (81%) | 0 (0%) | <0.005 |
| Mild | 24 (89%) | 5 (19%) | 19 (70%) | <0.005 |
| Moderate/severe | 0 (0%) | 0 (0%) | 8 (30%) | <0.005 |
| SIRT1 | Adiponectin | Leptin | ||||
|---|---|---|---|---|---|---|
| β | p-Value | β | p-Value | β | p-Value | |
| BMI (kg/m2) | −0.066 | 0.002 | −0.085 | <0.001 | 0.84 | <0.001 |
| Weight (kg) | −0.002 | 0.2 | −0.003 | 0.068 | 0.004 | 0.623 |
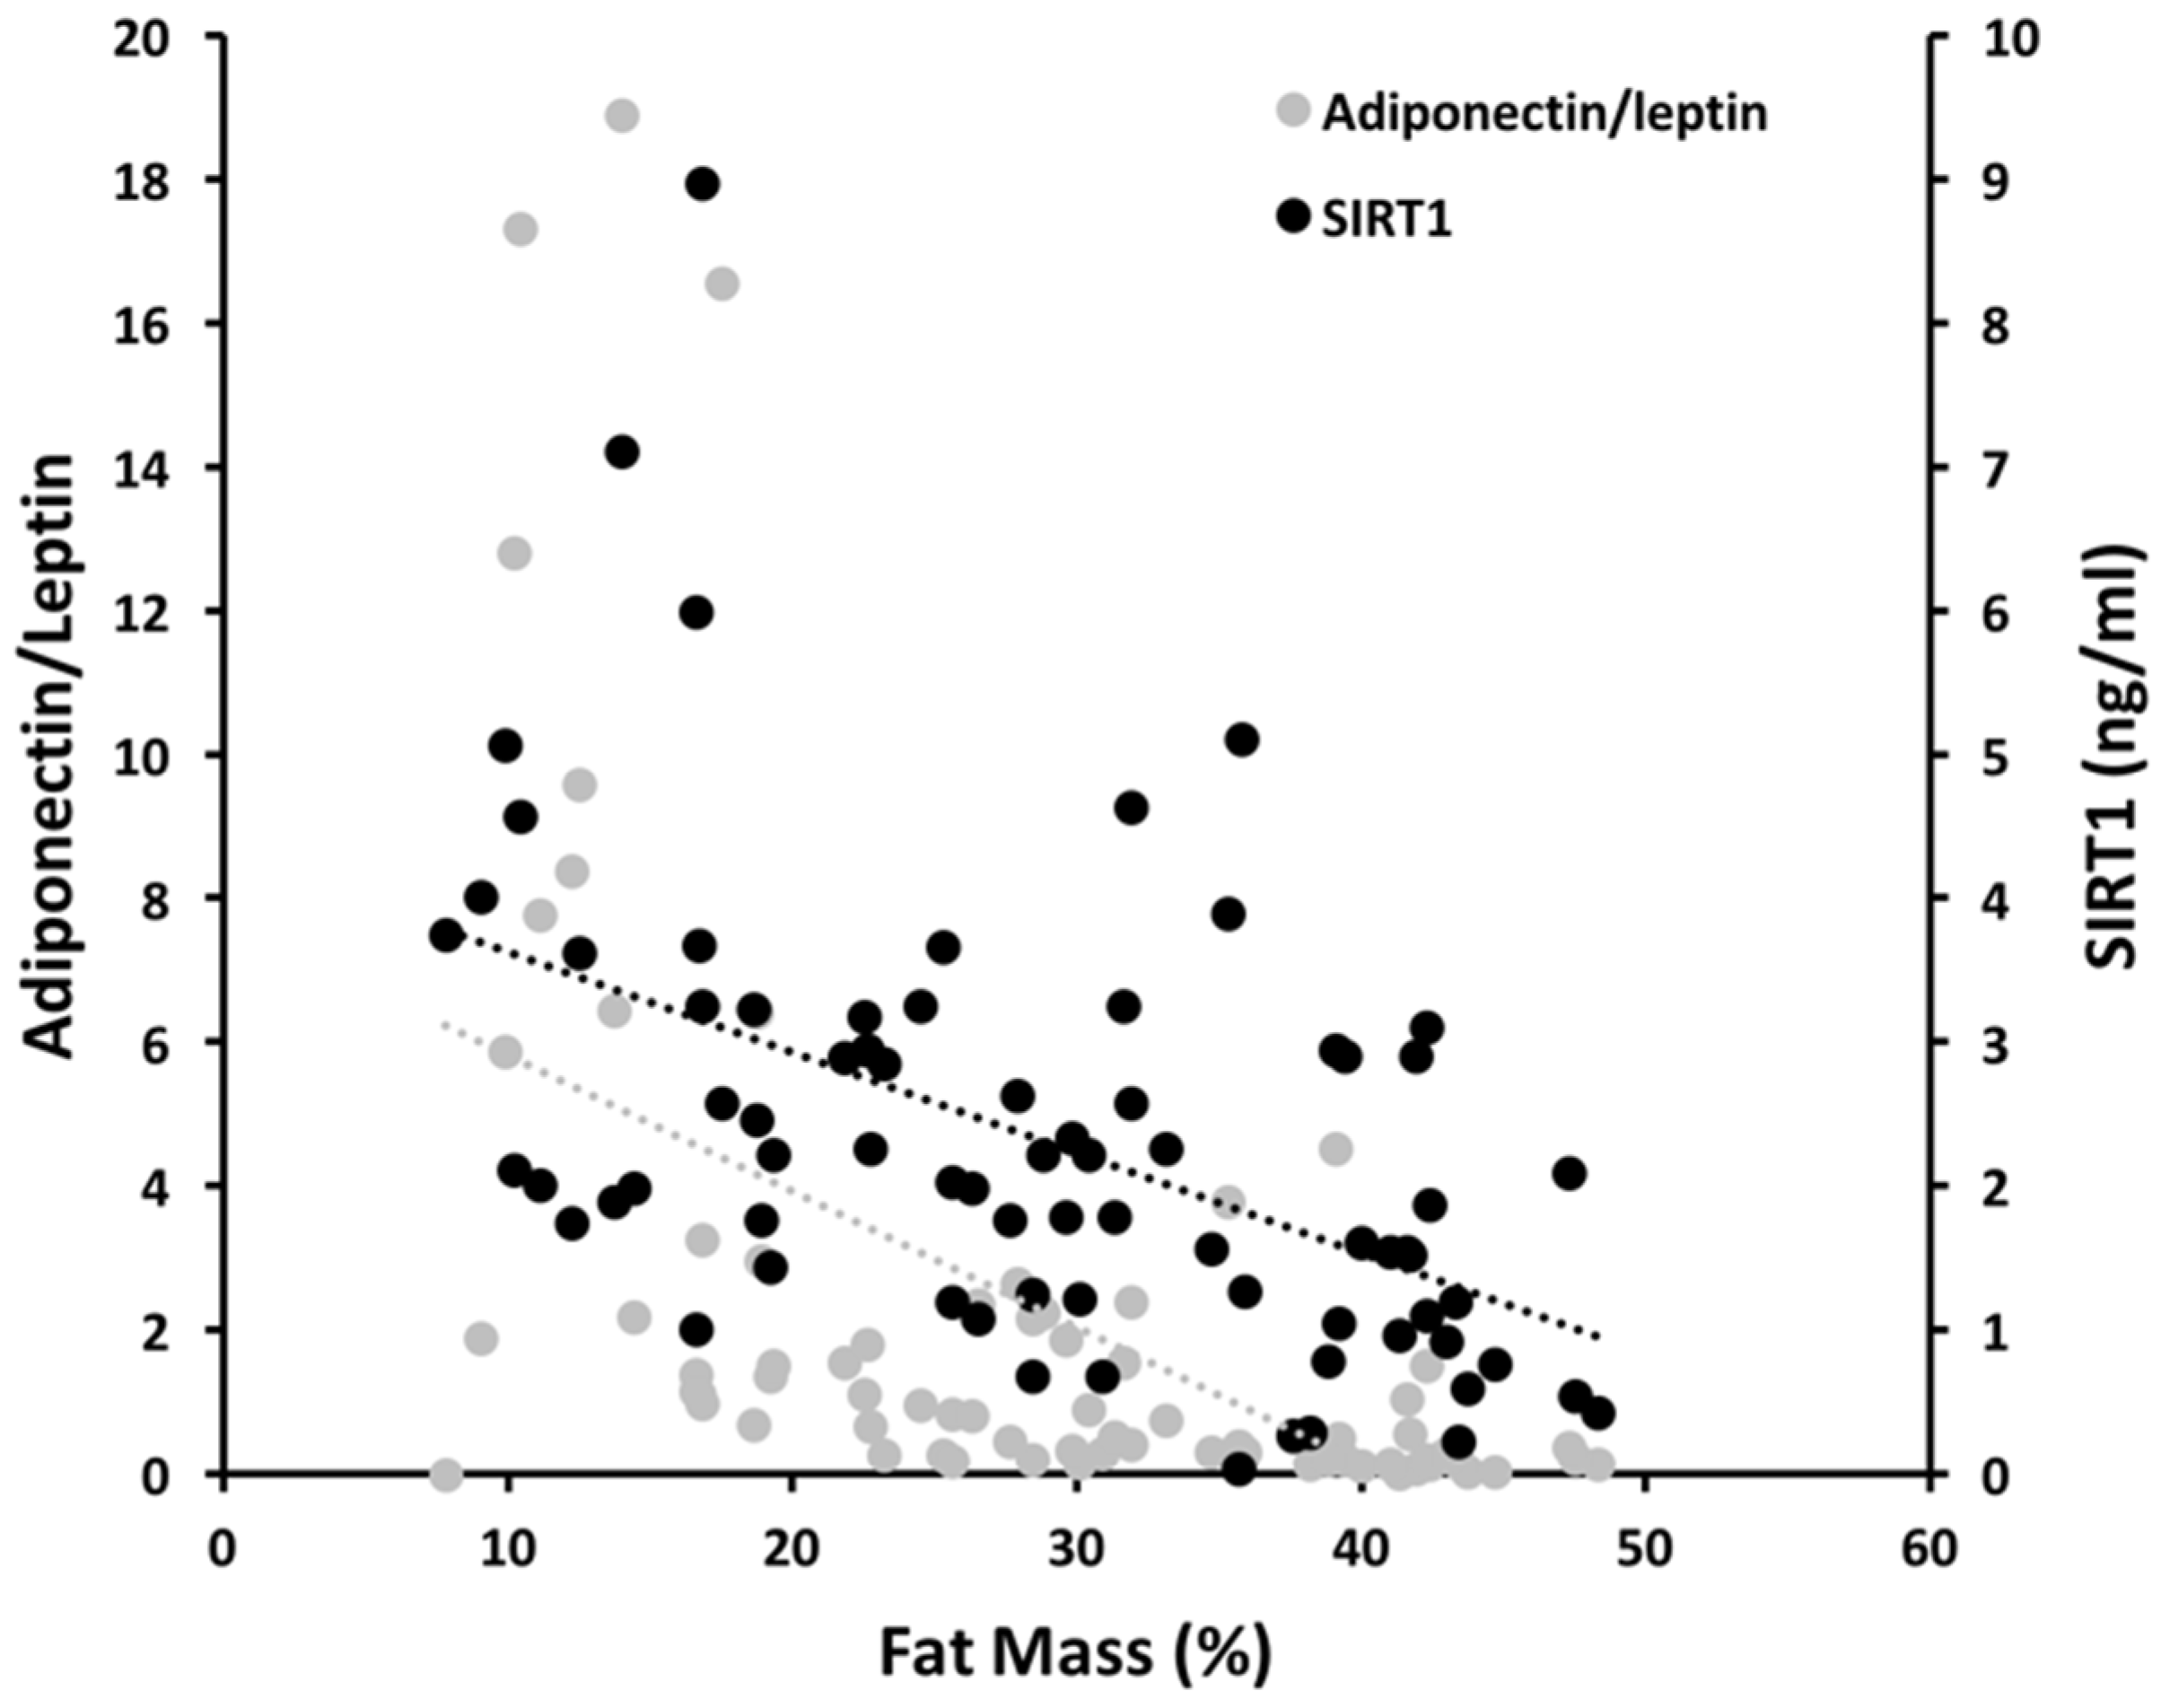
| Total FM (%) | −0.06 | 0.001 | −0.077 | <0.001 | 0.672 | <0.001 |
| Trunk FM (%) | −0.048 | 0.004 | −0.076 | <0.001 | 0.62 | <0.001 |
| Abdominal VAT (g) | −0.001 | 0.067 | −0.003 | <0.001 | 0.032 | <0.001 |
| EFT (mm) | −0.379 | 0.002 | −0.549 | <0.001 | 4.328 | <0.001 |
| Liver steatosis (degrees) | −0.456 | 0.219 | −0.027 | 0.942 | 9.576 | <0.001 |
| Anorexia Nervosa | Normal Weight | Obesity | |
|---|---|---|---|
| Total FM % | |||
| SIRT1 | 0.13 | 0.27 | 0.36 |
| Adiponectin | 0.08 | 0.42 | 0.36 |
| Leptin | 0.56 | 0.29 | 0.36 |
| Trunk FM % | |||
| SIRT1 | 0.07 | 0.07 | 0.12 |
| Adiponectin | 0.05 | 0.35 | 0.12 |
| Leptin | 0.55 | 0.06 | 0.13 |
| Abdominal VAT | |||
| SIRT1 | 0.17 | 0.61 | 0.21 |
| Adiponectin | 0.17 | 0.61 | 0.32 |
| Leptin | 0.32 | 0.53 | 0.26 |
| EFT | |||
| SIRT1 | 0.12 | 0.42 | 0.73 |
| Adiponectin | 0.13 | 0.47 | 0.72 |
| Leptin | 0.15 | 0.42 | 0.73 |
| Liver steatosis | |||
| SIRT1 | 0.16 | 0.16 | 0.32 |
| Adiponectin | 0.12 | 0.03 | 0.36 |
| Leptin | 0.11 | 0.04 | 0.37 |
Publisher’s Note: MDPI stays neutral with regard to jurisdictional claims in published maps and institutional affiliations. |
© 2020 by the authors. Licensee MDPI, Basel, Switzerland. This article is an open access article distributed under the terms and conditions of the Creative Commons Attribution (CC BY) license (http://creativecommons.org/licenses/by/4.0/).
Share and Cite
Mariani, S.; Di Giorgio, M.R.; Rossi, E.; Tozzi, R.; Contini, S.; Bauleo, L.; Cipriani, F.; Toscano, R.; Basciani, S.; Barbaro, G.; et al. Blood SIRT1 Shows a Coherent Association with Leptin and Adiponectin in Relation to the Degree and Distribution of Adiposity: A Study in Obesity, Normal Weight and Anorexia Nervosa. Nutrients 2020, 12, 3506. https://doi.org/10.3390/nu12113506
Mariani S, Di Giorgio MR, Rossi E, Tozzi R, Contini S, Bauleo L, Cipriani F, Toscano R, Basciani S, Barbaro G, et al. Blood SIRT1 Shows a Coherent Association with Leptin and Adiponectin in Relation to the Degree and Distribution of Adiposity: A Study in Obesity, Normal Weight and Anorexia Nervosa. Nutrients. 2020; 12(11):3506. https://doi.org/10.3390/nu12113506
Chicago/Turabian StyleMariani, Stefania, Maria Rosaria Di Giorgio, Erica Rossi, Rossella Tozzi, Savina Contini, Lisa Bauleo, Fiammetta Cipriani, Raffaella Toscano, Sabrina Basciani, Giuseppe Barbaro, and et al. 2020. "Blood SIRT1 Shows a Coherent Association with Leptin and Adiponectin in Relation to the Degree and Distribution of Adiposity: A Study in Obesity, Normal Weight and Anorexia Nervosa" Nutrients 12, no. 11: 3506. https://doi.org/10.3390/nu12113506