1. Introduction
Older mobile phones types typically consist of electronic circuitry, a printed circuit board (PCB), a liquid crystal display, a battery, a keypad and a plastic case [
1]. The waste PCBs (WPCBs) are diverse and complex in terms of their type, size, shape, components and composition [
2]. The elemental composition of PCBs varies depending on their type and applications [
3]. In general, these PCBs contain, in terms of weight, approximately 40% metals, 30% plastics or polymers, and 30% ceramics or refractory metal oxides [
1,
2,
4,
5,
6]. The majority metals in PCBs are Cu, Pb, Zn, Fe, Ni and Sn [
7]. Metallic material contains various elements, including precious metals, but also different hazardous elements such as heavy metals [
3]. Three main types of recyclable materials can be retrieved from PCBs: metals (mainly Cu, Al, Sn and Pb) and precious metals (Au, Ag and Pt), polymeric materials and ceramic materials [
8]. Each metal occurring in PCBs has its own specific properties depending on the particular point of view, such as weight share, economic value, environmental impacts, or natural resources depletion [
9].
The results of quantitative analysis of highly heterogeneous materials such as e-waste may be influenced by uncertainties stemming from several sources, for example, sampling, digestion, dilution, calibration or other interferences [
10].
The success of e-scrap treatment depends largely on the quality of sampling and assaying. Professional sampling and analysis is the basis for proper material assessment. Most sampling and assaying processes and technologies are still in-house developed [
11,
12,
13,
14,
15]. The general procedure in preparing samples from WPCBs involves crushing them into smaller particles (less than 1 mm in size), followed by various techniques, including magnetic, electrostatic, electrowinning and selective dissolution in order to separate the components [
16,
17].
The effectivity of acid digestion reaction with solid waste material depends on several factors: the character and concentration of the acid used, the reaction time, external driving forces (heat, ultrasound, agitation and microwaves), and reaction conditions (especially temperature and solid-liquid ratio) [
4]. The choice of acid or acid mixture for digestion largely depends on the metal forms present in the waste [
4,
18]. For example, hydrochloric acid is usually applied to release metals associated with carbonates, phosphates, borates and some oxides and sulphides [
18], and metals bound to silicate fractions are dissolved by hydrofluoric acid [
4,
18]. The mixture of HNO
3 + HF provides the strongest chemical interaction and dissolving power, and the combination of HNO
3 with microwave (MW) energy also represents a high-energy system, with the result that both of these systems may lead to complete dissolving of any matrix [
10]. The use of an aggressive combination of HNO
3 + HF + MW energy has been found to be more effective in releasing the majority metals Cu, Fe, Ni and Zn from WPCBs, compared with the utilization of hot aqua regia digestion.
The United States Environmental Protection Agency (US EPA) Solid Waste 846 Method 3052 is applicable to the microwave wet acid digestion of solid waste materials with siliceous, organics and other complex matrices [
4]. This US EPA method employs conc. HNO
3 and conc. HF, and this mixture combined with MW energy creates a high energy system with strongest chemical interaction, oxidization and dissolving power [
10].
Although this method was not originally designed for PCBs, it has already been used for this type of material (IT, telecommunication, large household, consumer equipment and lighting equipment) [
7,
19,
20].
In our study, we decided to use a new approach based on the application of the original US EPA Method 3052 and its modifications to material from older mobile phone type PCBs in order to select the most effective digestion method. The effectivity of MW digestion procedures for releasing the majority elements (Cu, Pb, Zn, Fe and Ni) from PCBs was monitored through determination of their content in the solution after digestion by means of high-resolution continuum-source flame atomic absorption spectrometry (HR CS FAAS).
3. Results and Discussion
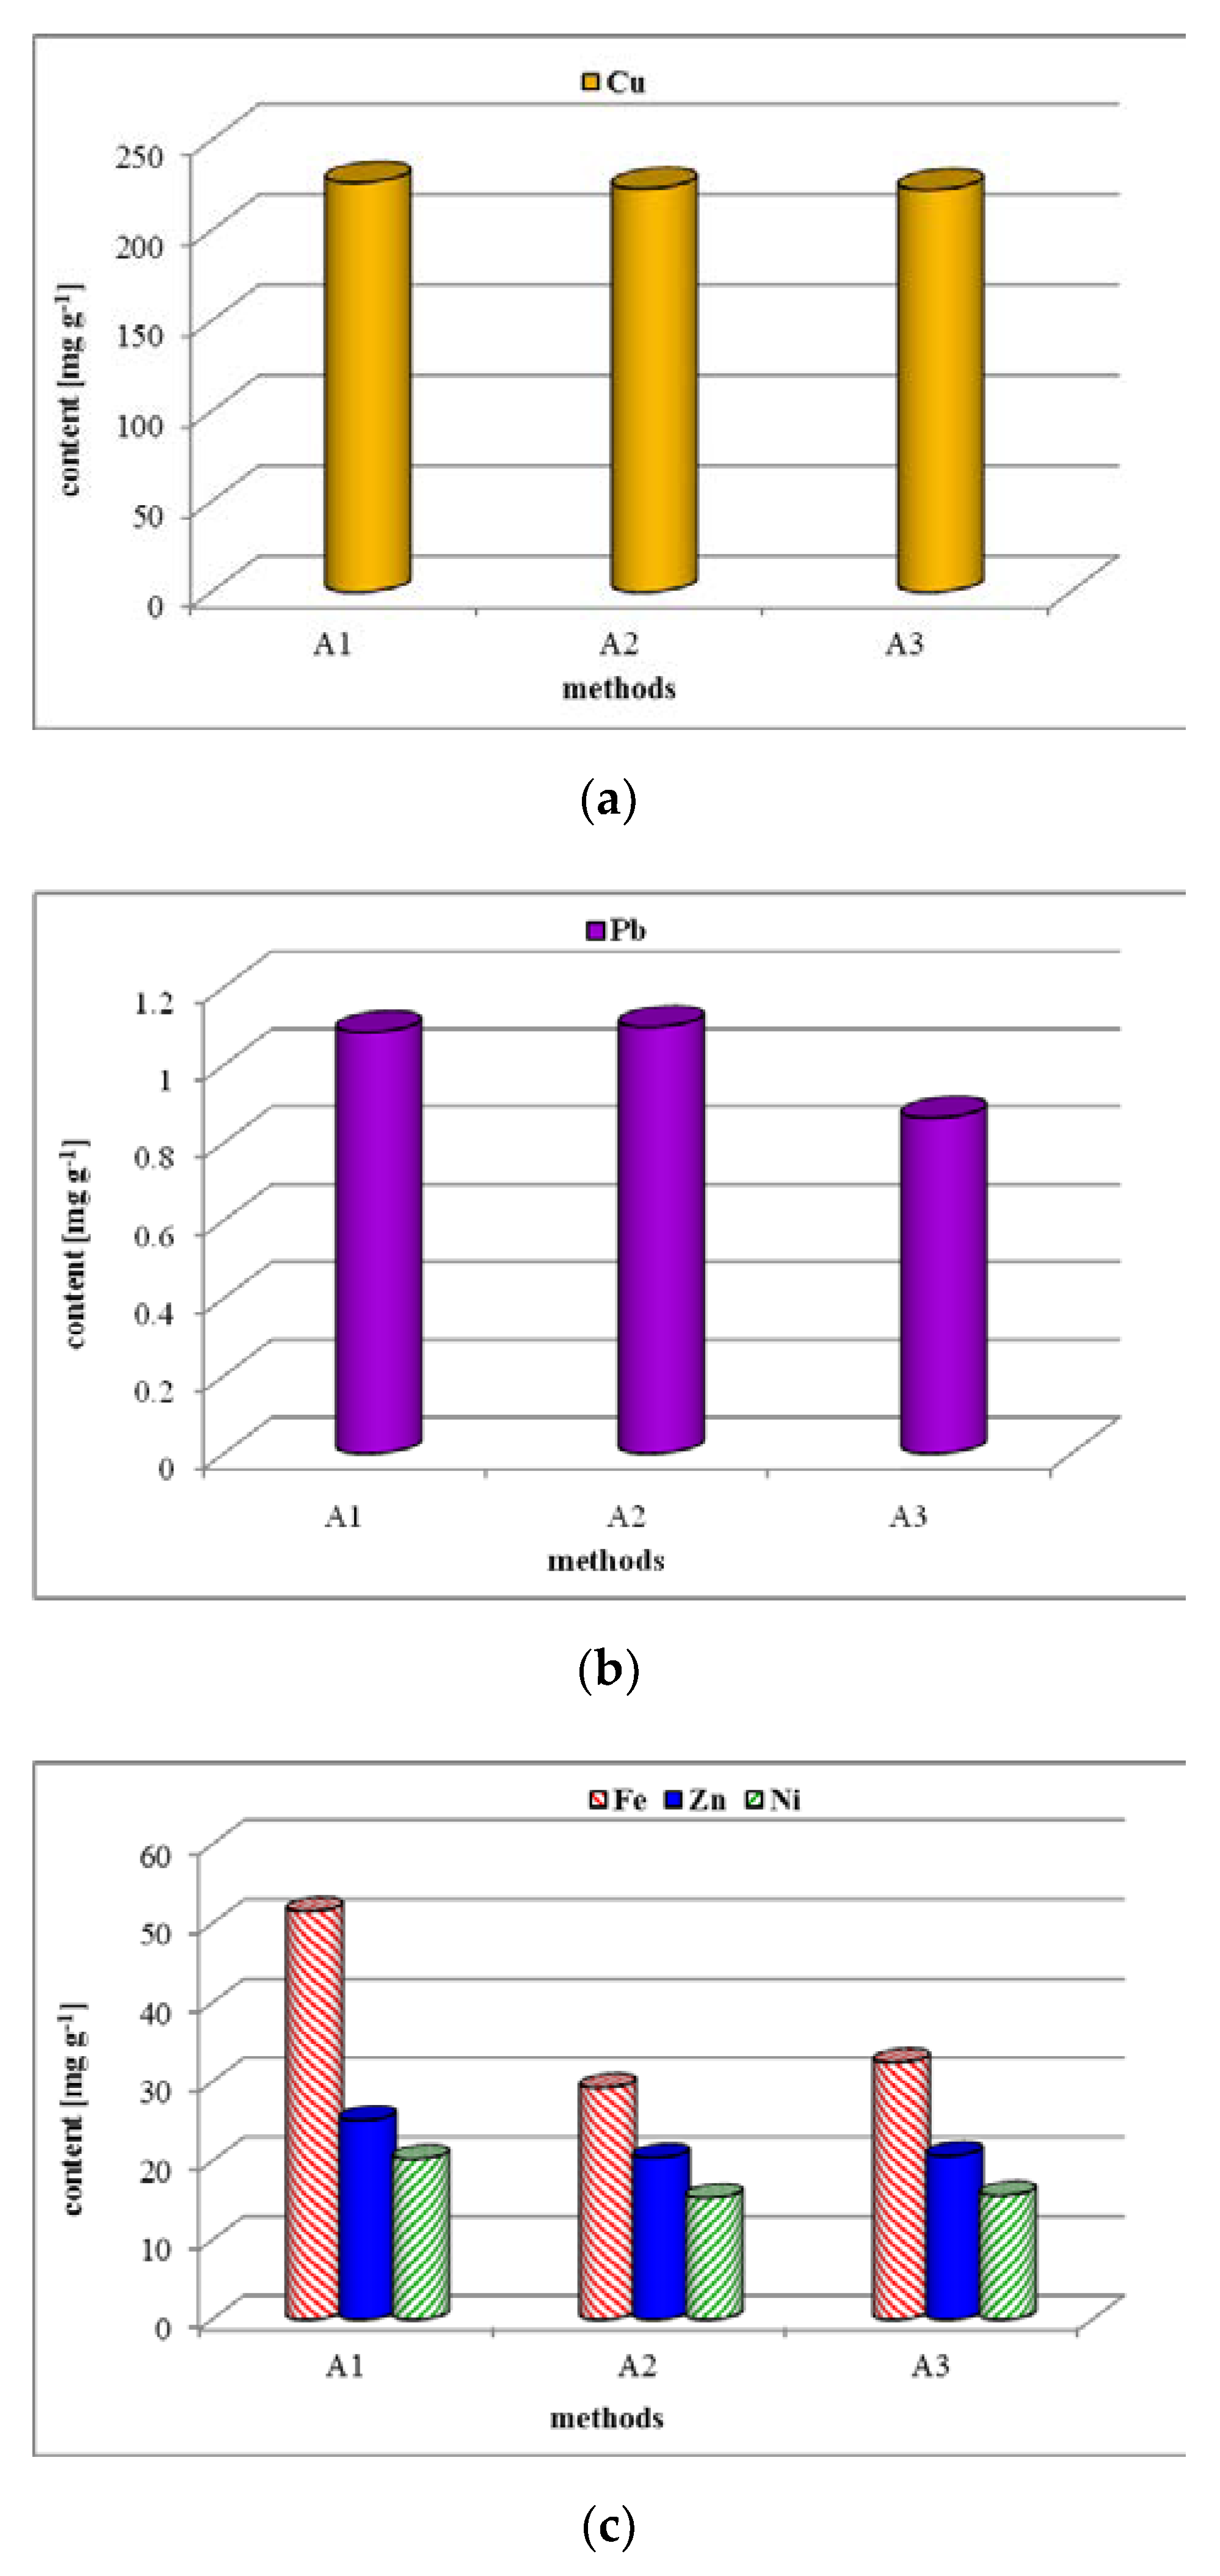
In the first series of experiments, we monitored the effect of digestion time (10 min for method A1, 20 min for method A2 and 30 min for method A3) with application of the original US EPA Method 3052 on the release of elements into the post-digestion solutions. The results of these experiments are shown in
Figure 3.
The results indicate that the extension of digestion time, with the exception of Cu, does not influence the increase in content of elements in the solution after digestion, nor does it increase the effectivity of digestion. Decomposition for 30 min resulted in a 20% decrease in Cu recovery and up to a 60% decrease in Fe recovery. Although it is not possible expressly determine the reason for the decrease in decomposition efficiency by prolonging its decomposition time, it is most likely that the equilibrium of decomposition reactions were shifted due to excessive formation of reaction products. This result led us to apply Method B as a modification of the original US EPA Method 3052 in another series of experiments.
Our second series of experiments was focused on monitoring the effects of the three modifications of US EPA Method 3052 (Methods B, C and D) on the release of elements. The aim of the experiments was to shift the chemical balance to products of digestion reactions, which would lead to increased release of elements. The modifications of US EPA Method 3052 were as follows:
The results (
Figure 4) show that application of the chosen digestion procedures did not achieve any increase in the release efficiency of metals from the PCB material in comparison with the original US EPA method. The efficiency of two-step decomposition with the addition of HCl in the second step was comparable to that of the US EPA method. Increasing the ratio of sample mass to digestion reagent volume appeared to be the least effective. Increasing the amount of reagents to the same amount of sample (0.25 g), in comparison to the original US EPA Method 3052, could result in an increase of the fluorides and oxides formation as new forms in the solid residue after digestion (see discussion in the last stage of studies).
The relative standard deviation (RSD) values, representing the uncertainty of elements content determination caused by the heterogeneity of the material, calculated from the four repeated digestions for each digestion method (A1, A2, A3, B, C and D) are shown in
Table 2.
The RSD values (
Table 2) ranged from 5 to 40 independently of the degree of dilution of the solution prior to analysis. The highest RSD values were found for determination of Pb content directly in the post-digestion solutions, and the lowest values were for Cu determination in the solutions with the highest dilution, suggesting that there was significant effect of material heterogeneity on the uncertainty of determining the content of the different elements. The effect of PCB material heterogeneity on the uncertainty of the analysis results may possibly be moderated by increasing the PCB amount in the digestion process. Considering the recommendations of the manufacturer of the MW digestion system, the maximum weight of a sample for digestion can be 0.5 g, and element content determined would be taken as the average of contents from two parallel digestions. The use of 0.5 g PCB material for digestion was not possible in our experiments, because unfavourable phenomena (explosions as a result of increased pressure within the closed vessel due to the inhomogeneity of sample) caused deformation and damage to the vessels.
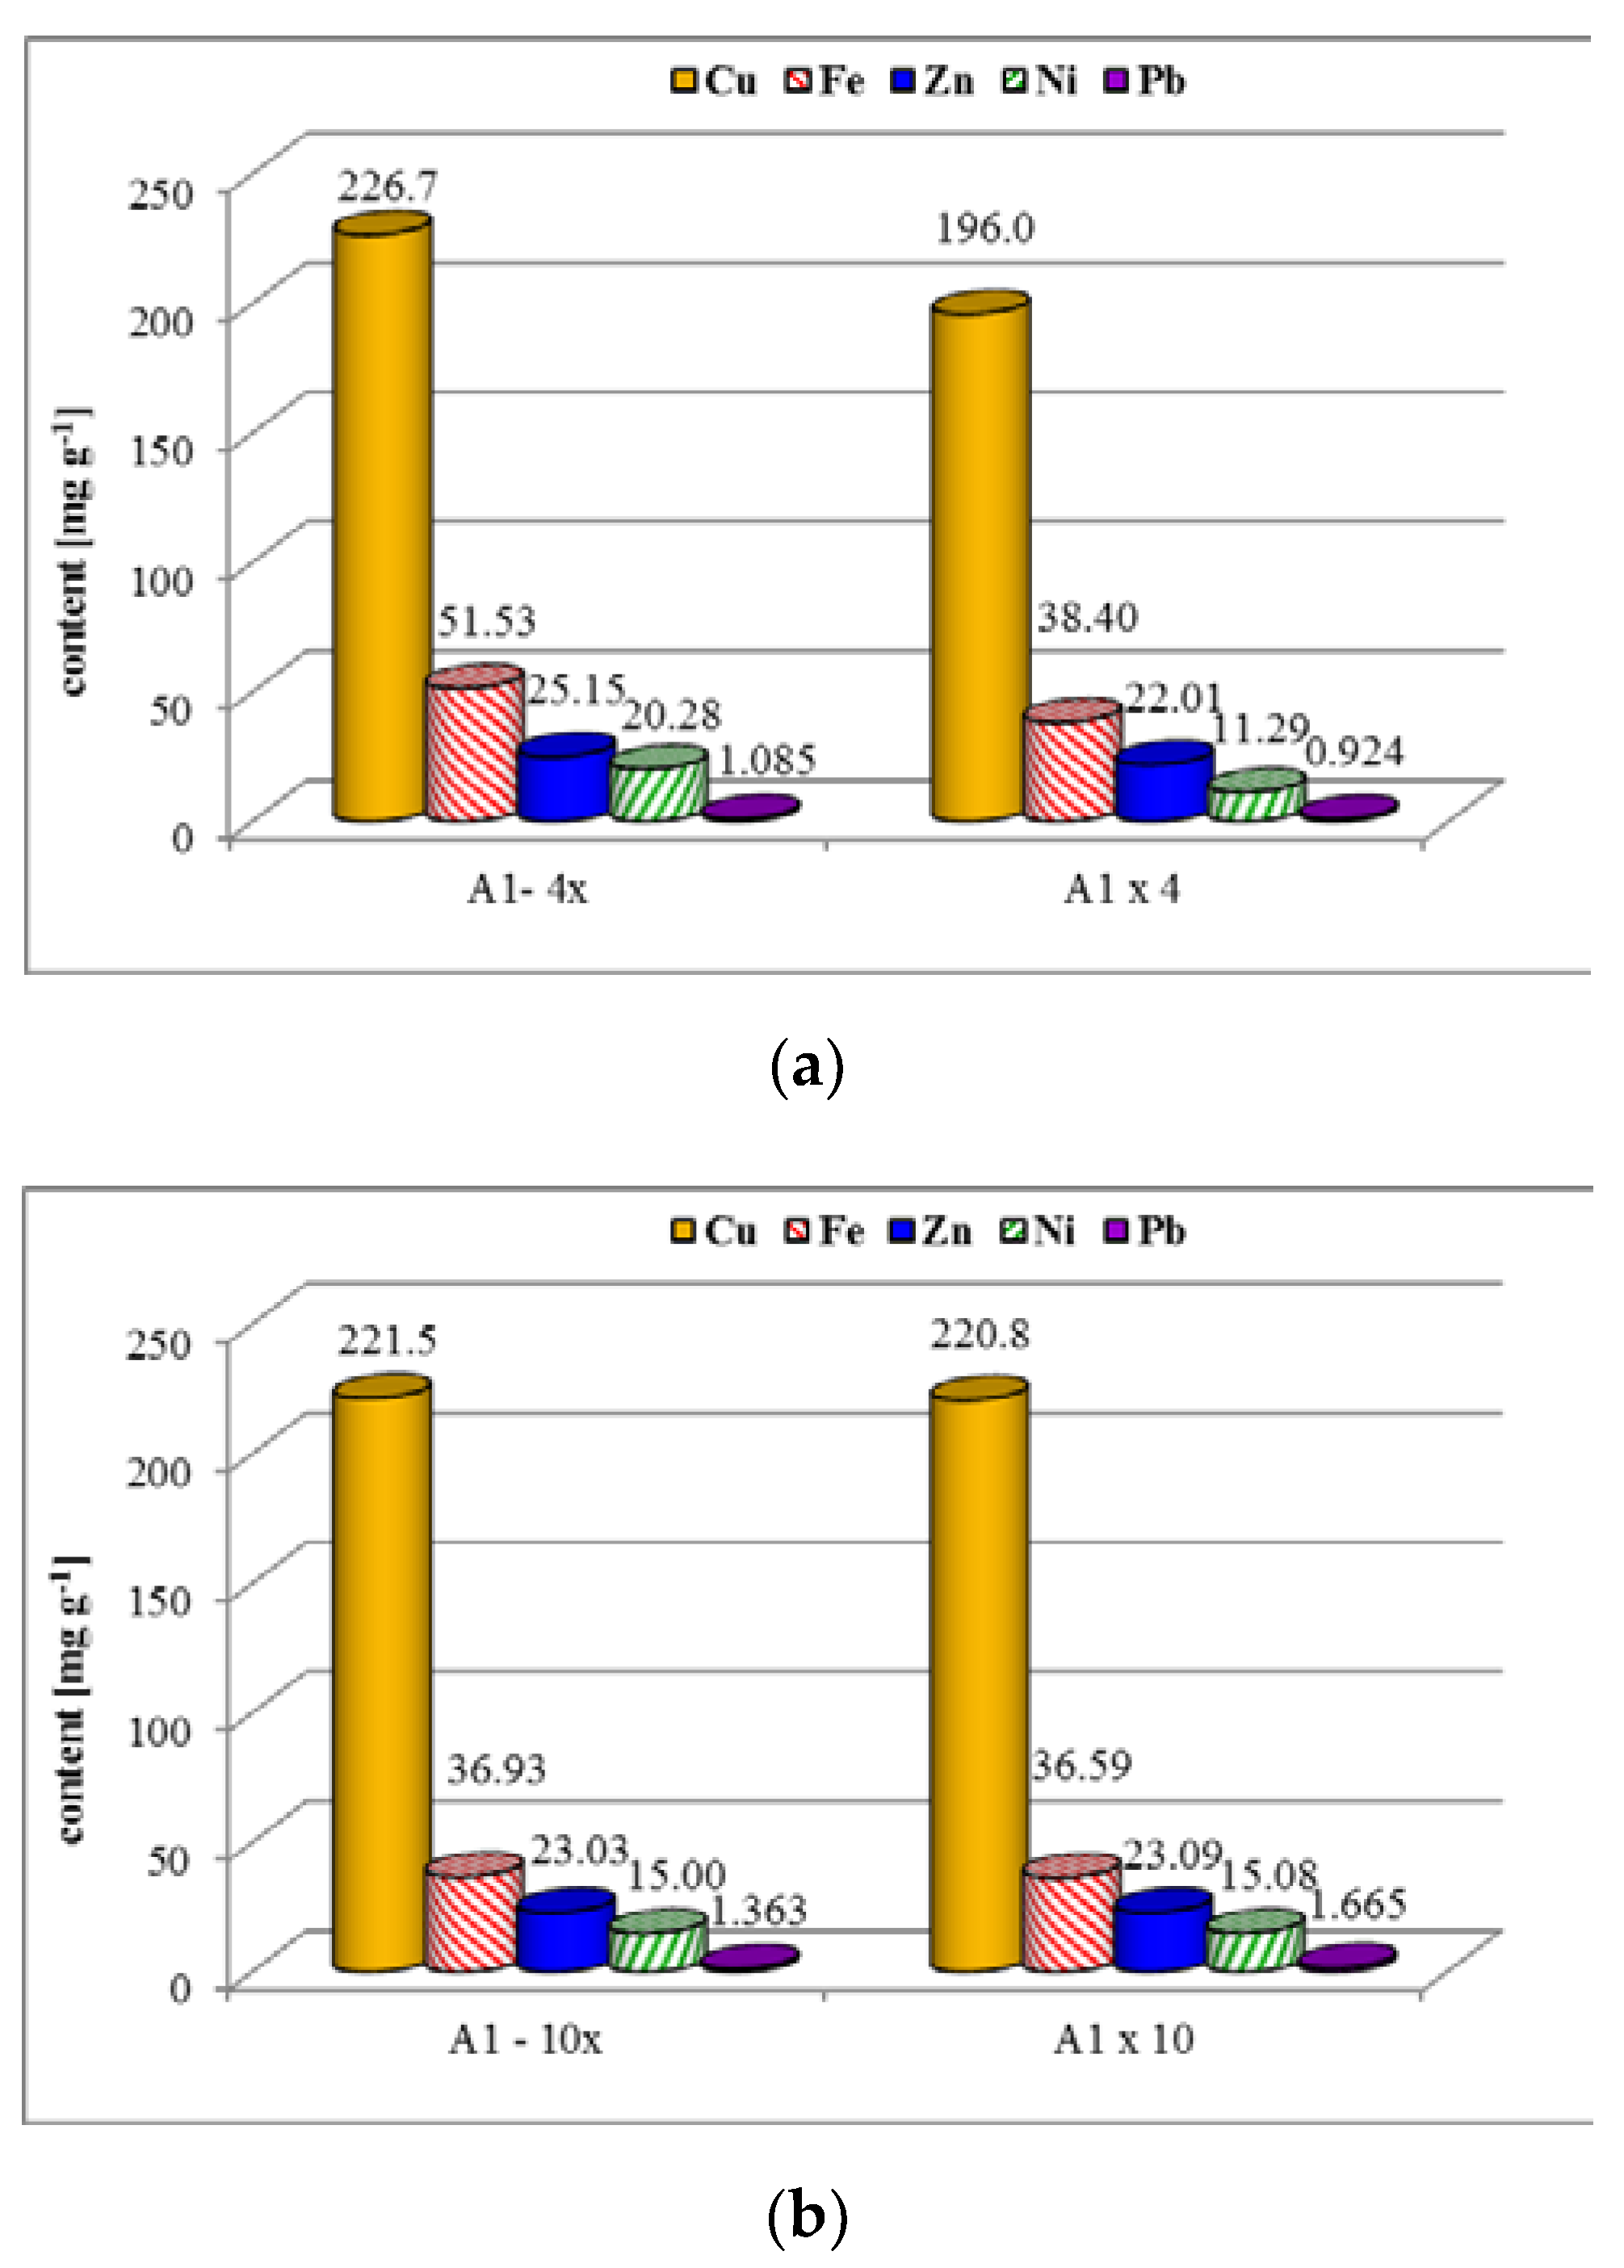
In the next series of experiments, we compared the average content of the elements calculated from the four contents determined in the four post-digestion solutions obtained using method A1 (A1 – 4×) with the content determined in the single solution containing the elements released from four replicates of digestion method A1 (A1 × 4). This experiment was also repeated by applying ten repeats of the A1 method.
Figure 5 shows the content of elements determined in this series of experiments.
While the contents of the elements determined from four repeated digestions, i.e., 1.0 g of the sample, were significantly different for the two methods of evaluation (
Figure 5a), in the case of the application of 10 repeated digestions, i.e., 2.5 g of the sample, these differences were minimal (
Figure 5b).
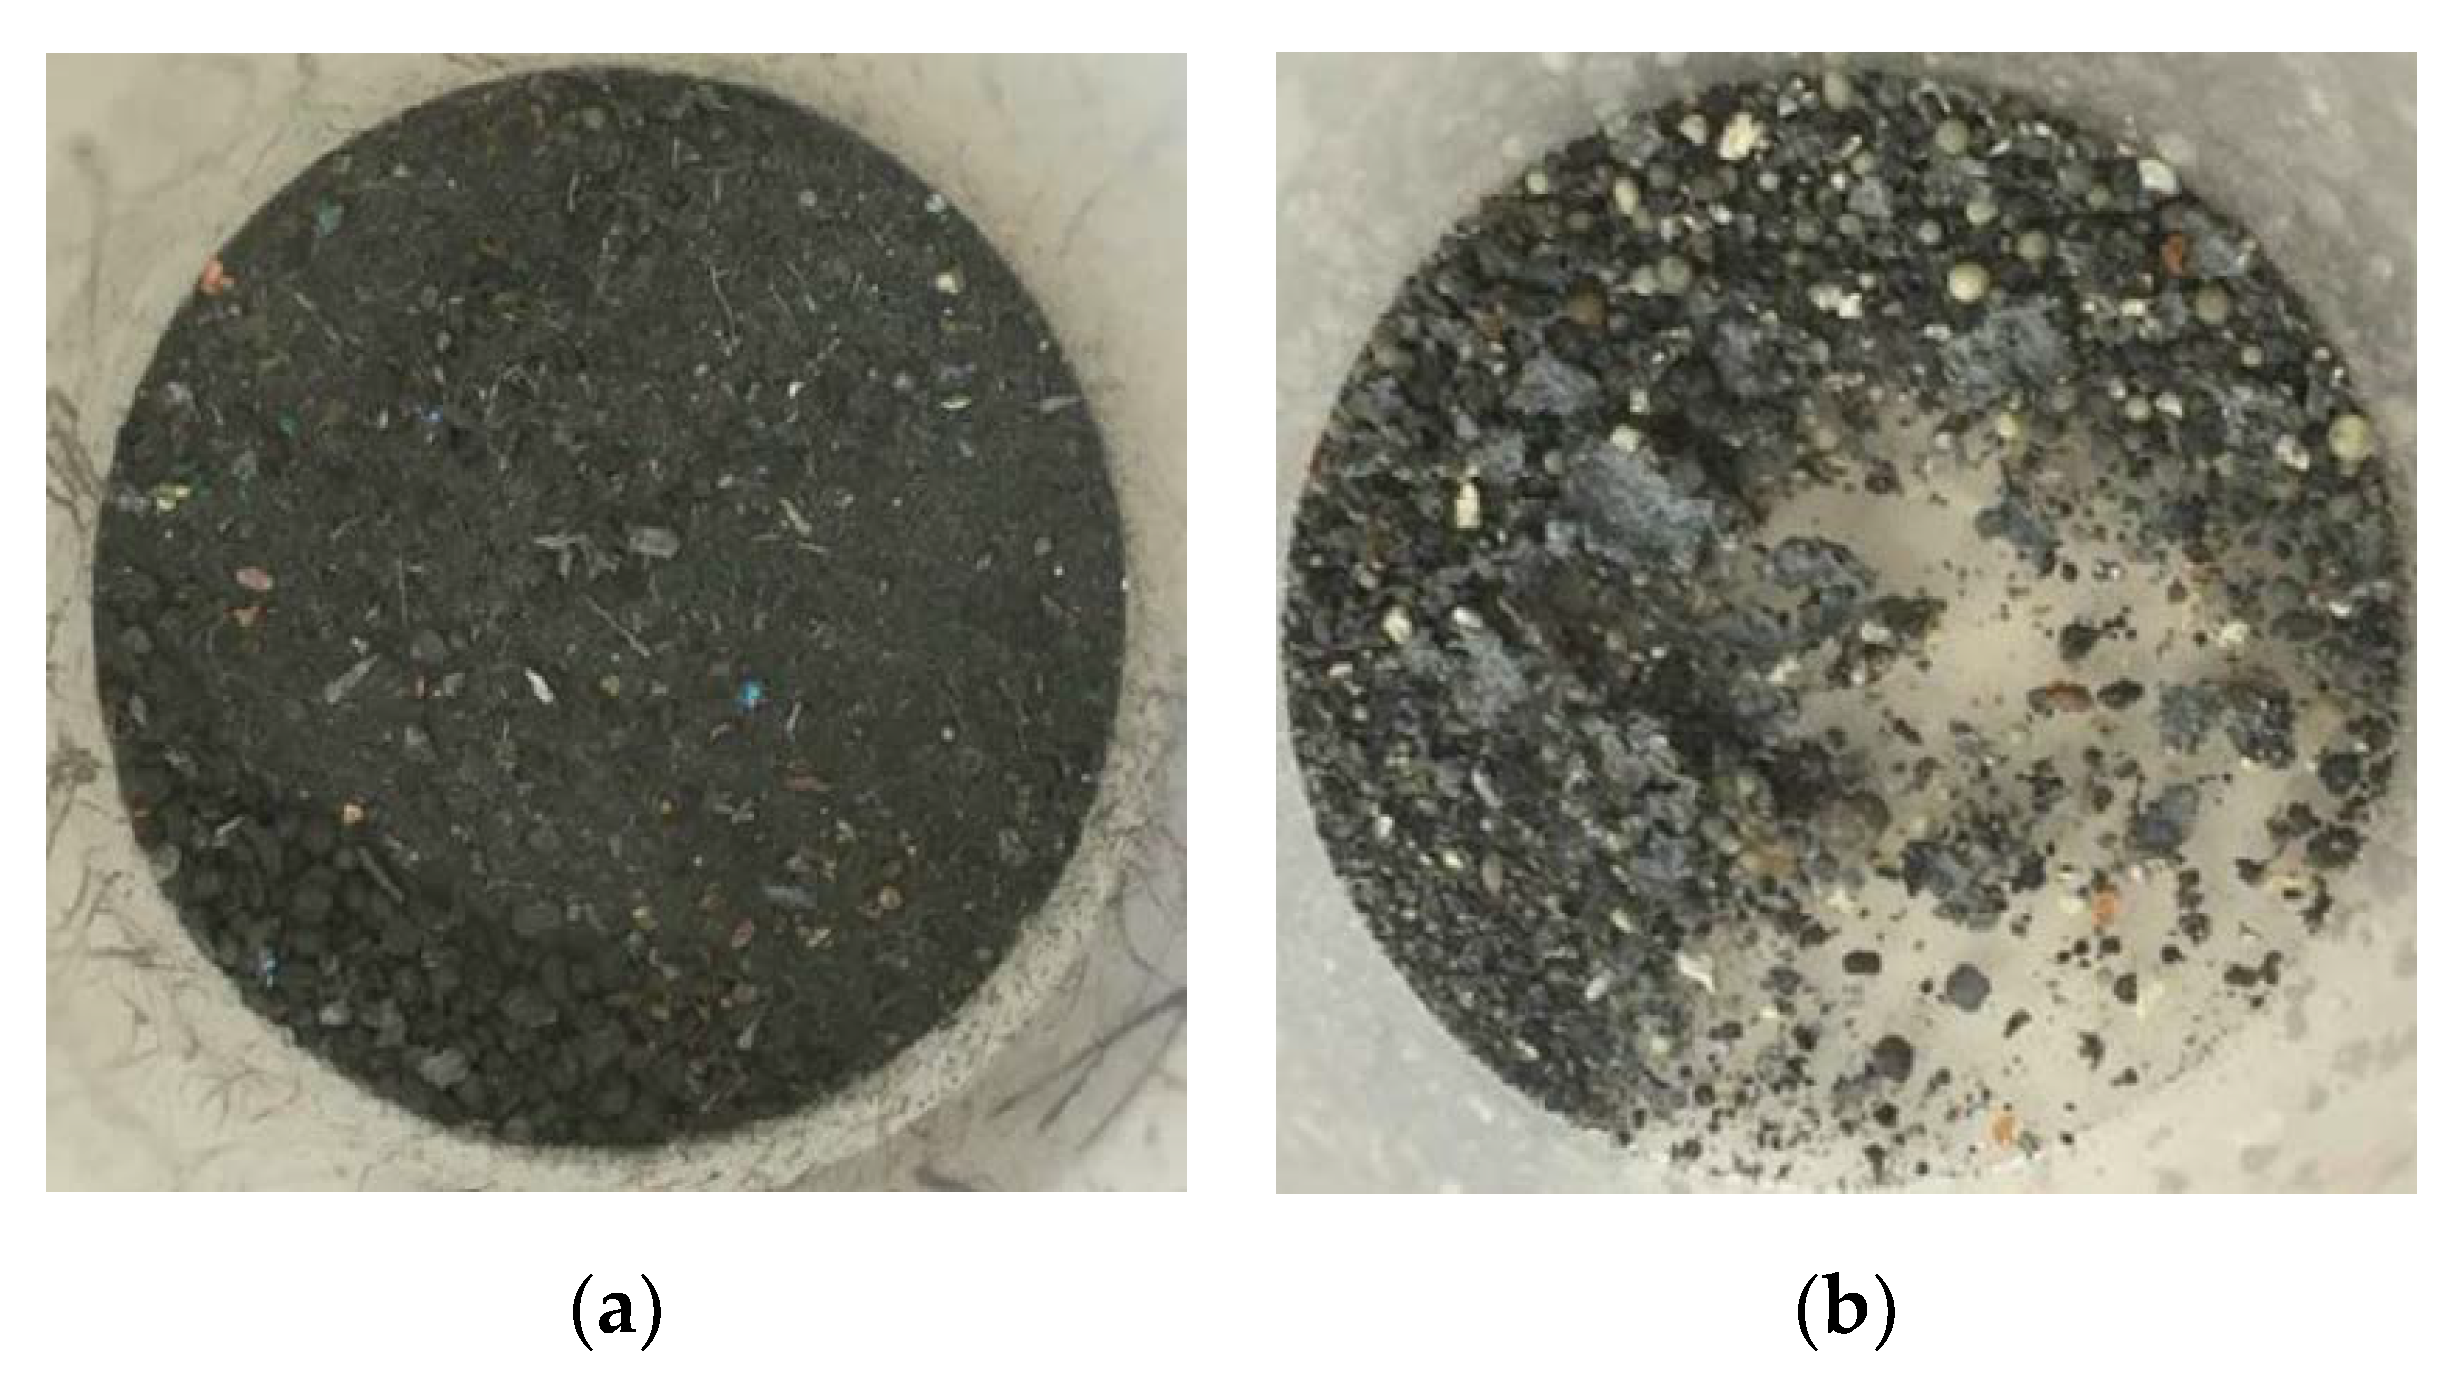
In the solid residue after digestion using US EPA Method 3052 (method A1,
Figure 6b), new formations were observed that were not present in the original sample (
Figure 6a). These new formations may have originated in the presence of nitric acid as a result of the passivation of some metals by a layer of stable oxides (e.g., Al, Ca, Cr and Fe) or the hydrolysis of some metals to form hydroxides (Sn). The use of hydrofluoric acid could result in the formation of stable fluorides of alkaline earth metals, but also of Cu, Pb and Zn.
SEM analysis of the solid residue after digestion of PCB material using Method A1 revealed marked diversity in shape and size of particles (
Figure 7a). Local chemical analysis of the solid surface using the EDX method confirmed the presence of fibrous material (
Figure 7b, spectrum 5) that, considering the higher content of non-metallic elements, probably corresponds to non-decomposed organic matter. Element concentration on the different particle surfaces (
Figure 7a) is given in
Table 3. It is evident, from
Table 3, that the presence of Fe was confirmed in the all analysed sites. Cu was found only in some sites (
Figure 7, spectrum 6, 7 and 9). F, O, Ca and Mg were found on the all investigated sites. Presence of Al and Br was confirmed almost on the all sites.
Solid residue after decomposition in HF is probably created of florides, mainly Ca and Mg, respectively, formed from unreacted HF. The oxygen in the residue is probably in the form of Al, Fe and Ca oxides. The HNO3 used in the decomposition mixture caused the formation of a layer of stable oxides of the given metals (passivation). Bromides were re-formed from Br (flame retardant), which was released into solution upon decomposition. The presence of Na (1–2.5 wt%), S (1–3.5 wt%), Cl (0.6–1.5 wt%) was found in some analyzed sites. It can be assumed that the presence of Br and Cl in the solid residue may be due to incomplete decomposition of the organic material (plastics) contained in the WPCBs. In addition to the mentioned elements, the presence of Ag was detected in the analyzed sites (7 and 8). At site 7, it was detected even up to 7.4 wt% of Ag.
Author Contributions
Conceptualization, D.R.; methodology, D.R.; formal analysis, D.R., S.R. and V.M.; investigation, D.R., V.M., M.L. and R.S.; resources, M.L.; writing—original draft preparation, D.R.; writing—review and editing, S.R. and V.M. visualization, S.R.; project administration, S.R.; funding acquisition, S.R. All authors have read and agreed to the published version of the manuscript.
Funding
This research was funded by Scientific Grant Agency VEGA, grant number 1/0631/17.
Conflicts of Interest
The authors declare no conflict of interest. The funders had no role in the design of the study; in the collection, analyses, or interpretation of data; in the writing of the manuscript, or in the decision to publish the results.
References
- Maragkos, K.G.; Hahladakis, J.N.; Gidarakos, E. Qualitative and quantitative determination of heavy metals in waste cellular phones. Waste Manag. 2013, 33, 1882–1889. [Google Scholar] [CrossRef]
- Kaya, M. Recovery of metals and nonmetals from electronic waste by physical and chemical recycling processes. Waste Manag. 2016, 57, 64–90. [Google Scholar] [CrossRef] [PubMed]
- Ghosh, B.; Ghosh, M.K.; Parhi, P.; Mukherjee, P.S.; Mishra, B.K. Waste printed circuit boards recycling: An extensive assessment of current status. J. Clean. Prod. 2015, 94, 5–19. [Google Scholar] [CrossRef]
- Das, S.; Ting, Y.-P. Evaluation of wet digestion methods for quantification of metal content in electronic scrap material. Resources 2017, 6, 64. [Google Scholar] [CrossRef]
- Yamane, L.H.; de Moraes, V.T.; Espinosa, D.C.R.; Tenório, J.A.S. Recycling of WEEE: Characterization of spent printed boards from mobile phones and computers. Waste Manag. 2011, 31, 2553–2558. [Google Scholar] [CrossRef] [PubMed]
- Kasper, A.C.; Berselli, G.B.T.; Freitas, B.D.; Tenório, J.A.S.; Bernardes, A.M.; Veit, H.M. Printed wiring boards for mobile phones: Characterization and recycling of copper. Waste Manag. 2011, 31, 2536–2545. [Google Scholar] [CrossRef]
- Priya, A.; Hait, S. Qualitative and quantitative metals liberation assessment for characterization of various waste printed circuit boards for recycling. Environ. Sci. Pollut. Res. 2017, 24, 27445–27456. [Google Scholar] [CrossRef]
- Bizzo, W.A.; Figueiredo, R.A.; de Andrade, V.F. Characterization of printed circuit boards for metal and energy recovery after milling and mechanical separation. Materials 2014, 7, 4555–4566. [Google Scholar] [CrossRef] [PubMed]
- Le, H.-L.; Yamasue, E.; Okumura, H.; Ishihara, K.N. MEMRECS-A sustainable view for metal recycling from waste printed circuit boards. J. Environ. Prot. 2013, 4, 803–810. [Google Scholar] [CrossRef]
- Ogunniyi, I.O.; Vermaak, M.K.G.; Groot, D.R. Chemical composition and liberation characterization of printed circuit board comminution fines for benefication investigations. Waste Manag. 2009, 29, 2140–2146. [Google Scholar] [CrossRef]
- Laubertova, M.; Malindzakova, M.; Rosova, A.; Trpcevska, J. Material flow model of electronic waste sampling and assaying. Przem. Chem. 2016, 95, 1390–1394. [Google Scholar]
- Sundqvist, R. E-Scrap Fundamentals. 2012. Available online: http://www.boliden.com/globalassets/investor-relations/reports-and-presentations/capital-markets-day/2012/cmd/2-e-scrap-fundamentals-roger-sundqvist-general-manager-boliden-ronnskar.pdf (accessed on 11 July 2020).
- Umicore Precious Metals Refining. 2009. Available online: http://www.umicore.com/storage/migrate/2009sept_PMR.pdf (accessed on 12 July 2020).
- Recycling Aurubis. 2013. Available online: http://www.aurubis.com/binaries/content/assets/aurubis-en/dateien/product-documents/recycling-brochure_2013_eng_doppelseitig.pdf (accessed on 10 July 2020).
- ALS Scandinavia. Available online: http://www.alsglobal.se (accessed on 14 July 2020).
- Vegliò, F.; Birloaga, I. Waste Electrical and Electronic Equipment Recycling, 1st ed.; Elsevier: Amsterdam, The Netherlands, 2018. [Google Scholar]
- Khaliq, A.; Rhamdhani, M.A.; Brooks, G.; Masood, S. Metal extraction processes for electronic waste and existing industrial routes: A review and australian perspective. Resources 2014, 3, 152–179. [Google Scholar] [CrossRef]
- Ramanathan, T.; Ting, Y.-P. Selection of wet digestion methods for metal quantification in hazardous solid wastes. J. Environ. Chem. Eng. 2015, 3, 1459–1467. [Google Scholar] [CrossRef]
- Priya, A.; Hait, S. Toxicity characterization of metals from various waste printed circuit boards. Process Saf. Environ. Prot. 2018, 116, 74–81. [Google Scholar] [CrossRef]
- Priya, A.; Hait, S. Comprehensive characterization of printed circuit boards of various end-of-life electrical and electronic equipment for benefication investigation. Waste Manag. 2018, 75, 103–123. [Google Scholar] [CrossRef] [PubMed]
- Krakovská, E.; Kuss, H.-M. Digestions in Analytical Chemistry (In Slovak), 1st ed.; Vienala: Košice, Slovakia, 2001. [Google Scholar]
| Publisher’s Note: MDPI stays neutral with regard to jurisdictional claims in published maps and institutional affiliations. |
© 2020 by the authors. Licensee MDPI, Basel, Switzerland. This article is an open access article distributed under the terms and conditions of the Creative Commons Attribution (CC BY) license (http://creativecommons.org/licenses/by/4.0/).


 and
and 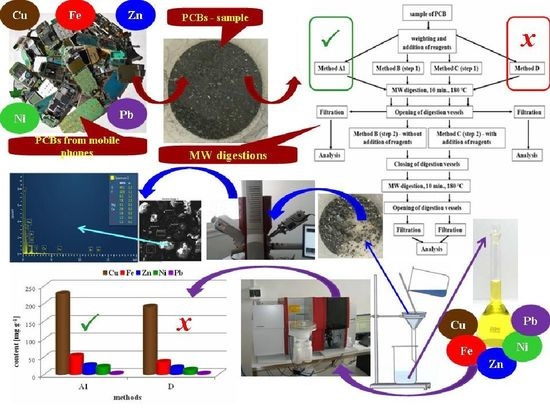


