Abstract
There is a growing number of international studies on the association between ambient air pollution and adverse pregnancy outcomes, and this systematic review and meta-analysis has been conducted focusing on European countries, to assess the crucial public health issue of this suspected association on this geographical area. A systematic literature search (based on Preferred Reporting Items for Systematic reviews and Meta-Analyses, PRISMA, guidelines) has been performed on all European epidemiological studies published up until 1 April 2020, on the association between maternal exposure during pregnancy to nitrogen dioxide (NO2) or particular matter (PM) and the risk of adverse birth outcomes, including: low birth weight (LBW) and preterm birth (PTB). Fourteen articles were included in the systematic review and nine of them were included in the meta-analysis. Our meta-analysis was conducted for 2 combinations of NO2 exposure related to birth weight and PTB. Our systematic review revealed that risk of LBW increases with the increase of air pollution exposure (including PM10, PM2.5 and NO2) during the whole pregnancy. Our meta-analysis found that birth weight decreases with NO2 increase (pooled beta = −13.63, 95% confidence interval (CI) (−28.03, 0.77)) and the risk of PTB increase for 10 µg/m3 increase in NO2 (pooled odds ratio (OR) = 1.07, 95% CI (0.90, 1.28)). However, the results were not statistically significant. Our finding support the main international results, suggesting that increased air pollution exposure during pregnancy might contribute to adverse birth outcomes, especially LBW. This body of evidence has limitations that impede the formulation of firm conclusions. Further studies, well-focused on European countries, are called to resolve the limitations which could affect the strength of association such as: the exposure assessment, the critical windows of exposure during pregnancy, and the definition of adverse birth outcomes. This analysis of limitations of the current body of research could be used as a baseline for further studies and may serve as basis for reflection for research agenda improvements.
Keywords:
systematic review; meta-analysis; birth weight; low birth weight; preterm birth; exposure; air pollution; PM; NO2 1. Introduction
Low birth weight (LBW) is defined by the World Health Organization (WHO) as birth weight less than 2500 g (referenced P07.0–P07.1 in the 10th revision of the international classification of diseases–ICD 10) [1]. In addition, preterm birth (PTB) is defined as childbirth occurring at less than 37 completed weeks or 259 days of gestation (referenced P07.2–P07.3 in ICD 10). The WHO estimated that between 15% and 20% of births worldwide are LBW, representing 20 million births a year [1]. On the other hand, it is estimated that more than 15 million babies are born preterm every year, more than 1 in 10 babies around the world [2]. In developed countries, PTB rates have been reported to range from 5% to 7% of live births [3]. Moreover, these figures appear to be on the rise [4]. For European countries, according to the European Perinatal Health Report, low birthweight babies accounted for less than 4.5% of all births in Iceland, Sweden, Finland, etc. and around 10% in Spain, France, etc. [5]. The percentage of low birthweight babies was significantly higher in 2015 compared with 2010 in some countries. Comparisons in the preterm birth rate in 2010 and 2015 differed widely between countries significantly higher in 8 countries.
The consequences of LBW and PTB include fetal and neonatal mortality, and morbidity (60% to 80% of all neonatal deaths [6]), poor cognitive development and an increased risk of chronic diseases later in life [7,8,9]. Recent studies have demonstrated that LBW will increase the risk of diabetes and cardiovascular disease later in life (reduction in risk per kg increase in birthweight in both men: hazard ratio (HR) = 0.88, 95% confidence interval (CI): 0.84–0.91, and women: HR = 0.88, 95% CI: 0.82–0.95 [10]). PTB has long-term adverse consequences for health, too. It is well documented that children who are born prematurely are more likely to present cerebral palsy, sensory deficits, learning disabilities and respiratory illnesses compared to children born at term [2,11,12,13,14,15,16,17,18]. Complications related to PTB are the leading cause of death for children under 5 years old, causing an estimated 1 million deaths worldwide in 2015 [6,19]. Therefore, with a range of both, short- and long-term consequences, LBW and PTB represent still today a major public health issue. Additionally, adverse consequences related to LBW and PTB contribute largely to the global health costs [1,19,20,21,22]. According to the European Union (EU) benchmarking report 2009/2010, the statistical data collected from 14 European countries demonstrate the significant and growing cost of prematurity in Europe. For instance, in Denmark each preterm birth cost near 55,460 euros for premature treatment and in France prematurity cost more than 1.5 Billion euro each year. [23].
Risk factors of PTB and LBW are still not completely understood, although the etiology is thought to be multifactorial [2]. It remains unclear whether these adverse outcomes could result from determinants which act independently or in combination. These factors include medical conditions of the mother or fetus, genetic influences, infertility treatments, behavioral and socioeconomic factors, iatrogenic prematurity, and environmental exposure [4,24,25]. Epidemiological studies indicate that currently the ambient air pollution could constitute an important environmental public health issue for individual and public health point of view [26]. In the last decade, a growing body of evidence has associated exposure to ambient air pollution, mainly particulate matter (PM) and nitrogen dioxide (NO2), during pregnancy with adverse pregnancy outcomes, especially fetal growth and gestational duration [27,28,29,30,31,32,33]. Pregnancy may constitute a particular period of high susceptibility to pollutants contained in air pollution because of a high level of cell proliferation, organ development and the changing capabilities of fetal metabolism [34]. Molecular studies have provided reasonable biological mechanisms for the association between air pollution and fetal growth and development [35,36]. Ambient air pollution exposure is hypothesized to affect the fetus either directly through trans-placental exposure or indirectly by affecting physiological changes in the mother [37]. Although effects of ambient air pollution on general population, and on pregnancy specifically are relatively small, larger population attributable health risks may be expected due to the ubiquitous nature of ambient air pollution exposure and because all the population is in contact with ambient air and so all the population can be considered at risk [26]. Therefore, it is important that appropriate policies are adopted to diminish ambient air pollution emissions and to raise the awareness of pregnant women [38]. According to the WHO, the goal is to achieve a 30% reduction of the number of infants born with a weight lower than 2500 g by the year 2025 [39]. This would translate into a 3.9% relative reduction per year between 2012 and 2025 and a reduction from approximately 20 million to about 14 million infants with low weight at birth [1].
Based on this evidence, several environmental public health measures have been adopted and implemented at the individual and population level to improve the quality of ambient air, such as promoting cleaner fuel sources and energy technologies, promoting smarter urban planning that aims to reduce urban density and traffic-related pollution, etc. [40]. So far, environmental policies designed to reduce air pollution issue have shown to be effective, with health benefits and helping to reach health policy objectives [41,42]. For instance: Japanese legislation has limited transportation-related emission since 2001. The average NO2 concentration decreased from 30 to 21 ppb and PM2.5 concentrations decreased from 38 to 26 mg/m3. These reductions respectively led to 1.1% and 0.6% lower prevalence of pediatric asthma [43].
To date, Health Impact Assessments (HIA) are recognized to play a crucial role in evaluating different policy scenarios for reducing air-pollution levels; in assessing new air-quality directives; or in calculating the external monetary costs of air pollution or the benefits of preventive actions [44,45]. More precisely, an HIA in this field provides the number of health events attributable to air pollution in the target population [45] and, thereby, in our case, quantifies the air pollution burden of disease due to adverse birth outcomes as preterm birth and low birth weight complications in Europe [46]. Assessment of environmental burden of disease enable the identification of policy priorities. To implement a HIA, several data sources are needed, including the dose-response function; this function derives from epidemiological studies assessing statistical indicator as relative risk associated with the modelled and observed exposure [47]. In our case, this relative risk may come from Europe based meta-analysis providing pooled estimates. One substantial input of meta-analysis is to offer estimates within a specific vulnerable population as well as a closer match with the geographical context of exposure [48]. More often, the dose–response curve linking air pollution and health impacts is supposed to be linear which means that reductions in air-pollution levels, will have consequences for health effects independently to the starting point on the curve. Therefore, this linear relationship cannot capture the different level of an individual’s susceptibility to air pollution [49,50]. It is a reason why preventive action aimed at reducing air-pollution levels in general and not only focusing on air-pollution peaks. Focusing on the peaks of air pollution would only prevent a small number of health events [45].
Recently, there has been a growing number of studies investigating the relationship between adverse birth outcomes, as PTB and LBW, and air pollutant concentration. The possible effect of air pollution exposures on birth outcomes has been reviewed in several systematic reviews and meta-analyses [26,37,48,51,52,53,54,55,56,57,58]. To the best of our knowledge, no European systematic review was performed to consider more homogeneous level of exposure to air pollution. The European Union and WHO have drafted a legislative framework which establishes health-based standards and objectives for several air pollutants. For instance, the threshold for the particulate matter (PM10) concentrations is 40 µg/m3 on 1 year, for PM2.5 25 µg/m3on 1 year, for NO2 40 µg/m3 on 1 year and for SO2 it is 125 µg/m3 on 24 h, these regulations differ from one continent to another. In this way, the average concentration of various air pollutants differs from one country to another. For instance, the level of exposure to annual average concentration of NO2 in the countries of the world, between 2000 and 2015 varied from 97 µg/m3 (NYC, USA) and 55 µg/m3 (Beijing, China) into 35 µg/m3 (Paris, France) and 26.1 µg/m3 (Valencia, Spain) [59,60,61,62].
In this setting, updating the literature synthesis of European studies may improve our understanding of the relationship between air pollution, and PTB (as well as LBW). Therefore, we conducted a meta-analysis to assess the association between air pollution and the risk of PTB and LBW, separately, in order to suggest future directions for European research and public health policies.
Our work investigated the following epidemiological question: among newborn in European countries, is air pollution exposure of women during pregnancy significantly related to a risk of adverse birth outcome including weight and term of birth in observational studies?
We focused our analysis only the European studies which investigated the relationship between PM and NO2 and birth outcome—LBW and PTB—in order to produce an appropriate dose-response function within a specific European population as well as a closer match with the geographical context of exposure. Therefore, our European meta-analysis could go beyond the main limitation of HIAs performed today to quantify the environmental burden of disease.
2. Materials and Methods
2.1. Search Strategy
The systematic literature search was conducted with the PubMed platform in order to access to the Academic Search Complete databases and Medline, among articles published up until 1 April 2020. The search strategy followed the Preferred Reporting Items for Systematic reviews and Meta-Analyses (PRISMA) guidelines [63] and was performed with the following keywords found in article titles and/or abstract:
“ambient air pollution” OR “outdoor air pollution” OR “atmospheric air pollution” AND “birth outcomes” OR “pregnancy outcomes” OR “low birth weight” OR “birth weight” OR “low-birth-weight” OR “birthweight” OR “birth-weight” OR “preterm birth” OR “gestational age” OR “LBW” OR “PTB” AND “Europe” OR “European” OR “Austria” OR “Belgium” OR “Bulgaria” OR “Croatia” OR “Cyprus” OR “Czech Republic” OR “Denmark” OR “Estonia” OR “Finland” OR “France” OR “Germany” OR “Greece” OR “Hungary” OR “Ireland” OR “Italy” OR “Latvia” OR “Lithuania” OR “Luxembourg” OR “Malta” OR “Netherlands” OR “Poland” OR “Portugal” OR “Romania” OR “Slovakia” OR “Slovenia” OR “Spain” OR “Sweden” OR “United Kingdom”
2.2. Studies Selction Strategy
Figure 1 summarizes the different steps of the selection process, in line with PRISMA recommendations.
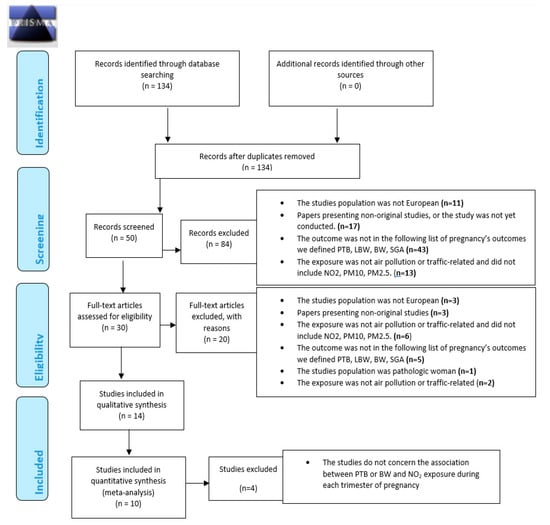
Figure 1.
Preferred Reporting Items for Systematic reviews and Meta-Analyses (PRISMA) 2009 Flow Diagram. From: Moher D, Liberati A, Tetzlaff J, Altman DG, The PRISMA Group (2009). Preferred Reporting Items for Systematic Reviews and Meta-Analyses: The PRISMA Statement. PLoS Med 6: e1000097. doi:10.1371/journal.pmed1000097 [63].
At the first step, the inclusion criteria were human studies, peer-reviewed papers written in English and articles published after 1998.
We restricted our systematic review on geographical location with European study only—for the reason described above—on the pregnant women and pregnancy outcomes, and on ambient air pollution. Papers presenting non-original studies were ultimately excluded.
At the second step, the inclusion criteria were specific pregnancy outcomes definitions including birthweight, low birth weight, preterm birth or small for gestational age (SGA). Secondary criteria were studies investigated specific outdoor air pollutants measured including NO2, PM10, PM2.5.
Two authors (VS and WK) independently screened the papers based on information in the title, abstracts and full manuscripts to select those papers considered relevant based on the screening criteria described below
At the last step, to perform meta-analysis, among articles included according to the inclusion criteria for the systematic literature review, the inclusion criteria were studies with measure of association between pollutant concentration and birth outcome.
In the last step, bibliographic reference lists of all included studies were searched manually to identify additional studies cited by the previous references.
Finally, meta-analysis was not performed when less than four studies were available for measures of association between a given outcome and a pollutant. Consequently, of the 14 articles included in this systematic literature review, 4 were excluded according to the inclusion criteria for the meta-analysis. Finally, 10 articles were included in the meta-analysis.
2.3. Data Extraction
For each study, we extracted and reported in several tables the following information:
- General information: first author’s name, country of origin and date of study;
- Main study characteristics: study design, period, location, statistical methods, population size, main findings (related to PTB, LBW, BW, SGA outcomes and NO2, PM10 and PM2.5 only);
- Participants’ characteristics: information on confounders, exposure measure;
- Outcome measures (definition, outcomes classification and source).
Assessments of association including odds ratios (ORs), hazard ratios (HRs), relative risks (RRs) and other metrics measuring the strength of association between outcomes and exposure to different pollutants including NO2, PM10, PM2.5 were extracted. When several measures of association were available, we reported those one from the fully adjusted models.
The two authors (VS and WK) independently extracted all data from selected studies.
2.4. Meta-Analysis
When at least four studies were available, the pooled estimate between pregnancy outcomes and exposure to air pollutant was computed. Studies’ risk and beta estimates were expressed as unit corresponding to an increase of 10 µg/m3. A fixed or random model based on the Cochran Q-test, the I-square statistic, and the associated p-value, was used to obtain the combined effect. The level of heterogeneity between studies is quantified with the I-square indicator (I2). When the Cochran Q-test do not reveal significant heterogeneity between studies, a fixed model was applied; inversely, a random model was implemented when the Cochran Q-test was significant. Q-test value between 25% and 50% correspond to a low level of heterogeneity, between 50% and 75% a medium level of heterogeneity and >75% corresponds to a high level of heterogeneity. Forest plots were used to visualize the combined risk estimates. Statistical analysis was performed using the STATA 11 software.
3. Results
3.1. Studies Selected for Review
In accordance with criteria summarized in Figure 1, in all 134 published selected, a total of 84 studies were excluded based on titles. At the second step, titles of the 134 were screened by two authors (VS and WK) independently. A total of 84 studies were excluded based on the criteria described above. At the third step, the abstracts of the remaining 50 articles (of the 134 articles initially selected) were thoroughly read independently by two experts (VS and WK, authors of this article); 16 were then excluded following criteria described above.
Full manuscripts of the remaining 30 articles (of the 134 articles initially selected) were thoroughly read and 16 articles were excluded. Finally, a total of 14 articles were included according to the inclusion criteria for the systematic literature review. Finally, bibliographic reference lists of all included studies were searched manually to identify additional studies cited by the previous references. No additional article was found. Selected studies are defined in Table 1.

Table 1.
Main characteristics of the selected studies, order by year of publication.
In order to perform a meta-analysis, studies were excluded where there was with a measure of exposure not expressed as a pollutant concentration (for instance: exposed/not exposed) or without measure of association, or when the outcome or the exposure (NOx in summer season) was not pertinent for the meta-analysis.
At last, meta-analysis was performed when at least four studies were available for measures of association between a given outcome and a pollutant. Consequently, of the 14 articles included in this systematic literature review, 4 were excluded according to the inclusion criteria for the meta-analysis. Finally, 10 articles were included in the meta-analysis.
3.2. General Description
There were 30 studies published since 1998, including more than 47,805 low birth weight newborns (and subtypes), 311,432 preterm birth (and subtypes) and 3319 newborns small for gestational age, in order to estimate the association between adverse pregnancy outcomes and exposure to three ambient pollutants, NO2, PM10 and PM2.5. About 10 were eligible for the meta-analyses with the exclusion of 4 studies [75,81,89,91]. Of these, LBW, VLBW, ELBW, PTB, VPTB, EPTB, SGA, gestational age and birth weight were investigated (Table 1). About 4046 cases of preterm birth were included in the meta-analyses and 12,502 births were used to study the birth weight.
3.3. Study Design and Location
Most of the studies (10 studies) were conducted in Spain [67,68,69,71,75,77,81,84,85,92]. There were also 5 studies conducted in France [72,76,78,90,91], 2 studies in: Scotland [79,88], Italy [74,89], England [65,80] and only one study in Germany [66], Norway [70], Lithuania [64], Finland [93], Belgium [82]. In addition, two studies included several (more than 10) European countries [73,86], one study included Spain and Belgium [83] and one study included Spain and Italy [87]. Our systematic review group different study designs: the majority of the studies are cohort studies [66,67,68,69,71,72,73,75,76,78,80,82,83,85,86,88,93]; others are ecological time-series studies [64,65,70,74,77,81,84,87,92], spatial approach study [90] and longitudinal study [79]. Prospective study [89], retrospective study [91].
3.4. Cases Definition and Data Sources
Several studies investigated the birth weight [66,67,68,70,72,76,80,82,88,89] or gestational age [67], but most investigated specific pathological outcomes. First, several studies investigated LBW and subtypes [64,66,70,73,75,81,84]. Several studies investigated PTB and subtypes [64,65,69,74,77,78,79,81,85,87,90,92,93]. Finally, some studies investigated SGA: birth weight or length below the 10th percentile according to standard percentile charts for sex and gestational age in the population [68,70,75,82,91] (Table 2).
Table 2.
Definitions of birth outcomes and studied population (order by outcome).
Databases were drawn mainly from birth certificate information and health database from hospital information systems while other form institutes of national health statistics and cohort databases were also used.
3.5. Pollutants Investigated
Most frequently, the studies investigate exposure to air pollutants separately NO2, PM10 and PM2.5 [70,73,75,77,80,86,88] or exposure to PM2.5 and NO2 [66,81,84,93] or exposure to PM10 and NO2 [72,74,76,79,82,87,92] or exposure to NO2 [64,67,68,69,71,78,83,85,90,91] or exposure to PM10 [65,89]. Some papers have used a monitoring station-based approach with average from all monitoring stations [89,92] or average from existing monitoring stations [64,65,74,77,81,84,87] but most used a modeling-based approach with, on the one hand, land-use regression, LUR [66,67,68,69,71,73,75,76,78,80,83,85,86], and on the other hand dispersion models [70,72,76,79,88,90,91]. Few studies use other models as spatial temporal interpolation method (Kriging method) [82] and system for integrated modeling of atmospheric composition (SILAM model) [93].
Table 3 describes the approaches used to assess the residential exposure measures and level of exposure assigned to the population of all studies included in the systematic review (n = 30).
Table 3.
Summary of approaches used to assess the residential exposure measures.
3.6. Window of Exposure
The different definitions of critical windows of exposure considered in the 30 studies included in the systematic review is described in Table 4. Short- and long-term exposure to air pollutants were used to investigate the relationship between LBW, PTB, SGA and residential exposure (at home address). Long-term exposures were the most explored cumulative exposure windows [64,66,67,68,69,70,71,72,73,75,76,80,81,82,83,84,85,86,87,88,89,91,92,93]. Moreover, few studies chose not to focus on a particular window of exposure, instead measuring annual average pollutant concentrations at residence [78,79,90].
Table 4.
Definition and assessment of window of exposure.
3.7. Overview of Current Evidence Concerning Possible Effects on Birth Outcomes of Exposure to Air Pollution
In this section, the results of studies are presented in Figure 2, Figure 3 and Figure 4, structured by window of exposure of different pollutants (NO2, PM10, PM2.5). Overall, results show the risk of adverse birth outcomes increases for a 10 µg/m3 increase NO2 exposure. Therefore, 19 results tend to show an association between the increase of risk of adverse pregnancy outcomes and NO2 exposure while 10 results which tend to show a decrease of these risks. Our review reveals that for 10 µg/m3 increase in NO2 exposure (Figure 2) newborn have increased risk of:
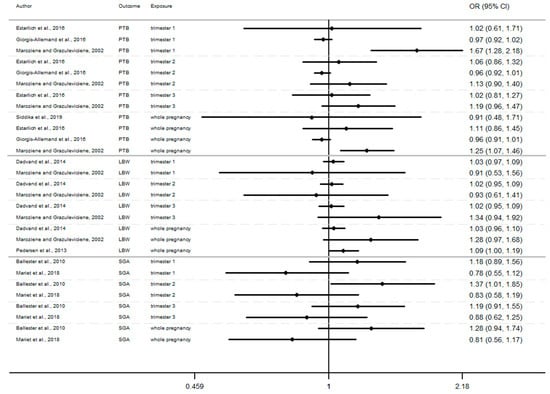
Figure 2.
Risk of birth outcome for NO2 exposure during different windows of exposure during pregnancy.
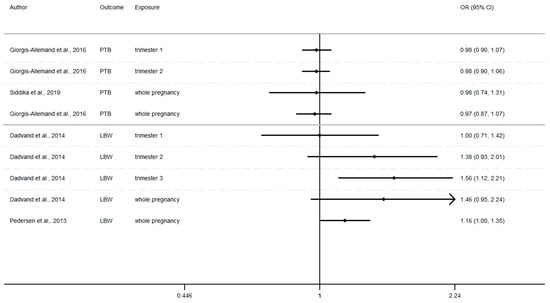
Figure 3.
Risk of birth outcome for PM10 exposure during different windows of exposure during pregnancy.
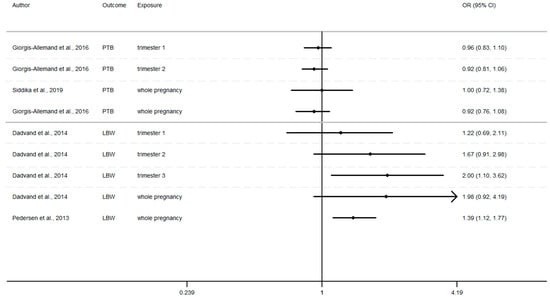
Figure 4.
Risk of birth outcome for PM2.5 exposure during different windows of exposure during pregnancy.
- Preterm birth (OR = CI 95%) OR = 1.67 (1.28–2.18) [64] for the first trimester, OR = 1.06 (0.86–1.32), 1.13 (0.90–1.40) [64,85] for the second trimester, OR = 1.19 (0.96–1.47) [64] for the third trimester.
- Small for gestational age (OR = CI 95%) OR = 1.18 (0.89–1.56), OR = 1.37 (1.01–1.85), OR = 1.19 (0.91–1.56), respectively for the windows of exposure of 1st, 2nd and 3rd trimester [68],
- Low birth weight (OR = CI 95%) OR = 1.03 (0.97–1.09), OR = 1.02 (0.95–1.09), OR = 1.34 (0.94–1.92) respectively for the windows of exposure of 1st, 2nd and 3rd trimester [64,73,75].
Furthermore, as shown in Figure 2, Figure 3 and Figure 4 (Appendix A), the LBW risk increases for outdoor air pollutant exposure during the windows of exposure of whole pregnancy.
- a 10 µg/m3 increase NO2 exposure: OR = 1.03 (0.96–1.10), OR = 1.28 (0.97–1.68), OR = 1.09 (1.00–1.19) [64,73,75].
- a 10 µg/m3 increase PM10 exposure OR: = 1.46 (0.95–2.24) and 1.16 (1.00–1.35) [73,75]
- a 10 µg/m3 increase PM2.5 exposures OR: = 1.98 (0.92–4.19) and 1.39 (1.12–1.77) [73,75]
However, several results were not significant, except studies [64,68,75].
Among studies focusing on critical windows, during each window of exposure the number of results which tend to show an association between PTB or SGA and air pollutant are the same and do not increase or decrease with the trimester of pregnancy, for any windows of exposure only three results tend to show an association [64,68,85].
Whereas the risk of LBW seems to increase as the pregnancy progresses. In this way, our review reveals that two results tend to show an association between the risk of LBW and air pollutant exposure (NO2, PM10, PM2.5, Figure 2, Figure 3 and Figure 4) during the first trimester of pregnancy (Appendix B), three results tend to show this association during the second trimester of pregnancy (Appendix C) and four results tend to show this association during the third trimester (Appendix D).
In addition, when studies consider the exposure of the entire pregnancy, seven results found an association between air pollutant exposure and the increase of the risk of LBW against only 3 results for PTB and SGA in the same windows (Appendix A).
Among studies focusing on the 1st trimester of exposure the risk of adverse birth outcomes ranges from 0.78 to 1.67 with confidence interval range from 0.53 to 2.18. For the 2nd trimester of exposure results (OR) range from 0.83 to 1.67 with a confidence interval range from 0.58 to 2.98. For the 3rd trimester of exposure results (OR) range from 0.88 to 2.00 with a confidence interval range from 0.62 to 3.62. These inconsistent results illustrate the lack of uniformity in the methods employed, difference between cross section, variability of variable’s definition, and the lack of studies, particularly in Europe.
For studies focusing on the whole pregnancy for the relationship between pregnancy adverse outcomes risk and air pollutant exposition: NO2 [64,68,73,75,85,86,91,93], PM10 [73,75,86,93], PM2.5 [73,75,86,93], only two studies had significant results. Maroziene and Grazulviciene, 2002 [64] suggest that the risk of PTB increases with NO2 exposure (OR = 1.25; 1.07–1.46), while Pedersen et al., 2013 [73] found increased LBW risk with PM2.5 exposures (OR = 1.39; 1.12–1.77).
The Pedersen’s study also had nearly significant results for NO2 exposure associated with LBW (OR = 1.09; 1.00–1.19) and for PM10 exposure associated with LBW (OR = 1.16; 1.00–1.35). Overall, the results reveal that the risk of adverse outcomes including: PTB [64,85,86,93], LBW [64,73,75], SGA [68,91] was not found to be significantly associated with any of the pollutants. As for the other windows of exposure (each pregnancy trimester), results are very heterogeneous and there appears to be no clear trend regardless of the model used. For NO2 exposure results (OR) range from 0.81 to 1.28 with a confidence interval range from 0.91 to 1.74. For PM10 exposure results (OR) range from 0.97 to 1.46 with a confidence interval range from 0.74 to 2.24. And for PM2.5 exposures, results (OR) range from 0.92 to 1.98 with a confidence interval range from 0.72 to 4.19.
4. Meta-Analysis
4.1. Main Characteristics
The meta-analysis presented in this study was conducted for 2 combinations between one air pollutant and two birth outcomes during different windows of exposure, when at least four studies were available for the same combination. More precisely, the 2 combinations were NO2 exposure and related with birth weight and PTB. Table 5 describes the measures of the association of the studies included in the meta-analysis.
Table 5.
Definitions of measures of association for meta-analysis.
In order to differentiate the health effect related to each trimester and entire pregnancy, stratified analyses have been performed, only when this is possible. For the combination between NO2 and preterm birth, it was conducted for the entire pregnancy only. Following these conditions, we produced, finally, 5 meta-analyses. Of these, heterogeneity (Q-test) tests indicated one meta-analyses with high I2 (I-square indicator) values (above or close to 50%) for which random effects models were applied (for the other four combinations, fixed models were used). Heterogeneity varied from 25.2% to 72.3%, indicating that measurement methods, sample properties, and characteristics varied both among and within different studies.
4.2. Birth Weight
As shown in Figure 5, the exposure of NO2 during any windows of exposure on birth weight was not statistically significant. The overall analysis did not reveal a significant decrease of birth weight in pooled beta for any windows of exposure: for second trimester the pooled beta is: −8.35, 95% CI (−23.04, 6.34) (Figure 6), for the third trimester: pooled beta = −7.04, 95% CI (−19.90, 5.81) (Figure 7). It is interesting to note here that the exposure of NO2 during the first trimester tends to show a nearly significant decrease of birth weight in pooled beta = −13.63, 95% CI (−28.03, 0.77). Finally, regarding whole pregnancy, as shown in the Figure 8, the exposure of NO2 during the entire pregnancy on birth weight was not statistically significant. The overall analysis did not reveal a significant decrease of birth weight in pooled beta (fixed models: pooled beta = −1.40, 95% CI (−6.08, 3.29)).
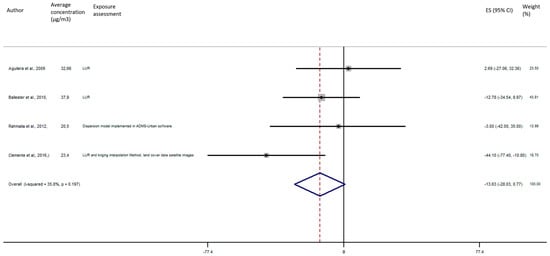
Figure 5.
Association between birth weight and NO2 exposure during the first trimester of pregnancy.
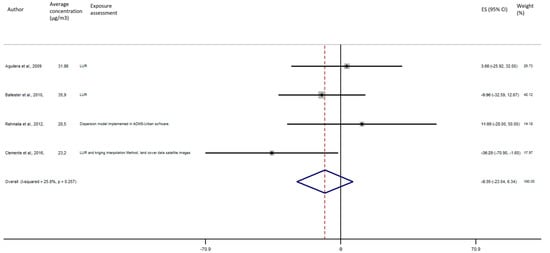
Figure 6.
Association between birth weight and NO2 exposure during the second trimester of pregnancy.
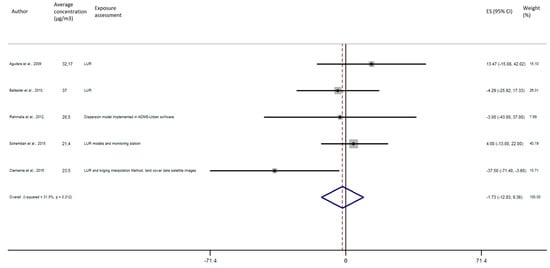
Figure 7.
Association between birth weight and NO2 exposure during the third trimester of pregnancy.
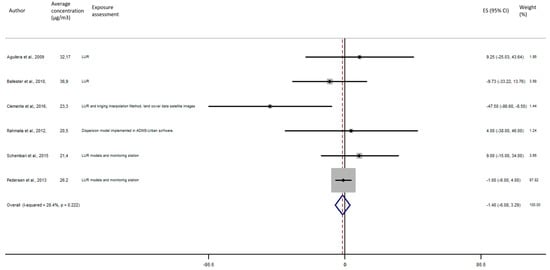
Figure 8.
Association between birth weight and NO2 exposure during the entire pregnancy.
4.3. Preterm Birth
As shown in Figure 9, the exposure of NO2 during the entire pregnancy on birth weight was not statistically significant, and did not reveal a significant increase of the risk of preterm birth in pooled OR (pooled OR = 1.07, 95% CI (0.90, 1.28)).
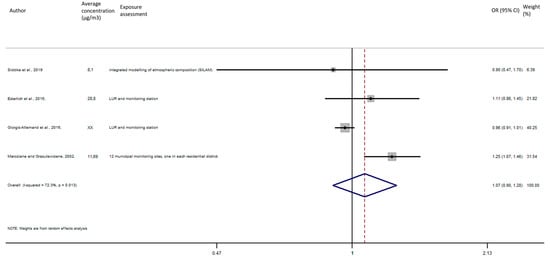
Figure 9.
Association between preterm birth and NO2 exposure during the entire pregnancy.
4.4. Sensitivity Analysis
To estimate the stability of our results, sensitivity analysis was performed by recalculating the pooled effects estimates after omitting one study each time as long as there remained at least 4 studies (Appendix B). We found that the effect estimates of each 10 µg/m3 increase in NO2 exposure during the entire pregnancy on birth weight showed no significant change by removing one single study, suggesting that the combined results were relatively stable and reliable. This is except for the sensitivity analysis of the association between birth weight and NO2 exposure during the third trimester of pregnancy, where the omission of the study of Clemente et al. (2016) [83] induced a reverse of the association that was hitherto negative (Table A1); however, the result was still not statistically significant (beta = 2.5, 95% CI = (−9.18, 14.30)). Small variations were visible, and while point combined estimates were rather similar, the precision level of the confidence interval decreased.
5. Discussion
5.1. Main Finding
Our systematic review does not show significant results, but despite this a trend is apparent in that NO2 exposure during the whole pregnancy seems to increase the prevalence of LBW. In addition, the result of published European studies included in our systematic review tend to show an increased risk of LBW with a 10 µg/m3 increase in PM2.5 and PM10, specifically for long-term exposure including exposure during last trimester and whole pregnancy. By contrast, no significant excess risk of adverse birth outcomes has been found regardless of pollutant or short-term window of exposure (each trimester).
Our meta-analysis does not reveal a significant result, and the exposure of NO2 during the first, second or third trimester on birth weight was not statistically significant. The overall analysis did not reveal a significant decrease of birth weight in pooled beta. For the PTB outcome and the exposure of NO2 during the entire pregnancy, the overall analysis did not reveal a significant increase of the risk of preterm birth in pooled-OR.
The characteristics of the different studies (design, adjustment, definition of the outcomes ....) (see Appendix F, Table A3 and Table A4) did not change the meta-risks estimated with the classical meta-analysis approach (data not shown).
These results for long-term exposure converge with international meta-analysis (see results in Appendix G) which show positive correlation between PM2.5, PM10, NO2, exposures during the entire pregnancy and LBW. [94] Conversely, international studies tend to show significant association between LBW and ambient air pollutant also during short-term exposure.
These results could be partially explained by methodological limitations inherent in the heterogeneity of the method of exposure assessment, definition of adverse birth outcome, definition of confounders and critical windows of exposure, thus limiting the number of studies usable in the meta-analysis which can reduce the statistical significance of possible risk.
The main hypotheses for the biological mechanism are that ambient air pollution could cause inflammation, oxidative stress, affect placental growth, decrease placental exchange, lead to endocrine disruption, etc. [95,96]. More specifically, oxidative stress induces DNA damage and mitochondrial DNA damage, and fosters inflammation, which appear to be important mechanisms of fetal growth [83,97,98,99]. Another specific mechanism affects the placenta; the maternal and fetal circulation are separated by the placental barrier; this barrier contains placental transporters that can regulate or facilitate external compounds [100,101]. Transient receptor potential channels are highly expressed in the placenta, and they can be affected by air pollution exposure. Non-human animal studies reveal that these receptors play important roles in placental development and regulating the fetal–maternal interface in mice models [102].
5.2. Outcome Data: Case Selection
We identified many pathways whose outcome information can lead to a bias in the assessments of association. Firstly, outcome definition itself could constitute a source of uncertainty and lead to qualification bias. Many studies investigated birth weight [66,67,68,70,72,76,80,82,88,89] or gestational age [67], but most investigated specific pathological outcomes; first, several studies investigated LBW and subtypes (VLBW, ELBW): birth weight <2500 g International Classification of Diseases 10th Revision; ICD-10: P07.0–P07.1 [64,70,73,75,81,84], birth weight <3000 g [65], VLBW between 1500 g and 2500 g [83] and ELBW <1500 g [83]. Several studies investigated PTB and subtypes: birth occurring before the 37th week of pregnancy; ICD-10: P07.2–P07.3 [64,65,69,78,81,85,87,90,92,93] birth occurring between the 33th and the 37th week of pregnancy [79], birth occurring between the 22th and the 36th week of pregnancy [74], birth occurring between the 30th and the 37th week of pregnancy [77], birth occurring before the 33th week of pregnancy [79], birth occurring before the 30th week of pregnancy [77], birth occurring before the 24th week of pregnancy [87]. Last but not least, some studies investigated SGA: birth weight or length below the 10th percentile according to standard percentile charts for sex and gestational age in the population; ICD10 codes in medical records, O36.5, P05.0, P05.1 [68,70,75,82,91]. Databases were drawn mainly from birth certificate information and health database from hospital information systems while other from institutes of national health statistics and cohort database. In addition, the databases used to collect health data including maternal and newborn characteristics are another source of limitation. PTB and LBW were the most frequently investigated outcomes in included studies. This is an expected finding because, according to the WHO, these outcomes are technically simple parameters to monitor prenatal health in a population and have short- and long-term public health implications. Assessment of gestational duration was most often based on the date of last menstrual period, which could introduce misclassification with recall bias depending on postconceptional bleeding, but also, menstrual irregularities, or late access to prenatal care [70].
5.3. Confounding Factors
Our findings need to be interpreted with prudence due to weaknesses that could affect the significance of the associations and then the redaction of accurate conclusions. The different adjustment factors used in each study and the different sample size may lead to difficulties between studies comparisons.
Indeed, most studies were adjusted for mothers’ characteristics (smoking during pregnancy, passive smoking during pregnancy, parity, education, race/ethnicity, age, gestational age, height, pre-pregnancy weight, etc.) [64,66,67,68,69,70,71,72,73,74,75,76,78,79,80,82,83,85,86,87,88,89,90,93] Some studies used birth characteristics (sex, birth order, fetal size) [67,68,69,70,71,72,73,75,76,78,80,82,83,85,86,88,89,91,93]. Other used neighborhood characteristic (city, exposure to other air pollutants, socioeconomic status, type and length of roads, population density, land coverage around the home address, temporal variations in pollution during pregnancy…) [66,68,69,70,71,75,76,78,79,82,85,86,87,90,91,93] Some of them used other characteristics like meteorological characteristic (e.g., temperature, humidity, season of conception or birth) [64,65,67,68,69,70,71,72,74,75,76,78,79,80,81,82,83,84,85,86,87,88,89,91,92,93]. Only one study did not use any covariates [77].
5.4. Exposure Assessment
Our systematic review revealed that several approaches for exposure assessment during pregnancy were implemented, and this could induce misclassification of exposure. Some papers have used average from monitoring existing stations [64,65,74,77,81,84,87] or a monitoring station-based approach with an average from all monitoring stations [89,92]. The size of the study area and the number of monitoring stations vary between studies and this may increase the level of heterogeneity of air pollution measurement. The number of monitoring stations varied between a minimum of 1 [65,87] and a maximum of 53 [89]. Consequently, there is a risk of bias when a small number of monitoring stations cover a wide area. The weak spatial representativeness of exposure influences the assessment of the residential exposure of pregnant women. Moreover, collection of these data is often based on national air quality guidelines and legislation and thus may not be optimal in the assessment of exposure and use with health data.
Most of the studies used modeling-based approaches with, on the one hand, LUR [66,67,68,69,71,73,75,76,78,80,83,85,86], and on the other hand dispersion models [70,72,76,79,80,81,82,83,84,85,86,87,88,89,90,91]. Few studies use other models as spatial temporal interpolation method (Kriging method) [81] and SILAM model [93]. These models allow to quantify individual levels of exposure and investigate the health consequences of exposure.
Even if modelling is the gold standard for environmental and health impact assessment, some bias may exist. Overall modelling approaches did not consider residential and daily mobility of pregnant women across the study area and thus exposure misclassification may occur. Finally, environmental modelling can hardly be applied for outdoor and indoor pollution concurrently; notably because of a lack of information on the correlation of indoor and outdoor air pollution depends on geographical and meteorological conditions, building types and systems, and air exchange rates [103].
5.5. Critical Windows of Exposure
The definition of window of exposure could induce exposure misclassifications. In our systematic review, two main approaches define the window of exposure in order to investigate the relationship between birth outcomes and residential exposure: long-term exposure, and short-term exposure.
To investigate pollutant exposure, studies used diverse windows of exposure, some of them used short-term daily exposure [65,74,77] or short-term cumulative exposure [65,82,87]. For example, different indicators for daily exposure were identified: the day of the birth (Lag0) [65,74], the day before birth (Lag1) [74] or longer lags such as from lag 1 to lag7 [74,77], or from lag 1 to lag 30 [74] (see Table 4). The studies that investigated short-term cumulative exposure examined also different windows of exposure including over 1 days before birth (lag0–1) [65], over 2 days (Lag0–2) [65,87], 3 days (Lag0–3) [65], 4 days (Lag0–4) [65], 5 days (Lag 0–5) [65], over 6 days before death (Lag 0–6) [65] or for the last week of pregnancy (lag 0–7) [82]. Several studies used long-term exposure, based on cumulative exposure during a given period of pregnancy, with diverse windows [82,84,86,91], but most used weekly exposure [81,84,87,88,92], trimester of pregnancy exposure [64,67,68,69,70,71,72,73,75,76,80,82,83,85,89,91,92] and 9 months of pregnancy exposure [64,66,67,68,69,70,71,72,73,75,76,80,83,85,86,87,91,93]. Finally, some studies investigated with no specific windows and used annual exposure [78,79,90] (see Table 4). Previously, certain meta-analysis and systematic reviews have reported that 1st trimester, 3rd trimester and last gestational month may be a possible critical window of exposure for preterm birth [25].
5.6. Assessment Approach and Mean Level of Exposure
The results found in the studies selected may vary according to mean level of exposure in each country, and particularly in each area of study. Our systematic review reveals that the risk of adverse birth outcome tends to be higher among study areas with low air pollutant average concentration. However, we highlight that these studies used mainly monitoring station. Some studies tried to estimate the discrepancy between results in the association between air pollution and birth outcome with different methods for estimating exposure [104,105]. They found that the level of NO2 during pregnancy estimated by the nearest air quality monitoring station (AQMS) and by the temporally adjusted geostatistical model (TAG), tend to show the same associations [104,105]. For PM, the use of the nearest AQMS or dispersion models indicated consistent results both in terms of exposure estimates and association with birth weight [105]. Studies tend to show that AQMS and kriging rather predict the average level of pollutant in the urban area, whereas local patterns of variation and LUR might be the most robust methods to predict long-term exposure in complex areas [106]. In this way, pertinence of the method used for the exposure assessment mainly depends on the time-window length and endpoints considered, the spatio-temporal variability of the pollutants and the population’s mobility [76].
5.7. Limitations and Risk Estimate of Birth Outcome
The features of the studies described above—such as study population, study design, sample size, the classification and definition of infant death, exposure assessment, difference between interquartile (IQR) used to assess the increase of exposure (Appendix H) and confounding factors—could all, independently or in combination, affect the quality of each study itself and, also, their comparison in our systematic review. Some factors may overestimate while other one may underestimate the risk of birth outcome.
The loss of precision inherent to such a general classification scheme (the definition of outcome and included all live birth) may reduce the likelihood of detecting an association between low birth weight and the study exposures. For instance, broad groupings of low birth weight into all LBW including term and preterm birth have also hampered the ability to examine associations for specific LBW by diluting relevant cases.
One source of such limitation lies in the databases. Using linked birth-hospital databases may reduce the likelihood of missing information, because it includes all birth information collected throughout birth, rather than only from institutes of national health statistics and cohort databases. Missing data, if not included, may yield the same effect, so that risk estimates of birth outcome, in particular, may be inaccurate.
In addition, the various confounding factors included in the individual studies make difficult the comparisons between studies. An absence of systematic adjustment for commonly known factors may affect the measure of association and thus the comparisons of all the risk estimates—for instance, folic acid supplementation, or information on dietary factors which are known to decrease the risk of birth outcome. These risk factors tend to vary across the unit of analysis and if they are coincident with the exposure measures, then these spatial confounders will bias the results of the study.
Exposure misclassification may occur where the birth certificate address does not reflect the mother’s true residence during the relevant window of fetal development. To assign exposure, many studies used maternal address at delivery rather than address around conception and during each trimester. This can have a particular impact on studies exploring the risk of birth outcome. Misclassification of exposure may occur following changes in residence during the pregnancy. Some studies revealed that residential mobility among pregnant women between conception and delivery ranged from about 12% in the former to 32% according country. In addition, this residential mobility may vary according to certain individual and contextual characteristics such as age, race, socioeconomic status and other factors including socioeconomic characteristics. This means that the exposure misclassification error due to using delivery address might be greater among younger mothers than among older ones, a phenomenon that might result in confounding—because age is also associated with the risk of poor pregnancy outcome. Therefore, where authors have restricted their analysis to women who resided at the address noted on the medical record before delivery, a slight increase of risk estimate may be observed.
Finally, misclassification of exposure may result from the use of postcode, census block or city level to define the location of maternal residence. These spatial units might not be valid measures of exposure level because they vary considerably in size and are irregular in shape. Therefore, the larger the spatial unit, the more likely it is that bias will be introduced due to heterogeneity within these units, and ecological fallacy may result.
5.8. European Versus International Systematic Review: Comparison with Previous International Systematic Reviews
The limited systematic review of European studies may explain the result obtained. Appendix D summarizes the main characteristics and results of previous systematic review and meta-analysis studies selected to compare our results. Most of the earlier reviews were based on cohort design studies like our systematic review. However, all previous systematic review was based on mostly US studies. Similar methodological issues were identified by previous systematic review including outcome and difference in the characterization of exposure and outcome and control of confounding factors.
However, the European average concentration of air pollutants seems to be lower than international average concentrations, moreover the results found in the studies selected may vary according to mean level of exposure in each country, and particularly in each area study. Our results reveal that, in Europe-based studies, the risk of adverse birth outcome tends to be higher among study area with low air pollutant average concentration.
Our findings for long-term exposure converge with international meta-analysis (see results in Appendix D) which show a positive correlation between PM2.5, PM10, NO2, exposures during the entire pregnancy and LBW [94]. Conversely, international studies tend to show significant association between LBW and ambient air pollutant also during short-term exposure.
5.9. Limitations
To complement the limitations described earlier, both our systematic review and our meta-analysis, present their own strengths and limitations. First, our search could suffer from study selection biases. Non-English publications of relevant articles may have been ignored. Furthermore, we cannot exclude the possibility that our systematic review could be impacted by publication bias. Indeed, unpublished results (including grey literature and results not statistically significant, which are not available) may influence our meta-analysis findings towards the statistical significance of the risk estimates
6. Public Health Implication
To date the main inherent limitation of environmental health risk assessments is related to uncertainties of the assumptions made about the dose–response function. More particularly, the potential limitations of geographic extrapolation of the shape of the risk function may be less well-defined in some geographic areas with the lowest concentrations. In some studies, the authors used the exposure–response function from only one cohort US study [107] while the other one used meta-analysis as a source to estimate the burden [108]. To our knowledge no European meta-analysis permits us to provide a more appropriate source of risk function in order to perform HIAs in European countries with the lowest concentration levels. Thus, the burden could derive from a non-coherent shape risk function that carries larger uncertainties. Our meta-analysis results provide pooled-risk for 5 combinations of air pollutant and birth weight and PTB, which may provide a coherent exposure–response function for environmental health risk assessments in European countries.
7. Conclusions
In spite of the limited number of epidemiological studies selected in the present literature review, our finding suggests that an increase air pollution exposure during pregnancy might contribute to adverse birth outcomes, especially LBW. This body of evidence has limitations that impede the formulation of firm conclusions and so new well-focused European studies are called for.
Our findings need to be interpreted with prudence due to weaknesses that could affect the significance of the associations and hence the drawing of accurate conclusions. Further studies, well-focused on European countries, are called for to resolve these limitations; in particular, the definition of the exposure assessment, the critical windows of exposure and the different adverse birth outcomes, which could affect the strength of association. Future studies could be based on this analysis of limitations of the current body of research, which may provide inspiration for research agenda improvements.
Author Contributions
Conceptualization, V.S. and W.K.-T.; methodology, V.S. and W.K.-T.; software, V.S. and W.K.-T.; validation, W.K.-T., S.D. and C.E.; formal analysis, V.S. and W.K.-T.; investigation, V.S.; data curation, V.S.; writing—original draft preparation, V.S.; writing—review and editing, V.S.; visualization, V.S., W.K.-T., S.D. and C.E.; supervision, W.K.-T., S.D. and C.E.; funding acquisition, W.K.-T. and C.E. All authors have read and agreed to the published version of the manuscript.
Funding
Valentin SIMONCIC is a recipient of a doctoral grant from the Grand Est Region.
Acknowledgments
This work is supported by the Institute for Research in Public Health (Institut de Recherche en santé publique, IReSP).
Conflicts of Interest
The authors declare no conflict of interest
Appendix A

Figure A1.
Risk of birth outcome for air pollutant exposure during overall pregnancy.
Figure A1.
Risk of birth outcome for air pollutant exposure during overall pregnancy.

Appendix B

Figure A2.
Risk of birth outcome for air pollutant exposure during first trimester.
Figure A2.
Risk of birth outcome for air pollutant exposure during first trimester.

Appendix C

Figure A3.
Risk of birth outcome for air pollutant exposure during second trimester.
Figure A3.
Risk of birth outcome for air pollutant exposure during second trimester.

Appendix D

Figure A4.
Risk of birth outcome for air pollutant exposure during third trimester.
Figure A4.
Risk of birth outcome for air pollutant exposure during third trimester.

Appendix E
Table A1.
Sensitivity analysis: birth weight and NO2 exposure during the third trimester of pregnancy.
Table A1.
Sensitivity analysis: birth weight and NO2 exposure during the third trimester of pregnancy.
| Study Omitted | Beta | [95% Confidence Intervals] | |
|---|---|---|---|
| Aguilera et al., 2009 [67] | −4.29 | −16.48 | 7.60 |
| Ballester et al., 2010 [68] | −0.82 | −13.74 | 12.10 |
| Rahmalia et al., 2012 [72] | −1.63 | −13.18 | 9.92 |
| Schembari et al., 2015 [80] | −5.59 | −19.93 | 8.76 |
| Clemente et al., 2016 [83] | 2.55 | −9.18 | 14.30 |
| Pooled estimate | −1.95 | −14.50 | 10.54 |
Table A2.
Sensitivity analysis: birth weight and NO2 exposure during the whole pregnancy.
Table A2.
Sensitivity analysis: birth weight and NO2 exposure during the whole pregnancy.
| Study Omitted | Beta | [95% Confidence Intervals] | |
|---|---|---|---|
| Aguilera et al., 2009 [67] | −1.60 | −6.33 | 3.13 |
| Ballester et al., 2010 [68] | −1.05 | −5.83 | 3.73 |
| Clemente et al.; 2016 [83] | −0.72 | −5.44 | 3.99 |
| Rahmalia et al., 2012 [72] | −1.47 | −6.18 | 3.25 |
| Schembari et al., 2015 [80] | −1.79 | −6.57 | 2.98 |
| Pedersen et al., 2013 [73] | −4.26 | −17.69 | 9.16 |
| Pooled estimate | −1.81 | −8.01 | 4.37 |
Appendix F
Text. Quality effect model methods
Individual quality assessment methodology was adapted from Croteau et al. in 2009 and doi and Thalib in 2008. The checklist was defined by researcher consensus. It assigned a maximum of 1.00 point for the different methodological criteria and a quality score (Qi = )) is calculated for each study included in the meta-analysis.
Ten criteria are defined as follows:
- 1-
- Sample size(1): completely satisfactory/justified by power analysis; (0.5): somewhat satisfactory; (0): not sufficient/not justified.
- 2-
- Design(1): cohort; (0.75): case-crossover; case-control; (0.5): ecological; time series
- 3-
- Country where the study was carried out(1): With good working and living conditions/high socio-economic standard; (0.5): Difficult conditions/lower socio-economic standard; (0.25): Very difficult conditions/very low socio-economic standard; (0): Not reported.(1: USA, UK, Sweden, Latin America; 0.5: China)
- 4-
- Timeframe(1): Reported; (0): Not reported.
- 5-
- Geocodage rate(1): ≥80%/considerable part of the population; (0.75): Not reported.
- 6-
- Definition of infant death(1): infant death excluding death due to accident and external causes or specific cause death; (0.75): death among singleton birth or among term birth; (0.5): overall death.
- 7-
- Assessment of infant death(1): valid database; (0.5): self-report; (0): not specified.
- 8-
- Assessment of the exposure(1): individual measure; (0.75): fine spatial level (zip code, municipality, ward level) (0.5): country level
- 9-
- Adjustments for covariates (cov)(1): At least 1 (cov) in each of the three covariates (baby’s characteristic, mother’s characteristics, or meteorological condition), (0.75): At least 1 (cov) baby’s characteristic and at least 1 (cov) mother’s characteristic (or meteorological condition); 0.5): At least 1 (cov) in meteorological condition; (0): no covariates
- 10-
- Effect size calculation for meta-analysis based on odds ratios(1): no transformations and no data imputation; (0.75): mild transformation and no data imputation; (0.5): several transformations and no data imputation; (0.25): considerable transformations and data imputation
Table A3.
Qualitative analysis (part 1).
Table A3.
Qualitative analysis (part 1).
| Auteurs | Aguilera et al., 2009 [67] | Ballester et al., 2010, [68] | Clemente et al., 2016). [83] | Pedersen et al., 2013 [73] | Rahmalia et al., 2012, [72] | Schembari et al., 2015 [80] |
|---|---|---|---|---|---|---|
| Population size | 570 (1) | 785 (1) | 376 (1) | 74,178 (1) | 1154 (1) | 9067 (1) |
| Study design, period location, | cohort (1) | cohort (1) | cohort (1) | Cohort (1) | Cohort (1) | Cohort (1) |
| Country | Sabadel, Spain (1) | Valencia, Spain (1) | Spain, Belgium (1) | European country (1) | Poitiers, Nancy, France (1) | England (1) |
| Timeframe | 2004–2006 (1) | 2004–2005 (1) | 2004–2008, 2010–2013 (1) | 1994–2011 (1) | 2003–2006 (1) | 2007–2010 (1) |
| Monitoring station or model | LUR model, passive samplers and fix monitoring station (1) | Land-use regression model, kriging interpolation model and monitoring station (1) | land use regression and kriging interpolation Method (1) | LUR and monitoring station (1) | Dispersion model implemented in ADMS-Urban software. (1) | LUR models and monitoring station (1) |
| Assessment of birthweight | recorded by specially trained midwives at delivery (1) | recorded by specially trained midwives at delivery (1) | recorded by specially trained midwives at delivery (1) | recorded by specially trained midwives at delivery and self-report (0.5) | recorded by specially trained midwives at delivery (1) | recorded by specially trained midwives at delivery (1) |
| Adjustments for personal covariates |
|
|
|
|
|
|
| exposure level | Individual level (1) | Individual level (1) | Individual level (1) | Individual level (1) | Individual level (1) | Individual level (1) |
| Geocodage rate | Not reported (0.75) | Not reported (0.75) | Not reported (0.75) | Not reported (0.75) | Not reported (0.75) | Not reported (0.75) |
| Quality index (Qi) | 0.972 | 0.972 | 0.972 | 0.806 | 0.972 | 0.972 |
Table A4.
Qualitative analysis (part 2).
Table A4.
Qualitative analysis (part 2).
| Auteurs | Estarlich et al., 2016, [85] | Giorgis-Allemand et al., 2016, [86] | Maroziene and Grazuleviciene, 2002, [64] | Siddika et al., 2019, [93] |
|---|---|---|---|---|
| Population size | 2409 (1) | 71,493 (1) | 3988 (1) | 2568 (1) |
| Study design, period location, | cohort (1) | cohort (1) | cohort (1) | cohort (1) |
| Country | Asturias, Gipuzkoa, Sabadell and Valencia, Spain (1) | 11 European countries (1) | Kaunas, Lithuania (1) | Espoo, Finland (1) |
| Timeframe | 2003–2008 (1) | 1994–2001 (1) | 1998 (1) | 1984–1990 (1) |
| Monitoring station or model | LUR and monitoring station (1) | LUR and monitoring station (1) | 12 municipal monitoring sites, one in each residential district (0.5) | integrated modelling of atmospheric composition (SILAM) (1) |
| Assessment of birthweight | Medical data and Self-report (0.5) | Medical data and Self-report (0.5) | valid database (1) | valid database (1) |
| Adjustments for personal covariates |
|
|
|
|
| exposure level | Individual level (1) | Individual level (1) | Residential district (0.75) | Individual level (1) |
| Geocodage rate | Not reported (0.75) | Not reported (0.75) | Not reported (0.75) | Not reported (0.75) |
| Quality index (Qi) | 0.917 | 0.917 | 0.889 | 0.972 |
Appendix G
Table A5.
Meta-analysis comparison.
Table A5.
Meta-analysis comparison.
| First Author | Number of Study Included | Main Location | Main Design | Main Exposure Assessment | Pollutant | Outcomes | ||
|---|---|---|---|---|---|---|---|---|
| PTB OR (95%CI) | BW Beta (95%CI) | LBW OR (95%CI) | ||||||
| Li et al., 2017 [56] | 23 | USA | cohort design | ground-based monitoring data | PM10 | NA | NA | NA |
| PM2.5 | 1T 1.03 (1.00, 1.06) | NA | 1T 1.00 (0.91, 1.11) | |||||
| 2T 1.01 (0.93, 1.10) | 2T 1.00 (0.96, 1.03) | |||||||
| 3T 1.02 (0.99, 1.04) | 3T 1.03 (0.98, 1.09) | |||||||
| EP 1.02 (0.93, 1.12) | EP 1.05 (0.98, 1.12) | |||||||
| EP (IQR) 1.03 (1.01, 1.05) | EP (IQR) 1.03 (1.02, 1.03) | |||||||
| NO2 | NA | NA | NA | |||||
| Stieb et al., 2012 [32] | 61 | North America | cohort design | central site monitoring data | PM10 | 1T 0.97 (0.87, 1.07) | 1T −3.92 (−8.97, 1.13) | 1T 1.03 (0.95, 1.11) |
| 2T 0.95 (0.91, 0.99) | 2T −3.40 (−7.22, 0.43) | 2T 1.02 (0.96, 1.09) | ||||||
| 3T 1.06 (1.03, 1.11) | 3T −4.20 (−14.27, 5.86) | 3T 1.01 (0.97, 1.06) | ||||||
| EP 1.35 (0.97, 1.90) | EP −16.77 (−20.23, −13.31) | EP 1.10 (1.05, 1.15) | ||||||
| PM2.5 | 1T 0.85 (0.60, 1.20) 3T 1.05 (0.98, 1.13) EP 1.16 (1.07, 1.26) | 1T −0.30 (−9.85, 9.25) 2T −14.66 (−34.01, 4.70) 3T −18.05 (–37.43, 1.34) EP−23,44 (−45.50, −1.38) | EP 1.05 (0.99, 1.12) | |||||
| NO2 | 1T 0.87 (0.64, 1.17) 3T 1.06 (0.96, 1.18) EP 1.16 (0.83, 1.63) | 1T −4.18 (−19, 10.82) 2T 0.85 (−1.27, 2.97) 3T −7.89 (−29.04, 13.25) EP −28.13 (−44.81, −11.45) | 1T 1.03 (0.99, 1.14) 2T 1.04 (1.01, 1.08) 3T 0.98 (0.87, 1.10) EP 1.05 (1.00, 1.09) | |||||
| Klepac et al., 2018 [26] | 48 | North America | cohort design | routine monitoring data | PM10 | 1T 1.04(1.01, 1.08) | NA | NA |
| 2T 1.04 (0.98, 1.09) | ||||||||
| 3T 1.00 (0.99, 1.00) | ||||||||
| 1M 1.05 (0.90, 1.24) | ||||||||
| LM 1.01 (0.99, 1.03) | ||||||||
| EP 1.09 (1.03, 1.16) | ||||||||
| PM2.5 | 1T 1.03 (0.95, 1.11) | NA | NA | |||||
| 2T 1.10 (0.96, 1.27) | ||||||||
| 3T 1.05 (1.02, 1.09) | ||||||||
| 1M 1.04 (0.91, 1.19) | ||||||||
| LM 1.04 (0.98, 1.10) | ||||||||
| EP 1.24 (1.08, 1.41) | ||||||||
| NO2 | 1T 0.99 (1.95, 1.03) | NA | NA | |||||
| 2T 1.02 (0.97, 1.08) | ||||||||
| 3T 1.02 (0.96, 1.08) | ||||||||
| 1M 0.91 (0.80, 1.04) | ||||||||
| LM 1.03 (1.00, 1.05) | ||||||||
| EP 1.05 (0.99, 1.11) | ||||||||
PM10 and PM2.5: per 10 mg/m3 increment and 20 mg/m3 increment (depending on study) NO2 per 10 ppb increment, OR: odds ratio, PTB: preterm birth, BW: birthweight, LBW: low birth weight, PM: particulate matter; PM10: particulate matter with an aerodynamic diameter up to 10 μm; PM2.5: particulate matter with an aerodynamic diameter up to 2.5 μm; NO2: nitrogen, 1T: first trimester, 2T: second trimester, 3T: third trimester, 1M: first month, LM: last month, EP: entire pregnancy.
Appendix H
Table A6.
Interquartile range (IQR) table for NO2 exposure (µg/m3).
Table A6.
Interquartile range (IQR) table for NO2 exposure (µg/m3).
| Studies | First Trimester IQR | Second Trimester IQR | Third Trimester IQR | Whole Pregnancy IQR |
|---|---|---|---|---|
| Aguilera et al., 2009 [67] | 12.27 | 12 | 12.47 | 9.51 |
| Ballester et al., 2010 [68] | 10 | 10 | 10 | 10 |
| Rahmalia et al., 2012 [72] | 10 | 10 | 10 | 10 |
| Schembari et al., 2015 [80] | NA | NA | 10 | 10 |
| Clemente et al., 2016 [83] | 10 | 10 | 10 | 10 |
| Estarlich et al., 2016, [85] | 10 | 10 | 10 | 10 |
| Maroziene and Grazuleviciene, 2002 [64] | 10 | 10 | 10 | 10 |
| Giorgis-Allemand et al., 2016 [86] | 10 | 10 | NA | 10 |
| Siddika et al., 2019 [93] | NA | NA | NA | 18.8 |
| Dadvand et al., 2014 [75] | 20.5 | 19.9 | 18.7 | 16.8 |
| Pedersen et al., 2013 [73] | NA | NA | NA | 10 |
| Mariet et al., 2018 [91] | 10 | 10 | 10 | 10 |
Table A7.
IQR table for PM10 exposure (µg/m3).
Table A7.
IQR table for PM10 exposure (µg/m3).
| Studies | First Trimester IQR | Second Trimester IQR | Third Trimester IQR | Whole Pregnancy IQR |
|---|---|---|---|---|
| Rahmalia et al., 2012 [72] | 10 | 10 | 10 | 10 |
| Schembari et al., 2015 [80] | NA | NA | 10 | 10 |
| Giorgis-Allemand et al., 2016 [86] | 10 | 10 | NA | 10 |
| Siddika et al., 2019 [93] | NA | NA | NA | 10 |
| Dadvand et al., 2014 [75] | 5.7 | 5.6 | 5.2 | 3.9 |
| Pedersen et al., 2013 [73] | NA | NA | NA | 10 |
| Giovannini et al., 2017, [89] | 10 | 10 | 10 | NA |
Table A8.
IQR table for PM2.5 exposure (µg/m3).
Table A8.
IQR table for PM2.5 exposure (µg/m3).
| Studies | First Trimester IQR | Second Trimester IQR | Third Trimester IQR | Whole Pregnancy IQR |
|---|---|---|---|---|
| Schembari et al., 2015 [80] | NA | NA | 5 | 5 |
| Giorgis-Allemand et al., 2016 [86] | 5 | 5 | NA | 5 |
| Siddika et al., 2019 [93] | NA | NA | NA | 10 |
| Dadvand et al., 2014 [75] | 3.4 | 3.4 | 3.1 | 2.3 |
| Pedersen et al., 2013 [73] | NA | NA | NA | 5 |
References
- WHO. WHA Global Nutrition Targets 2025: Low Birth Weight Policy Brief. Available online: https://www.who.int/nutrition/topics/globaltargets_lowbirthweight_policybrief.pdf (accessed on 24 April 2020).
- Beck, S.; Wojdyla, D.; Say, L.; Bertran, A.P.; Merialdi, M.; Requejo, J.H.; Rubens, C.; Menon, R.; Van Look, P.F.A. The worldwide incidence of preterm birth: A systematic review of maternal mortality and morbidity. Bull. World Healthy Organ. 2010, 88, 31–38. [Google Scholar] [CrossRef] [PubMed]
- Lawn, J.E.; Cousens, S.N.; Darmstadt, G.L.; Bhutta, Z.A.; Martines, J.; Paul, V.; Knippenberg, R.; Fogstad, H. 1 year after The Lancet Neonatal Survival Series—Was the call for action heard? Lancet 2006, 367, 1541–1547. [Google Scholar] [CrossRef]
- Goldenberg, R.L.; Culhane, J.F.; Iams, J.D.; Romero, R. Epidemiology and causes of preterm birth. Lancet 2008, 371, 75–84. [Google Scholar] [CrossRef]
- Euro-Peristat Project. European Perinatal Health Report. Core Indicators of the Health and Care of Pregnant Women and Babies in Europe in 2015. November 2018. Available online: www.europeristat.com (accessed on 15 April 2020).
- WHO. Preterm Birth. Available online: https://www.who.int/news-room/fact-sheets/detail/preterm-birth (accessed on 23 April 2020).
- World Health Organization. International Classification of Diseases and Related Health Problems, 10th ed.; World Health Organization: Geneva, Switzerland, 1992. [Google Scholar]
- Huddy, C.L.J. Educational and behavioural problems in babies of 32–35 weeks gestation. Arch. Dis. Child.-Fetal Neonatal Ed. 2001, 85, F23–F28. [Google Scholar] [CrossRef]
- Wang, M.L.; Dorer, D.J.; Fleming, M.P.; Catlin, E.A. Clinical Outcomes of Near-Term Infants. Pediatrics 2004, 114, 372–376. [Google Scholar] [CrossRef] [PubMed]
- Risnes, K.R.; Vatten, L.J.; Baker, J.L.; Jameson, K.; Sovio, U.; Kajantie, E.; Osler, M.; Morley, R.; Jokela, M.; Painter, R.C.; et al. Birthweight and mortality in adulthood: A systematic review and meta-analysis. Int. J. Epidemiol. 2011, 40, 647–661. [Google Scholar] [CrossRef]
- Barker, D. The Developmental Origins of Adult Disease. J. Am. Coll. Nutr. 2004, 23, 588S–595S. [Google Scholar] [CrossRef]
- Gopinath, B.; Baur, L.A.; Wang, J.J.; Teber, E.; Liew, G.; Cheung, N.; Wong, T.Y.; Mitchell, P. Smaller Birth Size is Associated with Narrower Retinal Arterioles in Early Adolescence. Microcirculation 2010, 17, 660–668. [Google Scholar] [CrossRef]
- Howson, C.P.; the Born Too Soon Preterm Birth Action Group; Kinney, M.V.; McDougall, L.; Lawn, J.E. Born Too Soon: Preterm birth matters. Reprod. Healthy 2013, 10, S1. [Google Scholar] [CrossRef]
- Mathewson, K.J.; Chow, C.H.T.; Dobson, K.G.; Pope, E.I.; Schmidt, L.A.; Van Lieshout, R.J. Mental health of extremely low birth weight survivors: A systematic review and meta-analysis. Psychol. Bull. 2017, 143, 347–383. [Google Scholar] [CrossRef]
- Osmond, C.; Barker, D.J. Fetal, infant, and childhood growth are predictors of coronary heart disease, diabetes, and hypertension in adult men and women. Environ. Healthy Perspect. 2000, 108, 545–553. [Google Scholar] [CrossRef]
- Wilcox, A. On the importance—And the unimportance—Of birthweight. Int. J. Epidemiol. 2001, 30, 1233–1241. [Google Scholar] [CrossRef]
- Institute of Medicine (US) Committee on Understanding Premature Birth and Assuring Healthy Outcomes. Preterm Birth: Causes, Consequences, and Prevention; Behrman, R.E., Butler, A.S., Eds.; National Academies Press: Washington, DC, USA, 2007; p. 11622. ISBN 978-0-309-10159-2. [Google Scholar]
- Van Lieshout, R.J.; Boyle, M.H.; Saigal, S.; Morrison, K.; Schmidt, L.A. Mental Health of Extremely Low Birth Weight Survivors in Their 30s. Pediatrics 2015, 135, 452–459. [Google Scholar] [CrossRef]
- Lawn, J.E.; the GAPPS Review Group; Gravett, M.G.; Nunes, T.M.; Rubens, C.E.; Stanton, C. Global report on preterm birth and stillbirth (1 of 7): Definitions, description of the burden and opportunities to improve data. BMC Pregnancy Childbirth 2010, 10, S1. [Google Scholar] [CrossRef]
- Petrou, S. The economic consequences of preterm birth duringthe first 10 years of life. BJOG: Int. J. Obstet. Gynaecol. 2005, 112, 10–15. [Google Scholar] [CrossRef]
- Petrou, S.; Mehta, Z.; Hockley, C.; Cook-Mozaffari, P.; Henderson, J.; Goldacre, M. The Impact of Preterm Birth on Hospital Inpatient Admissions and Costs During the First 5 Years of Life. Pediatrics 2003, 112, 1290–1297. [Google Scholar] [CrossRef]
- Saigal, S.; Doyle, L.W. An overview of mortality and sequelae of preterm birth from infancy to adulthood. Lancet 2008, 371, 261–269. [Google Scholar] [CrossRef]
- Niebler, A.; Mader, S.; Merialdi, M.; Keller, M. European Foundation for the Care of Newborn Infants. Too Little, Too Late? Why Europe Should Do More for Preterm Infants; EU Benchmarking Report 2009/2010; European Foundation for the Care of Newborn Infants: Munich, Germany, 2010. [Google Scholar]
- Bibby, E.; Stewart, A. The epidemiology of preterm birth. Neuro Endocrinol. Lett. 2004, 1, 43–47. [Google Scholar]
- Du, M.-K.; Ge, L.-Y.; Zhou, M.-L.; Ying, J.; Qu, F.; Dong, M.-Y.; Chen, D.-Q. Effects of pre-pregnancy body mass index and gestational weight gain on neonatal birth weight* #. J. Zhejiang Univ. Sci. B 2017, 18, 263–271. [Google Scholar] [CrossRef]
- Klepac, P.; Locatelli, I.; Korošec, S.; Künzli, N.; Kukec, A. Ambient air pollution and pregnancy outcomes: A comprehensive review and identification of environmental public health challenges. Environ. Res. 2018, 167, 144–159. [Google Scholar] [CrossRef] [PubMed]
- Bonzini, M.; Carugno, M.; Grillo, P.; Mensi, C.; Bertazzi, P.A.; Pesatori, A.C. Impact of ambient air pollution on birth outcomes: Systematic review of the current evidences. La Med. Lav. 2010, 101, 341–363. [Google Scholar]
- Dadvand, P.; Parker, J.; Bell, M.L.; Bonzini, M.; Brauer, M.; Darrow, L.A.; Gehring, U.; Glinianaia, S.V.; Gouveia, N.; Ha, E.-H.; et al. Maternal Exposure to Particulate Air Pollution and Term Birth Weight: A Multi-Country Evaluation of Effect and Heterogeneity. Environ. Healthy Perspect. 2013, 121, 267–373. [Google Scholar] [CrossRef]
- Polichetti, G.; Capone, D.; Grigoropoulos, K.; Tarantino, G.; Nunziata, A.; Gentile, A. Effects of Ambient Air Pollution on Birth Outcomes: An Overview. Crit. Rev. Environ. Sci. Technol. 2013, 43, 752–774. [Google Scholar] [CrossRef]
- Lu, C.; Zhang, W.; Zheng, X.; Sun, J.; Chen, L.; Deng, Q. Combined effects of ambient air pollution and home environmental factors on low birth weight. Chemosphere 2020, 240, 124836. [Google Scholar] [CrossRef]
- Sapkota, A.; Chelikowsky, A.P.; Nachman, K.E.; Cohen, A.J.; Ritz, B. Exposure to particulate matter and adverse birth outcomes: A comprehensive review and meta-analysis. Air Qual. Atmosphere Healthy 2010, 5, 369–381. [Google Scholar] [CrossRef]
- Stieb, D.M.; Chen, L.; Eshoul, M.; Judek, S. Ambient air pollution, birth weight and preterm birth: A systematic review and meta-analysis. Environ. Res. 2012, 117, 100–111. [Google Scholar] [CrossRef]
- Zhu, X.; Liu, Y.; Chen, Y.; Yao, C.; Che, Z.; Cao, J. Maternal exposure to fine particulate matter (PM2.5) and pregnancy outcomes: A meta-analysis. Environ. Sci. Pollut. Res. 2014, 22, 3383–3396. [Google Scholar] [CrossRef]
- Selevan, S.G.; Kimmel, C.A.; Mendola, P. Identifying critical windows of exposure for children’s health. Environ. Healthy Perspect. 2000, 108, 451–455. [Google Scholar] [CrossRef]
- Sram, R.J.; Binková, B.; Rössner, P.; Rubeš, J.; Topinka, J.; Dejmek, J. Adverse reproductive outcomes from exposure to environmental mutagens. Mutat. Res. Mol. Mech. Mutagen. 1999, 428, 203–215. [Google Scholar] [CrossRef]
- Šrám, R.J.; Binková, B.; Dejmek, J.; Bobak, M. Ambient Air Pollution and Pregnancy Outcomes: A Review of the Literature. Environ. Healthy Perspect. 2005, 113, 375–382. [Google Scholar] [CrossRef]
- Glinianaia, S.V.; Rankin, J.; Bell, R.; Pless-Mulloli, T.; Howel, D. Particulate Air Pollution and Fetal Health. Epidemiol. 2004, 15, 36–45. [Google Scholar] [CrossRef]
- Joss, M.K.; Eeftens, M.; Gintowt, E.; Kappeler, R.; Künzli, N. Time to harmonize national ambient air quality standards. Int. J. Public Healthy 2017, 62, 453–462. [Google Scholar] [CrossRef]
- Resolution WHA65.6. Comprehensive Implementation Plan on Maternal, Infant and Young Child Nutrition. In Sixty-fifth World Health Assembly Geneva, 21–26 May 2012. Resolutions and Decisions, Annexes; World Health Organization: Geneva, Switzerland, 2012; pp. 12–13. Available online: http://www.who.int/nutrition/topics/WHA65.6_resolution_en.pdf?ua=1 (accessed on 18 April 2020).
- Hooper, L.G.; Kaufman, J.D. Ambient Air Pollution and Clinical Implications for Susceptible Populations. Ann. Am. Thorac. Soc. 2018, 15, S64–S68. [Google Scholar] [CrossRef] [PubMed]
- Schraufnagel, D.E.; Balmes, J.R.; De Matteis, S.; Hoffman, B.; Kim, W.J.; Perez-Padilla, R.; Rice, M.; Sood, A.; Vanker, A.; Wuebbles, D.J. Health Benefits of Air Pollution Reduction. Ann. Am. Thorac. Soc. 2019, 16, 1478–1487. [Google Scholar] [CrossRef] [PubMed]
- Environmental Protection Agency. The Benefits and Costs of the Clean Air Act from 1990 to 2020: Summary Report; Environmental Protection Agency: Washington, DC, USA, 1990; p. 35.
- Hasunuma, H.; Ishimaru, Y.; Yoda, Y.; Shima, M. Decline of ambient air pollution levels due to measures to control automobile emissions and effects on the prevalence of respiratory and allergic disorders among children in Japan. Environ. Res. 2014, 131, 111–118. [Google Scholar] [CrossRef]
- WHO. Quantification of the Health Effects of Exposure to Air Pollution—Report of a WHO Working Group. European Centre or Environment and Health; WHO: Bilthoven, The Netherlands, 2000; p. 34. [Google Scholar]
- SPF Air Pollution and Health: A European Information System (APHEIS) Health Impact Assessment of Air Pollution in 26 European Cities Second-Year Report. 2000–2001. Available online: /determinants-de-sante/pollution-et-sante/air/air-pollution-and-health-a-european-information-system-apheis-health-impact-assessment-of-air-pollution-in-26-european-cities-second-year-repor (accessed on 22 August 2020).
- Health Impact Assessment. Available online: https://www.who.int/westernpacific/health-topics/health-impact-assessment (accessed on 22 August 2020).
- Ostro, B. Outdoor Air Pollution: Assessing the Environmental Burden of Disease at National and Local Levels; World Health Organization: Geneva, Switzerland, 2004; ISBN 978-92-4-159146-1. [Google Scholar]
- Kihal-Talantikite, W.; Marchetta, G.P.; Deguen, S. Infant Mortality Related to NO2 and PM Exposure: Systematic Review and Meta-Analysis. Int. J. Environ. Res. Public Healthy 2020, 17, 2623. [Google Scholar] [CrossRef] [PubMed]
- Schwartz, J. Assessing confounding, effect modification, and thresholds in the association between ambient particles and daily deaths. Environ. Healthy Perspect. 2000, 108, 563–568. [Google Scholar] [CrossRef]
- Daniels, M.J.; Dominici, F.; Samet, J.M.; Zeger, S.L. Estimating particulate matter-mortality dose-response curves and threshold levels: An analysis of daily time-series for the 20 largest US cities. Am. J. Epidemiol. 2000, 152, 397–406. [Google Scholar] [CrossRef]
- Guo, T.; Wang, Y.; Zhang, H.; Zhang, Y.; Zhao, J.; Wang, Q.; Shen, H.; Wang, Y.; Xie, X.; Wang, L.; et al. The association between ambient PM2.5 exposure and the risk of preterm birth in China: A retrospective cohort study. Sci. Total. Environ. 2018, 633, 1453–1459. [Google Scholar] [CrossRef]
- Pedersen, M.; Stayner, L.; Slama, R.; Sørensen, M.; Figueras, F.; Nieuwenhuijsen, M.J.; Raaschou-Nielsen, O.; Dadvand, P. Ambient Air Pollution and Pregnancy-Induced Hypertensive Disorders. Hypertension 2014, 64, 494–500. [Google Scholar] [CrossRef]
- Vrijheid, M.; Martinez, D.; Manzanares, S.; Dadvand, P.; Schembari, A.; Rankin, J.; Nieuwenhuijsen, M. Ambient Air Pollution and Risk of Congenital Anomalies: A Systematic Review and Meta-analysis. Environ. Healthy Perspect. 2011, 119, 598–606. [Google Scholar] [CrossRef]
- Shah, P.S.; Balkhair, T. Air pollution and birth outcomes: A systematic review. Environ. Int. 2011, 37, 498–516. [Google Scholar] [CrossRef]
- Jacobs, M.; Zhang, G.; Chen, S.; Mullins, B.; Bell, M.; Jin, L.; Guo, Y.; Huxley, R.; Pereira, G. The association between ambient air pollution and selected adverse pregnancy outcomes in China: A systematic review. Sci. Total. Environ. 2017, 579, 1179–1192. [Google Scholar] [CrossRef]
- Li, X.; Huang, S.; Jiao, A.; Yang, X.; Yun, J.; Wang, Y.; Xue, X.; Chu, Y.; Liu, F.; Liu, Y.; et al. Association between ambient fine particulate matter and preterm birth or term low birth weight: An updated systematic review and meta-analysis. Environ. Pollut. 2017, 227, 596–605. [Google Scholar] [CrossRef]
- Yuan, L.; Zhang, Y.; Gao, Y.; Tian, Y. Maternal fine particulate matter (PM2.5) exposure and adverse birth outcomes: An updated systematic review based on cohort studies. Environ. Sci. Pollut. Res. 2019, 26, 13963–13983. [Google Scholar] [CrossRef] [PubMed]
- Liu, C.; Sun, J.; Liu, Y.; Liang, H.; Wang, M.; Wang, C.; Shi, T. Different exposure levels of fine particulate matter and preterm birth: A meta-analysis based on cohort studies. Environ. Sci. Pollut. Res. 2017, 24, 17976–17984. [Google Scholar] [CrossRef]
- Kheirbek, I.; Haney, J.; Douglas, S.; Ito, K.; Matte, T. The contribution of motor vehicle emissions to ambient fine particulate matter public health impacts in New York City: A health burden assessment. Environ. Healthy 2016, 15, 1–14. [Google Scholar] [CrossRef]
- AirParif. Surveillance et information sur la qualité de l’air à Paris en; AirParif: Paris, France, 2016. [Google Scholar]
- Li, W.; Cao, Y.; Li, R.; Ma, X.; Chen, J.; Wu, Z.; Xu, Q. The spatial variation in the effects of air pollution on cardiovascular mortality in Beijing, China. J. Expo. Sci. Environ. Epidemiol. 2018, 28, 297–304. [Google Scholar] [CrossRef]
- Esplugues, A.; Ballester, F.; Estarlich, M.; Llop, S.; Fuentes, V.; Mantilla, E.; Íñiguez, C. Indoor and outdoor concentrations and determinants of NO2 in a cohort of 1-year-old children in Valencia, Spain. Indoor Air 2010, 20, 213–223. [Google Scholar] [CrossRef]
- Liberati, A.; Altman, D.G.; Tetzlaff, J.; Mulrow, C.; Gøtzsche, P.C.; Ioannidis, J.P.A.; Clarke, M.; Devereaux, P.J.; Kleijnen, J.; Moher, D. The PRISMA statement for reporting systematic reviews and meta-analyses of studies that evaluate healthcare interventions: Explanation and elaboration. BMJ 2009, 339, b2700. [Google Scholar] [CrossRef]
- Maroziene, L.; Grazuleviciene, R. Maternal exposure to low-level air pollution and pregnancy outcomes: A population-based study. Environ. Healthy 2002, 1, 6. [Google Scholar] [CrossRef]
- Lee, S.J.; Hajat, S.; Steer, P.J.; Filippi, V. A time-series analysis of any short-term effects of meteorological and air pollution factors on preterm births in London, UK. Environ. Res. 2008, 106, 185–194. [Google Scholar] [CrossRef]
- Slama, R.; Morgenstern, V.; Cyrys, J.; Zutavern, A.; Herbarth, O.; Wichmann, H.-E.; Heinrich, J.; the LISA Study Group. Traffic-Related Atmospheric Pollutants Levels during Pregnancy and Offspring’s Term Birth Weight: A Study Relying on a Land-Use Regression Exposure Model. Environ. Healthy Perspect. 2007, 115, 1283–1292. [Google Scholar] [CrossRef] [PubMed]
- Aguilera, I.; Guxens, M.; García-Esteban, R.; Corbella, T.; Nieuwenhuijsen, M.J.; Foradada, C.M.; Sunyer, J. Association between GIS-Based Exposure to Urban Air Pollution during Pregnancy and Birth Weight in the INMA Sabadell Cohort. Environ. Healthy Perspect. 2009, 117, 1322–1327. [Google Scholar] [CrossRef] [PubMed]
- Ballester, F.; Estarlich, M.; Iñiguez, C.; Llop, S.; Ramón, R.; Esplugues, A.; Lacasaña, M.; Rebagliato, M. Air pollution exposure during pregnancy and reduced birth size: A prospective birth cohort study in Valencia, Spain. Environ. Healthy 2010, 9, 6. [Google Scholar] [CrossRef]
- Llop, S.; Ballester, F.; Estarlich, M.; Esplugues, A.; Rebagliato, M.; Iñiguez, C. Preterm birth and exposure to air pollutants during pregnancy. Environ. Res. 2010, 110, 778–785. [Google Scholar] [CrossRef]
- Madsen, C.; Gehring, U.; Walker, S.E.; Brunekreef, B.; Stigum, H.; Næss, Ø.; Nafstad, P. Ambient air pollution exposure, residential mobility and term birth weight in Oslo, Norway. Environ. Res. 2010, 110, 363–371. [Google Scholar] [CrossRef]
- Estarlich, M.; Ballester, F.; Aguilera, I.; García-Castro, L.; Lertxundi, A.; Llop, S.; Freire, C.; Tardón, A.; Basterrechea, M.; Sunyer, J.; et al. Residential Exposure to Outdoor Air Pollution during Pregnancy and Anthropometric Measures at Birth in a Multicenter Cohort in Spain. Environ. Healthy Perspect. 2011, 119, 1333–1338. [Google Scholar] [CrossRef]
- Rahmalia, A.; Giorgis-Allemand, L.; Lepeule, J.; Philippat, C.; Galineau, J.; Hulin, A.; Charles, M.-A.; Slama, R. Pregnancy exposure to atmospheric pollutants and placental weight: An approach relying on a dispersion model. Environ. Int. 2012, 48, 47–55. [Google Scholar] [CrossRef] [PubMed]
- Pedersen, M.; Giorgis-Allemand, L.; Bernard, C.; Aguilera, I.; Andersen, A.-M.N.; Ballester, F.; Beelen, R.M.J.; Chatzi, L.; Cirach, M.; Danileviciute, A.; et al. Ambient air pollution and low birthweight: A European cohort study (ESCAPE). Lancet Respir. Med. 2013, 1, 695–704. [Google Scholar] [CrossRef]
- Schifano, P.; Lallo, A.; Asta, F.; De Sario, M.; Davoli, M.; Michelozzi, P. Effect of ambient temperature and air pollutants on the risk of preterm birth, Rome 2001–2010. Environ. Int. 2013, 61, 77–87. [Google Scholar] [CrossRef]
- Dadvand, P.; Ostro, B.; Figueras, F.; Foraster, M.; Basagaña, X.; Valentín, A.; Martinez, D.; Beelen, R.; Cirach, M.; Hoek, G.; et al. Residential Proximity to Major Roads and Term Low Birth Weight. Epidemiology 2014, 25, 518–525. [Google Scholar] [CrossRef]
- Sellier, Y.; Galineau, J.; Hulin, A.; Caini, F.; Marquis, N.; Navel, V.; Bottagisi, S.; Giorgis-Allemand, L.; Jacquier, C.; Slama, R.; et al. Health effects of ambient air pollution: Do different methods for estimating exposure lead to different results? Environ. Int. 2014, 66, 165–173. [Google Scholar] [CrossRef]
- Arroyo, V.; Díaz, J.; Ortiz, C.; Carmona, R.; Sáez, M.; Linares, C. Short term effect of air pollution, noise and heat waves on preterm births in Madrid (Spain). Environ. Res. 2016, 145, 162–168. [Google Scholar] [CrossRef]
- Bertin, M.; Chevrier, C.; Serrano, T.; Monfort, C.; Rouget, F.; Cordier, S.; Viel, J.-F. Association between prenatal exposure to traffic-related air pollution and preterm birth in the PELAGIE mother–child cohort, Brittany, France. Does the urban–rural context matter? Environ. Res. 2015, 142, 17–24. [Google Scholar] [CrossRef] [PubMed]
- Dibben, C.; Clemens, T. Place of work and residential exposure to ambient air pollution and birth outcomes in Scotland, using geographically fine pollution climate mapping estimates. Environ. Res. 2015, 140, 535–541. [Google Scholar] [CrossRef]
- Schembari, A.; De Hoogh, K.; Pedersen, M.; Dadvand, P.; Martinez, D.; Hoek, G.; Petherick, E.S.; Wright, J.; Nieuwenhuijsen, M.J. Ambient Air Pollution and Newborn Size and Adiposity at Birth: Differences by Maternal Ethnicity (the Born in Bradford Study Cohort). Environ. Healthy Perspect. 2015, 123, 1208–1215. [Google Scholar] [CrossRef]
- Arroyo, V.; Díaz, J.; Carmona, R.; Ortiz, C.; Linares, C. Impact of air pollution and temperature on adverse birth outcomes: Madrid, 2001–2009. Environ. Pollut. 2016, 218, 1154–1161. [Google Scholar] [CrossRef] [PubMed]
- Bijnens, E.M.; Derom, C.; Gielen, M.; Winckelmans, E.; Fierens, F.; Vlietinck, R.; Zeegers, M.P.; Nawrot, T.S. Small for gestational age and exposure to particulate air pollution in the early-life environment of twins. Environ. Res. 2016, 148, 39–45. [Google Scholar] [CrossRef]
- Clemente, D.B.; Casas, M.; Vilahur, N.; Begiristain, H.; Bustamante, M.; Carsin, A.-E.; Fernández, M.F.; Fierens, F.; Gyselaers, W.; Iñiguez, C.; et al. Prenatal Ambient Air Pollution, Placental Mitochondrial DNA Content, and Birth Weight in the INMA (Spain) and ENVIR ON AGE (Belgium) Birth Cohorts. Environ. Healthy Perspect. 2016, 124, 659–665. [Google Scholar] [CrossRef]
- Díaz, J.; Arroyo, V.; Ortiz, C.; Carmona, R.; Linares, C. Effect of Environmental Factors on Low Weight in Non-Premature Births: A Time Series Analysis. PLoS ONE 2016, 11, e0164741. [Google Scholar] [CrossRef]
- Estarlich, M.; Ballester, F.; Davdand, P.; Llop, S.; Esplugues, A.; Fernández-Somoano, A.; Lertxundi, A.; Guxens, M.; Basterrechea, M.; Tardón, A.; et al. Exposure to ambient air pollution during pregnancy and preterm birth: A Spanish multicenter birth cohort study. Environ. Res. 2016, 147, 50–58. [Google Scholar] [CrossRef]
- Giorgis-Allemand, L.; Pedersen, M.; Bernard, C.; Aguilera, I.; Beelen, R.M.J.; Chatzi, L.; Cirach, M.; Danileviciute, A.; Dedele, A.; Van Eijsden, M.; et al. The Influence of Meteorological Factors and Atmospheric Pollutants on the Risk of Preterm Birth. Am. J. Epidemiol. 2017, 185, 247–258. [Google Scholar] [CrossRef] [PubMed]
- Schifano, P.; Asta, F.; Dadvand, P.; Davoli, M.; Basagaña, X.; Michelozzi, P. Heat and air pollution exposure as triggers of delivery: A survival analysis of population-based pregnancy cohorts in Rome and Barcelona. Environ. Int. 2016, 88, 153–159. [Google Scholar] [CrossRef]
- Clemens, T.; Turner, S.; Dibben, C. Maternal exposure to ambient air pollution and fetal growth in North-East Scotland: A population-based study using routine ultrasound scans. Environ. Int. 2017, 107, 216–226. [Google Scholar] [CrossRef]
- Giovannini, N.; Schwartz, L.; Cipriani, S.; Parazzini, F.; Baini, I.; Signorelli, V.; Cetin, I. Particulate matter (PM10) exposure, birth and fetal-placental weight and umbilical arterial pH: Results from a prospective study. J. Matern. Neonatal Med. 2017, 31, 651–655. [Google Scholar] [CrossRef]
- Deguen, S.; Ahlers, N.; Gilles, M.; Danzon, A.; Carayol, M.; Zmirou-Navier, D.; Kihal-Talantikite, W. Using a Clustering Approach to Investigate Socio-Environmental Inequality in Preterm Birth—A Study Conducted at Fine Spatial Scale in Paris (France). Int. J. Environ. Res. Public Healthy 2018, 15, 1895. [Google Scholar] [CrossRef]
- Mariet, A.-S.; Mauny, F.; Pujol, S.; Thiriez, G.; Sagot, P.; Riethmuller, D.; Boilleaut, M.; Defrance, J.; Houot, H.; Parmentier, A.-L.; et al. Multiple pregnancies and air pollution in moderately polluted cities: Is there an association between air pollution and fetal growth? Environ. Int. 2018, 121, 890–897. [Google Scholar] [CrossRef]
- Arroyo, V.; Linares, C.; Díaz, J. Premature births in Spain: Measuring the impact of air pollution using time series analyses. Sci. Total. Environ. 2019, 660, 105–114. [Google Scholar] [CrossRef]
- Siddika, N.; Rantala, A.K.; Antikainen, H.; Balogun, H.; Amegah, A.K.; Ryti, N.R.; Kukkonen, J.; Sofiev, M.; Jaakkola, M.S.; Jaakkola, J.J. Synergistic effects of prenatal exposure to fine particulate matter (PM2.5) and ozone (O3) on the risk of preterm birth: A population-based cohort study. Environ. Res. 2019, 176, 108549. [Google Scholar] [CrossRef]
- Li, C.; Yang, M.; Zhu, Z.; Sun, S.; Zhang, Q.; Cao, J.-Y.; Ding, R. Maternal exposure to air pollution and the risk of low birth weight: A meta-analysis of cohort studies. Environ. Res. 2020, 190, 109970. [Google Scholar] [CrossRef]
- Kannan, S.; Misra, D.P.; Dvonch, J.T.; Krishnakumar, A. Exposures to Airborne Particulate Matter and Adverse Perinatal Outcomes: A Biologically Plausible Mechanistic Framework for Exploring Potential Effect Modification by Nutrition. Environ. Healthy Perspect. 2006, 114, 1636–1642. [Google Scholar] [CrossRef]
- Bose, S.; Hansel, N.N.; Tonorezos, E.S.; Williams, D.L.; Bilderback, A.; Breysse, P.N.; Diette, G.B.; McCormack, M.C. Indoor Particulate Matter Associated with Systemic Inflammation in COPD. J. Environ. Prot. 2015, 6, 566–572. [Google Scholar] [CrossRef]
- Møller, P.; Danielsen, P.H.; Karottki, D.G.; Jantzen, K.; Roursgaard, M.; Klingberg, H.; Jensen, D.M.; Vest Christophersen, D.; Hemmingsen, J.G.; Cao, Y.; et al. Oxidative stress and inflammation generated DNA damage by exposure to air pollution particles. Mutat. Res. Mutat. Res. 2014, 762, 133–166. [Google Scholar] [CrossRef]
- Byun, H.-M.; Baccarelli, A.A. Environmental exposure and mitochondrial epigenetics: Study design and analytical challenges. Qual. Life Res. 2014, 133, 247–257. [Google Scholar] [CrossRef]
- Hou, L.; Zhu, Z.-Z.; Zhang, X.; Nordio, F.; Bonzini, M.; Schwartz, J.D.; Hoxha, M.; Dioni, L.; Marinelli, B.; Pegoraro, V.; et al. Airborne particulate matter and mitochondrial damage: A cross-sectional study. Environ. Healthy 2010, 9, 48. [Google Scholar] [CrossRef] [PubMed]
- Wick, P.; Malek, A.; Manser, P.; Meili, D.; Maeder-Althaus, X.; Diener, L.; Diener, P.-A.; Zisch, A.; Krug, H.F.; Von Mandach, U. Barrier Capacity of Human Placenta for Nanosized Materials. Environ. Healthy Perspect. 2010, 118, 432–436. [Google Scholar] [CrossRef]
- Myllynen, P.; Pasanen, M.; Pelkonen, O. Human placenta: A human organ for developmental toxicology research and biomonitoring. Placenta 2005, 26, 361–371. [Google Scholar] [CrossRef]
- Weldy, C.S.; Liu, Y.; Liggitt, H.D.; Chin, M.T. In Utero Exposure to Diesel Exhaust Air Pollution Promotes Adverse Intrauterine Conditions, Resulting in Weight Gain, Altered Blood Pressure, and Increased Susceptibility to Heart Failure in Adult Mice. PLoS ONE 2014, 9, e88582. [Google Scholar] [CrossRef] [PubMed]
- Lv, Y.; Wang, H.; Wei, S.; Zhang, L.; Zhao, Q. The Correlation between Indoor and Outdoor Particulate Matter of Different Building Types in Daqing, China. Procedia Eng. 2017, 205, 360–367. [Google Scholar] [CrossRef]
- Lepeule, J.; Caïni, F.; Bottagisi, S.; Galineau, J.; Hulin, A.; Marquis, N.; Bohet, A.; Siroux, V.; Kaminski, M.; Charles, M.-A.; et al. Maternal Exposure to Nitrogen Dioxide during Pregnancy and Offspring Birth Weight: Comparison of Two Exposure Models. Environ. Healthy Perspect. 2010, 118, 1483–1489. [Google Scholar] [CrossRef]
- Lebret, E.; Briggs, D.; Van Reeuwijk, H.; Fischer, P.; Smallbone, K.; Harssema, H.; Kriz, B.; Gorynski, P.; Elliott, P. Small area variations in ambient NO2 concentrations in four European areas. Atmos. Environ. 2000, 34, 177–185. [Google Scholar] [CrossRef]
- Gulliver, J.; De Hoogh, K.; Fecht, D.; Vienneau, D.; Briggs, D. Comparative assessment of GIS-based methods and metrics for estimating long-term exposures to air pollution. Atmos. Environ. 2011, 45, 7072–7080. [Google Scholar] [CrossRef]
- Kaiser, R.; Romieu, I.; Medina, S.; Schwartz, J.; Krzyzanowski, M.; Künzli, N. Air pollution attributable postneonatal infant mortality in U.S. metropolitan areas: A risk assessment study. Environ. Healthy 2004, 3, 4. [Google Scholar] [CrossRef]
- Kihal-Talantikite, W.; Legendre, P.; Le Nouveau, P.; Deguen, S. Premature Adult Death and Equity Impact of a Reduction of NO2, PM10, and PM2.5 Levels in Paris—A Health Impact Assessment Study Conducted at the Census Block Level. Int. J. Environ. Res. Public Healthy 2018, 16, 38. [Google Scholar] [CrossRef] [PubMed]


Publisher’s Note: MDPI stays neutral with regard to jurisdictional claims in published maps and institutional affiliations. |
© 2020 by the authors. Licensee MDPI, Basel, Switzerland. This article is an open access article distributed under the terms and conditions of the Creative Commons Attribution (CC BY) license (http://creativecommons.org/licenses/by/4.0/).