Impact of the COVID-19 Pandemic Lockdown on Air Pollution in 20 Major Cities around the World
Abstract
1. Introduction
2. Materials and Methods
2.1. City Selection
2.2. Air Quality Data
2.3. Lockdown Data
2.4. Climate Data
3. Results
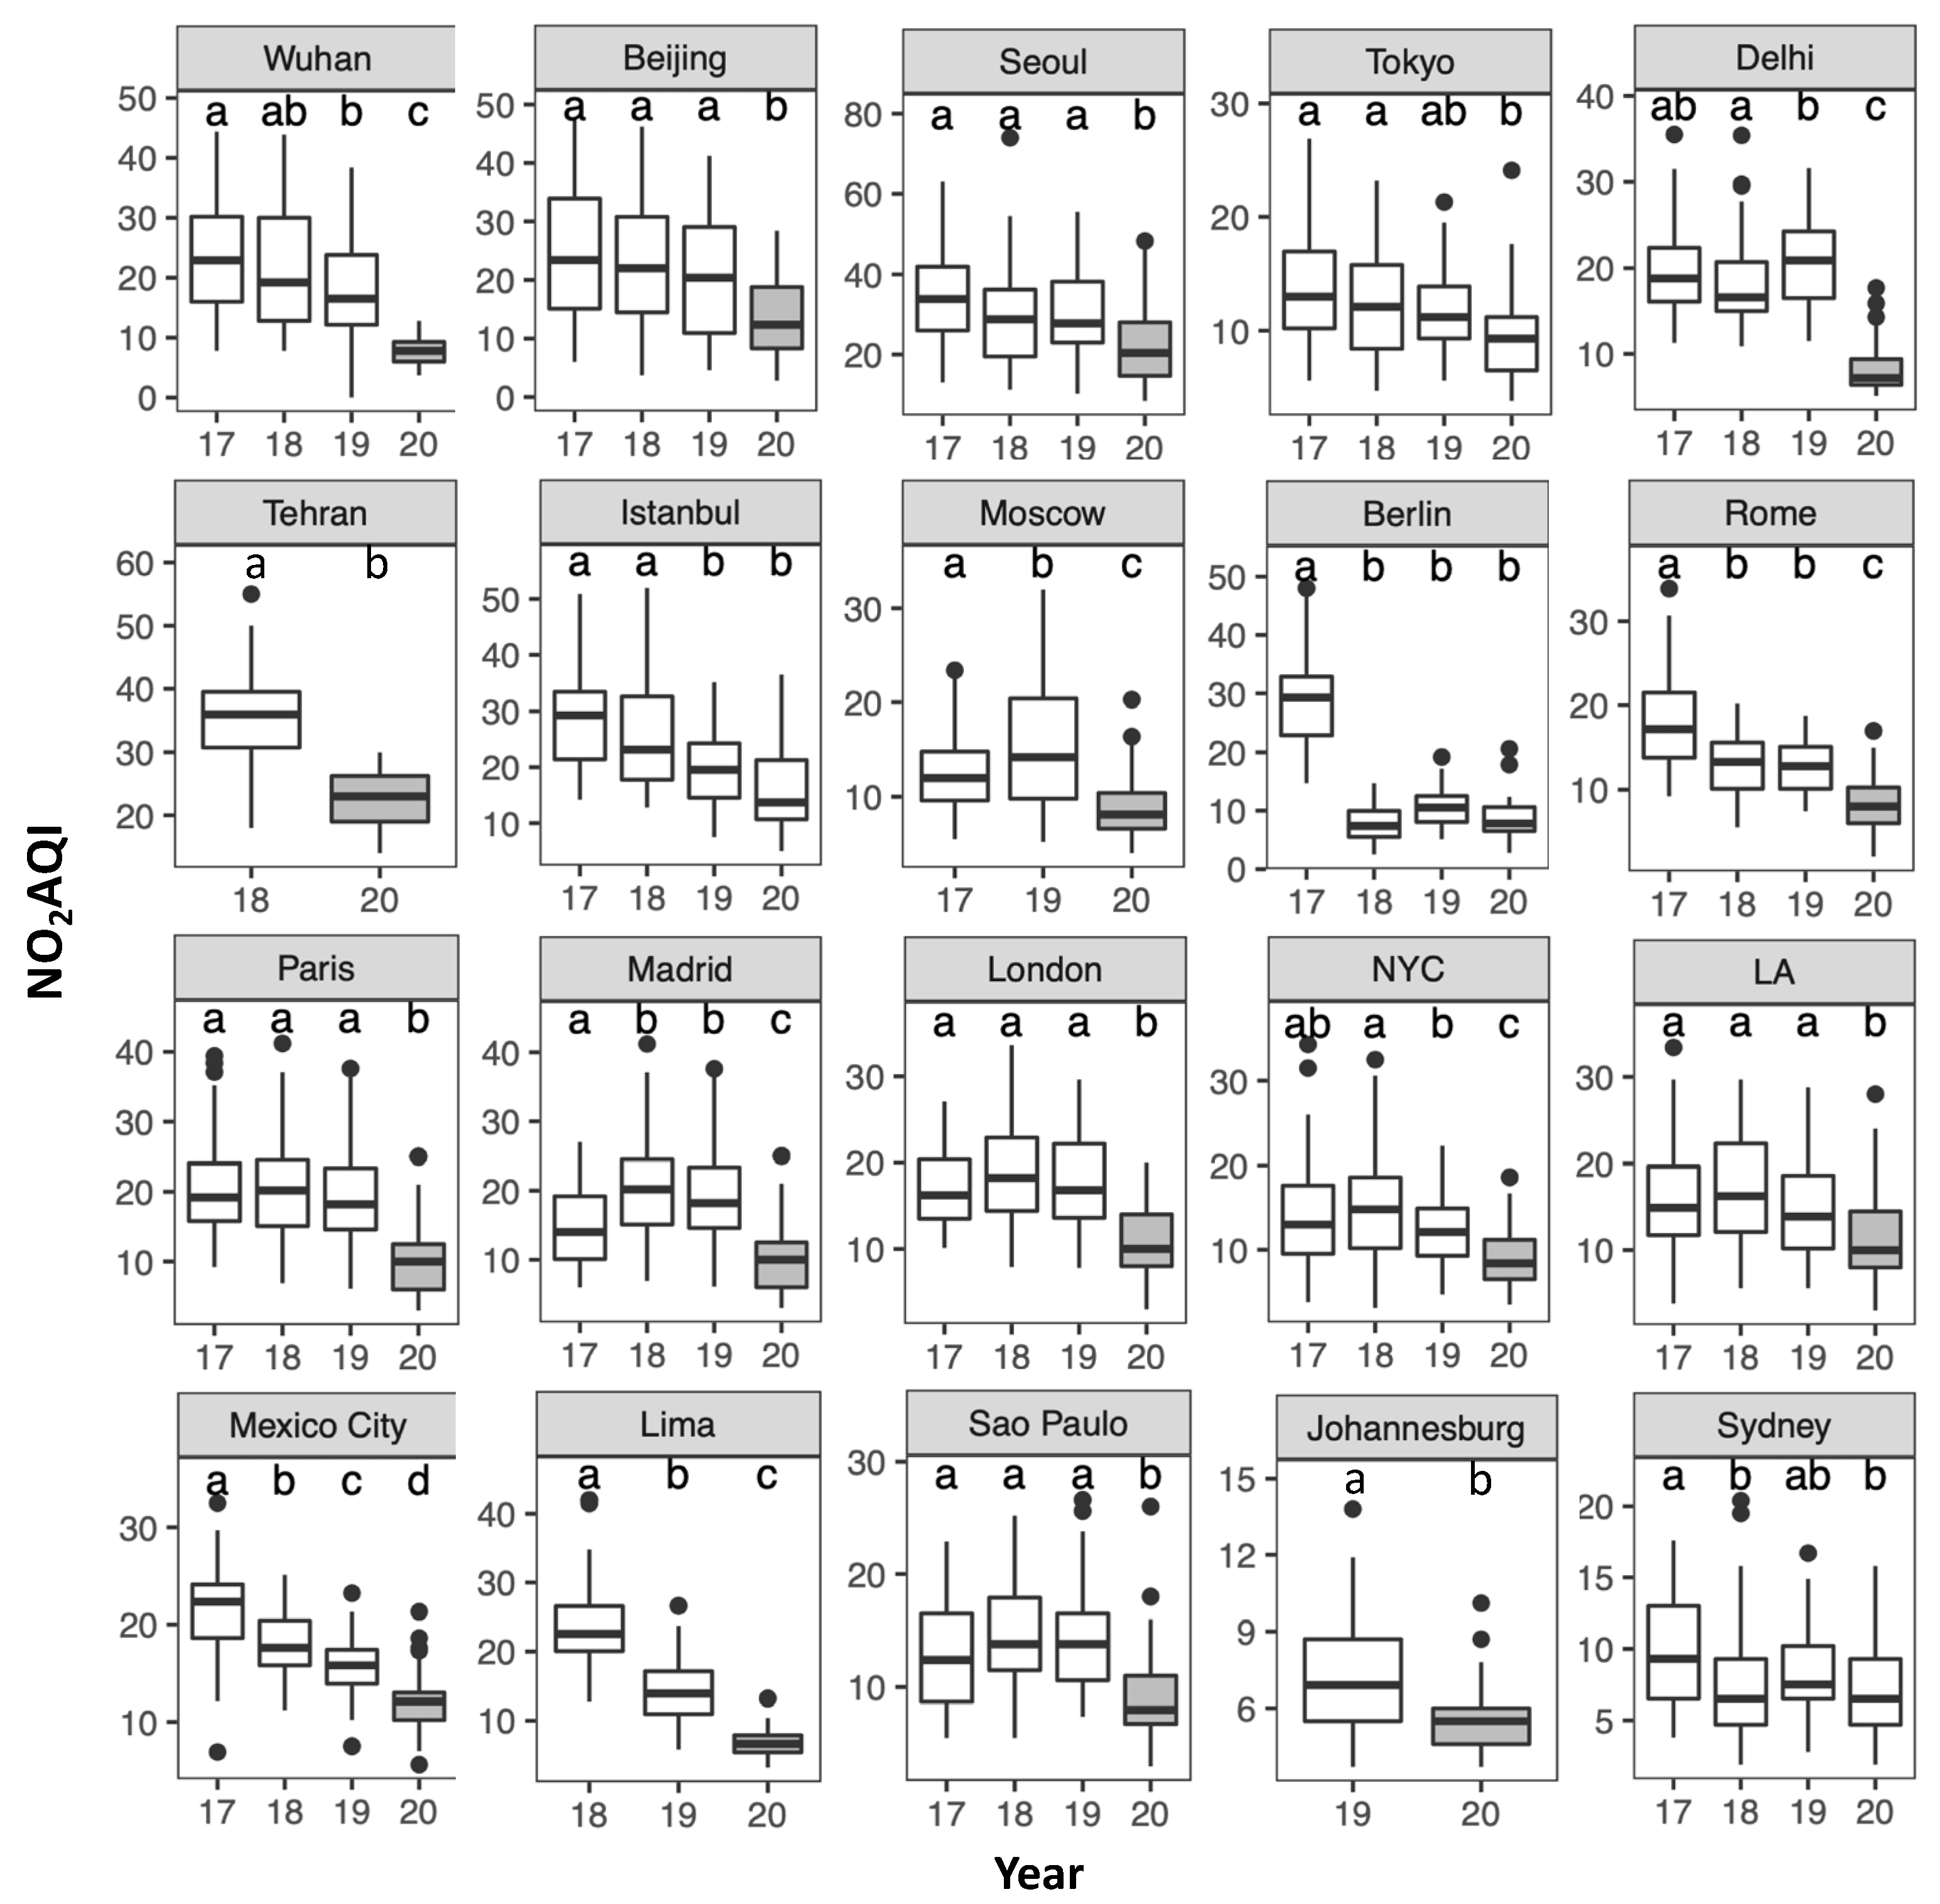
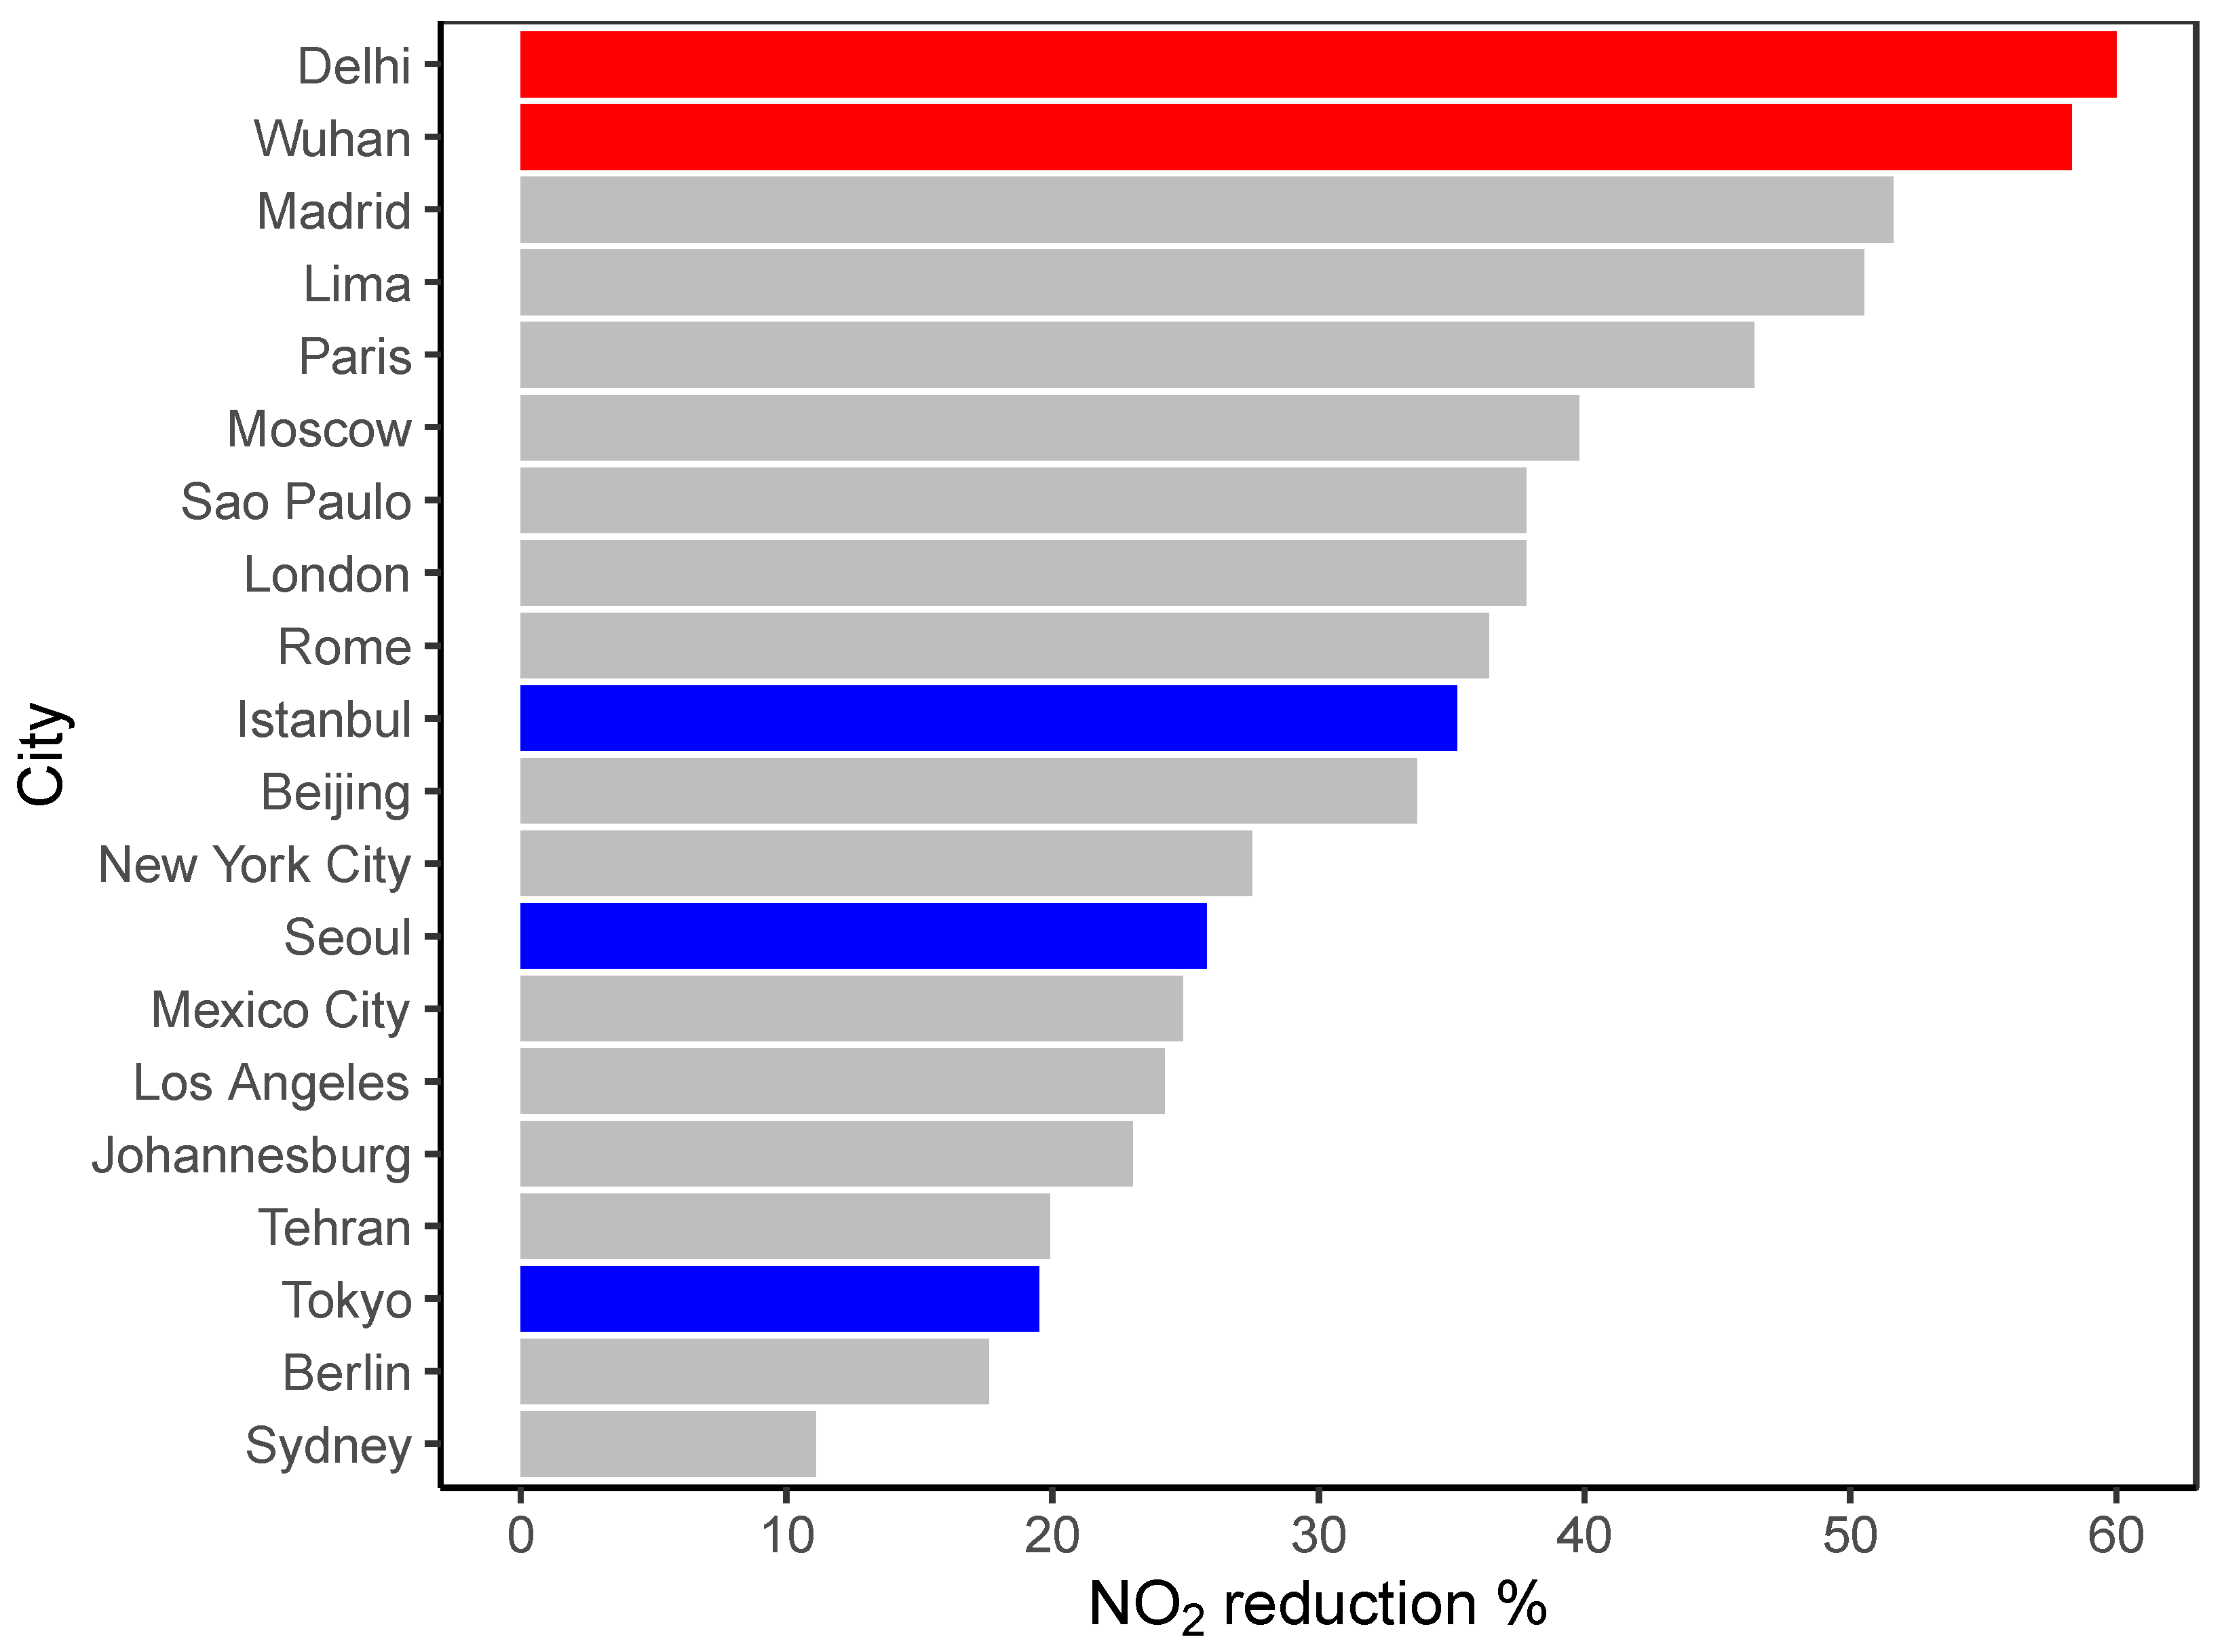
3.1. Primary Pollutants: NO2, SO2 and CO
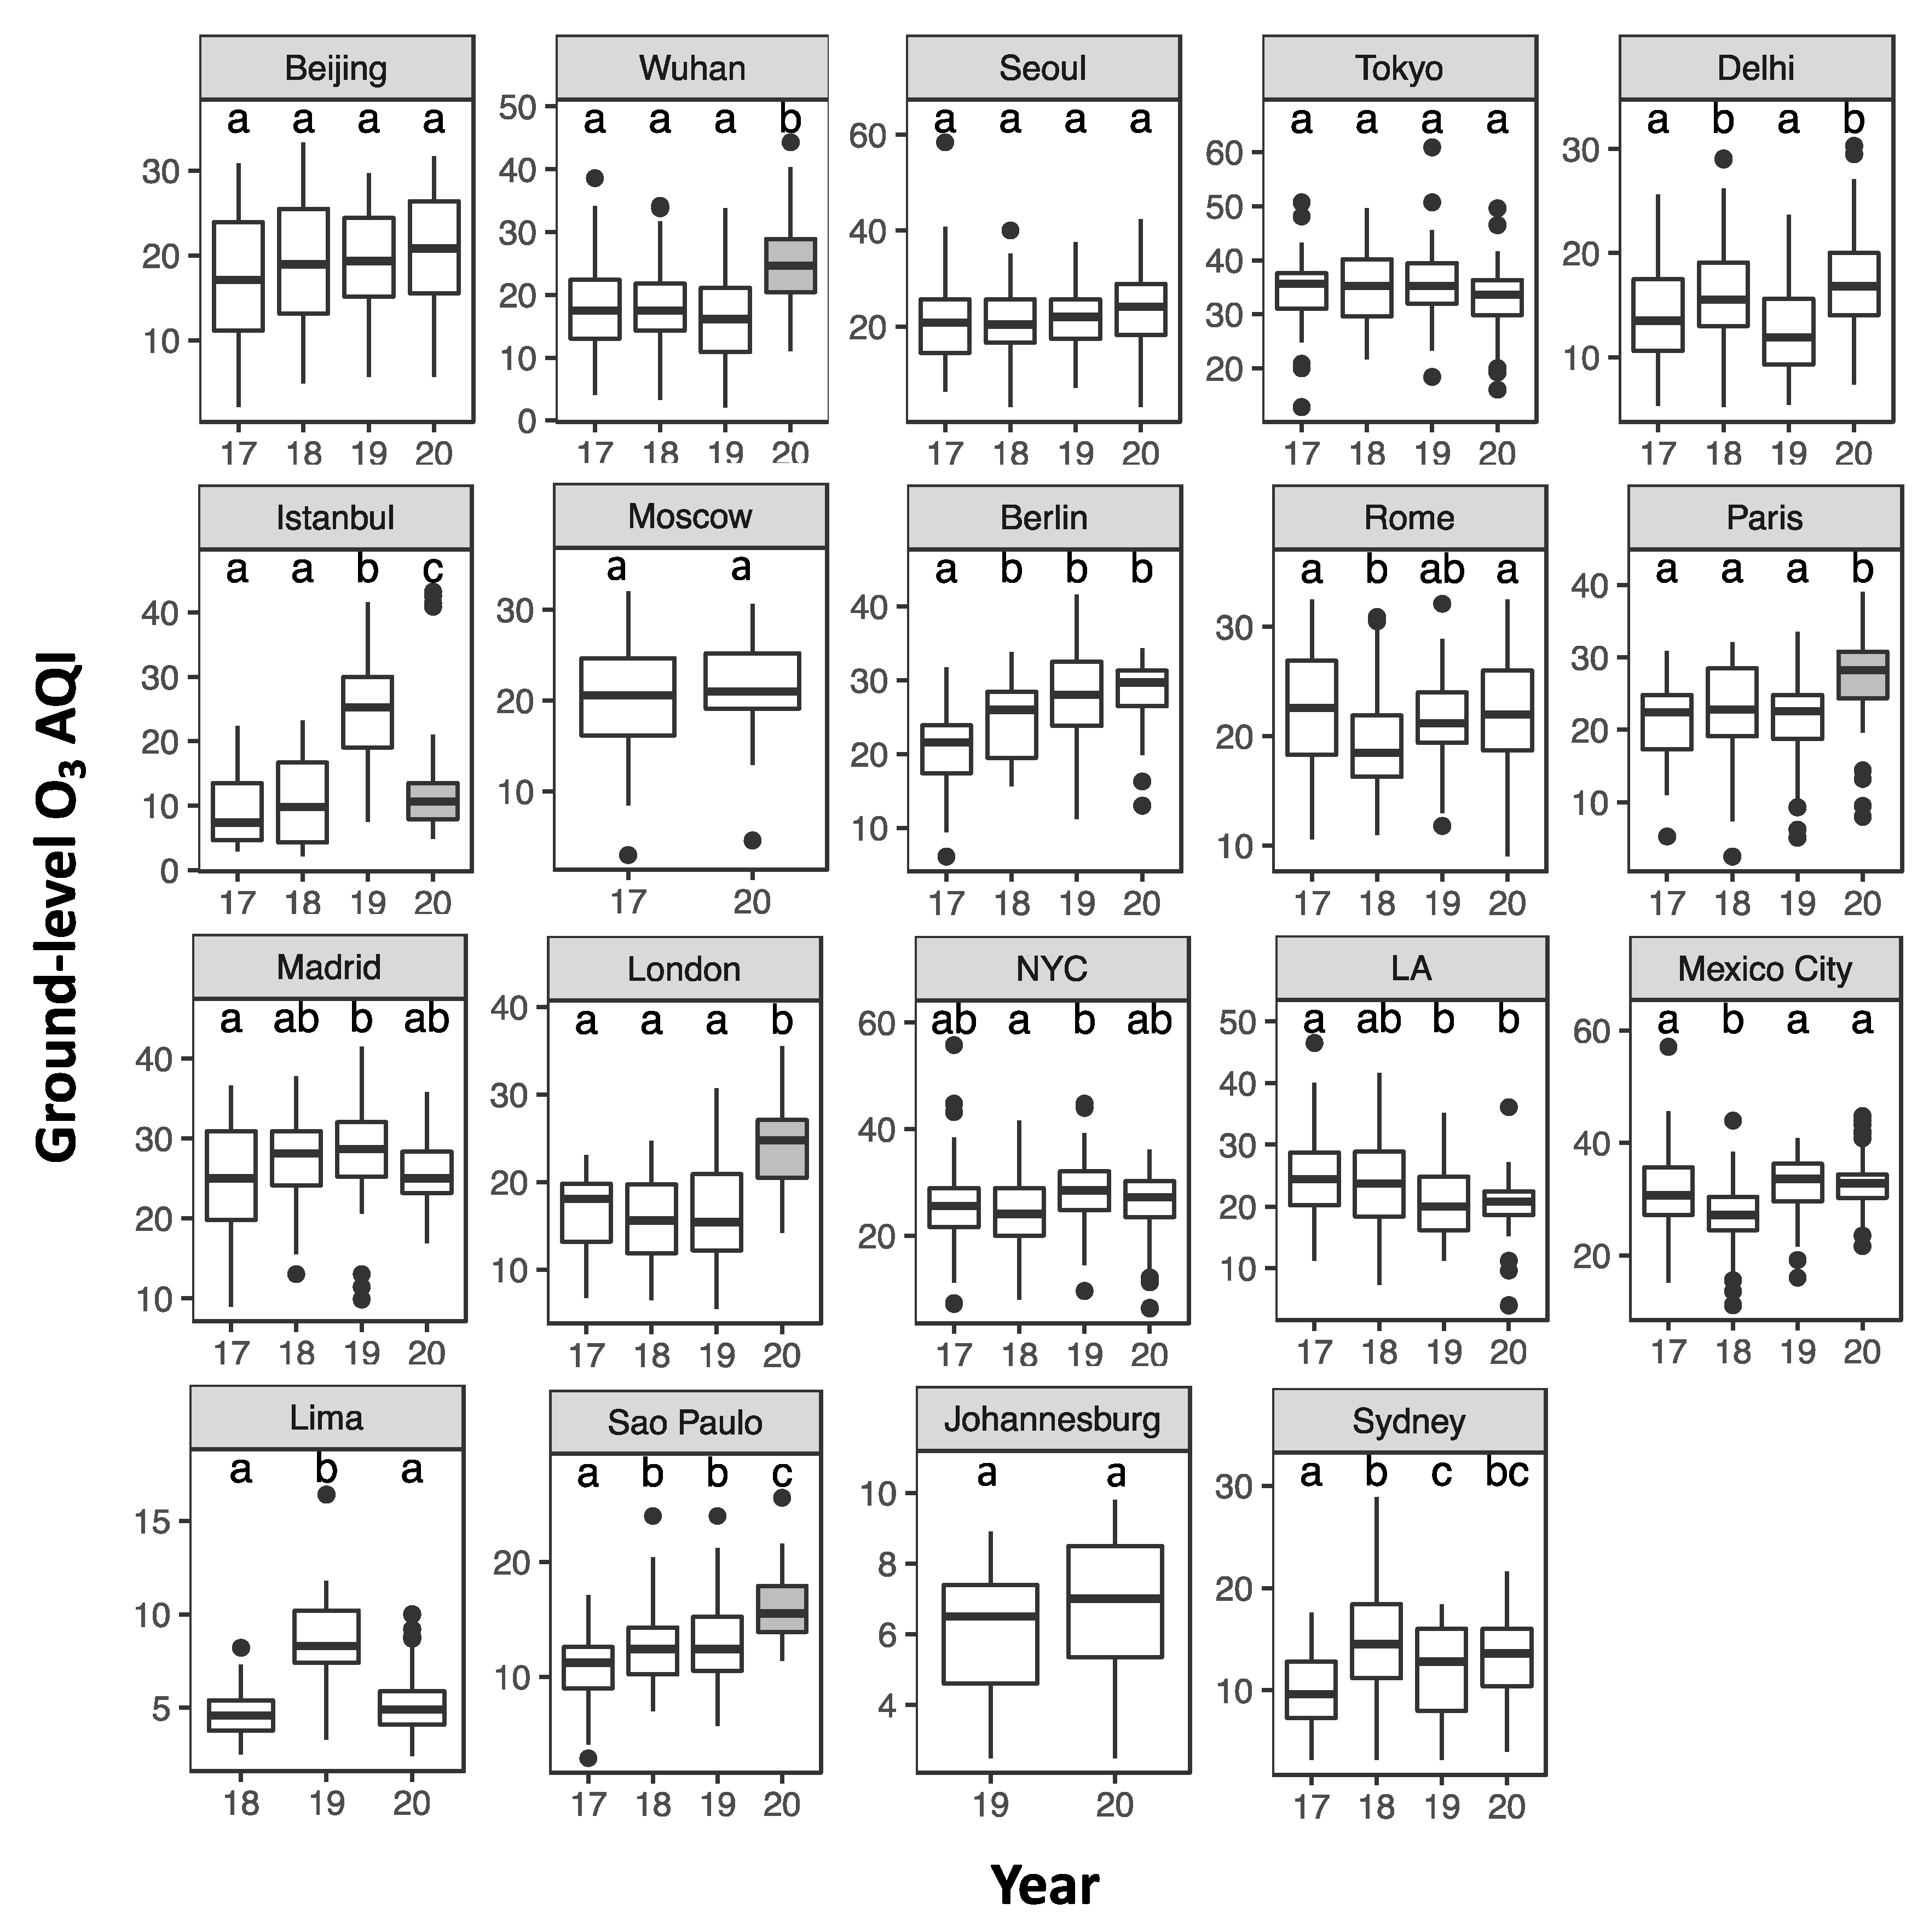
3.2. Secondary Pollutants: Ground-Level O3
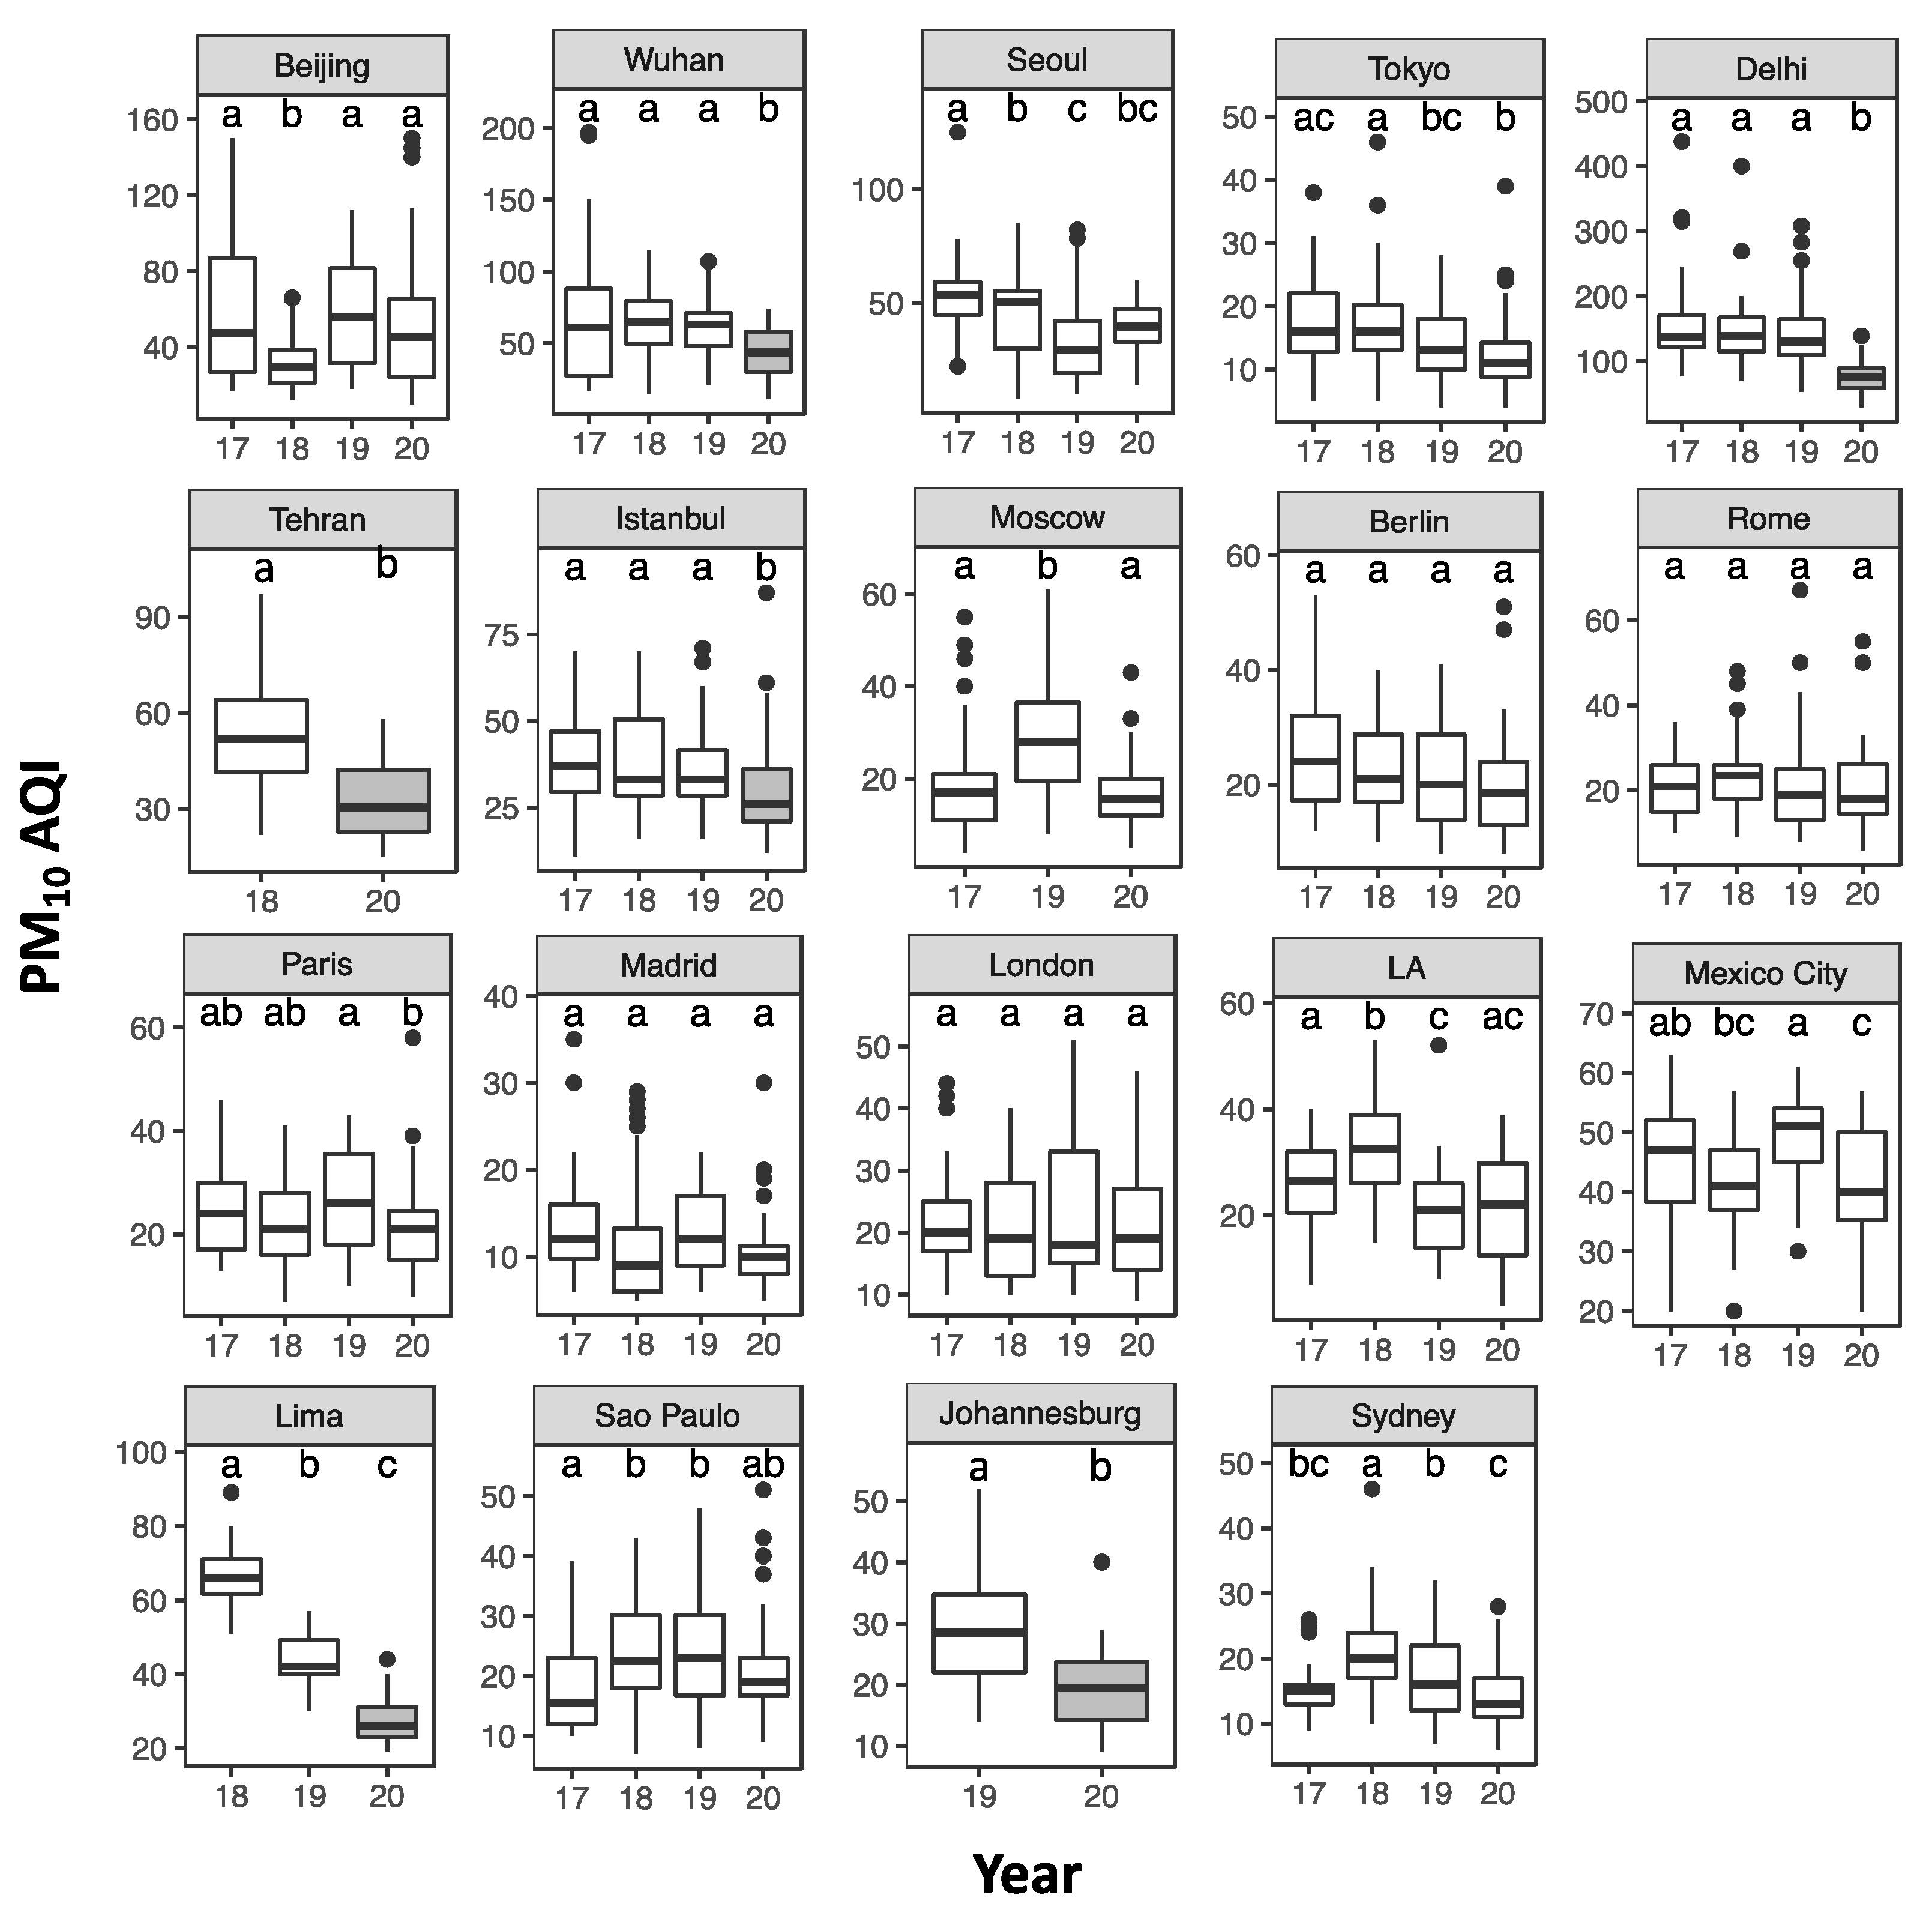
3.3. Particulate Matter: PM2.5 and PM10
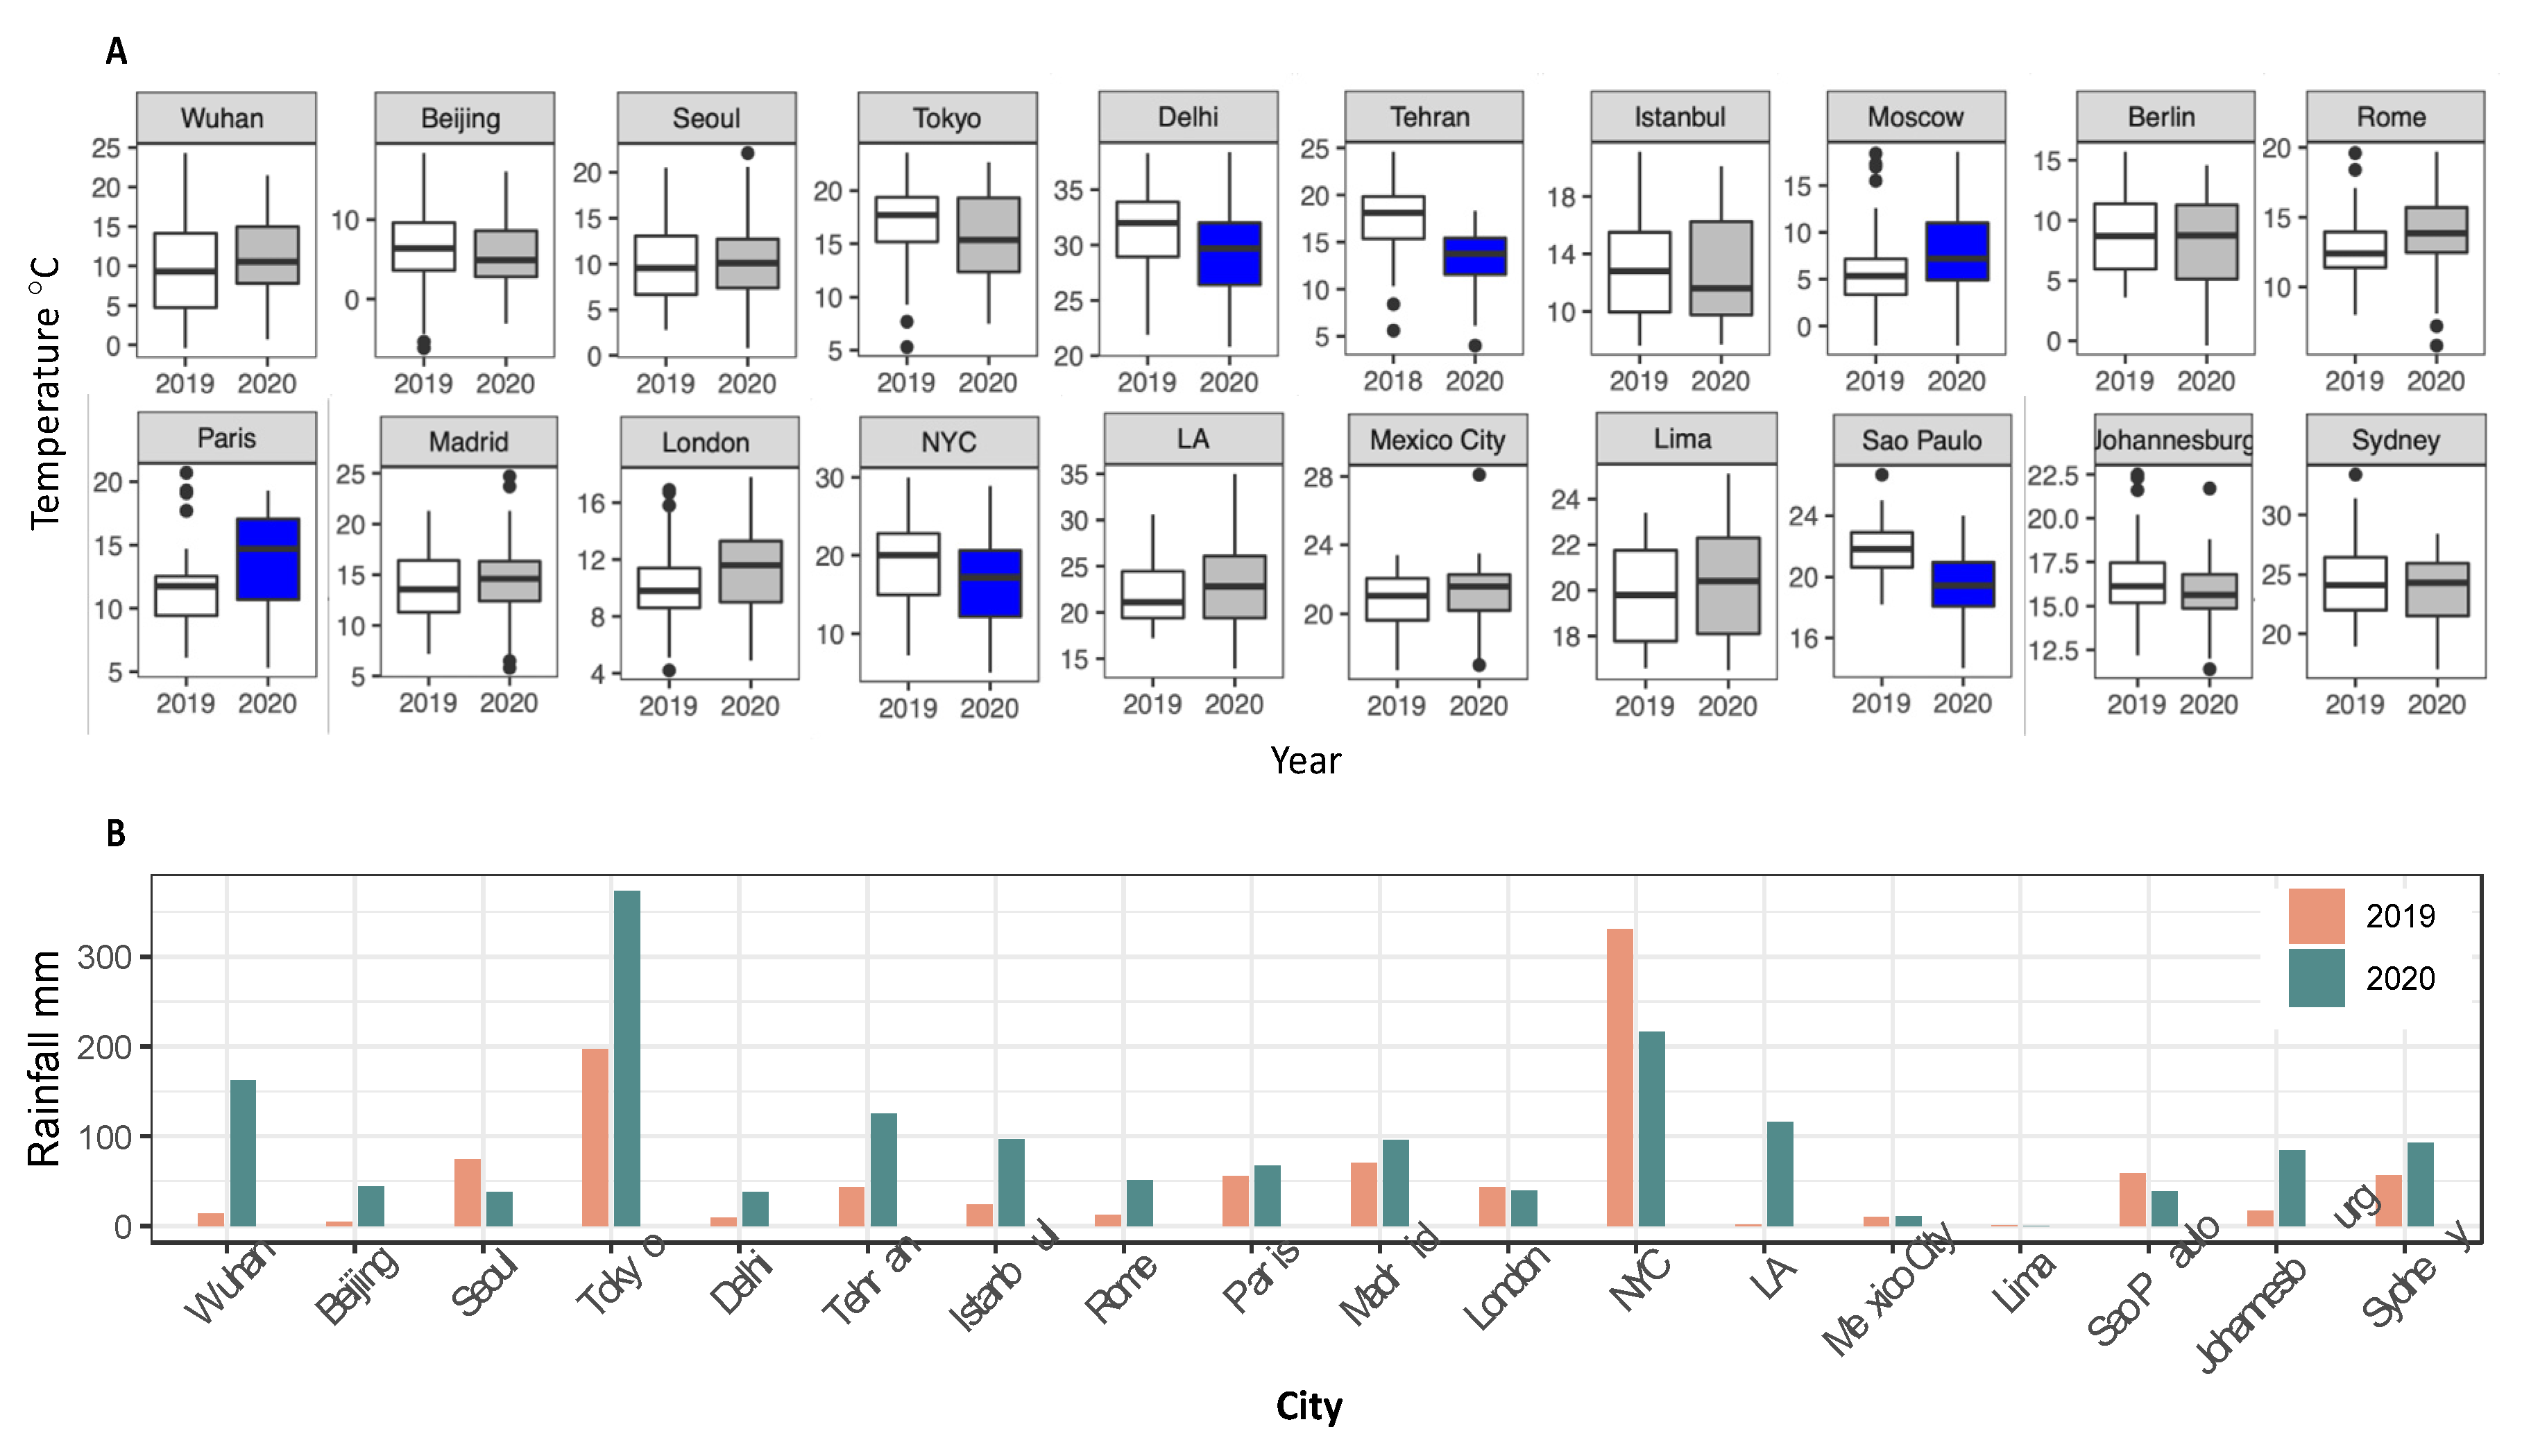
3.4. Temperature and Rainfall
4. Discussion
4.1. Changes in AQI of Main Pollutants
4.2. Impact of Lockdown Strategy on Air Quality
4.3. Impact of Meteorological Conditions on Air Quality
4.4. Impact of Environmental Policy on Air Quality
5. Conclusions
Supplementary Materials
Author Contributions
Funding
Conflicts of Interest
References
- Shah, A.S.V.; Langrish, J.P.; Nair, H.; McAllister, D.A.; Hunter, A.L.; Donaldson, K.; Newby, D.E.; Mills, N.L. Global association of air pollution and heart failure: A systematic review and meta-analysis. Lancet 2013, 382, 1039–1048. [Google Scholar] [CrossRef]
- International Agency for Research on Cancer (IARC). Outdoor Air Pollution: A Leading Environmental Cause of Cancer Deaths. Available online: https://www.iarc.fr/news-events/iarc-outdoor-air-pollution-a-leading-environmental-cause-of-cancer-deaths/ (accessed on 17 October 2013).
- Halonen, J.I.; Lanki, T.; Yli-Tuomi, T.; Tiittanen, P.; Kulmala, M.; Pekkanen, J. Particulate air pollution and acute cardiorespiratory hospital admissions and mortality among the elderly. Epidemiology 2009, 20, 143–153. [Google Scholar] [CrossRef]
- World Health Organization (WHO). Update and Revision of the Air Quality Guidelines for Europe: Meeting of the Working Group on Classical Air Pollutants; WHO Regional Office for Europe: Copenhagen, Denmark, 1995. [Google Scholar]
- Lin, C.-Y.C.; Jacob, D.J.; Fiore, A.M. Trends in exceedances of the ozone air quality standard in the continental United States, 1980–1998. Atmos. Environ. 2001, 35, 3217–3228. [Google Scholar] [CrossRef]
- Raub, J.A.; Mathieu-Nolf, M.; Hampson, N.B.; Thom, S.R. Carbon monoxide poisoning—A public health perspective. Toxicology 2000, 145, 1–14. [Google Scholar] [CrossRef]
- Poschl, U. Atmospheric aerosols: Composition, transformation, climate and health effects. Angew. Chem. Int. Ed. Engl. 2005, 44, 7520–7540. [Google Scholar] [CrossRef] [PubMed]
- Huang, T.; Zhu, X.; Zhong, Q.; Yun, X.; Meng, W.; Li, B.; Ma, J.; Zeng, E.Y.; Tao, S. Spatial and Temporal Trends in Global Emissions of Nitrogen Oxides from 1960 to 2014. Environ. Sci. Technol. 2017, 51, 7992–8000. [Google Scholar] [CrossRef] [PubMed]
- Chin, M.; Savoie, D.L.; Huebert, B.J.; Bandy, A.R.; Thornton, D.C.; Bates, T.S.; Quinn, P.K.; Saltzman, E.S.; De Bruyn, W.J. Atmospheric sulfur cycle simulated in the global model GOCART: Model description and global properties. J. Geophys. Res. Atmos. 2000, 105, 24671–24687. [Google Scholar] [CrossRef]
- Zhong, Q.; Huang, Y.; Shen, H.; Chen, Y.; Chen, H.; Huang, T.; Tao, S. Global estimates of carbon monoxide emissions from 1960 to 2013. Environ. Sci. Pollut. Res. 2016, 24, 864–873. [Google Scholar] [CrossRef]
- United States Environmental Protection Agency (US EPA). National Annual Emissions Trend. Available online: https://www.epa.gov/sites/production/files/2018-04/national_tier1_caps.xlsx (accessed on 31 July 2020).
- Airparif. Inventaire Régional des Emissions en Ile-de-France Année de Référence 2012—Eléments Synthétiques Edition mai 2016. Available online: https://www.airparif.asso.fr/_pdf/publications/inventaire-emissions-idf-2012-150121.pdf (accessed on 31 July 2020).
- Greater London Authority (GLA). London Atmospheric Emissions Inventory 2017. Available online: https://data.london.gov.uk/dataset/london-atmospheric-emissions-inventory-2013 (accessed on 31 July 2020).
- Gurjar, B.; Nagpure, A. Indian megacities as localities of environmental vulnerability from air quality perspective. J. Smart Cities. 2015, 1, 15–30. [Google Scholar] [CrossRef]
- EMEP/CEIP. Officially Reported Emission Data for 2019. Available online: https://www.ceip.at/webdab-emission-database/reported-emissiondata (accessed on 31 July 2020).
- Klimont, Z.; Kupiainen, K.; Heyes, C.; Purohit, P.; Cofala, J.; Rafaj, P.; Borken-Kleefeld, J.; Schöpp, W. Global anthropogenic emissions of particulate matter including black carbon. Atmos. Chem. Phys. 2017, 17, 8681–8723. [Google Scholar] [CrossRef]
- Lu, H.; Stratton, C.W.; Tang, Y.W. Outbreak of pneumonia of unknown etiology in Wuhan China: The mystery and the miracle. J. Med. Virol. 2020, 92, 401–402. [Google Scholar] [CrossRef]
- Pepe, E.; Bajardi, P.; Gauvin, L.; Privitera, F.; Lake, B.; Cattuto, C.; Tizzoni, M. COVID-19 outbreak response: A first assessment of mobility changes in Italy following national lockdown. medRxiv 2020. [Google Scholar] [CrossRef]
- Kumar, P.; Hama, S.; Omidvarborna, H.; Sharma, A.; Sahani, J.; Abhijith, K.V.; Debele, S.E.; Zavala-Reyes, J.C.; Barwise, Y.; Tiwari, A. Temporary reduction in fine particulate matter due to ‘anthropogenic emissions switch-o’ during COVID-19 lockdown in Indian cities. Sustain. Cities Soc. 2020, 62, 102382. [Google Scholar] [CrossRef] [PubMed]
- Venter, Z.S.; Aunan, K.; Chowdhury, S.; Lelieveld, J. COVID-19 lockdowns cause global air pollution declines with implications for public health risk. medRxiv 2020. [Google Scholar] [CrossRef]
- Lal, P.; Kumar, A.; Kumar, S.; Kumari, S.; Saikia, P.; Dayanandan, A.; Adhikari, D.; Khan, M.L. The dark cloud with a silver lining: Assessing the impact of the SARS COVID-19 pandemic on the global environment. Sci. Total Environ. 2020, 732, 139297. [Google Scholar] [CrossRef]
- Apple Mobility Trends Reports. Available online: https://www.apple.com/covid19/mobility (accessed on 31 July 2020).
- International Energy Agency (IEA). Global Energy Review 2020: The Impacts of the COVID-19 Crisis on Global Energy Demand and CO2 Emissions, Flagship Report—April 2020. Available online: https://www.iea.org/reports/global-energy-review-2020/electricity (accessed on 31 July 2020).
- Sillman, S. Tropospheric ozone and photochemical smog. Treatise Geochem. 2020, 9, 407–431. [Google Scholar] [CrossRef]
- Kim, M.J.; Park, R.J.; Kim, J.J. Urban air quality modeling with full O3-NOx-VOC chemistry: Implications for O3 and PM air quality in a street canyon. Atmos. Environ. 2012, 47, 330–340. [Google Scholar] [CrossRef]
- Simon, H.; Reff, A.; Wells, B.; Xing, J.; Frank, N. Ozone trends across the United States over a period of decreasing NOx and VOC emissions. Environ. Sci. Technol. 2015, 49, 186–195. [Google Scholar] [CrossRef]
- Charron, A.; Harrison, R.M.; Quincey, P. What are the sources and conditions responsible for exceedances of the 24 h PM10 Limit Value (50 μg m–3) at a heavily trafficked London site? Atmos. Environ. 2007, 41, 1960–1975. [Google Scholar] [CrossRef]
- Lenschow, P.; Abraham, H.J.; Kutzner, K.; Lutz, M.; Preu, J.D.; Reichenbacher, W. Some ideas about the sources of PM10. Atmos. Environ. 2001, 35, 23–33. [Google Scholar] [CrossRef]
- Wang, Y. China’s ongoing battle against the coronavirus: A scholar-practitioner’s experiences and reflections. Socio. Ecol. Pract. Res. 2020, 2, 181–183. [Google Scholar] [CrossRef]
- Tobías, A. Evaluation of the lockdowns for the SARS-CoV-2 epidemic in Italy and Spain after one month follow up. Sci. Total Environ. 2020, 725, 138539. [Google Scholar] [CrossRef]
- Mitjà, O.; Arenas, À.; Rodó, X.; Tobias, A.; Brew, J.; Benlloch, J.M. Experts’ request to the Spanish government: Move Spain towards complete lockdown. Lancet 2020, 395, 1193–1194. [Google Scholar] [CrossRef]
- Pullano, G.; Valdano, E.; Scarpa, N.; Rubrichi, S.; Colizza, V. Population mobility reductions during covid-19 epidemic in France under lockdown. medRxiv 2020. [Google Scholar] [CrossRef]
- Hampton, M.; Clark, M.; Baxter, I.; Stevens, R.; Flatt, E.; Murray, J.; Wembridge, K. The effects of a UK lockdown on orthopedic trauma admissions and surgical cases: A Multicentre comparative study. Bone Joint Open 2020, 1, 137–143. [Google Scholar] [CrossRef]
- Perez-Brumer, A.; Silva-Santisteban, A. COVID-19 policies can perpetuate violence against transgender communities: Insights from Peru. AIDS Behav. 2020, 24, 2477–2479. [Google Scholar] [CrossRef]
- Morita, H.; Nakamura, S.; Hayashi, Y. Changes of Urban Activities and Behaviors Due to COVID-19 in Japan. Available online: http://dx.doi.org/10.2139/ssrn.3594054 (accessed on 6 May 2020).
- Aum, S.; Lee, S.Y.T.; Shin, Y. COVID-19 Doesn’t Need Lockdowns to Destroy Jobs: The Effect of Local Outbreaks in Korea. National Bureau of Economic Research, Working Paper 27264. Available online: https://doi.org/10.3386/w27264 (accessed on 2 October 2020).
- Armbruster, S.; Klotzbücher, V. Lost in Lockdown? COVID-19, Social Distancing, and Mental Health in Germany, Diskussionsbeiträge, No. 2020-04. Available online: http://hdl.handle.net/10419/218885 (accessed on 2 October 2020).
- Kaskun, S.; Ulutas, K. The Effect of COVID-19 Pandemic on Air Quality Caused by Traffic in Istanbul. Res. Square 2020, 5. [Google Scholar] [CrossRef]
- Brzezinski, A.; Kecht, V.; Van Dijcke, D. The Cost of Staying Open: Voluntary Social Distancing and Lockdowns in the US. Working Paper. 2020. Available online: http://dx.doi.org/10.2139/ssrn.3614494 (accessed on 2 October 2020).
- Bargain, O.; Aminjonov, U. Trust and Compliance to Public Health Policies in Times of COVID-19. IZA 2020, DP 13205. Available online: http://ftp.iza.org/dp13205.pdf (accessed on 2 October 2020).
- Jacob, D.J.; Winner, D.A. Effect of climate change on air quality. Atmos. Environ. 2009, 43, 51–63. [Google Scholar] [CrossRef]
- Fan, H.; Zhao, C.; Yang, Y. A comprehensive analysis of the spatio-temporal variation of urban air pollution in China during 2014–2018. Atmos. Environ. 2019, 220, 117066. [Google Scholar] [CrossRef]
- Sharma, R.; Kumar, R.; Sharma, D.K.; Son, L.H.; Priyadarshini, I.; Pham, B.T.; Bui, D.T.; Rai, S. Inferring air pollution from air quality index by different geographical areas: Case study in India. Air Qual. Atmos. Health 2019, 12, 1347–1357. [Google Scholar] [CrossRef]
- Zhai, S.; Jacob, D.J.; Wang, X.; Shen, L.; Li, K.; Zhang, Y.; Gui, K.; Zhao, T.; Liao, H. Fine particulate matter (PM2.5) trends in China, 2013–2018: Separating contributions from anthropogenic emissions and meteorology. Atmos. Chem. Phys. 2019, 19, 11031–11041. [Google Scholar] [CrossRef]
- Zheng, B.; Tong, D.; Li, M.; Liu, F.; Hong, C.; Geng, G.; Li, H.; Li, X.; Peng, L.; Qi, J.; et al. Trends in China’s anthropogenic emissions since 2010 as the consequence of clean air actions. Atmos. Chem. Phys. 2019, 18, 14095–14111. [Google Scholar] [CrossRef]
- Krotkov, N.A.; McLinden, C.A.; Li, C.; Lamsal, L.N.; Celarier, E.A.; Marchenko, S.V.; Swartz, W.H.; Bucsela, E.J.; Joiner, J.; Duncan, B.N.; et al. Aura OMI observations of regional SO2 and NO2 pollution changes from 2005 to 2015. Atmos. Chem. Phys. 2016, 16, 4605–4629. [Google Scholar] [CrossRef]
- Ministry of Environment, Forest & Climate Change of India (MoEFCC). National Clean Air Programme. Available online: http://moef.gov.in/wp-content/uploads/2019/05/NCAP_Report.pdf (accessed on 2 October 2020).
- Sevimoglu, O. Assessment of Major Air Pollution Sources in Efforts of Long-Term Air Quality Improvement in Istanbul. Sakarya Univ. J. Sci. 2020, 24, 389–405. [Google Scholar] [CrossRef][Green Version]
- Convention on Long-Range Transboundary Air Pollution (CLRTAP). Protocols to the Convention on Long-Range Transboundary Air Pollution; United Nations Economic Commission for Europe: Geneva, Switzerland; Available online: http://www.unece.org/fileadmin//DAM/env/lrtap/status/lrtap_s.htm (accessed on 2 October 2020).
- Kuklinska, K.; Wolska, L.; Namiesnik, J. Air quality policy in the U.S. and the EU—A review. Atmos. Pollut. Res. 2015, 6, 129–137. [Google Scholar] [CrossRef]
- United States Environmental Protection Agency (US EPA). National Air Quality: Status and Trends of Key Pollutants. Available online: https://www.epa.gov/air-trends/) (accessed on 31 July 2020).
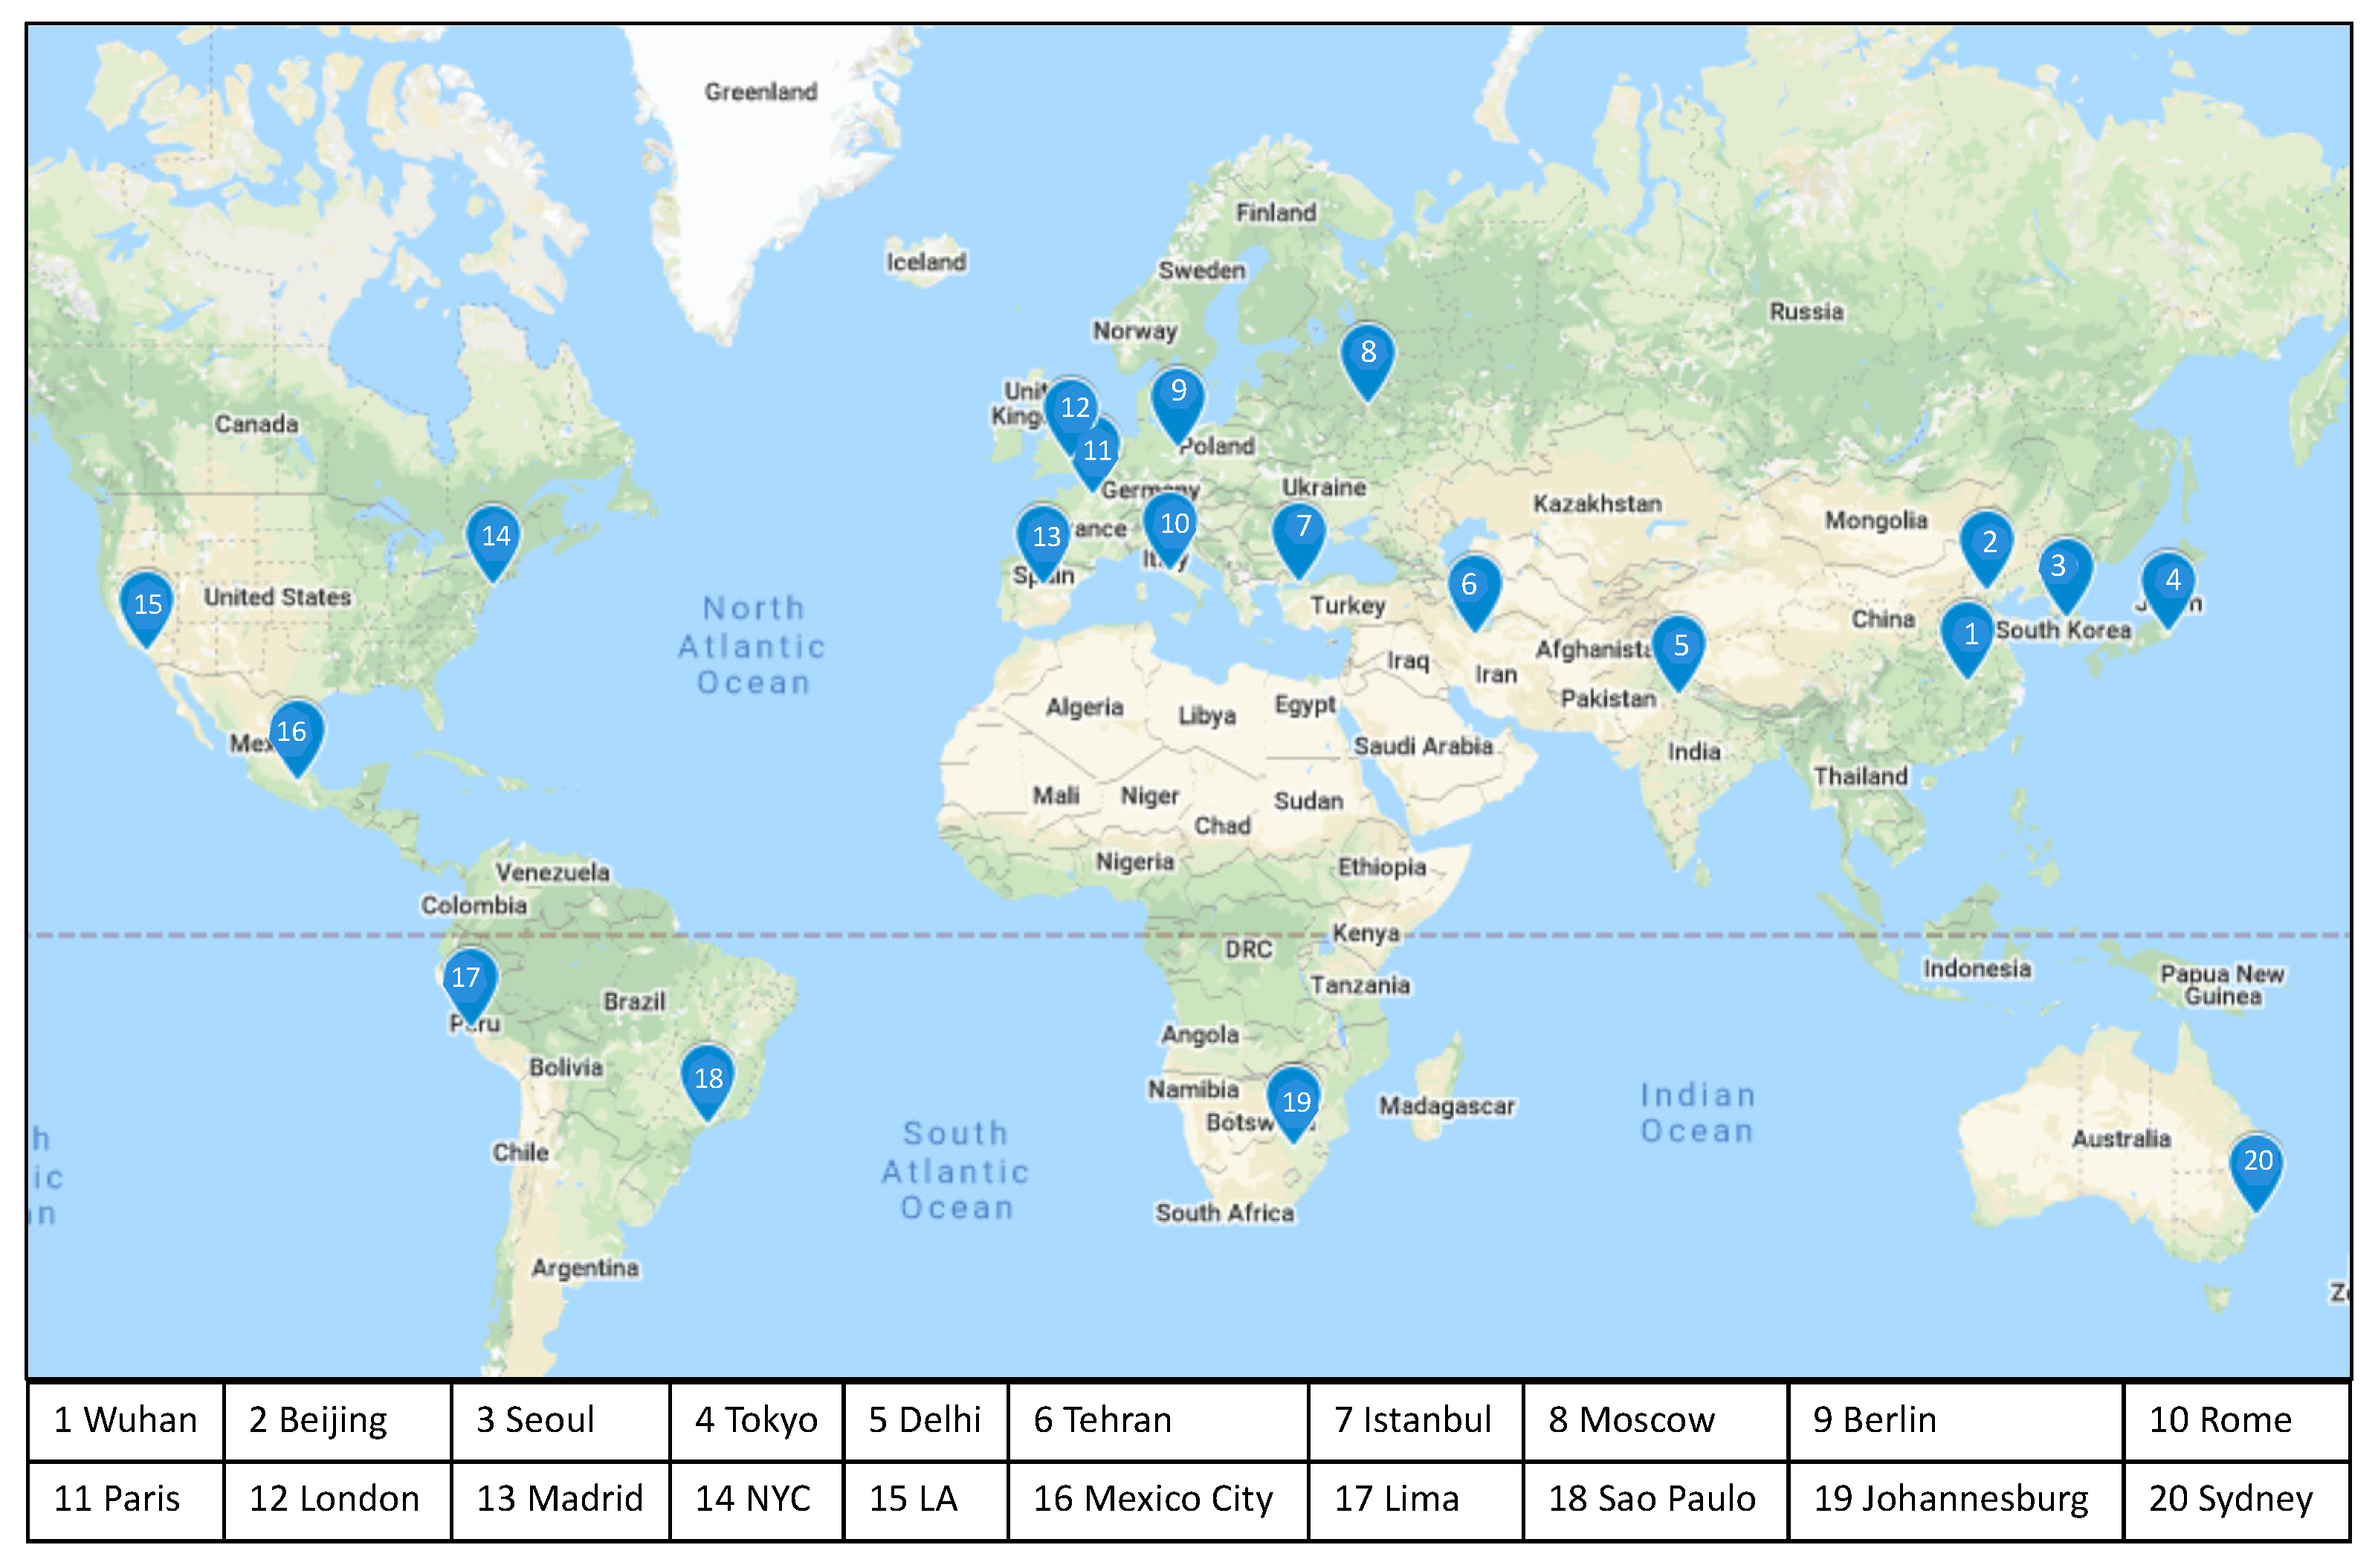

| City | Country | Lockdown | Lockdown Policy | ||
|---|---|---|---|---|---|
| From | To | Total/Partial | Other Local Actions | ||
| Wuhan | China | 23-Jan | 7-Apr | Total | Strictest human mobility restrictions, public transportation stopped |
| Delhi | India | 24-Mar | 31-May | Total | Only those who work for “essential services” can move freely, public transportation stopped |
| Lima | Peru | 15-Mar | 30-Jun | Total | Gender-based mobility restriction |
| Madrid | Spain | 14-Mar | 4-May | Total | Outdoor physical exercise banned |
| Tehran | Iran | 13-Mar | 17-Apr | Total | Shops, streets and roads cleared |
| Moscow | Russia | 30-Mar | 8-Jun | Total | Digital pass required for car or public transport use |
| Rome | Italy | 9-Mar | 3-May | Total | Only allowed to go out alone near home |
| Paris | France | 17-Mar | 10-May | Total | Permit required for going out |
| London | U.K. | 23-Mar | 10-May | Total | Only go outside to buy food, to exercise once a day, or go to work if they absolutely cannot work from home |
| Johannesburg | South Africa | 26-Mar | 30-Apr | Total | Severe restrictions on travel and movement |
| Sydney | Australia | 23-Mar | 27-Apr | Total | Stay-at-home except for essential outings |
| Beijing | China | 10-Feb | 27-Mar | Partial | Ordering residential communities and villages to limit access for outsiders |
| New York City | U.S.A | 22-Mar | 7-Jun | Partial | Statewide stay-at-home order |
| Los Angeles | U.S.A | 19-Mar | 7-May | Partial | Statewide stay-at-home order, social pressure for violations |
| Mexico City | Mexico | 23-Mar | 30-May | Partial | Closing gyms, museums and clubs, banning big gathering, restricting mobility to areas less affected |
| Sao Paulo | Brazil | 24-Mar | 10-May | Partial | Social distancing measures |
| Berlin | Germany | 17-Mar | 19-Apr | Partial | Rules differing across states. Only go out alone or with a person from same household. |
| Seoul | South Korea | 24-Feb | 6-May | -- | No strict lockdown, social distancing applied, no movement restriction |
| Tokyo | Japan | 7-Apr | 24-May | -- | State of emergency, encouraged social distancing |
| Istanbul | Turkey | 21-Mar | 10-May | -- | Weekend curfew |
| Continent | City | Country | NO2 | SO2 | CO | Ground-level O3 | PM2.5 | PM10 | ||||||
|---|---|---|---|---|---|---|---|---|---|---|---|---|---|---|
| To 17–19 | To 19 | To 17–19 | To 19 | To 17–19 | To 19 | To 17–19 | To 19 | To 17–19 | To 19 | To 17–19 | To 19 | |||
| Asia | Wuhan | China | −63.3 | −58.3 | −28.6 | −11.2 | −17.3 | −13.8 | +45.6 | +54.2 | −26.2 | −23.2 | −31.9 | −30.4 |
| Beijing | −41.8 | −33.7 | −60.3 | −33.5 | −7.1 | +92.4 | +10.7 | +5.1 | −15.2 | −7.2 | +0.1 | −14.8 | ||
| Seoul | South Korea | −28.0 | −25.8 | −28.3 | −20.8 | −14.5 | −14.6 | +10.9 | +10.2 | −21.2 | −19.1 | −8.8 | +19.5 | |
| Tokyo | Japan | −25.8 | −19.5 | −37.6 | −28.1 | −3.1 | +7.3 | −5.3 | −6.7 | −22.9 | −11.4 | −24.1 | −11.0 | |
| Delhi | India | −57.7 | −60 | −23.7 | −31.7 | −22.8 | −34.0 | +19.3 | +36.3 | −31.0 | −27.6 | −47.9 | −45.9 | |
| Tehran * | Iran | NA | −35.2 | NA | NA | NA | NA | NA | NA | NA | −21.9 | NA | −37.9 | |
| Istanbul | Turkey | −36.5 | −19.9 | +53.8 | +29.3 | +48.5 | +2.9 | −8.3 | −43.6 | −19.1 | −3.4 | −22.4 | −19.0 | |
| Europe | Moscow † | Russia | −35.8 | −39.8 | −25.5 | −25.8 | −18.8 | −18.7 | NA | +6.4 | −12.7 | −25.9 | −29.6 | −42.5 |
| Berlin | Germany | −45.0 | −17.6 | NA | +29.5 | NA | NA | +16.4 | +3.9 | −27.4 | −22.5 | −15.1 | −10.3 | |
| Rome | Italy | −45.0 | −36.4 | −8.6 | −3.8 | NA | NA | +4.4 | +2.9 | +0.1 | +8.3 | −6.6 | −1.8 | |
| Paris | France | −47.8 | −46.4 | −20.5 | +13.5 | NA | NA | +24.0 | +26.8 | −4.5 | −13 | −14.7 | −22.3 | |
| Madrid | Spain | −56 | −51.6 | +7.1 | −54.8 | NA | NA | −4.9 | −9.9 | −2.4 | −1.6 | −17.2 | −19.8 | |
| London | U. K | −39.6 | −37.8 | +1.3 | +0.6 | −35.0 | −53.5 | +47.7 | +48.0 | −8.8 | −14 | −4.7 | −10 | |
| North America | New York City # | U. S | −33.7 | −27.5 | NA | NA | −22.0 | −20.7 | +1.0 | −6.3 | −30.8 | −27.6 | NA | NA |
| Los Angeles | −29.0 | −24.2 | NA | NA | −36.9 | 7.2 | −11.7 | −3.5 | −20.4 | −13.7 | −18.1 | +2.0 | ||
| Mexico City | Mexico | −35.2 | −24.9 | −14.9 | +2.2 | −1.2 | +4.0 | +7.9 | −0.1 | −3.7 | −8.3 | −8.8 | −15.5 | |
| South America | Lima ‡ | Peru | −63.4 | −50.5 | −18.1 | −35.2 | −58.6 | −61.8 | −28.5 | −42.9 | −27.1 | −19.4 | −42.3 | −31.7 |
| Sao Paulo | Brazil | −36.0 | −37.8 | −27.3 | −23.2 | −31.8 | −32.7 | +33.9 | +24.9 | −11.3 | −18.3 | −5.4 | −12.9 | |
| Africa | Johannesburg § | South Africa | NA | −23.0 | NA | −13.9 | NA | 5.0 | NA | +9.0 | NA | −31.3 | NA | −33.1 |
| Oceania | Sydney | Australia | −15.0 | −11.1 | NA | NA | −25.5 | −24 | +5.2 | +5.6 | −34.7 | −29.2 | −19.7 | −17.0 |
Publisher’s Note: MDPI stays neutral with regard to jurisdictional claims in published maps and institutional affiliations. |
© 2020 by the authors. Licensee MDPI, Basel, Switzerland. This article is an open access article distributed under the terms and conditions of the Creative Commons Attribution (CC BY) license (http://creativecommons.org/licenses/by/4.0/).
Share and Cite
Fu, F.; Purvis-Roberts, K.L.; Williams, B. Impact of the COVID-19 Pandemic Lockdown on Air Pollution in 20 Major Cities around the World. Atmosphere 2020, 11, 1189. https://doi.org/10.3390/atmos11111189
Fu F, Purvis-Roberts KL, Williams B. Impact of the COVID-19 Pandemic Lockdown on Air Pollution in 20 Major Cities around the World. Atmosphere. 2020; 11(11):1189. https://doi.org/10.3390/atmos11111189
Chicago/Turabian StyleFu, Franck, Kathleen L. Purvis-Roberts, and Branwen Williams. 2020. "Impact of the COVID-19 Pandemic Lockdown on Air Pollution in 20 Major Cities around the World" Atmosphere 11, no. 11: 1189. https://doi.org/10.3390/atmos11111189
APA StyleFu, F., Purvis-Roberts, K. L., & Williams, B. (2020). Impact of the COVID-19 Pandemic Lockdown on Air Pollution in 20 Major Cities around the World. Atmosphere, 11(11), 1189. https://doi.org/10.3390/atmos11111189


