The Combination of a Diversified Intake of Carbohydrates and Fats and Supplementation of Vitamin D in a Diet Does Not Affect the Levels of Hormones (Testosterone, Estradiol, and Cortisol) in Men Practicing Strength Training for the Duration of 12 Weeks


Abstract
:1. Introduction
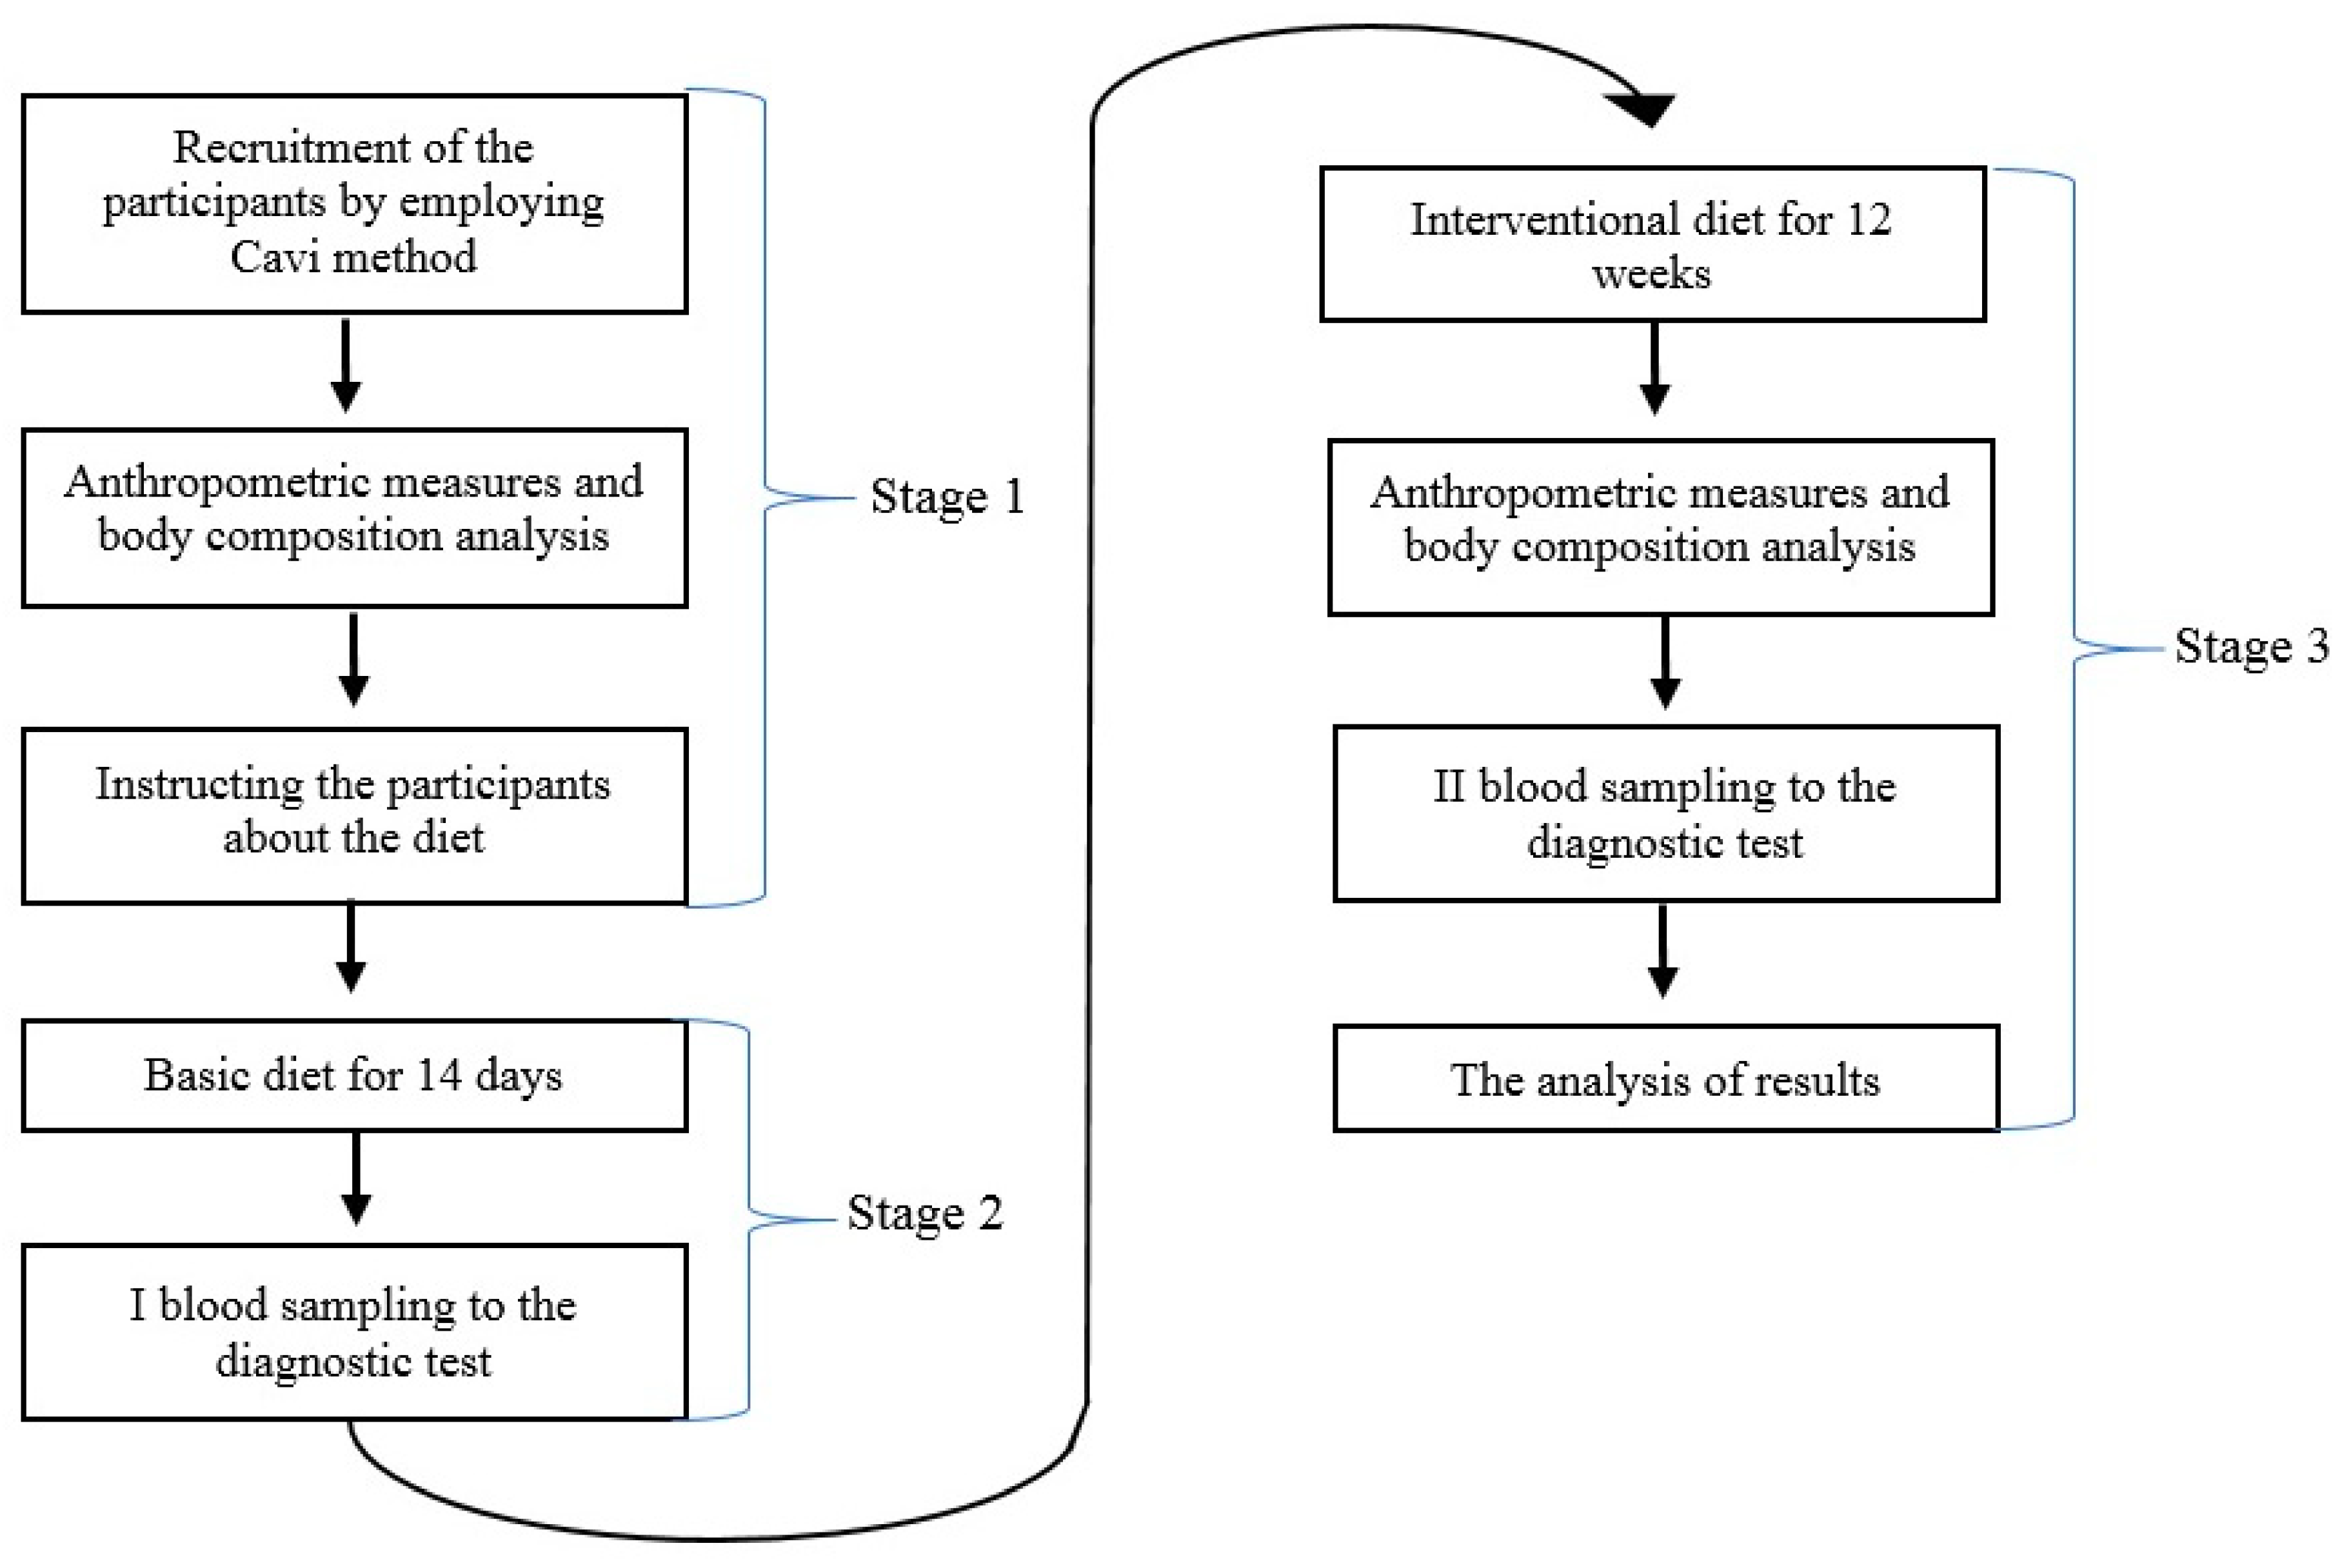
2. Methodology
3. Results
4. Discussion
5. Conclusions
Author Contributions
Funding
Conflicts of Interest
References
- Travison, T.G.; Araujo, A.B.; O'Donnell, A.B.; Kupelian, V.; McKinlay, J.B. A Population-Level Decline in Serum Testosterone Levels in American Men. J. Clin. Endocrinol. Metab. 2007, 92, 196–202. [Google Scholar] [CrossRef] [PubMed] [Green Version]
- Lane, A.R.; Duke, J.W.; Hackney, A.C. Influence of dietary carbohydrate intake on the free testosterone: Cortisol ratio responses to short-therm intensive exercise training. Eur. J. Appl. Physiol. 2010, 108, 1125–1131. [Google Scholar] [CrossRef] [PubMed]
- Durkalec-Michalski, K. Ocena Wpływu Suplementacji Kwasem Beta-Hydroksy-Beta-Metylomasłowym (HMB) na Wskaźniki Wydolności Fizycznej Zawodników Wybranych Dyscyplin Sportowych. Ph.D. Thesis, Uniwersytet Przyrodniczy w Poznaniu, Poznań, Poland, 2012. [Google Scholar]
- Cangemi, R.; Friedmann, A.J.; Holloszy, J.O.; Fontana, L. Long-term effects of calorie restriction on serum sex-hormone concentrations in men. Aging Cell 2010, 9, 236–242. [Google Scholar] [CrossRef] [PubMed] [Green Version]
- Anderson, K.E.; Rosner, W.; Khan, M.S. Diet-hormone interactions: Protein/carbohydrate ratio alters reciprocally the plasma levels of testosterone and cortisol and their respective binding globulins in man. Life Sci. 1987, 40, 1761–1768. [Google Scholar] [CrossRef]
- Roland, A.V.; Moenter, S.M. Regulation of gonadotropin-releasing hormone neurons by glucose. Trends Endocrinol. Metab. 2011, 22, 443–449. [Google Scholar] [CrossRef] [Green Version]
- Longcope, C.; Feldman, H.A.; McKinlay, J.B. Diet and Sex Hormone-Binding Globulin. J. Clin. Endocrinol. Metab. 2010, 85, 293–296. [Google Scholar] [CrossRef]
- Blomberg Jensen, M.; Nielsen, J.E.; Jørgensen, A.; Rajpert-De Meyts, E.; Kristensen, D.M.; Jørgensen, N.; Skakkebaek, N.E.; Juul, A.; Leffers, H. Vitamin D receptor and vitamin D metabolizing enzymes are expressed in the human male reproductive tract. Hum. Reprod. 2010, 25, 1303–1311. [Google Scholar] [CrossRef] [Green Version]
- Lee, M.D.; Tajar, A.; Pye, R.S. Association of hypogonadism with vitamin D status: The European Male Ageing Study. Eur. J. Endocrinol. 2010, 1, 77–85. [Google Scholar] [CrossRef] [Green Version]
- Wehr, E.; Pilz, S.; Boehm, B.O.; Marz, W.; Obermayer-Pietsch, B. Association of vitamin D status with serum androgen levels in men. Clin. Endocrinol. 2010, 73, 243–248. [Google Scholar] [CrossRef]
- Nimptsch, K.; Platz, E.A.; Willet, W.C.; Giovannucci, E. Association between plasma 25-OH vitamin D and testosterone levels in men. Clin. Endocrinol. 2012, 77, 106–112. [Google Scholar] [CrossRef] [Green Version]
- Pilz, S.; Frisch, S.; Koertke, H.; Kuhn, J.; Dreier, J.; Obermayer-Pietsch, B.; Wehr, E.; Zittermann, A. Effect of vitamin D supplementation on testosterone levels in men. Horm. Metab. Res. 2011, 43, 223–225. [Google Scholar] [CrossRef]
- Płudowski, P.; Ducki, C.; Konstantynowicz, J.; Jaworski, M. Vitamin D status in Poland. Pol. Arch. Med. Wewn. 2016, 126, 530–539. [Google Scholar] [CrossRef] [PubMed] [Green Version]
- Lewandowicz, M.; Krzymińska-Siemaszko, R.; Wieczorowska-Tobis, K. A review of methods of dietary assessment with the distinction of food photography method with possibility of their use in elderly people. Geriatria 2015, 9, 3–10. [Google Scholar]
- Jarosz, M. Normy żywienia dla Populacji Polski. 2017. Available online: https://ncez.pl/upload/normy-net-1.pdf (accessed on 31 October 2020).
- Jarosz, M. Normy żywienia dla Populacji Polski. 2012. Available online: http://www.izz.waw.pl/attachments/article/33/NormyZywieniaNowelizacjaIZZ2012.pdf (accessed on 31 October 2020).
- ACSM Position Statements. Nutrition and Athletic Performance. MSSE 2016, 48, 543–568. [Google Scholar]
- Lokeshwar, S.D.; Patel, P.; Fantus, R.J.; Halpern, J.; Chang, C.; Kargi, A.Y.; Ramasamy, R. Decline in Serum Testosterone Levels Among Adolescent and Young Men in the USA. Eur. Urol. Focus 2020, 18, 1–4. [Google Scholar] [CrossRef] [PubMed]
- Bishop, D.T.; Meikle, A.W.; Slattery, M.L.; Stringham, J.D.; Ford, M.H.; West, D.W. The effect of nutritional factors on sex hormone levels in male twins. Genet. Epidemiol. 1988, 5, 43–59. [Google Scholar] [CrossRef] [PubMed]
- Nagata, C.; Takatsuka, N.; Kawakami, N.; Shimizu, H. Relationships between types of fat consumed and serum estrogen and androgen concentrations in Japanese men. Nutr. Cancer 2000, 38, 163–167. [Google Scholar] [CrossRef]
- Volek, J.S.; Kraemer, W.J.; Bush, J.A. Testosterone and cortisol in relationship to dietary nutrients and resistance exercise. J. Appl. Physiol. 1997, 82, 49–54. [Google Scholar] [CrossRef] [Green Version]
- Gromadzka-Ostrowska, J.; Przepiorka, M.; Romanowicz, K. Influence of dietary fatty acids composition, level of dietary fat and feeding period on some parameters of androgen metabolism in male rats. Reprod. Biol. 2002, 2, 277–293. [Google Scholar]
- Marra, C.A.; de Alaniz, M.J. Influence of testosterone administration on the biosynthesis of unsaturated fatty acids in male and female rats. Lipids 1989, 24, 1014–1019. [Google Scholar] [CrossRef]
- Dorgan, J.F.; Judd, J.T.; Longcope, C. Effects of dietary fat and fiber on plasma and urine androgens and estrogens in men: A controlled feeding study. Am. J. Clin. Nutr. 1996, 64, 850–855. [Google Scholar] [CrossRef] [PubMed]
- Roli, L.; De Vincentis, S.; Rocchi, M.B.; Trenti, T.; De Santis, M.C.; Savino, G. Testosterone, cortisol, hGH, and IGF-1 levels in an Italian female elite volleyball team. Health Sci. Rep. 2018, 9, 32. [Google Scholar] [CrossRef] [PubMed]
- Anderson, T.; Wideman, L. Exercise and the Cortisol Awakening Response: A systematic Review. Sports Med. Open 2017, 10, 1–15. [Google Scholar] [CrossRef] [PubMed] [Green Version]
- Rusińska, A.; Płudowski, P.; Walczak, M.; Borszewska-Kornacka, M.K.; Bossowski, A.; Chlebna-Sokół, D.; Czech-Kowalska, J.; Dobrzańska, A.; Franek, E.; Helwich, E.; et al. Vitamin D Supplementation Guidelines for General Population and Groups at Risk of Vitamin D Deficiency in Poland—Recommendations of the Polish Society of Pediatric Endocrinology and Diabetes and the Expert Panel with Participation of National Specialist Consultants and Representatives of Scientific Societies—2018 Update. Front. Endocrinol. 2018, 9, 246. [Google Scholar]
- Nickols-Richardson, S.M.; Beiseigel, J.M.; Gwazdauskas, F.C. Eating restraint is negatively associated with biomarkers of bone turnover but not measurements of bone mineral density in young women. J. Am. Diet. Assoc. 2006, 106, 1095–1101. [Google Scholar] [CrossRef]
- Nattiv, A.; Loucks, A.B.; Manore, M.M.; Sanborn, C.F.; Sundgot-Borgen, J.; Warren, M.P.; American College of Sports Medicine. American College of Sports Medicine position stand. The female athlete triad. Med. Sci. Sports Exerc. 2007, 39, 1867–1882. [Google Scholar]
- Mielgo-Ayuso, J.; Calleja-González, J.; Urdampilleta, A.; León-Guereño, P.; Córdova, A.; Caballero-García, A.; Fernandez-Lázaro, D. Effects of vitamin D supplementation on haematological values and muscle recovery in elite male traditional rowers. Nutrients 2018, 10, 1968. [Google Scholar] [CrossRef] [Green Version]
- Ramezani Ahmadi, A.; Mohammadshahi, M.; Alizadeh, A.; Ahmadi Angali, K.; Jahanshahi, A. Effects of vitamin D3 supplementation for 12 weeks on serum levels of anabolic hormones, anaerobic power, and aerobic performance in active male subjects: A randomized, double-blind, placebo-controlled trial. Eur. J. Sport Sci. 2020, 18, 1–13. [Google Scholar] [CrossRef]
- Nimitphong, H.; Saetung, S.; Chanprasertyotin, S.; Chailurkit, L.; Ongphiphadhanakul, B. Changes in circulating25-hydroxyvitamin D according to vitamin D binding protein genotypes after vitamin D 3 or D 2 supplementation. Nutr. J. 2013, 12, 39. [Google Scholar] [CrossRef] [Green Version]
- Dahlquist, D.T.; Dieter, B.P.; Koehle, M.S. Plausible ergogenic effects of vitamin D on athletic performance and recovery. J. Int. Soc. Sport Nutr. 2015, 12, 33. [Google Scholar] [CrossRef] [Green Version]

| Variable | LCHF Group | LFHC Group |
|---|---|---|
| (n = 27) | (n = 28) | |
| Mean ± SD | Mean ± SD | |
| Caloric value [kcal] | The caloric value was in line with the energy requirements of each man participating in the research | |
| Proteins [g] | 2.0 g/kg body mass (about 20% of energy) | |
| Fats in total [g] | 40.2 ± 8.8% | 21.7 ± 1.9% |
| Carbohydrates [g] | 38.7 ± 6.3% | 58.2 ± 4.8% |
| Variable | LCHF Group | LFHC Group |
|---|---|---|
| (n = 27) | (n = 28) | |
| Mean ± SD | Mean ± SD | |
| Caloric value [kcal] | 2938 ± 153.9 | 2687 ± 203.7 |
| Caloric value [kcal/kg body mass] | 35.36 ± 1.85 | 35.41 ± 2.68 |
| Proteins [g] | 142.5 ± 9.8 | 129 ± 16.2 |
| Proteins [g/kg fat free body mass] | 2.06 ± 0.13 | 2.01 ± 0.25 |
| Fats in total [g] | 131.3 ± 28.9 | 65 ± 5.8 |
| Carbohydrates [g] | 284.8 ± 46.9 | 391.2 32.9 |
| Fiber [g] | 41.7 ± 7 | 44.6 ± 6.9 |
| Saturated fats [g] | 33.4 ± 4.8 | 19 ± 2.9 |
| Monosaturated fats [g] | 67.9 ± 10.6 | 24.7 ± 3.5 |
| Polysaturated fats [g] | 25 ± 3.26 | 13.9 ± 2.6 |
| Variable | LCHF Group | LFHC Group | p * | ||
|---|---|---|---|---|---|
| (n = 27) | (n = 28) | ||||
| Mean ± SD | Median | Mean | Median | ||
| (Min–Max) | (Min–Max) | ||||
| Age [years] | 28.33 ± 3.01 | 29 | 26.71 ± 3.56 | 26.5 | 0.06 |
| (23–34) | (19–35) | ||||
| Height [cm] | 184.16 ± 5.66 | 185 | 178.71 ± 5.07 | 178.3 | 0.0002 |
| (171–195) | (168–192) | ||||
| Body mass [kg] | 83.07 ± 7.4 | 83.4 | 75.88 ± 4.79 | 76.6 | 0.00001 |
| (60.4–95.4) | (65–89) | ||||
| BMI [kg/m2] | 24.34 ± 1.07 | 24.7 | 23.7 ± 1.2 | 23.9 | 0.03 |
| (20.4–26.1) | (20.1–25.6) | ||||
| Body fat mass [kg] | 13.9 ± 3.21 | 14 | 11.76 ± 3.06 | 12.1 | 0.01 |
| (6.7–19.8) | (5.1–16.3) | ||||
| Fat content [%] | 16.33 ± 3.24 | 17.1 | 16.98 ± 9.66 | 16.2 | 0.5 |
| (9.8–21.2) | (7.5–19.1) | ||||
| Free fat mass [kg] | 69.17 ± 5.76 | 70.4 (53.7–78.9) | 64.12 ± 3.87 | 64.2 (56.4–73.8) | 0.0002 |
| Body hydration [%] | 59.46 ± 2.78 | 59.2 | 61.18 ± 3.30 | 60.9 | 0.07 |
| (55–64.7) | (55.9–69.9) | ||||
| Variable (Reference Range) | LCHF Group | LFHC Group | p * | ||
|---|---|---|---|---|---|
| (n = 27) | (n = 28) | ||||
| Mean ± SD | Median | Mean ± SD | Median | ||
| (Min–Max) | (Min–Max) | ||||
| Testosterone [ng/dl] | 569.44 ± 134.85 | 542 | 589.39 ± 152.14 | 613 | 0.64 |
| (249.00–836.00) | (319–830) | (249–825) | |||
| Estradiol [pg/mL] | 25.81 ± 8.27 | 24.4 | 25.03 ± 7.88 | 23.9 | 0.71 |
| (11.30–43.20) | (14.1–43) | (11.1–40.7) | |||
| Cortisol [mcg/dl] | 14.17 ± 3.04 | 14.6 | 14.17 ± 3.35 | 15 | 0.56 |
| (4.82–19.5) | (7.7–19.3) | (8.6–19.8) | |||
| SHGB [nmol/l] | 42.21 ± 16.19 | 39.8 | 44.46 ± 15.15 | 41.6 | 0.4 |
| (18.30–54.10) | (21.5–52) | (21.5–50.9) | |||
| 0.25 (OH) D [ng/mL] | 20.34 ± 9.28 | 18.9 | 23.52 ± 10.52 | 22.2 | 0.18 |
| (30.00–50.00) | (8–29) | (9.9–29.1) | |||
| Variable | LCHF Group | LFHC Group | ||||||
|---|---|---|---|---|---|---|---|---|
| (n = 27) | (n = 28) | |||||||
| Mean ± SD | Median | Change | p * | Mean ± SD | Median | Change | p * | |
| (Min–Max) | (Min–Max) | |||||||
| Testosterone [ng/dl] | 577.18 | 592 | 2.50% | 0.75 | 625.57 | 591 | 11.90% | 0.2 |
| ±144.79 | (281–810) | ±138.1 | (376–881) | |||||
| Estradiol [pg/mL] | 23.87 | 23.2 | −3.4% | 0.08 | 23.72 | 21.6 | −2% | 0.24 |
| ±8.79 | (12–41) | ±8.23 | (11–40.8) | |||||
| Cortisol [mcg/dl] | 13.16 | 13 | −4.5% | 0.09 | 13.93 | 14.2 | −3.5% | 0.03 |
| ±2.75 | (8–19.9) | ±2.63 | (8.5–18.4) | |||||
| SHGB [nmol/l] | 42.65 | 40.1 | 2.90% | 0.77 | 46.25 | 43.4 | 8.80% | 0.87 |
| ±16.14 | (22–51) | ±17.39 | (21.9–53.1) | |||||
| 0.25 (OH) D [ng/mL] | 34.25 | 31 | 95% | 0.01 | 32.79 | 33.5 | 58.30% | 0.01 |
| ±8.91 | (21–56) | ±7.46 | (18.9–49.9) | |||||
Publisher’s Note: MDPI stays neutral with regard to jurisdictional claims in published maps and institutional affiliations. |
© 2020 by the authors. Licensee MDPI, Basel, Switzerland. This article is an open access article distributed under the terms and conditions of the Creative Commons Attribution (CC BY) license (http://creativecommons.org/licenses/by/4.0/).
Share and Cite
Wrzosek, M.; Woźniak, J.; Włodarek, D. The Combination of a Diversified Intake of Carbohydrates and Fats and Supplementation of Vitamin D in a Diet Does Not Affect the Levels of Hormones (Testosterone, Estradiol, and Cortisol) in Men Practicing Strength Training for the Duration of 12 Weeks. Int. J. Environ. Res. Public Health 2020, 17, 8057. https://doi.org/10.3390/ijerph17218057
Wrzosek M, Woźniak J, Włodarek D. The Combination of a Diversified Intake of Carbohydrates and Fats and Supplementation of Vitamin D in a Diet Does Not Affect the Levels of Hormones (Testosterone, Estradiol, and Cortisol) in Men Practicing Strength Training for the Duration of 12 Weeks. International Journal of Environmental Research and Public Health. 2020; 17(21):8057. https://doi.org/10.3390/ijerph17218057
Chicago/Turabian StyleWrzosek, Michał, Jakub Woźniak, and Dariusz Włodarek. 2020. "The Combination of a Diversified Intake of Carbohydrates and Fats and Supplementation of Vitamin D in a Diet Does Not Affect the Levels of Hormones (Testosterone, Estradiol, and Cortisol) in Men Practicing Strength Training for the Duration of 12 Weeks" International Journal of Environmental Research and Public Health 17, no. 21: 8057. https://doi.org/10.3390/ijerph17218057