Abstract
Clearance of terrestrial wetland vegetation and rainfall variations affect biodiversity. The rainfall trend–NDVI (Normalized Difference Vegetation Index) relationship was examined to assess the extent to which rainfall affects vegetation productivity within Nylsvley, Ramsar site in Limpopo Province, South Africa. Daily rainfall data measured from eight rainfall stations between 1950 and 2016 were used to generate seasonal and annual rainfall data. Mann-Kendall and quantile regression were applied to assess trends in rainfall data. NDVI was derived from satellite images from between 1984 and 2003 using Zonal statistics and correlated with rainfall of the same period to assess vegetation dynamics. Mann-Kendall and Sen’s slope estimator showed only one station had a significant increasing rainfall trend annually and seasonally at p < 0.05, whereas all the other stations showed insignificant trends in both rainfall seasons. Quantile regression showed 50% and 62.5% of the stations had increasing annual and seasonal rainfall, respectively. Of the stations, 37.5% were statistically significant at p < 0.05, indicating increasing and decreasing rainfall trends. These rainfall trends show that the rainfall of Nylsvley decreased between 1995 and 2003. The R2 between rainfall and NDVI of Nylsvley is 55% indicating the influence of rainfall variability on vegetation productivity. The results underscore the impact of decadal rainfall patterns on wetland ecosystem change.
1. Introduction
Vegetation is critical for assessing the conditions of terrestrial wetland ecosystems impacted by global climate changes [1]. Wetland Vegetation plays crucial roles in habitat provision for wildlife, preventing soil loss, slowing water movement, and in the process of removing pollutants and purifying water [1,2,3]. Climate change warms the atmosphere, changes rainfall patterns and timing, leaving some parts of the world dryer and others wetter than before [4,5,6,7], and this impacts on wetland ecological processes [7]. The potential of climate change together with its effects on rainfall distribution is a threat to vegetation development. In the continent of Africa, rainfall amounts are predicted to decrease, especially in Sub-Saharan Africa, forcing already high temperatures to further increase [8,9,10]. The more rainfall received at a time implies more vegetation cover [11], especially in semi-arid regions where rainfall is erratic and is exacerbated by global climate change. Rainfall affects both the spatial and temporal patterns of water availability on the earth’s surface and is used in climate science to trace the magnitude and extent of variability of climate change [12,13,14]. The emphasis is on investigating the dynamics of rainfall and vegetation through constant monitoring as it provides policymakers with information for making informed decisions and can predict future patterns [15,16,17].
Several studies have investigated the relationship between vegetation and rainfall and among these is the Normalized Difference Vegetation Index (NDVI), which is a good proxy for vegetation greenness and productivity [18,19,20,21,22,23]. NDVI is derived from satellite images and has been used to examine vegetation trends and analysis over time and can be correlated with rainfall to determine long-term climate change effects [24,25,26]. Rainfall, on the other hand, is discrete in nature and difficult to measure in space but correlates well with NDVI [8]. Detecting changes using annual and seasonal rainfall overtime may depict some trends in rainfall over time [27,28] which can assist to explain vegetation growth and climate change effects. This data is obtained mainly through networks of rainfall stations in any given area. Yang et al. [11] note that rainfall records suffer incomplete measured rainfall data or a shortage of rainfall stations in the sub-Saharan region except for South Africa.
Within Nylsvley, a Ramsar site of international importance, restoration activities have been implemented since 2014 to aid in the promotion of natural vegetation regrowth from previous anthropogenic activities that impacted on the wetlands’ vegetation. The study by Huang et al. [1] stipulated that vegetation clearance leads to excessive soil, water, and biodiversity loss [29,30,31,32], making it a serious issue that prompted the Government of South Africa to implement restoration activities to save Nylsvley and its unique biodiversity. About 80 million South African Rand is spent annually on wetland-restoration projects in South Africa with Nylsvley having a budget of over 7 million South African Rand in 2016 alone [33], hence the need to fully understand climate variations to make informed restoration decisions. Pan et al. [21] stipulated that removal of vegetation in wetland ecosystems is reflected in poor vegetation productivity in these ecosystems. Nylsvley has been linked to previous anthropogenic activities such as agriculture and grazing which has impacted vegetation recovery since the formation of the reserve in 1974 [34,35].
Nylsvley, despite its importance, is at risk of further deterioration, hence the need to analyse if rainfall received in this region has been constant over time, as well as the need to relate the Nylsvley station rainfall to the NDVI of Nylsvley reserve. This provides critical information for understanding climate change impacts on natural vegetation development in this restored wetland ecosystems [36]. However, several studies in Nylsvley by these authors [17,31,37], including those by [38,39,40,41], did not attempt to assess climate change impacts in this wetland. Elsewhere in Limpopo province of South Africa, a study by Whitecross et al. [42] focused only on rainfall trends in Levubu catchment without relating it to environmental attributes, particularly vegetation. This is crucial as the availability of water in wetland systems is critical for flora and fauna which in-turn attracts tourists and boosts the regional economy. Despite all these studies conducted in the province and in the Nylsvley wetland owing to its importance, there is a dearth of literature that focuses on the impacts of climate change on this semi-arid restored wetland. Limited information on the conditions of these impacts results in a limited understanding of the state of climate change impacts on this wetland.
An attempt is made to study long term rainfall trends and their relationship to the vegetation of the system to depict climate change impacts. Correlating rainfall and NDVI has been done in Northern coastal regions and most recently in semi-arid regions of China [43], and to the best of our knowledge assessing the relationship of NDVI and rainfall remains unresolved especially in restored wetlands of semi-arid regions of South Africa. Asfaw et al. [10] state that micro-scale studies of rainfall trends are critical in understanding local scale manifestation of the effects of climate change leading to the development of specific interventions or monitoring tools. For the development of better management options, local-level rainfall trend analysis data are used to compare with the country or regional data sets. To bridge this gap, a co-correlation model, will be utilised to understand the NDVI-rainfall relationship and the impact of climate on the regeneration of vegetation in this area. Moreover, this Ramsar site has unique biota such as the grass Oryza longistaminata, among others, which are restricted only to Nylsvley in South Africa [44].
We hypothesised that there is a relationship between the NDVI and rainfall patterns in Nylsvley. The findings provide additional insights for understanding climate variability within the Nyl River system (NRS), including the restored Nylsvley wetland. More light will also be shed on our understanding of the climate change impacts on vegetation growth in wetlands of semi-arid regions and assists with proper management and monitoring of this and similar wetlands for early warning against negative effects. Thus, an attempt was made to investigate the diurnal seasonal and annual rainfall in the NRS to determine the significant trends in rainfall from the year 1950 to 2016. It also explored the seasonal rainfall–NDVI relationship in Nylsvley between 1983 and 2003 as a contribution towards understanding the local-level impacts of climate variations in the restored wetland vegetation ecosystem. In addition, there is little evidence of studies that show long-term trend changes in rainfall and their ecological impacts on vegetation growth within the Nylsvley wetland. Restoration activities are costly hence the need to conduct such a study to fully understand climate change impacts within this wetland.
2. Materials and Methods
2.1. Study Area
Nylsvley floodplain (3975 hectares in size) is located to the east of Waterberg between Modimolle and Mookgophong in Limpopo Province of South Africa. Figure 1 shows the location of the Nylsvley Nature Reserve within the NRS [39,45]. The flood plain is located at 28°42.00′ East and 24°39.00′ South, within the Nyl River system which is managed by the Limpopo Conservation Authority. It was declared a Ramsar site of international conservation importance in 1998, and the wetland is largely recognized as it represents one of the most important avian conservation areas in South African wetlands [29,39,44].
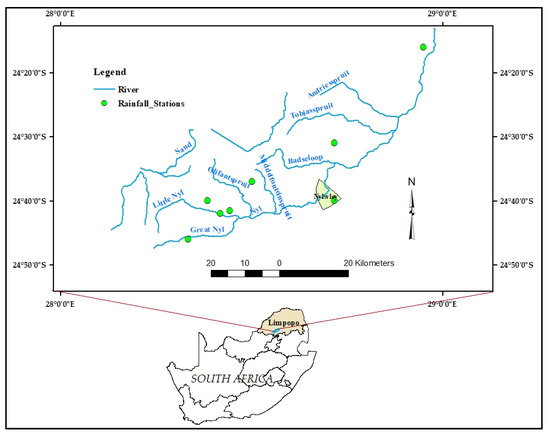
Figure 1.
Location of the study area, Nylsvley Nature Reserve and distribution of rainfall stations Source: GIS data sets, University of Venda.
The floodplain houses over 100 aquatic bird species, 57 of which breed in this wetland. This makes it an important nesting and feeding site for migratory birds and several endangered species. There are 23 waterfowl bird species found in this wetland that are listed in the International Union for Conservation of Nature Red data book of threatened species [46,47]. The wetland, apart from its conservation value, is also agriculturally important as it provides animals with extensive grasslands for year-round grazing.
Nyslvley is in a semi-arid region characterized by hot-wet and warm-dry seasons with an average annual rainfall of 630 mm [35,45,46]. The NRS catchment is underlain by sedimentary rocks of the Waterberg, mainly composed of sandstone, grit, mudstone, siltstone, shale, and conglomerate [48]. The soils are predominantly acidic sands, which are highly variable, gravels and loams occurring at ~1200 mm depth with altitude ranging from 1180 to 1508 m [48]. The Nyslvley flood plain, located in the middle of NRS is characterised by both well and poorly drained soils, black clay soils, and alluvial soils [1,2]. Nylsvley has a history of being grazed by domestic and non-domesticated animals.
There is highly seasonal rainfall, 95% of it occurs between November and March [35] with a mid-season dry spell during significant periods of growth. Winters (May to July) are dry and springs (September) have little to no rainfall (10 mm on average). The mean annual temperature is 18 °C with temperatures ranging from −6 °C (winter) to 39 °C (summer) [49]. The catchment area lies in ~90% natural savanna bushveld and 10% croplands [49]. Landuse activities include agriculture (growing of crops and rearing of animals), game farming, and settlements. The Nyl River systems (NRS) consist of small tributaries that lie in the Waterberg plateau [50].
Different wetland vegetation species cover the park, including those in salt marshes, floodplains, and grasslands, being mostly Leersia hexandra, Eleocharis dregeana, and the grass Oryza longistaminata, which is restricted to Nylsvley only [44]. The most dominant species found in Nylsvley freshwater swamps are reeds (Phragmites australis). Rich underlying geological formations are responsible for supporting the unique biodiversity of plant and animal life [51].
Nylsvley Nature Reserve (NNR), which is a Ramsar site of international importance, has been under threat for the past two decades. Studies show that the water quality is poor and the population of aquatic bird species visiting NNR wetland has reduced drastically by 80–90% [28,30,36]
The Nylsvley freshwater wetland is part of the Nyl River system situated in the semi-arid savannah region in Limpopo province of South Africa. This freshwater ecosystem is the largest inland floodplain covering an area of about 16,000 ha when fully inundated. The wetland’s ability to provide groundwater recharge throughout the year makes it valuable and prompts the need for its conservation [45]. Rowberry et al. [52] note that the ecological status of the freshwater wetland has been threatened by the increasing developments within upstream catchments affecting the availability of water and vegetation in the floodplain. Sustainable conservation and management of wetlands require regular monitoring and assessments to check on the status and changes of vegetation in wetland zones [53]. Wetland assessment involves the inventory and mapping of vegetation species within the wetlands [54,55]. Identification, mapping, and assessing the condition of freshwater wetlands is of paramount importance for various management and planning activities at global, regional, and local scales [53,56,57]. This offers information on wetland vegetation types, their distribution and phenology, and acts as a good indicator in cases of assessing wetland deterioration [53,58,59].
Originally, the NNR was part of a privately-owned property that was active in agriculture. Due to the reserve’s unique landscape and biodiversity, it was commissioned to the government in 1974, and the other portion, Vogelfontein was added in 1997. The nature reserve harbors South Africa’s largest freshwater flood plain, a variety of birds, and many other faunal species. Since the year 2000, the improvement of ecological integrity has become the key objective with a clear shift from projects at a habitat scale to integrated projects of the entire ecosystem [60]. Simenstad et al. [61] view the 21st century as a period for fixing global environmental problems that were caused by human ignorance. In this century, the desire is to restore the disturbed areas and assess the progress of such restoration activities, as ecosystem functioning is impacted by alterations or changes in the landscapes [61]. It is vital to note that restoration plays a critical role in environmental management and policy development for monitoring purposes [62]. This helps in understating the benefits of most restoration efforts done today especially the development of vegetation in semi-arid regions under climate change projected period.
2.2. Data Availability
To assess and understand the trends in rainfall within the NRS, daily rainfall data measured from eight rainfall stations ranging from 27 to 66 years between the years 1950 and 2016 were studied. The selected long-term period provided a common data set for rainfall and allowed for reliable climatic variations in this study. The rainfall data set was obtained from the South African Weather Service (SAWS) and Agriculture Research Council (ARC), two and six stations, respectively. This data has the advantage of quality control with information on missing or unaudited data explained. However, it should be noted that climate time series data are affected by several non-climatic factors which include changes in instruments, human errors, or different observation practices [63]. Hence more rainfall stations were studied before relating vegetation of the wetland to Nylsvley wetland rainfall station to check on the reliability of this station data. Total daily rainfall values were used to come up with mean monthly, seasonal, and annual rainfall. Mean monthly rainfall was correlated with mean NDVI in Nylsvley from 1984 to 2003. Nylsvley rainfall station data was limited up to the 2003 period forcing the analysis to also end in the same period. Seasonal rainfall time series were selected to show changes that may not be depicted by total annual rainfall. Mazvimavi [64] highlighted that overtime changes in rainfall at smaller spatial scales have the potential to show climate change impacts on a localized scale.
NDVI data were derived from Landsat 5 images downloaded from USGS through the earth explorer website (https://earthexplorer.usgs.gov/) and have been geometrically and radiometrically corrected. The imagery at 30 m resolution with a temporal resolution of 16-days (row 170/077, UTM projection), acquired in the summer season for selected years between 1984 to 2003, were considered in this study, see Appendix A for the selected images. The selected sensor is the best available cloud-free image in the study area for the period. Images from the beginning of the season were selected as most were free from cloud cover (October). The winter vegetation coverage of semi-arid regions was mostly poor, hence we focused on summer seasons (October to March), selecting cloud-free images. NDVI values were thus averaged and utilized for analysis in this study. The detailed properties of NDVI are provided in many other studies including [8,26,65,66]. The research was done in semi-arid regions in the 1980s and the 1990s, demonstrating the seasonal relationship between NDVI and rainfall variations [67]. NDVI enabled us to examine ecosystem dynamics and long term trends in vegetation [68].
2.3. Data Analysis
To analyze trends in rainfall data, statistical methods have been developed and applied in studies over many years [42,63,69,70]. Most of these studies have used linear regression models, based on ordinary least-squares regression, which were used mostly in linear trend studies. These models have limitations surrounding providing information on the mean condition of indices, ignoring aspects of the lower or upper tails of index distributions that are more important than the mean trends in climate trend studies [71]. Odiyo et al. [42] highlighted that using more than one method in trend analysis has the advantage of improving results. Thus, to boost the accuracy of and confidence in the study results, the Mann-Kendall trend test (MK), Sen’s slope estimator, and quantile regression (QR) were used to analyze annual and seasonal rainfall data of NRS and final trend station results were compared. Tareghian and Rasmussen [71] and Lee et al. [72] noted that the QR method has recently been introduced in climate-related studies, and it is new in rainfall application studies in Southern Africa [64,73].
The non-parametric MK method has been preferred over the parametric test method in analyzing data trends as it also estimates trend direction [69]. The Sen’s slope method is used for estimating the slope of a linear trend. It has been widely used for determining the trend magnitude in hydrological and meteorological time series data [14,74,75]. Asfaw et al. [10] note that non-parametric statistical tests are suitable for data that is not normally distributed and with missing data which is a common phenomenon in hydrological time series data. Shapiro-Wilk Normality Test (R-Studio software) was used for testing the normality distribution of the data of all the rainfall stations. MK was used in detecting the significance of the trend in rainfall time series and it works well with data that has outliers. The MK test is based on the statistic S defined in the following formula:
where N stands for the number of data points, xj and xi represent the values at time j and i(j > i), respectively, sgn stands for sign [14]. The Sen’s slope estimator determined the magnitude of the trend in rainfall data. Pohlert [76] states that Sen’s slope test computes the linear rate of change and intercept as follows:
where d = slope, k = median X denotes the variable, n = number of data and i, j = indices. Sen’s slope is therefore calculated as the median from all slopes: b = Median dk. These intercepts are computed for each time step t, and a is intercept as shown in the formula below:
at = Xt − b * t,
This formula computed the upper and lower confidence limits for Sen’s slope.
The results of Sen’s slope that had a negative sign represent the decreasing trend, while a positive sign showed the increasing trend [77]. Long-term trend analysis had an advantage, as it can reveal the starting point of the trend year and changes occurring over time, as well as abrupt detections of changes in time series. The Sen’s slope estimator embedded within MK was used to determine the magnitude of trends in time series. MK, a non-parametric test, was ideal for analyzing hydrological and climatological data which were characterized by missing or non-normally distributed data as this was a common feature [78].
The QR is an extension of the least-squares regression method [63] and examines functional relations between variables for all portions of a probability distribution and estimates multiple rates of change (slopes) from the minimum to maximum responses [79,80]. It provides a complete picture of the relationships among variables when both the lower and upper quantiles are of interest in a study [81]. Changes in rainfall regimes may not equally affect all rainfall percentile values [82] and hence the need to examine changes in several quantiles in detecting trends among different rainfall distributions. In this study, it was used in the estimation of slopes of trends in quantiles 0.1, 0.2, 0.5, 0.7, and 0.9 of the total recorded daily rainfall values which were used to compute seasonal and annual rainfall for NRS. Quantiles 0.1 and 0.2 represented low rainfall, 0.5 and 0.7 median, and 0.9 indicated high rainfall events [79,80,83]. The first order QR model had X which was defined as covariant of Y and τ and X = x, as follows:
where Y is a random variable of the total rainfall time series and θ has values ranging from 0 ≤ θ ≤ 1 with Y probability being equal or less than τ which signifies the θth quantile. The β(θ)1 is the coefficient, the β(θ)0 is the intercept depending on the θth quantile value and ξ signifies an error with exception of zero [63,64]. The QR estimates also the p-values, t-statistics, standard errors, and confidence intervals. The negative or positive trend detection that is different from zero indicates that the θth quantile of rainfall is either decreasing or increasing signifying low or high rainfall, respectively. Each rainfall station was considered independently in this study.
Y(θ\x) = β(θ)0 + β(θ)1X + ξ,
The QR estimates and MK results were compared through values of slope coefficients and p-values across quantiles [84]. The Statistical Analysis System (SAS) ‘quantreg’ package software (SAS v94), was run for QR analysis and MK for trend analysis. The SAS v94 software version can show upper and lower tail distributions that provide additional crucial information on changes in all parts of the distribution of a series [63]. A regression model with heterogeneous variance implies that there is not a single rate of change that characterizes variation in probability distributions. To focus only on analyzing changes on means may under or overestimate or even fail to distinguish real non-zero changes in heterogeneous distributions [85]. Trends in all quantiles were compared using p-values and slope coefficients to investigate their similarities and differences in explaining different quantile regression slopes.
The acquired Landsat 5 images were imported in the ArcGIS 10.7 environment, for analysis. The study area was extracted by clipping the image with the Nylsvley boundary in ArcGIS 10.7. All downloaded images were refined using Erdas 2018 and ArcGIS 10.7 tools and the images were clipped to the study area shapefile boundary before extracting the mean NDVI values. The study area was an inland nature reserve with limited air pollution, with no specific intra-class vegetation analysis needing to be done, and atmospheric corrections for haze was not done as cloud-free day images were used. The NDVI as described in [26,86] was used for developing NDVI maps using the spatial analysis tool within ArcGIS 10.7 software. NDVI calculation uses the Near InfraRed (NIR) and the RED bands as vegetation strongly reflect in the NIR. The NDVI formula is as follows:
NDVI = (NIR − RED)/(NIR + RED)
NDVI values range between −1 to 1, with positive values indicating high amounts of vegetation and negative values responding to poorly or sparsely vegetated areas. Using the image analysis toolbar in ArcGIS 10.7, NDVI maps showing areas of healthy and not healthy vegetation were produced. Mean NDVI values were created using Zonal statistics as a table tool in ArcGIS 10.7. The correlation coefficient which measures the strength of the linear relationship of two variables was computed as postulated by Onema and Taigbenu [18]. The magnitude of the correlation between NDVI and rainfall in Nylsvley was measured in the period 1984 and 2003, with statistical significance at a confidence level of 95% (p = 0.05). The R-squared (R2) revealed the goodness of fit in a linear regression model was used in the analysis of Rainfall-NDVI data. The correlation formula used is as follows:
where r = correlation coefficient of variables rainfall and NDVI, xi = ith of the first variable (rainfall), yi = ith of the second variable (NDVI), = mean for rainfall, = mean for NDVI.
The extracted NDVI values were exported to Excel for the creation of graphs with output NDVI and rainfall trend patterns. The study hypothesized that there is a trend in both NDVI and rainfall time series.
3. Results
3.1. Rainfall Variability Across Stations
The eight stations had rainfall data observations ranging between 27 to 66 years with Groenfontein and Modimolle stations having least and most observations, respectively (Table 1). Positive and negative Sen’s slopes indicated an increase and decrease in annual rainfall, respectively. The analysis of the annual rainfall showed four (50%) of the eight stations (Mookgophong, Modimolle, Baffelspoort, and Elandspoort) with increasing rainfall trends and the other four (50%) (Groenfontein, Moorddrift, Nylsvley, and Polokwane) with decreasing rainfall trends over the years under study. Seasonally, an additional station, Groenfontein, showed an increasing rainfall trend over the years, making 62.5% of the stations to be with increasing rainfall and 3 stations (37.5%) with decreasing rainfall (Table 1).

Table 1.
Results of Mann-Kendall trend test for total annual (October to September) and seasonal (October to March) rainfall for the eight rainfall stations. The bold values in the table show statistically significant rainfall stations.
The QR model trend analysis highlighted annual and seasonal rainfall results (Table 2).
Table 2.
Annual and seasonal rainfall for the eight rainfall stations in the Nyl river system. The bold figures in the table indicate stations that are statistically significant.
The negative slope coefficients showed decreasing trends in all quantiles of either annual or seasonal rainfall. Similarly, positive slope coefficients showed increasing rainfall trends in both seasons studied. Polokwane was the only rainfall station showing decreasing seasonal rainfall trends in all quantiles. Table 2 clearly shows the stations with increasing or decreasing annual and seasonal rainfall trends in respective quantiles in NRS.
The results thus show that 37.5% of the rainfall stations were statistically significant in specific quantiles with either increase or decrease in annual or seasonal rainfall. Nylsvley station showed a decrease in all and most quantiles for annual and seasonal rainfall, respectively, whilst Elandspoort showed an increase in most and all quantiles for annual and seasonal rainfall, respectively. Groenfontein showed a decrease in most quantiles of annual rainfall and middle and upper quantiles of seasonal rainfall whilst lower quantiles (0.1, 0.2) showed increasing seasonal rainfall. The mean and median trends as described by Fan and Chen [63], reflect long-term trends in either lower or upper tails of the conditional distributions of the annual and seasonal rainfall. The trends in the median are like those in the mean, unlike the lower and upper tails that show different trends from the mean slopes (Table 1 for slope distribution of the plotted stations).
The annual and seasonal rainfall of the eight rainfall stations analysed between 1950 and 2016 are presented in Figure 2 and Figure 3.
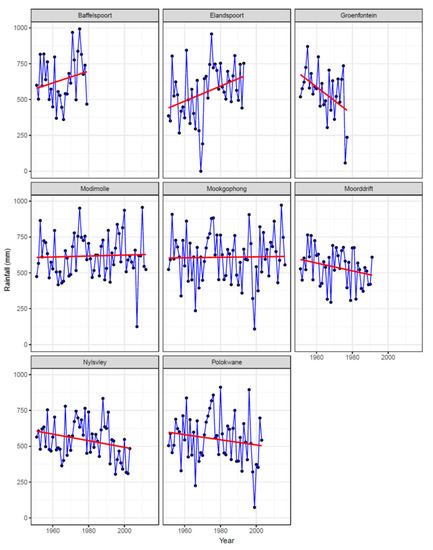
Figure 2.
Annual rainfall for stations analyzed between 1950 and 2016.
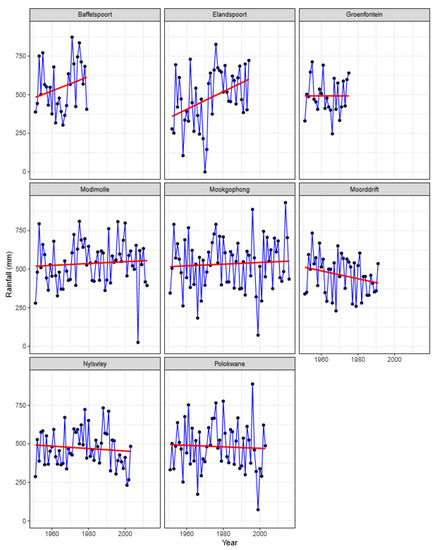
Figure 3.
Mann-Kendall trend test for seasonal rainfall of the stations analyzed between 1950 and 2016.
The spatial distribution of stations with a statistically significant change in rainfall are shown in Figure 4. Elandspoort rainfall station, upstream of the Nylsvley Nature Reserve, had a statistically significant increase in rainfall (Figure 4). Nylsvley station, located inside the Nature Reserve, had reported a decrease in rainfall as revealed by rainfall data recorded over 53 years in this study. Whilst Groenfontein station, which had statistically significant decreasing annual rainfall, is located upstream of the Nature Reserve.
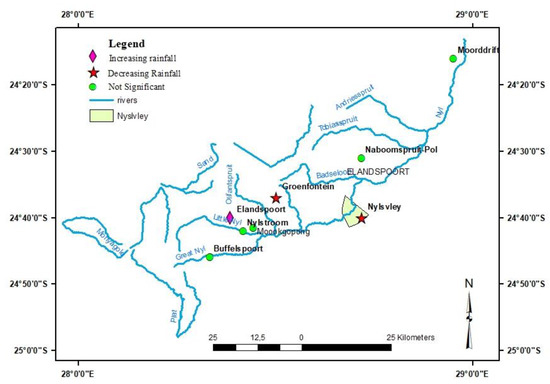
Figure 4.
Location of rainfall stations with statistically significant increasing (Elandspoort) and decreasing (Groenfontein, Nylsvley) rainfall along the Nyl River system.
Validation of Rainfall Results
Mann-Kendall trend test showed only one station (Elandspoort), showing a significant increase in both annual and seasonal rainfall at p < 0.05, Table 1. QR results, with p-values that were greater than α (0.05) showed non-statistically significant increasing or decreasing rainfall trends in the stations studied. Elandspoort station was statistically significant with increasing annual and seasonal rainfall at median quantiles, 0.5 and 0.7. The statistically significant stations at the 5% significance level varied per quantile. For instance, Groenfontein station was statistically significant in lower quantile (0.2) while Nylsvley station was also statistically significant in lower quantiles (0.1 and 0.2) whilst Elandspoort was statistically significant in median quantiles (0.5 and 0.7) for annual rainfall trends. Statistically significant stations are shown in Table 2 in bold and Figure 5 shows QR slopes of these statistically significant stations.
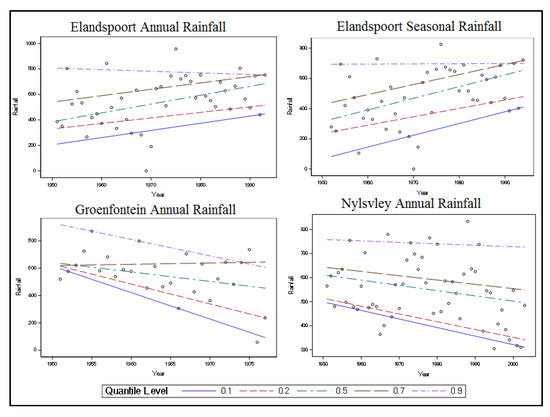
Figure 5.
Statistically significant stations in both annual and seasonal rainfall using Quantile Regression. The five dotted lines in the Figure represent different quantiles, ranging from the lower to higher quantile (0.1, 0.2, 0.5, 0.7, and 0.9).
3.2. Mean Monthly Rainfall and NDVI Results
The results of the average monthly summer rainfall and mean NDVI are as shown in Figure 6 and Figure 8. The average summer season rainfall from 9 different months of separate years between 1984 and 2003 explains that there was a positive significant relationship between rainfall and NDVI in Nylsvley shown by, correlation of 0.74 at p < 0.02 which was less than alpha of 0.05. The regression, R2 explains that 55% of the data fits well on the model, shown in Figure 7. Onema and Taigbenu [18] highlighted that correlation measures the strength of two variables in a linear relationship and in this study, the strength of NDVI and rainfall was measured using rainfall and NDVI data for 9 years.
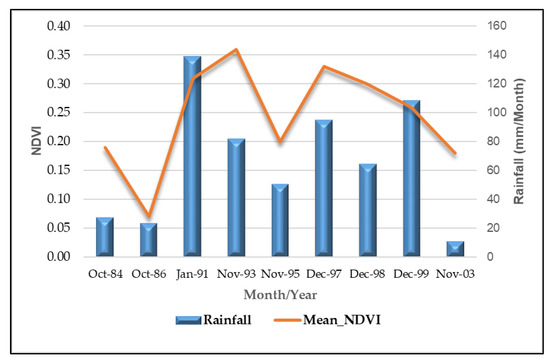
Figure 6.
The Mean Normalized Difference Vegetation Index (NDVI) and rainfall effects in Nylsvley wetland for the years studied.
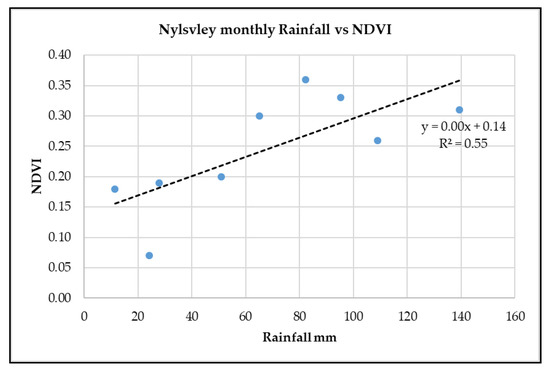
Figure 7.
Correlation of rainfall and NDVI in Nylsvley wetland.
Figure 8 shows the trend of mean NDVI and average monthly rainfall in the summer season in Nylsvley wetland. Examining the relationship between NDVI and summer rainfall as shown in Figure 8, indicated that there was a general agreement between rainfall amount and availability of vegetation. Where rainfall increased, NDVI tended to increase too, see Figure 8, between the 1986 and 1991 period. The years 1993 and 1995 saw a decrease in both rainfall and NDVI. From the period 1997 as rainfall decreased, NDVI continued to drop despite rainfall increases as of 1998. This shows that vegetation takes time to recover and regrow. By 2003, both rainfall and NDVI showed a downward trend, Figure 8. The mean monthly rainfall and mean NDVI values were high mostly in the months of November–January, indicating the strong relationship between the two. The beginning of season months, such as October, received lower rainfall and had low vegetation indicated by low NDVI.
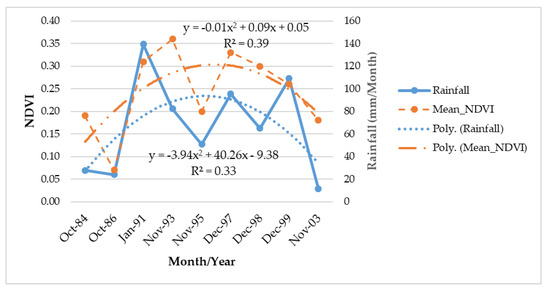
Figure 8.
Trend of mean NDVI and average monthly rainfall in Nylsvley wetland.
4. Discussion
This study used the MK and Sen’s slope, non-parametric trend statistic methods to determine the trend significance and magnitude, ideal for the comparison of total annual and seasonal rainfall variations within the Limpopo Province [87]. The study observed that both MK and Sen’s slope methods gave similar trends for the rainfall series of all the eight stations studied (Table 1). From annual and seasonal analyses, four and five of the eight stations showed increases in annual and seasonal rainfall, respectively, in the NRS. Using QR, the results show that about half of rainfall stations showed decreasing annual rainfall trends in most quantiles while 37.5% of rainfall stations showed decreasing seasonal rainfall trends. Thus, most of the rainfall stations (62.5%) showed increasing seasonal rainfall trends in most of the quantiles. There are two rainfall stations (Moorddrift and Nylsvley), with constantly decreasing annual and seasonal rainfall trends on all and most of the quantiles, respectively (Table 2).
New et al. [27] in their study of precipitation from 1961–2000 highlighted that few stations in 14 African nations studied showed decreases in rainfall; however, the depicted trends by these authors were not statistically significant. This agrees with the studies by Hulme et al. [88] and Kruger [87], who reported that most stations studied in South Africa between 1901–1995 showed no significance in trends. This study, even though it was done at a localised scale and with data length varying (27–66 years), agrees with previous studies that an equal number of stations at the annual level, and fewer stations at the seasonal, in the region showed non-statistically significant decreases in annual and/or seasonal rainfall, respectively [87]. The results also show the significant increasing trends in both annual and seasonal rainfall at the Elandspoort station, whilst the rest of the stations with increasing trends have statistically non-significant increasing trends.
The decreases and increases in trends shown in the data could be because of increases and decreases in the extreme and inter-annual inconsistency of rainfall within some years in some provinces of South Africa [87]. This can explain why Elandsport and Groenfontein stations, both upstream of Nylsvley (Figure 2), have increasing or decreasing rainfall, respectively. Odiyo et al. [42] investigated variability in rainfall using long-term data (1931/1932–2005/2006) of the Luvuvhu River Catchment (LRC) of South Africa. Two of the six studied rainfall stations showed decreasing trends in 5- and 10-years mean rainfall with decadal fluctuation in a 10-year mean of daily rainfall. Their study concluded that the variability of rainfall has increased in LRC for over 86 years. Various other studies on long-term rainfall changes in South Africa include studies on analyses of rainfall data from 157 stations between 1880 and 1972 [89]. A study by Nicholson [90] reveals no trends in mean annual rainfall over Southern Africa between 1900–1970 and 1961–1990 periods. Kruger [87] reports significant decreases in annual precipitation in some parts of South Africa that include Northern Limpopo, Western KwaZulu Natal, North Eastern Free State, and the South-Eastern regions of Eastern Cape, and increases in rainfall were projected in Northern, Western, and Eastern Cape Provinces. Lynch [91] notes gradual rainfall increases in the Potchefstroom area from 1925 to 1998 whilst Warburton and Schulze [92] report a decrease in median annual rainfall in the Limpopo Province over the latter half of the 20th century.
All rainfall stations located in the upper section of the NRS, namely, Mookgophong, Modimolle, Elandspoort, and Buffelspoort have generally received increased rainfall in both seasons that were studied. In the middle section of NRS, two stations, Nylsvley and Polokwane, received decreased rainfall both annually and seasonally. The decrease in rainfall in Nylsvley over the years contributes to less water available in the Nylsvley floodplain. Moorddrift station situated in the lower section of the NRS has also faced decreased rainfall both annually and seasonally under the study (Figure 2 and Figure 3). These differences can be explained by either natural climatic factors or differences in microclimates [93,94]. The main causes of long-term rainfall variability across the Southern Africa region and the continent at large are complex as they are influenced by the changes taking place in the oceans together with atmospheric circulation. These include the ENSO (El Nino southern oscillation cycle) [23] and the fluctuations in sea surface temperature (SST) which has no relationship with the ENSO [95] and human anthropogenic activities on the environment leading to land cover changes [88]. The results of this study and previous studies on rainfall trends show a clear indication of how variable rainfall has been over the centuries.
The study showed no widespread evidence that rainfall in NRS had decreased or increased due to climate variations. The study based its evidence on results from the eight stations studied with annual and seasonal rainfall and showed no strong evidence that seasonal or annual rainfall has declined or increased since only three of the eight stations had statistically significant results. The study, therefore, rejects the null hypothesis as most of the stations (62.5%) showed a statistically insignificant change over time. Using two methods revealed that rainfall trends from three stations are statistically significant. MK had depicted the Elandspoort station as having a statistically significant increasing rainfall trend. Additional stations, Nylsvley and Groenfontein were depicted by the QR method as having statistically significant decreasing trends in annual rainfall.
The Nylsvley rainfall station, located within the flood plain with over 53 years of recorded annual rainfall data, has received a maximum and minimum annual rainfall of 733 mm in 1988 and 231 mm in 2001, respectively, shown in Figure 2. The Nylsvley rainfall station is crucial as it provides rainfall statistics of the flood plain and the Nature Reserve. The trend of low annual rainfall in Nylsvley has been recorded from the years 1995 to 2003 which received between 231 mm and 483 mm. This decrease could impact on vegetation growth and the availability of flooding water within the flood plain and its biological diversity. This decrease agrees with the results of the study that the flood plain has consistently received low rainfall as shown by the decreasing trends in both rainfall and NDVI, as shown in Figure 6. The decrease in rainfall in the Nylsvley agrees with the ideology that the flood plain is experiencing dry years as exacerbated by low rainfall being received in some of the years.
Though many stations showed decreasing rainfall trends, they were mostly not statistically significant or proved and this could imply that there are interannual and seasonal variations of rainfall in NRS. The insignificant trends can also be linked to a relatively high year-to-year variability of rainfall in South Africa (including Limpopo Province) which is associated with some cloud band and ENSO [96]. Mazvimavi [64] highlighted no changes over-time for rainfall in Zimbabwe and stated that global warming may cause changes in rainfall patterns, but these effects were not statistically significant. The author later stipulated that the Southern Africa region is semi-arid to arid with inter-annual rainfall variability. In the region, including Limpopo Province of South Africa, there is need to be vigilant to such decadal or inter-annual changes to be ready to respond to uncertainty raised by climate change and/or anthropogenic factors. New et al. [27] in their study highlighted the decrease in precipitation of Southern Africa even though the study was not statistically significant either.
Onema and Taigbenu [18] also emphasised in their study that the NDVI–rainfall relationship is linked, hence they expected to see a trend in most of their data. This trend has also been shown in the Nylsvley wetland indicating that, when restoration activities take place in the wetland, management should be informed of the water challenges needed for vegetation growth and other life forms including flooding in the wetland.
The major decrease in rainfall in the years between 1991 and 1993 agrees with studies by Nicholson et al. and Richard et al. [97,98], as there was a serious drought in the Southern Africa region that caused significant summer rainfall variations. This could have led to decrease in NDVI in Nylsvley as the area could have received less rainfall to promote plant vigour. The annual and seasonal rainfall trends for the Nylsvley station from 1953 to 2003 have shown a decreasing trend, as seen in Table 1. A study on vegetation greenness (NDVI) and rainfall variability conducted in the Sahel region in the period 1982–2003 concluded that rainfall remains the main causative factor for vegetation greenness increase [99]. Other studies by Martiny et al. and Barbosa et al. [8,66], also support the NDVI–rainfall relationship, although anthropogenic factors impact negatively too [26]. The decrease in NDVI within the study area could also be attributed to other factors such as anthropogenic activities, for example, agriculture in the area [45]. Agriculture leaves most surfaces as bare ground with infertile soils. As such, vegetation in these old fields takes a long time to naturally recover [100], which could be the case in some parts of Nylsvley.
Nylsvley has a history of grazing both from domesticated and wild animals [45]. The growing of crops ceased in part of the wetland in 1974 and the remaining part in 1997, as it became a protected area. The degradation of the wetland through the removal of vegetation has forced the government, through its project implementer (Working for Wetlands), to embark on restoring the wetland so that it can return closer to its natural state. The decrease in NDVI due to less rainfall has implications in ecosystem development and services. For instance, in the Nylsvley wetland, game animals obtain their food through grazing and less vegetation has implications when planning for these grazers. Vegetation also provides a habitat for migratory birds that visit Nylsvley, and this attracts tourists to visit for bird watching and is a source of income to this region and employment creation in the tourism sector. Thus, the rainfall-NDVI relationship is critical as it helps managers to prepare for early negative climatic effects.
5. Conclusions and Recommendations
This study addressed the historical rainfall trends in NRS and rainfall-vegetation relationships to assess climate effects on wetland vegetation growth. NDVI was thus used as a proxy of vegetation and showed that as rainfall decreased or increased over the years under study, NDVI seemingly followed suit (Figure 6 and Figure 8). The study utilised two methods in assessing historical rainfall trends which revealed that three stations (Groenfontein, Elandspoort, and Nylsvley) have fluctuating rainfall patterns with Nylsvley consistently reporting decreasing rainfall trends. Three out of the eight rainfall stations studied demonstrated evidence of the changes in annual and seasonal rainfall patterns. The decrease in rainfall in Nylsvley has negatively impacted the floodplain wetland with implications on tourists intending to visit it for bird watching and other activities.
The trend of mean NDVI and monthly rainfall shows a positive relationship in some years under study with other years showing negative NDVI increase. This may suggest a combination of years of drought and the effects of negative human activities such as grazing, which is still active in Nylsvley. The changes seen in this study area require proper management and monitoring for sustainable wetland protection of this Ramsar site. This study also suggests that the knowledge of changes in rainfall and NDVI patterns could be used in planning for the effective utilisation of water resources throughout the Nyl River system. Since the study showed varying stations indicating decrease and/or increase in rainfall trends, there is a need to investigate the effects of anthropogenic changes such as land cover/use changes which affect the availability of water resources and the success of natural vegetation restoration within Nylsvley
Author Contributions
Conceptualization, F.M.M.; methodology, F.M.M. and J.O.O., software, F.M.M.; validation, J.O.O. and O.M.; formal analysis, F.M.M.; investigation, F.M.M.; resources, F.M.M.; data curation, F.M.M.; writing—original draft preparation, F.M.M.; writing—review and editing, O.M.; J.O.O. and F.M.M., visualization, F.M.M.; supervision, J.O.O. and O.M. All authors have read and agreed to the published version of the manuscript.
Funding
No external funding was received for this research.
Acknowledgments
The authors thank South Africa Weather Services and Agricultural Research Council for providing long term rainfall data. GreenMatter is also acknowledged for the financial support in the form of a bursary to the student that made it possible to accomplish this research task.
Conflicts of Interest
The authors declare that there are no conflicts of interests.
Appendix A: Shows Landsat 5 Imagery Used to Derive the NDVI Data
| Satellite Sensor | Path/Row | Spatial Resolution | Acquisition Date | Season | Projection |
| Landsat 5 | 170/077 | 30 m | 281,084 | Summer | UTM |
| Landsat 5 | 170/077 | 30 m | 021,086 | Summer | UTM |
| Landsat 5 | 170/077 | 30 m | 010,191 | Summer | UTM |
| Landsat 5 | 170/077 | 30 m | 031,193 | Summer | UTM |
| Landsat 5 | 170/077 | 30 m | 281,195 | Summer | UTM |
| Landsat 5 | 170/077 | 30 m | 021,297 | Summer | UTM |
| Landsat 5 | 170/077 | 30 m | 221,298 | Summer | UTM |
| Landsat 5 | 170/077 | 30 m | 120,399 | Summer | UTM |
| Landsat 5 | 170/077 | 30 m | 181,103 | Summer | UTM |
Appendix B: Shows Average Monthly Summer Rainfall and Mean NDVI of Nylsvley
| Month/Year | Mean NDVI | Mean Rainfall |
| October 1984 | 0.19 | 27.9 |
| October 1986 | 0.07 | 24.1 |
| January 1991 | 0.31 | 139.3 |
| November 1993 | 0.36 | 82.2 |
| November 1995 | 0.2 | 50.9 |
| December 1997 | 0.33 | 95.3 |
| December 1998 | 0.3 | 65 |
| December 1999 | 0.26 | 109 |
| November 2003 | 0.18 | 11.4 |
References
- Huang, S.; Zheng, X.; Ma, L.; Wang, H.; Huang, Q.; Leng, G.; Meng, E.; Guo, Y. Quantitative contribution of climate change and human activities to vegetation cover variations based on GA-SVM model. J. Hydrol. 2020, 584, 124687. [Google Scholar] [CrossRef]
- Sun, W.; Song, X.; Mu, X.; Gao, P.; Wang, F.; Zhao, G. Spatiotemporal vegetation cover variations associated with climate change and ecological restoration in the Loess Plateau. Agric. For. Meteorol. 2015, 209, 87–99. [Google Scholar] [CrossRef]
- Han, Z.; Huang, S.; Huang, Q.; Leng, G.; Wang, H.; He, L.; Fang, W.; Li, P. Assessing GRACE-based terrestrial water storage anomalies dynamics at multi-timescales and their correlations with teleconnection factors in Yunnan Province, China. J. Hydrol. 2019, 574, 836–850. [Google Scholar] [CrossRef]
- Lavergne, S.; Mouquet, N.; Thuiller, W.; Ronce, O. Biodiversity and climate change: Integrating evolutionary and ecological responses of species and communities. Annu. Rev. Ecol. Evol. Syst. 2010, 41, 321–350. [Google Scholar] [CrossRef]
- Some’e, B.S.; Ezani, A.; Tabari, H. Spatiotemporal trends and change point of precipitation in Iran. Atmos. Res. 2012, 113, 1–12. [Google Scholar]
- Climate Change 2014 Mitigation of Climate Change Summary for Policymakers Technical Summary, Shanghai China. Available online: https://www.ipcc.ch/site/assets/uploads/2018/03/WGIIIAR5_SPM_TS_Volume-3.pdf (accessed on 21 September 2020).
- Zhao, J.; Huang, S.; Huang, Q.; Wang, H.; Leng, G.; Peng, J.; Dong, H. Copula-based abrupt variations detection in the relationship of seasonal vegetation-climate in the Jing River Basin, China. Remote Sens. 2019, 11, 1628. [Google Scholar] [CrossRef]
- Martiny, N.; Philippon, N.; Richard, Y.; Camberlin, P.; Reason, C. Predictability of NDVI in semi-arid African regions. Theor. Appl. Climatol. 2010, 100, 467–484. [Google Scholar] [CrossRef]
- IPCC. Climate Change 2014–Impacts, Adaptation and Vulnerability: Regional Aspects; Cambridge University Press: Cambridge, UK, 2014. [Google Scholar]
- Asfaw, A.; Simane, B.; Hassen, A.; Bantider, A. Variability and time series trend analysis of rainfall and temperature in northcentral Ethiopia: A case study in Woleka sub-basin. Weather Clim. Extrem. 2018, 19, 29–41. [Google Scholar] [CrossRef]
- Yang, X.; Xie, X.; Liu, D.L.; Ji, F.; Wang, L. Spatial interpolation of daily rainfall data for local climate impact assessment over greater Sydney region. Adv. Meteorol. 2015. [Google Scholar] [CrossRef]
- IPCC. Climate Change 2007—The Physical Science Basis: Contribution of Working Group I to the Fourth Assessment Report of the IPCC; Cambridge University Press: Cambridge, UK, 2007. [Google Scholar]
- Taxak, A.K.; Murumkar, A.; Arya, D. Long term spatial and temporal rainfall trends and homogeneity analysis in Wainganga basin, Central India. Weather Clim. Extrem. 2014, 4, 50–61. [Google Scholar] [CrossRef]
- Adarsh, S.; Janga Reddy, M. Trend analysis of rainfall in four meteorological subdivisions of southern India using nonparametric methods and discrete wavelet transforms. Int. J. Climatol. 2015, 35, 1107–1124. [Google Scholar] [CrossRef]
- Kent, M.; Coker, P. Vegetation Description and Analysis: A Practical Approach; John Wiley Sons: New York, NY, USA, 1992; pp. 167–169. [Google Scholar]
- Yang, X. Integrated use of remote sensing and geographic information systems in riparian vegetation delineation and mapping. Int. J. Remote Sens. 2007, 28, 353–370. [Google Scholar] [CrossRef]
- Sieben, E.J.J.; Mtshali, H.; Janks, M. National Wetland Vegetation Database: Classification and Analysis of Wetland Vegetation Types for Conservation Planning and Monitoring. Water Research Commission. Available online: http://www.wrc.org.za/wp-content/uploads/mdocs/1980-1-14.pdf (accessed on 21 September 2020).
- Onema, J.-M.K.; Taigbenu, A. NDVI–rainfall relationship in the Semliki watershed of the equatorial Nile. Phys Chem Earth Parts A/B/C 2009, 34, 711–721. [Google Scholar] [CrossRef]
- Vrieling, A.; De Leeuw, J.; Said, M.Y. Length of growing period over Africa: Variability and trends from 30 years of NDVI time series. Remote Sens. 2013, 5, 982–1000. [Google Scholar] [CrossRef]
- Zhao, Z.; Gao, J.; Wang, Y.; Liu, J.; Li, S. Exploring spatially variable relationships between NDVI and climatic factors in a transition zone using geographically weighted regression. Theor. Appl. Climatol. 2015, 120, 507–519. [Google Scholar] [CrossRef]
- Pan, F.; Xie, J.; Lin, J.; Zhao, T.; Ji, Y.; Hu, Q.; Pan, X.; Wang, C.; Xi, X. Evaluation of climate change impacts on wetland vegetation in the Dunhuang Yangguan National Nature Reserve in Northwest China using Landsat derived NDVI. Remote Sens. 2018, 10, 735. [Google Scholar] [CrossRef]
- Wilson, N.R.; Norman, L.M. Analysis of vegetation recovery surrounding a restored wetland using the normalized difference infrared index (NDII) and normalized difference vegetation index (NDVI). Int. J. Remote Sens. 2018, 39, 3243–3274. [Google Scholar] [CrossRef]
- Anyamba, A.; Tucker, C.J.; Mahoney, R. From El Niño to La Niña: Vegetation response patterns over east and southern Africa during the 1997–2000 period. J. Clim. 2002, 15, 3096–3103. [Google Scholar] [CrossRef]
- Anyamba, A.; Tucker, C.J. Analysis of Sahelian vegetation dynamics using NOAA-AVHRR NDVI data from 1981–2003. J. Arid Environ. 2005, 63, 596–614. [Google Scholar] [CrossRef]
- Huber, S.; Fensholt, R.; Rasmussen, K. Water availability as the driver of vegetation dynamics in the African Sahel from 1982 to 2007. Glob. Planet. Chang. 2011, 76, 186–195. [Google Scholar] [CrossRef]
- Shisanya, C.; Recha, C.; Anyamba, A. Rainfall variability and its impact on normalized difference vegetation index in arid and semi-arid lands of Kenya. Int. J. Geosci. 2011, 2, 36. [Google Scholar] [CrossRef]
- New, M.; Hewitson, B.; Stephenson, D.B.; Tsiga, A.; Kruger, A.; Manhique, A.; Gomez, B.; Coelho, C.A.; Masisi, D.N.; Kululanga, E. Evidence of trends in daily climate extremes over southern and west Africa. J. Geophys. Res. Atmos. 2006, 111. [Google Scholar] [CrossRef]
- Aguilar, E.; Aziz Barry, A.; Brunet, M.; Ekang, L.; Fernandes, A.; Massoukina, M.; Mbah, J.; Mhanda, A.; Do Nascimento, D.; Peterson, T. Changes in temperature and precipitation extremes in western central Africa, Guinea Conakry, and Zimbabwe, 1955–2006. J. Geophys. Res. Atmos. 2009, 114. [Google Scholar] [CrossRef]
- Greenfield, R. An Assessment Protocol for Water Quality Integrity and Management of the Nyl River Wetland System. Ph. D. Thesis, University of Johannesburg, Johannesburg, South Africa, 2008. [Google Scholar]
- Hefting, M.M.; Clement, J.-C.; Bienkowski, P.; Dowrick, D.; Guenat, C.; Butturini, A.; Topa, S.; Pinay, G.; Verhoeven, J.T. The role of vegetation and litter in the nitrogen dynamics of riparian buffer zones in Europe. Ecol. Eng. 2005, 24, 465–482. [Google Scholar] [CrossRef]
- Greenfield, R.; Van Vuren, J.; Wepener, V. Heavy metal conentrations in the water of the Nyl River system, South Africa. Afr. J. Aquat. Sci. 2012, 37, 219–224. [Google Scholar] [CrossRef]
- Khoza, Z.; Potgieter, M.; Vlok, W. A preliminary survey of biotic composition of the Olifantspruit catchment, South Africa. Afr. J. Aquat. Sci. 2012, 37, 201–208. [Google Scholar] [CrossRef]
- Cowden, C.; Kotze, D.; Ellery, W.; Sieben, E. Assessment of the long-term response to rehabilitation of two wetlands in KwaZulu-Natal, South Africa. Afr. J. Aquat. Sci. 2014, 39, 237–247. [Google Scholar] [CrossRef]
- Higgins, S.I.; Rogers, K.H. The Nyl River Floodplain: Situation Report and Preliminary Statement of Impacts of Proposed Olifantsspruit Dam; Centre for Water in the Environment Report: Johannesburg, South Africa, 1993; pp. 670–681. [Google Scholar]
- Higgins, S.I.; Coetzeem, A.S.; Marneweck, G.C.; Rogers, K.H. The Nyl River floodplain, South Africa, as a functional unit of the landscape: A review of current information. Afr. J. Ecol. 1996, 34, 131–145. [Google Scholar] [CrossRef]
- Jensen, A. Repairing wetlands of the Lower Murray: Learning from restoration practice. Ecol. Manag. Restor. 2002, 3, 5–14. [Google Scholar] [CrossRef]
- Greenfield, R.; Van Vuren, J.; Wepener, V. Determination of sediment quality in the Nyl river system, Limpopo Province, South Africa. Water SA. 2007, 33, 693–700. [Google Scholar] [CrossRef]
- Kleynhans, M.T.; James, C.S.; Birkhead, A.L. Hydrologic and Hydraulic Modelling of the Nyl River Floodplain, Part 3: Applications to Assess Ecological Impact. Water SA 2007, 33. [Google Scholar] [CrossRef]
- McCarthy, T.S.; Tooth, S.; Jacobs, Z.; Rowberry, M.D.; Thompson, M.; Brandt, D.; Hancox, P.J.; Marren, P.M.; Woodborne, S.; Ellery, W.N. The origin and development of the Nyl Riverfloodplain wetland, Limpopo Province, South Africa: Trunk–tributary river interactions in a dryland setting. S. Afr. Geogr. J. 2011, 93, 172–190. [Google Scholar] [CrossRef]
- Tooth, S.; Mccarthy, T.S. Wetlands in drylands: Geomorphological and sedimentological characteristics, with emphasis on examples from Southern Africa. Prog. Phys. Geogr. 2007, 31, 3–41. [Google Scholar] [CrossRef]
- Whitecross, M.A.; Witkowski, E.T.F.; Archibald, S. No two are the same: Assessing phenology, with watering, from 2012 to 2014 at Nylsvley, South Africa. S. Afr. J. Bot. 2016, 105, 123–132. [Google Scholar] [CrossRef]
- Odiyo, J.O.; Makungo, R.; Nkuna, T.R. Long-term changes and variability in rainfall and streamflow in Luvuvhu River Catchment, South Africa. S. Afr. J. Sci. 2015, 111, 1–9. [Google Scholar] [CrossRef]
- Zhong, L.; Ma, Y.; Xue, Y.; Piao, S. Climate change trends and impacts on vegetation greening over the Tibetan Plateau. J. Geophys. Res. Atmos. 2019, 124, 7540–7552. [Google Scholar] [CrossRef]
- Mucina, L.; Rutherford, M.C. The Vegetation of South Africa, Lesotho and Swaziland; Strelitzia 19, South African National Biodiversity Institute: Pretoria, South Africa, 2006; Available online: https://www.sanbi.org/wp-content/uploads/2018/05/Strelitzia-19.pdf (accessed on 21 September 2020).
- Scholes, R.J.; Walker, B.H. An African Savanna: Synthesis of the Nylsvley Study; Cambridge University Press: Cambridge, UK, 1993; Available online: https://download-pdfs.com/v6/preview/?pid=6&offer_id=26&ref_id=5c7981af0e2335e4aa9828ea3771TS1x_5756ae7b_c28f910b&sub1=22741&keyword=R.%20J.%20Scholes%20-%20An%20African%20Savanna:%20Synthesis%20Of%20The%20Nylsvley%20Study (accessed on 21 September 2020).
- Tarboton, W.R. The Nyl River floodplain. Fauna Flora 1987, 45, 3–5. [Google Scholar]
- Brooke, R.K. South African red data book–birds. Foundation for Research Development: CSIR; 1984. Available online: https://researchspace.csir.co.za/dspace/handle/10204/2015 (accessed on 21 September 2020).
- Dye, P.J.; Croke, B.F. Evaluation of streamflow predictions by the IHACRES rainfall-runoff model in two South African catchments. Environ. Model. Softw. 2003, 18, 705–712. [Google Scholar] [CrossRef]
- Low, A.B.; Rebelo, A.G. A companion to the Vegetation Map of South Africa, Lesotho and Swaziland. Available online: https://agris.fao.org/agris-search/search.do?recordID=XF2015021976 (accessed on 21 September 2020).
- Higgins, S.I.; Rogers, K.H.; Kemper, J. A description of the functional vegetation pattern of a semi-arid floodplain, South Africa. Plant. Ecol. 1997, 129, 95–101. [Google Scholar] [CrossRef]
- Mucina, L.; Rutherford, M.C. Vegetation Atlas of South Africa Lesotho Swaziland. In The vegetation of South Africa, Lesotho and Swaziland; South African National Biodiversity Institute: Pretoria, South Africa, 2006; pp. 748–790. [Google Scholar]
- Rowberry, M.; McCarthy, T.; Thompson, M.; Nomnganga, A.; Moyo, L. The spatial and temporal characterisation of flooding within the floodplain wetland of the Nyl River, Limpopo Province, South Africa. Water SA 2011, 37, 445–452. [Google Scholar] [CrossRef]
- Skidmore, A.K.; Bijker, W.; Schmidt, K.S.; Kumar, L. Use of remote sensing and GIS for sustainable land management. ITC J. 1998, 3, 302–315. [Google Scholar]
- Scott, D.A.; Jones, T.A. Classification and Inventory of Wetlands: A Global Overview. Vegetation 1995, 118, 113–116. [Google Scholar] [CrossRef]
- Merritt, D.M.; Manning, M.E.; Hough-Snee, N. The National Riparian Core Protocol: A Riparian Vegetation Monitoring Protocol for Wadeable Streams of the Conterminous United States; Gen. Tech. Rep. RMRS-GTR-367; US Department of Agriculture, Forest Service, Rocky Mountain Research Station: Fort Collins, CO, USA, 2017; Volume 37, p. 367.
- Brooks, R.P.; O’Connell, T.J.; Wardrop, D.H.; Jackson, L.E. Towards a regional index of biological integrity: The example of forested riparian ecosystems. In Monitoring Ecological Condition at Regional Scales; Springer: Dordrecht, The Netherlands, 1998; pp. 131–143. Available online: https://link.springer.com/chapter/10.1007/978-94-011-4976-1_10 (accessed on 21 September 2020).
- Gallant, A.L.; Kaya, S.G.; White, L.; Brisco, B.; Roth, F.M.; Sadinski, W.; Rover, J. Detecting Emergence Growth, and Senescence of Wetland Vegetation with Polarimetric Synthetic Aperture Radar (SAR). Data Water 2014, 6, 694–722. [Google Scholar] [CrossRef]
- Netando, G.W.; Waswa, F.; Maina, L.; Naisiko, T.; Masayi, N.; Ngaira, J.K. Agro biodiversity endangered by sugarcane farming in Mumias and Nzoia Sugar belts of Western Kenya. Afr. J. Environ. Sci. Technol. 2010, 4, 437–445. [Google Scholar]
- Mesta, P.; Setturu, B.; Chandran, M.D.S.; Ramachandra, T.V. Inventorying, Mapping and Monitoring of Mangroves towards Sustainable Management of West Coast, India. Geophys. Remote Sens. 2014, 3, 3–9. [Google Scholar]
- Nakamura, K.; Tockner, K.; Amano, K. River and wetland restoration: Lessons from Japan. Aibs Bull. 2006, 56, 419–429. Available online: https://www.dora.lib4ri.ch/eawag/islandora/object/eawag%3A5226/datastream/PDF/Nakamura-2006-River_and_wetland_restoration-%28published_version%29.pdf (accessed on 21 September 2020). [CrossRef]
- Simenstad, C.; Reed, D.; Ford, M. When is restoration not? Incorporating landscape-scale processes to restore self-sustaining ecosystems in coastal wetland restoration. Ecol. Eng. 2006, 26, 27–39. [Google Scholar] [CrossRef]
- Bernhardt, E.S.; Palmer, M.A.; Allan, J.; Alexander, G.; Barnas, K.; Brooks, S.; Carr, J.; Clayton, S.; Dahm, C.; Follstad-Shah, J. Synthesizing US River Restoration Efforts; American Association for the Advancement of Science: Philadelphia, PA, USA, 2005. [Google Scholar]
- Fan, L.; Chen, D. Trends in extreme precipitation indices across China detected using quantile regression. Atmos. Sci. Lett. 2016, 17, 400–406. [Google Scholar] [CrossRef]
- Mazvimavi, D. Investigating changes over time of annual rainfall in Zimbabwe. Hydrol. Earth Syst. Sci. 2010, 14, 2671–2679. [Google Scholar] [CrossRef]
- Ichii, K.; Kawabata, A.; Yamaguchi, Y. Global correlation analysis for NDVI and climatic variables and NDVI trends: 1982–1990. Int. J. Remote Sens. 2002, 23, 3873–3878. [Google Scholar] [CrossRef]
- Barbosa, H.; Kumar, T.L.; Silva, L. Recent trends in vegetation dynamics in the South America and their relationship to rainfall. Nat. Hazards 2015, 77, 883–899. [Google Scholar] [CrossRef]
- Tucker, C.J.; Nicholson, S.E. Variations in the size of the Sahara Desert from 1980 to 1997. Ambio 1999, 7, 587–591. Available online: https://www.jstor.org/stable/4314962?seq=1 (accessed on 21 September 2020).
- Eklundh, L.; Olsson, L. Vegetation index trends for the African Sahel 1982–1999. Geophys. Res. Lett. 2003, 30. [Google Scholar] [CrossRef]
- Sayemuzzaman, M.; Jha, M.K. Seasonal and annual precipitation time series trend analysis in North Carolina, United States. Atmos. Res. 2014, 137, 183–194. [Google Scholar] [CrossRef]
- Singh, S.; Kumar, S. Trend analysis of rainfall of Sagar district, Madhya Pradesh. Indian J. Soil Conserv. 2016, 44, 44–49. [Google Scholar]
- Tareghian, R.; Rasmussen, P. Analysis of Arctic and Antarctic sea ice extent using quantile regression. Int. J. Climatol. 2013, 33, 1079–1086. [Google Scholar] [CrossRef]
- Lee, K.; Baek, H.-J.; Cho, C. Analysis of changes in extreme temperatures using quantile regression. Asia-Pac. J. Atmos. Sci. 2013, 49, 313–323. [Google Scholar] [CrossRef]
- Chamaillé-Jammes, S.; Fritz, H.; Murindagomo, F. Detecting climate changes of concern in highly variable environments: Quantile regressions reveal that droughts worsen in Hwange National Park, Zimbabwe. J. Arid Environ. 2007, 71, 321–326. [Google Scholar] [CrossRef]
- Partal, T.; Kahya, E. Trend analysis in Turkish precipitation data. Hydrol. Process. 2006, 20, 2011–2026. [Google Scholar] [CrossRef]
- Jain, S.; Kumar, V.; Saharia, M. Analysis of rainfall and temperature trends in northeast. Indian Int. J. Climatol. 2013, 33, 968–978. [Google Scholar] [CrossRef]
- Pohlert, T. Non-Parametric Trend Tests and Change-Point Detection. Available online: http://cran.stat.upd.edu.ph/web/packages/trend/vignettes/trend.pdf (accessed on 21 September 2020).
- Motulsky, H. Prism 5 Statistics Guide. Available online: https://cdn.graphpad.com/faq/2/file/Prism_v5_Statistics_Guide.pdf (accessed on 21 September 2020).
- Yue, S.; Pilon, P. A comparison of the power of the t test, Mann-Kendall and bootstrap tests for trend detection/Une comparaison de la puissance des tests t de. Student, de Mann-Kendall et du bootstrap pour la détection de tendance. Hydrol. Sci. J. 2004, 49, 21–37. [Google Scholar] [CrossRef]
- Koenker, R.; Bassett, G., Jr. Regression quantiles. Econometrica. J. Econom. Soc. 1978, 46, 33–50. [Google Scholar] [CrossRef]
- Cade, B.S.; Noon, B.R. A gentle introduction to quantile regression for ecologists. Front. Ecol. Environ. 2003, 1, 412–420. [Google Scholar] [CrossRef]
- Chen, C. An Introduction to Quantile Regression and the Quantreg Procedure. In Proceedings of the Thirtieth Annual SAS Users Group International Conference; SAS Institute Inc.: Cary, NC, USA, 2005; pp. 213–230. [Google Scholar]
- Shiau, J.T.; Huang, W.H. Detecting distributional changes of annual rainfall indices in Taiwan using quantile regression. J. Hydro-Environ. Res. 2015, 9, 368–380. [Google Scholar] [CrossRef]
- Koenker, R.; Hallock, K. Quantile regression: An introduction. J. Econ. Perspect. 2001, 15, 43–56. [Google Scholar] [CrossRef]
- McMillen, D.P. Quantile Regression for Spatial Data; Springer Science and Business Media: Berlin, Germany, 2012. [Google Scholar]
- Cade, B.S.; Terrell, J.W.; Schroeder, R.L. Estimating effects of limiting factors with regression quantiles. Ecology 1999, 80, 311–323. [Google Scholar] [CrossRef]
- Ayele, G.T.; Tebeje, A.K.; Demissie, S.S.; Belete, M.A.; Jemberrie, M.A.; Teshome, W.M.; Mengistu, D.T.; Teshale, E.Z. Time Series Land Cover Mapping and Change Detection Analysis Using Geographic Information System and Remote Sensing, Northern Ethiopia. AirSoil Water Res. 2018, 11, 1178622117751603. [Google Scholar] [CrossRef]
- Kruger, A. Observed trends in daily precipitation indices in South Africa: 1910–2004. Int. J. Climatol. 2006, 26, 2275–2285. [Google Scholar] [CrossRef]
- Hulme, M.; Doherty, R.; Ngara, T.; New, M.; Lister, D. African climate change: 1900–2100. Clim. Res. 2001, 17, 145–168. [Google Scholar] [CrossRef]
- Tyson, P.D.; Dyer, T.G.; Mametse, M. Secular changes in South African rainfall: 1880 to 1972. Q. J. R. Meteorol. Soc. 1975, 101, 817–833. [Google Scholar] [CrossRef]
- Nicholson, S.E. The nature of rainfall variability in Africa south of the equator. Int. J. Climatol. 1986, 6, 515–530. [Google Scholar] [CrossRef]
- Lynch, S. Development of A Raster Database of Annual, Monthly and Daily Rainfall for Southern Africa: Report to the Water Research Commission. South Africa. 2004. Available online: http://www.wrc.org.za/wp-content/uploads/mdocs/1156-1-041.pdf (accessed on 21 September 2020).
- Warburton, M.; Schulze, R. Historical precipitation trends over southern Africa: A hydrology perspective. In Climate Change and Water Resources in Southern Africa: Studies on Scenarios, Impacts, Vulnerabilities and Adaptation; 2005; pp. 325–338. Available online: http://www.wrc.org.za/wp-content/uploads/mdocs/14302.pdf (accessed on 21 September 2020).
- Türkeş, M.; Sümer, U. Spatial and temporal patterns of trends and variability in diurnal temperature ranges of Turkey. Theor. Appl. Climatol. 2004, 77, 195–227. [Google Scholar] [CrossRef]
- Tabari, H.; Talaee, P.H. Temporal variability of precipitation over Iran: 1966–2005. J. Hydrol. 2011, 396, 313–320. [Google Scholar] [CrossRef]
- Nicholson, S.E.; Entekhabi, D. Rainfall variability in equatorial and southern Africa: Relationships with sea surface temperatures along the southwestern coast of Africa. J. Clim. Appl. Meteorol. 1987, 26, 561–578. [Google Scholar] [CrossRef][Green Version]
- Chikoore, H. Drought in Southern Africa. Ph.D. Thesis, University of Zululand, Richards Bay, South Africa, 2016. [Google Scholar]
- Richard, Y.; Fauchereau, N.; Poccard, I.; Rouault, M.; Trzaska, S. 20th century droughts in southern Africa: Spatial and temporal variability, teleconnections with oceanic and atmospheric conditions. Int. J. Climatol. J. R. Meteorol. Soc. 2001, 21, 873–885. [Google Scholar] [CrossRef]
- Usman, M.T.; Reason, C. Dry spell frequencies and their variability over southern Africa. Clim. Res. 2004, 26, 199–211. [Google Scholar] [CrossRef]
- Herrmann, S.M.; Anyamba, A.; Tucker, C.J. Recent trends in vegetation dynamics in the African Sahel and their relationship to climate. Glob. Environ. Change 2005, 15, 394–404. [Google Scholar] [CrossRef]
- Ruwanza, S.; Mulaudzi, D. Soil physico-chemical properties in Lapalala Wilderness old agricultural fields, Limpopo Province of South Africa. Appl. Ecol. Environ. Res. 2018, 16, 2475–2486. [Google Scholar] [CrossRef]


Publisher’s Note: MDPI stays neutral with regard to jurisdictional claims in published maps and institutional affiliations. |
© 2020 by the authors. Licensee MDPI, Basel, Switzerland. This article is an open access article distributed under the terms and conditions of the Creative Commons Attribution (CC BY) license (http://creativecommons.org/licenses/by/4.0/).