Article

Assessment of Soil Erosion Using the RUSLE Model for the Epworth District of the Harare Metropolitan Province, Zimbabwe

by
Andrew K. Marondedze
* and
Brigitta Schütt
*
Physical Geography, Institute of Geographical Sciences, Freie Universität Berlin, Malteserstraße 74–100, 12449 Berlin, Germany
*
Authors to whom correspondence should be addressed.
Sustainability 2020, 12(20), 8531; https://doi.org/10.3390/su12208531
Submission received: 14 August 2020 / Revised: 12 October 2020 / Accepted: 13 October 2020 / Published: 15 October 2020
(This article belongs to the Section Environmental Sustainability and Applications)

Abstract

:
Urban development without adequate soil erosion control measures is becoming a major environmental concern in developing urban areas across Africa. These environmental disturbances encompass rampart Land Use and Land Cover changes (LULC) due to a high population growth rate and increased economic activities. To understand the influence of accelerated LULC changes and urban expansion as major drivers in landscape degradation in the Epworth district of the Harare Metropolitan Province, the RUSLE model was employed. This considers land use, soil, climate and topography as input parameters in the assessment of the extent and impact of these drivers on soil erosion. The Revised Universal Soil Loss Equation (RUSLE) was used to predict the potential erosion between 1984 and 2018 and soil erosion risk for the years 2000 and 2018. The mean rate of the predicted potential soil erosion was 13.2 t ha−1 yr−1 (1984–2018); areas especially vulnerable to erosion were predicted for foot slope areas with direct tributaries to the major streams and steep sloping zones. The average soil erosion risk was estimated at 1.31 t ha−1 yr−1 for the year 2000 and 1.12 t ha−1 yr−1 for 2018. While the overall potential soil loss decreased between 2000 and 2018, the potential soil loss was observed to increase tremendously in residential areas, which doubled in extent between 2000 and 2018. The findings reveal that about 40% of the Epworth district was threatened by unsustainable soil loss resulting from increased soil erosion risk within the built-up areas.

Graphical Abstract

1. Introduction

Urbanization is a continuous process that has boldly accelerated with population increase, expansion and spread of built-up structures in a designated urban area [1]. Urbanization in Africa has been growing at alarming rates with an anticipated annual growth rate of approximately 3.9% [2]. Population growth and increasing economic activities have been linked to aggravate Land Use and Land Cover (LULC) changes [3,4,5]. As such, urban development inevitably involves construction and sealing activities that alter natural landscapes [6] resulting in an increase in impervious surfaces, which replace natural vegetation and reduce the capacity for water infiltration.
This in-turn results in surface runoff that substantially threatens soil loss in vulnerable landscapes through erosion processes [7]. While multiple studies on urbanization processes focus on the social and planning aspect and the assessment of the effects of urbanization processes on the (quasi-) natural environment, in the presented study we assess the effects of urbanization on surface processes by water in the strongly urbanizing area of Harare in tropical Africa; as case study we selected the 35 km2 largest growing informal urban district of the Harare Metropolitan Province, which showed urbanization processes in the sense of surface-sealing of 18 km2 since the year 2000 [8,9]. Due to the unprecedented growing rates of urban-built up area in Harare Metropolitan Province [9,10,11], there is profound need for mapping potential erosion, and estimating potential soil erosion risk.
Soil erosion by water is a naturally occurring process, which is accelerated by human interference and activities including agriculture, deforestation, urban expansion and potentially climate change [12,13,14,15]. It is a continuous process that involves the bodily detachment, transport and deposition of particles originating from soils and weathered bedrock [16,17]. This resultant effect of overland flow and surface runoff has degrading effects on soil resources and affects agriculture and infrastructure [18,19]. The mechanisms involved in soil erosion by water underly a spatio-temporal variability and they are affected by factors such as rainfall, soil characteristics, ground cover and terrain [20]. In regions with seasonal rainfall dynamics, vegetation is sparsely distributed during dry season, making surfaces vulnerable to high raindrop energy impacts at the onset of wet season [21,22,23,24]. Accelerated soil erosion is also reported especially on rainfed agriculture during the pre-monsoon due to high intensity rainfall events occurring concurrently with high wind speeds [25,26].
The spatial heterogeneity and dynamic mechanisms of soil erosion can be attributed to on-site and off-site effects that trigger landscape degradation [18,27]. On-site soil erosion impacts encompass soil sealing and reduced crop productivity [28]. Furthermore, change of soil structure emanating from the loss of topsoil and soil aggregates due to high rainfall erosivity and low infiltration rates severely perturb the sustainability of agricultural systems [24,29]. Off-site damages effect widespread damages such as clogging of canals and drainage systems, siltation of reservoirs and destruction of roads thereby impeding transportation of goods and accessibility to properties [23,27,30]. Construction activities such as grading and use of heavy machinery on steep and lengthy slope are reported as major sources of sediment loss due to their effect in accentuating erosion potential [31]. Long-term LULC changes negatively impact river systems through the alteration of channel flow, soil deposition processes, soil textural organization and habitat loss [25,32]. Henceforth, the need is to assess the spatial distribution and extent of soil erosion in the rapidly transforming Epworth district of the Harare Metropolitan Province.
Globally, almost 84% of land loss results from soil erosion processes [30]. The estimated mean rates of soil erosion across the world range between 12 and 15 t ha−1 yr −1 [33]. In Africa, it is estimated that 19% of the total reservoirs are under siltation threat due to soil erosion by water [33]. About 494 million hectares of land in Africa are subjected to different types of degradation with degradation influenced by water estimated at 227 million ha [34]. A countrywide annual soil loss of 1.5 * 109 t was predicted for Ethiopia, with cultivated lands recording the highest soil loss rate at 42 t ha−1 yr −1 [35]. Soil erosion rates in Ethiopia’s cultivated lands and highlands have been highly influenced by increasing demographic pressure, climate change, terrain and depletion of vegetative cover [36,37]. Only a few studies focus on an assessment of soil erosion risk in urbanized areas. For Kinshasa/DR Kongo, approximately 4.3% of the total urban area was predicted under high-risk of soil erosion with over 15 t ha−1 yr −1 annual average loss [38]. A study on Kuala Lumpar/Malaysia Metropolitan city shows that approximately 38.1% of the city area was above the soil loss tolerable rates (> 1 t ha−1 yr −1) due to high soil erodibility and steep slopes in some parts of the city [3]. At all, urban flooding falls among other problems associated with water induced urban soil erosion. This further aggravates risks on downstream water quality from overflowing sewers and street solids transported in concentrated urban runoff [39].
A wide range of empirical, conceptual and physical models have been developed to estimate soil loss risks and these models vary in complexity, data requirements, processes considered and calibration [40,41]. These models include, among others, the statistical model of the Universal Soil Loss Equation [42] and its derivatives the Revised Universal Soil Loss Equation [43], the Soil and Water Assessment Tool [44] or the Water Erosion Prediction Project [45]. In general, model selection is particularly dependent on the availability of data, attributes of a working area and intended use [41,43]. However, [23] we point out that the complexity of urban land use makes standard soil erosion recording and sampling techniques difficult to apply.
The suitability of satellite remote sensing and Geographic Information Systems (GIS) applications to extract, delineate and manipulate land characteristics, and their integration with the Revised Universal Soil Loss Equation (RUSLE), makes them fundamental tools for spatial soil erosion estimation [46,47,48,49]. The RUSLE model is widely used and has been validated over decades, in addition to the fact that its limitations have been well documented [43,50]. Various studies on the prediction and assessment of soil erosion rates using RUSLE have been reported for Africa, with much attention to highlands and river watersheds [51,52,53]. However, there is paucity in research on mapping potential erosion and soil erosion risk modelling in urban built-up areas [23,30,38]. The advances in urban development and soil erosion management have shown that land managers and policy makers consider the spatial distribution of soil erosion risk more than actual soil loss values [3].
The objectives of this paper are: (a) to model the spatial distribution of the soil erosion risk and potential erosion for Epworth district over different time slices: 2000 and 2018 in order to assess the dynamics of soil erosion over time in heterogenous urban landscapes; (b) to assess the influence of rampart land use and land cover changes on soil erosion risk in the Epworth district through the analysis of temporal soil erosion estimations between 2000 and 2018. The temporal investigation makes use of the RUSLE model for estimating quantitative and spatial data on potential erosion and soil erosion risk in the Epworth district of the Harare Metropolitan province [54] in order to enhance and support soil conservation planning [43]. The study implements field observations, direct erosion feature registration and quantification towards establishing comparison and validation tools for Epworth district soil erosion models [55]. Overall, our study results aim to provide scientific advice towards the sustainability of urban growth.

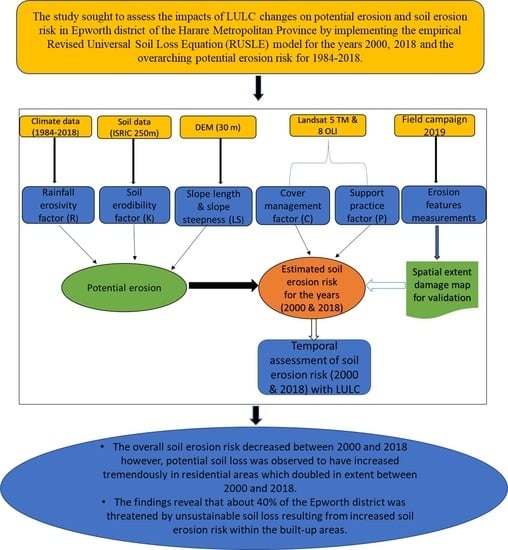
2. Materials and Methods

2.1. Study Area

Harare Metropolitan Province is the capital city of Zimbabwe (Figure 1), located between 17°40′–18°00′ S and 30°55′–31°15′ E. Harare Metropolitan Province is situated in the headwater areas of the Mukuvisi, Marimba and Manyame rivers, which supply Lake Chivero, a reservoir that supplies Harare with water [39]. The Harare Metropolitan Province is composed of four districts: Harare urban, Harare rural, Chitungwiza and Epworth. Epworth district is located about 12 km southeast of the central business district (Figure 1). Epworth district has been purposively selected as a study site because it is the largest informal settlement across urban districts in Zimbabwe [8]. Epworth counted approximately 500 families in 1950 [56] while in 2012 the district had an estimated total population of 167,462 [57].
Settlement activities such as urban agriculture, construction, illegal sand mining, brick molding and effluent discharge from industries pose water quality threats to the Lake Chivero drainage basin [8,58]. Epworth district is largely dominated by high density residential areas. These are characterized by overcrowdings and concentrated housing residential structures due to densification; only little vegetation occurs across the settlements [8].
The general topography of Epworth district is characterized by undulating and slightly rolling terrain in the upland areas, being part of the southern Africa Highveld. Elevations range from 1455 m to 1556 m a.s.l. For Epworth district, clayey Fersiallistic soils (moderately leached soils of the kaolinitic order) occur in contact zones and Paraferrallitic soils (comprises of highly leached soils) are widely distributed across the entire district [59,60]. The sub-tropical climate of Harare Metropolitan Province is dominated by four distinct seasons: the cool-dry season (mid-May to August), hot-dry season (September to mid-November), rain-wet season (mid-November to mid-March) and the post rainy season (mid-March to mid-May) [11]. Harare Metropolitan Province receives 470–1350 mm of precipitation annually; rainfall predominantly occurs during the four months of rainy season. Average temperatures range from 7 °C to 20 °C during dry periods and from 13 °C to 28 °C in hot-dry periods [11].

2.2. Soil Erosion Modelling

2.2.1. Parameter Estimation for Soil Erosion Risk Assessment Using RUSLE

The RUSLE model is simple and the mostly used computerized version of the Universal Soil Loss Equation (USLE), a statistical model developed to estimate the annual soil loss per unit area based on erosion factors [43,61]. The RUSLE model has been widely implemented for the prediction of average annual soil losses caused by sheet and rill erosion and to display the spatial distribution of potential erosion risk [23,55,61,62,63,64,65]. The application of the RUSLE model for soil erosion risk considers the rainfall erosivity factor (R), soil erodibility factor (K), slope length and steepness factor (LS), land cover and management factor (C) and the support practice factor (P) [43]. In the current study, the RUSLE model was adapted for mapping potential erosion using C and P factors as identity elements (C and P = 1) and for the spatial distribution of soil erosion risk.
According to [43], the Revised Universal Soil Loss Equation (RUSLE) states that:
A = R K L S C P
where: A is the annual average of soil erosion rate factor (t ha−1 yr−1); R is the rainfall erosivity factor (MJ mm ha−1 h−1 yr−1); K is the soil erodibility factor (t hMJ−1 mm−1); LS is the dimensionless slope length and steepness factor; C is the dimensionless crop management factor (ranging between 0 and 1) and P is the dimensionless conservation support practice factor (ranging between 0 and 1). The calculation of the potential erosion is based on the same formula while adjusting factors C and P to one [3,65].
Spatial analyses in the study were performed using ArcGIS 10.2 software to assess the dynamics of soil erosion over time in the heterogenous urban landscapes for the years 2000, 2018 and the overall, 1984–2018 long-term rainfall data were used for rainfall erosivity factor computation (Figure 2). The LS factor RUSLE geospatial input factor was computed using a hydrology module (LS-factor field base) in SAGA GIS [66]. The acquired geospatial input parameters for the RUSLE model (Table 1) were used to produce thematic maps for the estimation of potential erosion and soil erosion risk generated within every cell grid [67,68,69]. For data harmonization, we resampled all data sources to determine 30 m × 30 m grid cell size using nearest neighborhood technique so as to retain original pixel value before carrying out grid cell calculations. This was performed to enhance data compatibility from varying data sources used for modelling [70].

2.2.2. Data Integration for Soil Erosion Risk Assessment

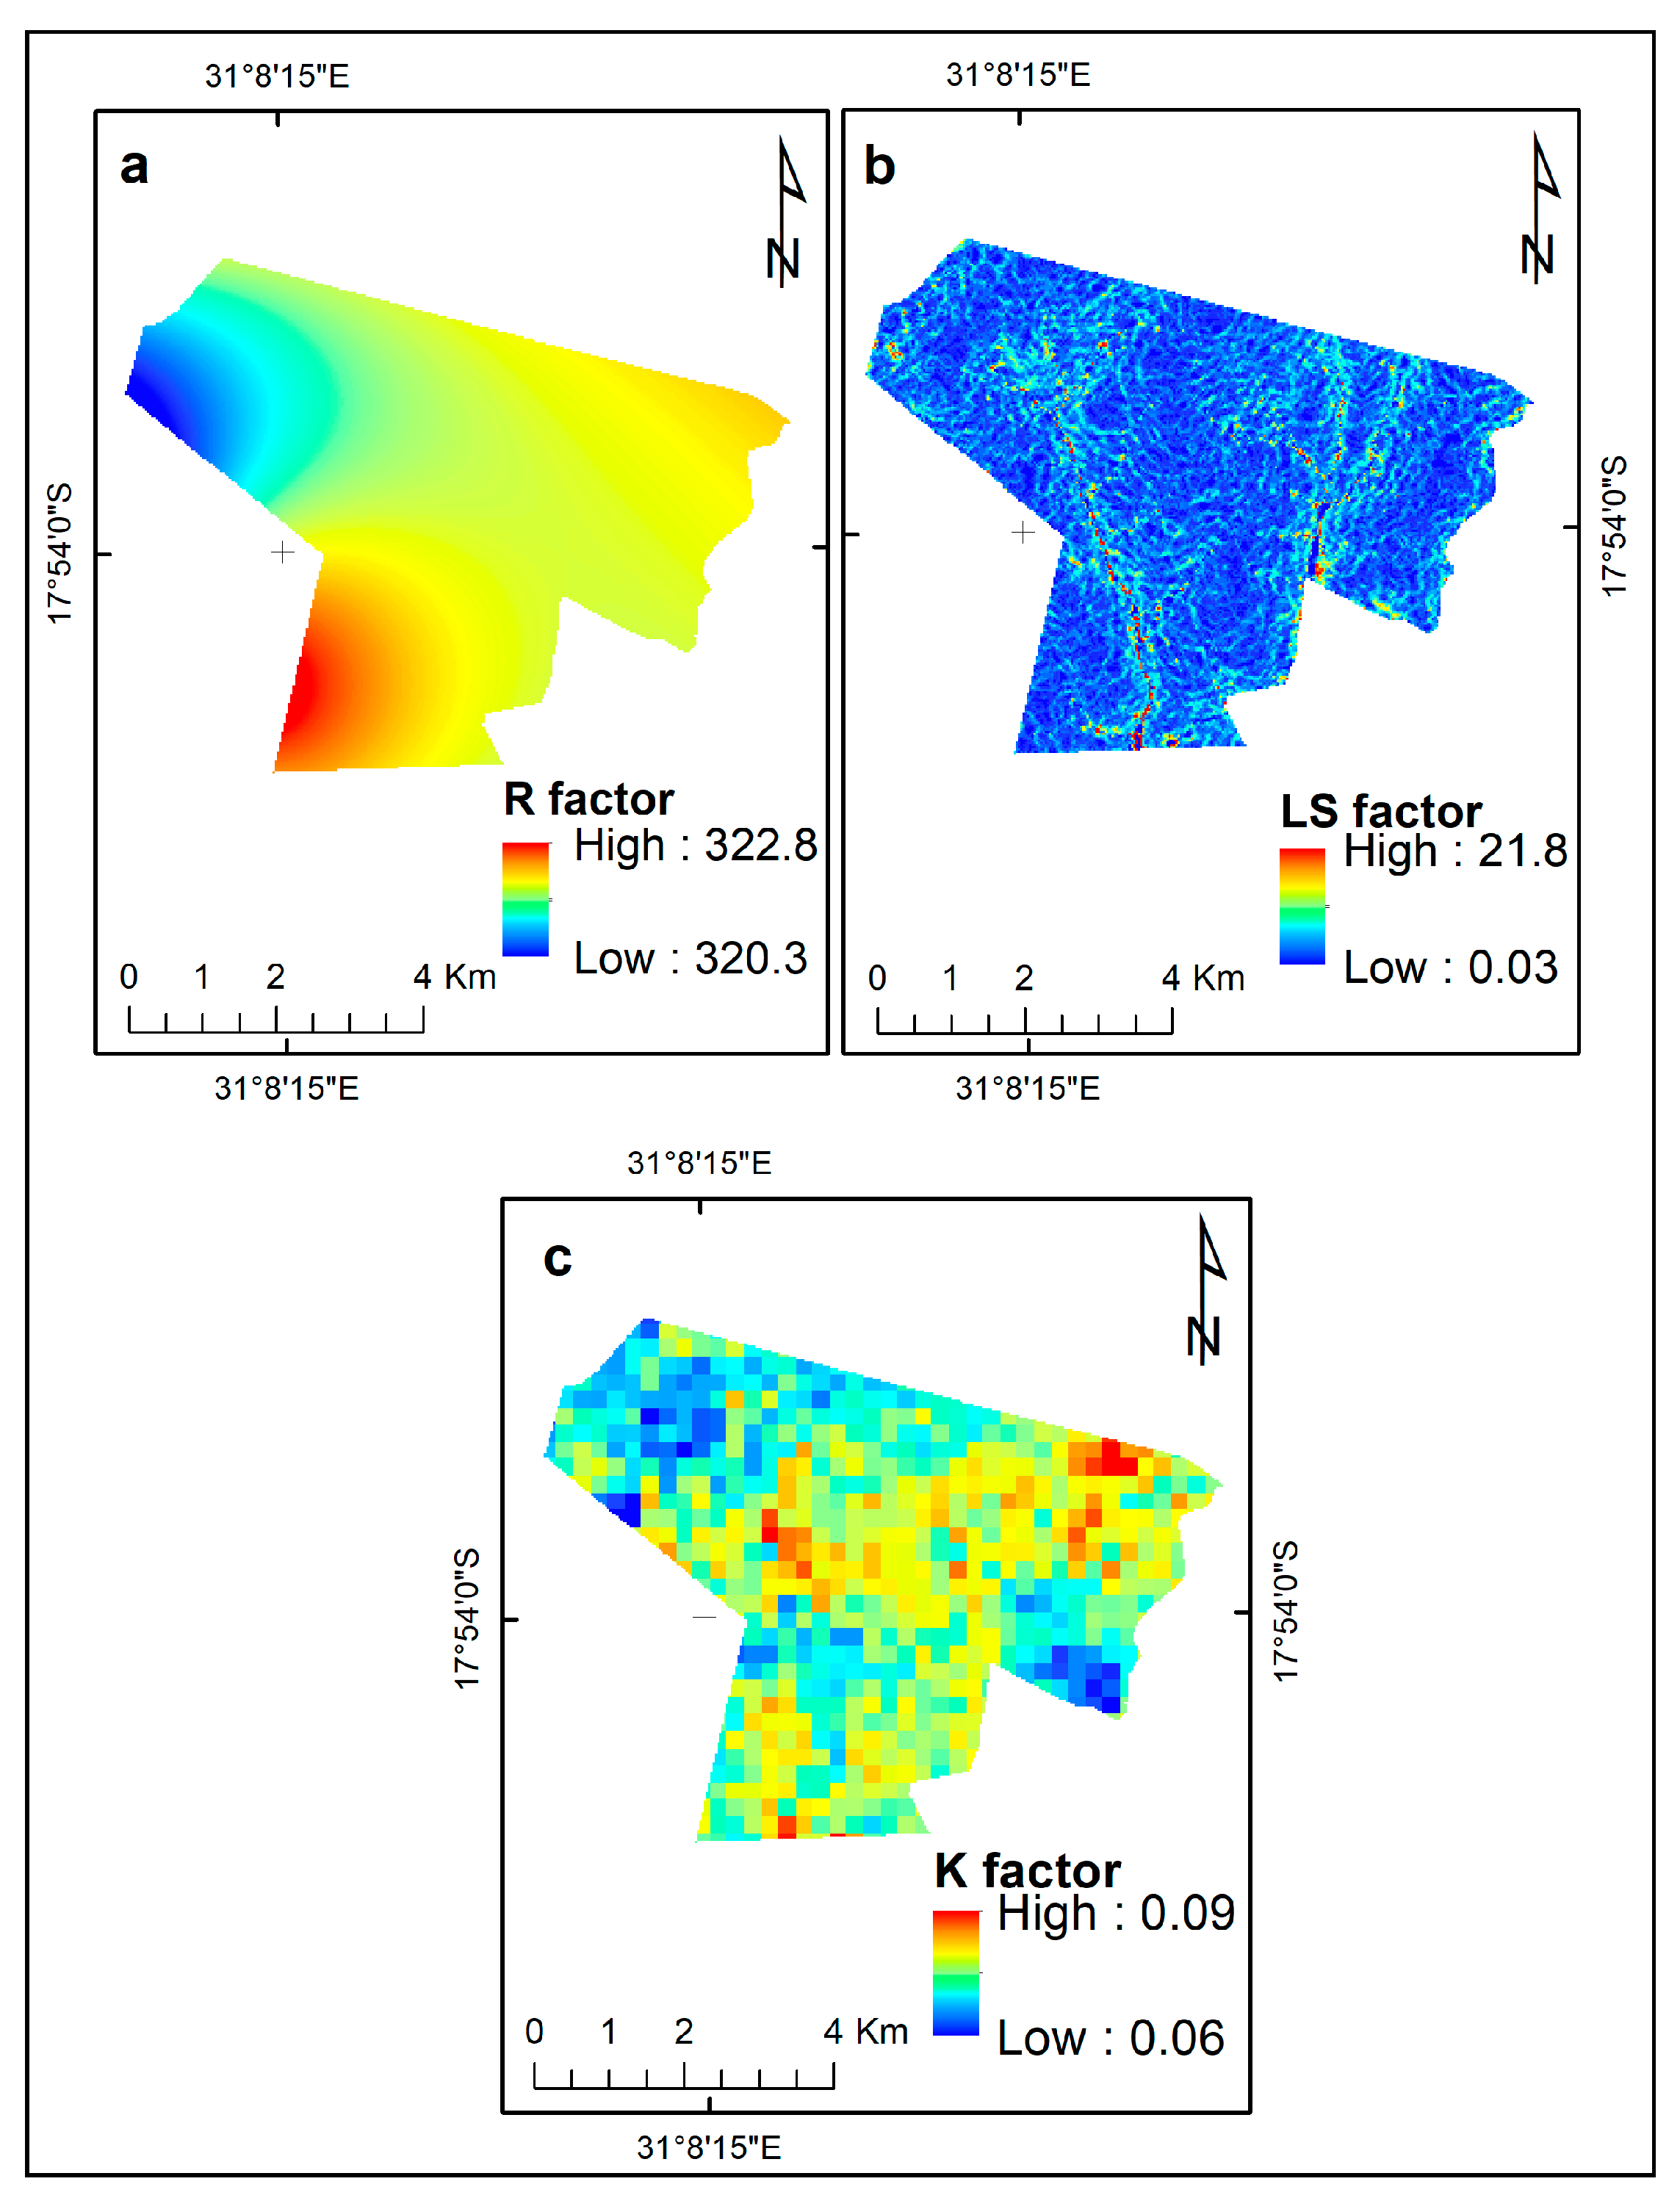
Rainfall Erosivity Factor (R)

Rainfall erosivity factor (R) describes the ability of rainfall to trigger soil erosion [69,73,74]. The RUSLE model makes use of this erosivity factor (R [MJ mm ha−1 h−1 yr−1]) in integrating the effects of raindrop impact, rainfall duration and resulting runoff rates, which are coupled with the amount and the energy within each recorded rainfall pattern [43,69]. Rainfall erosivity was calculated using mean annual rainfall data collected from three gauging stations in Harare Metropolitan Province (Harare Belvedere, Harare airport and Harare Kutsaga; Table 2) following Equation (2) [40,64]:
R = 38.5 + 0.35 M
where R = Rainfall erosivity factor, M = Mean annual rainfall.
To analyze possibly changing rainfall erosivity since 1984, annual rainfall averages were calculated for the time steps: 1984–2000, 2000–2018 and overarching, 1984–2018. The mean annual precipitation data were interpolated over entire district by applying the inverse distance weighting (IDW) interpolation technique and converted to rainfall erosivity by applying Equation (2).

Soil Erodibility Factor (K)

The responsive effect of a particular soil in a given location to the erosive power of rainfall and runoff impacts is referred to as the soil erodibility factor (K) [16,75]. Soil erodibility is regarded as a function of the soil texture, organic matter content, soil structure and the degree of permeability [41,76]. Soils being highly susceptible to erosion have soil erodibility values close to 1, whereas corresponding values close to 0 indicate a resistive nature of the soil [51,77]. In the current study, information on soil structure and profile permeability was not available. Therefore, the K factor was estimated using the ISRIC (International Soil Reference Information Centre)-World Soil Information data [78], following the equation by [79].

Topographic Factor (LS)

The LS factor summarizes the effects of topography on soil erosion and combines the influence of slope length and slope angle on soil loss; while the S-factor measures the effect of slope steepness, the L-factor defines the impact of slope length. The slope length L is defined as the distance between the upslope starting point of a slope segment to the downslope point where deposition begins [33,66]. Increasing slope length and steepness per unit area results in increased runoff and flow velocity and consequently in increased soil loss exposure [42,75,80]. The Shuttle Radar Topography Mission (SRTM) digital elevation model (DEM) with a spatial resolution of 30 m was used for the LS factor computation applying SAGA software 2.3/Hydrology module [66,80]. For data pre-processing, fill sink algorithm was employed using the spill elevation method for filling sinks on the DEM [81]. Multiple flow direction tool (MFD) incorporated in the Hydrology module was applied to the DEM to assign flow directions and flow accumulation [82,83].

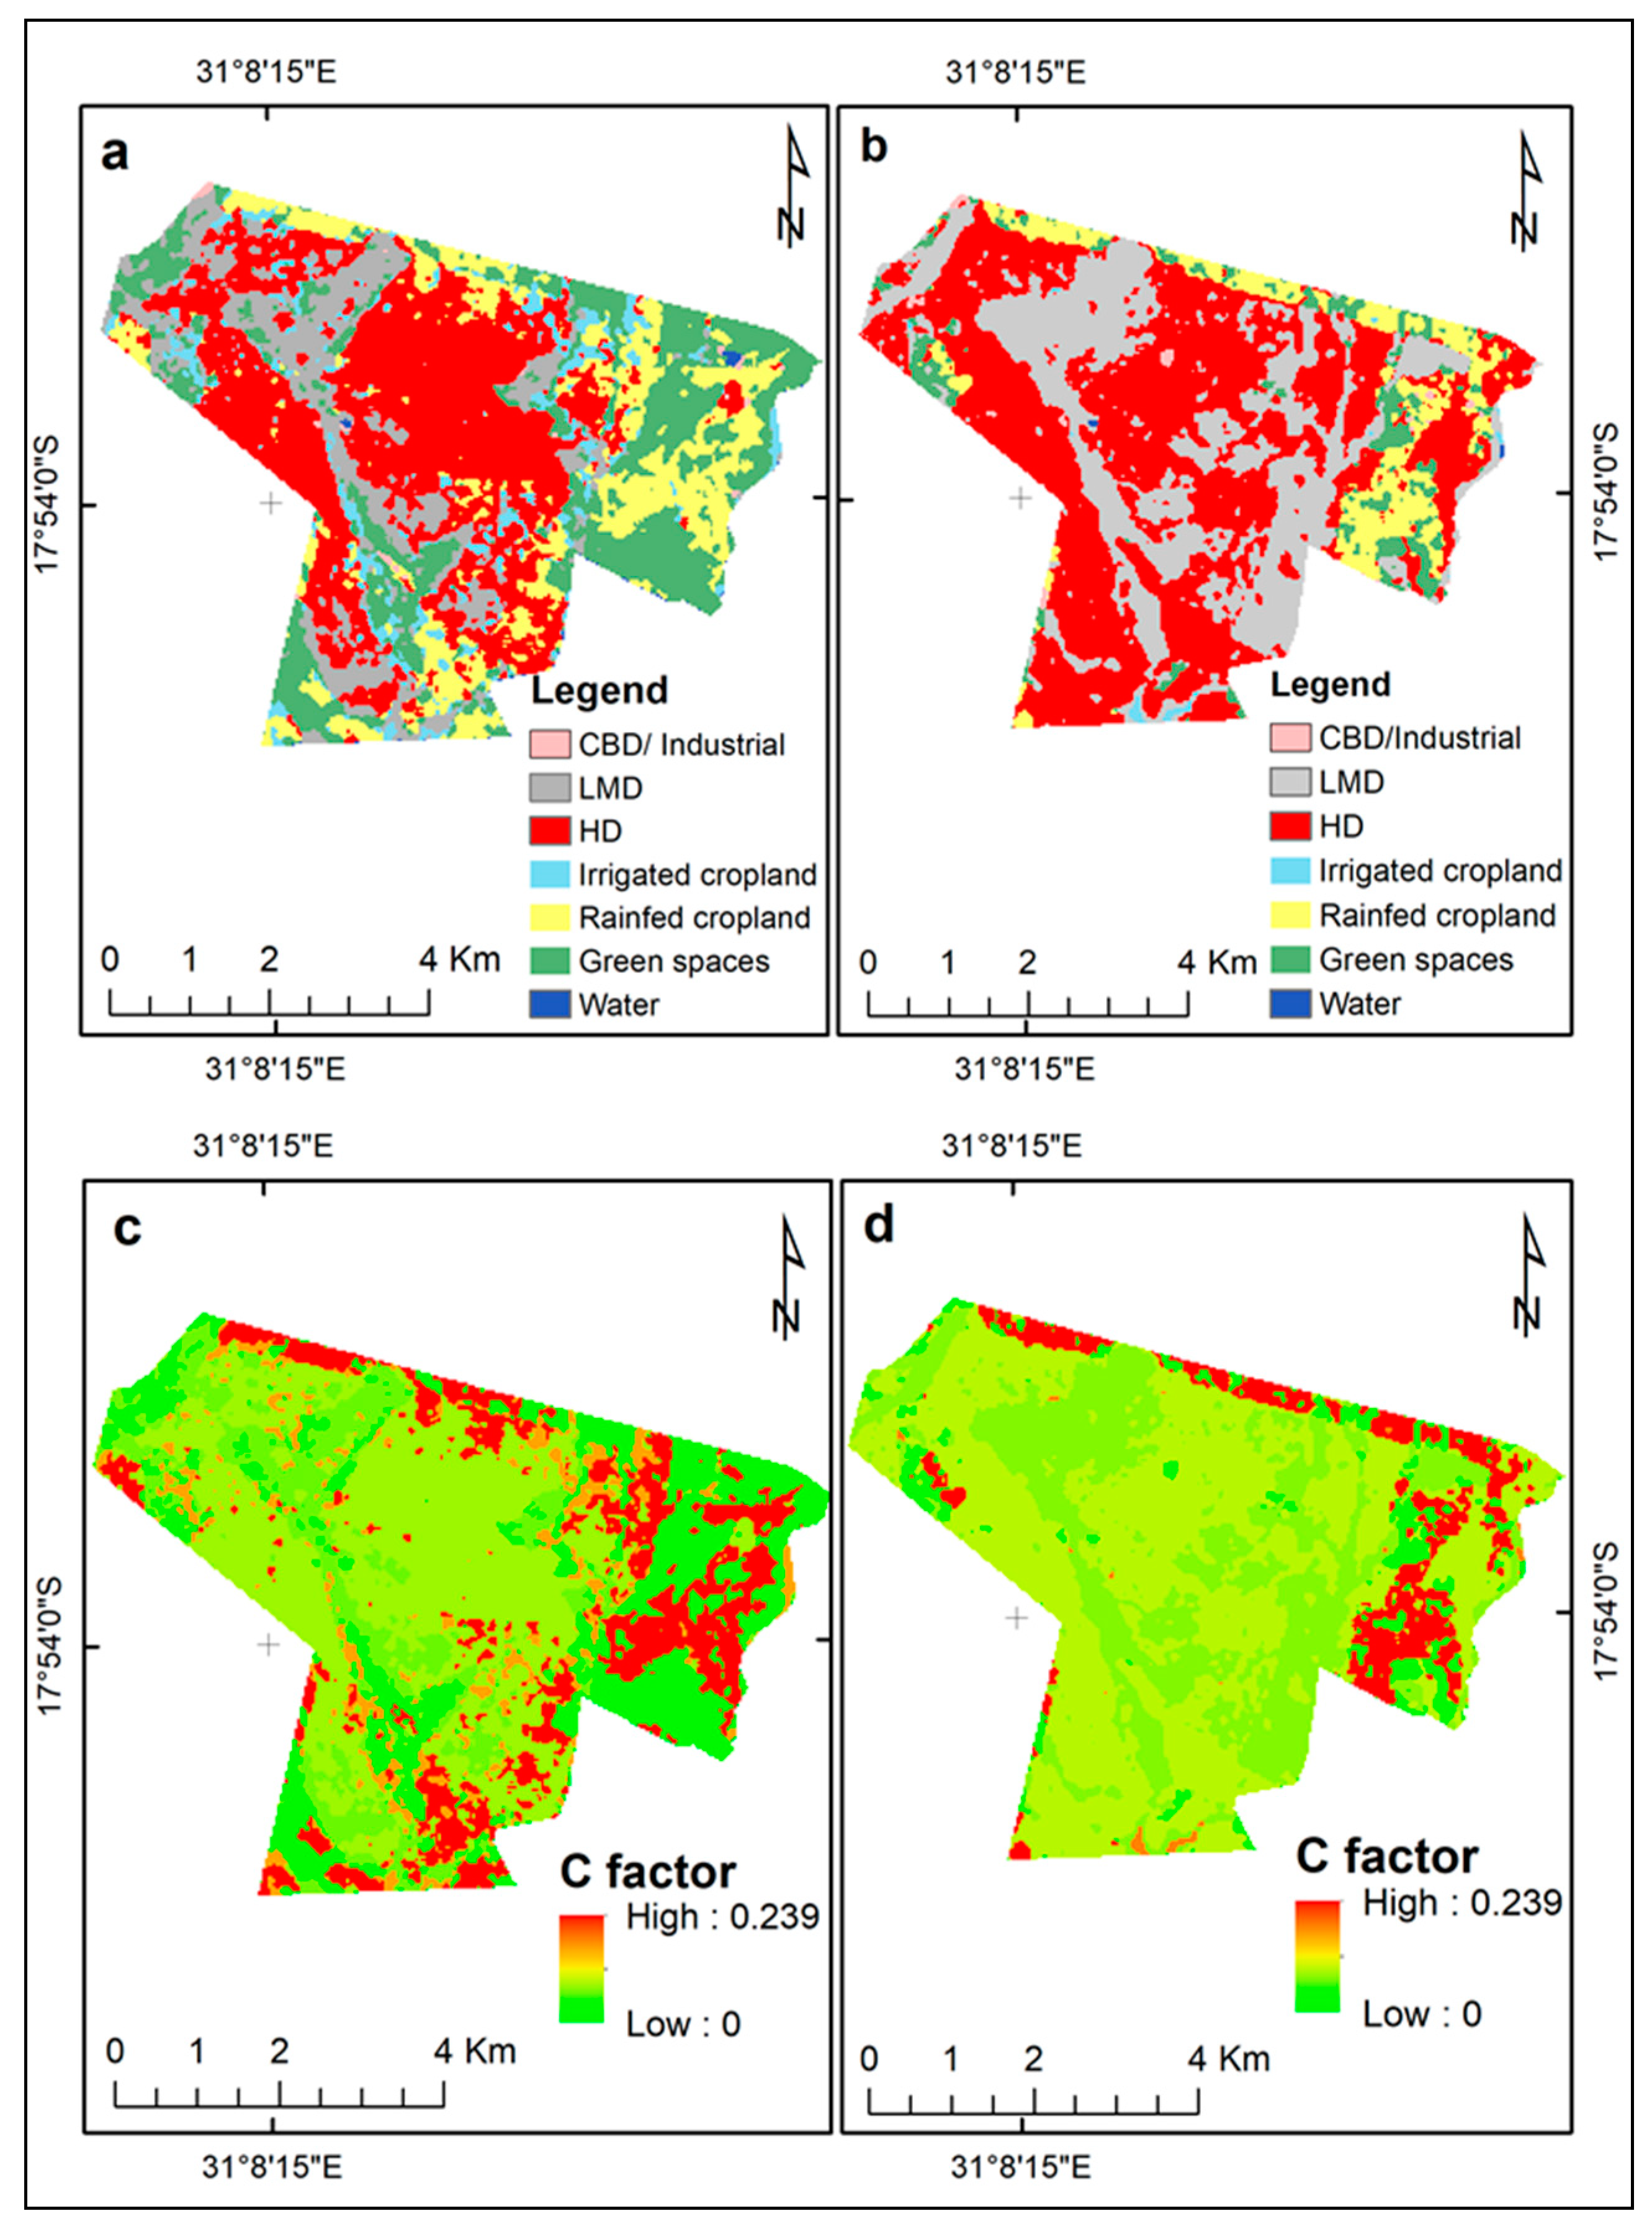
Land Cover and Management Factor (C)

The Land cover and management factor C’s pivotal role is to capture differences in soil loss in vegetated areas by dissipating raindrop impact on the soil surface compared to bare areas [43,84,85]. The C factor decreases from 1 to 0 depending on vegetation cover and cropping management systems implemented to mitigate soil erosion [41,80]. In order to determine the C factor, land use maps generated from the supervised classification of satellite images were adapted for use [9]. The C factor values for each land use are a result of weighted average of the soil loss ratio deduced from a reference plot (bare) with a C factor of 1 [43,66]. Henceforth, the C factor values of each land use type were evaluated from literature [3,86,87,88]; weighting of the data was performed following field observations and the biophysical characteristics per sampling plot (canopy cover, prior land uses, and surface cover) [43,89]. The weighted C factor evaluation considered plant growth, height and the extent of canopy cover in-situ [89,90], in relation to bare and sealed area. Further, previous urban farming practices and residues of the plant material influence were majorly factored in during surface cover subfactor assessment per sampling plot. For croplands the C factor was estimated by averaging the values of predominant crops within the study area’s croplands [91]. The availability of remote sensing data, especially the supervised classification maps, appropriately aided the evaluation of spatial variability of the C factor [89]. Overall, the weighted C factors were estimated as a result of multiplying the scaled percentages of the evaluated C subfactors (Table 3), reviewed RUSLE C factors according to the literature [86,87,88] and the ratio of sealed area proportion [9] in relation to the reference plot (bare).

Support Practice Factor (P)

The Support practice factor P expresses the effects of surface management practices that are applied to reduce soil loss through erosion processes [30,43]. These practices include among others terracing, strip cropping and contour ploughing [43]. The P factor value ranges between 0 and 1, where 0 shows the highest effectiveness of the conservation practice and 1 indicates that there are no support practices or measures implemented [43,92]. In this study a P factor of 1 has been all-over applied due to the area wide absence of support or management practices.

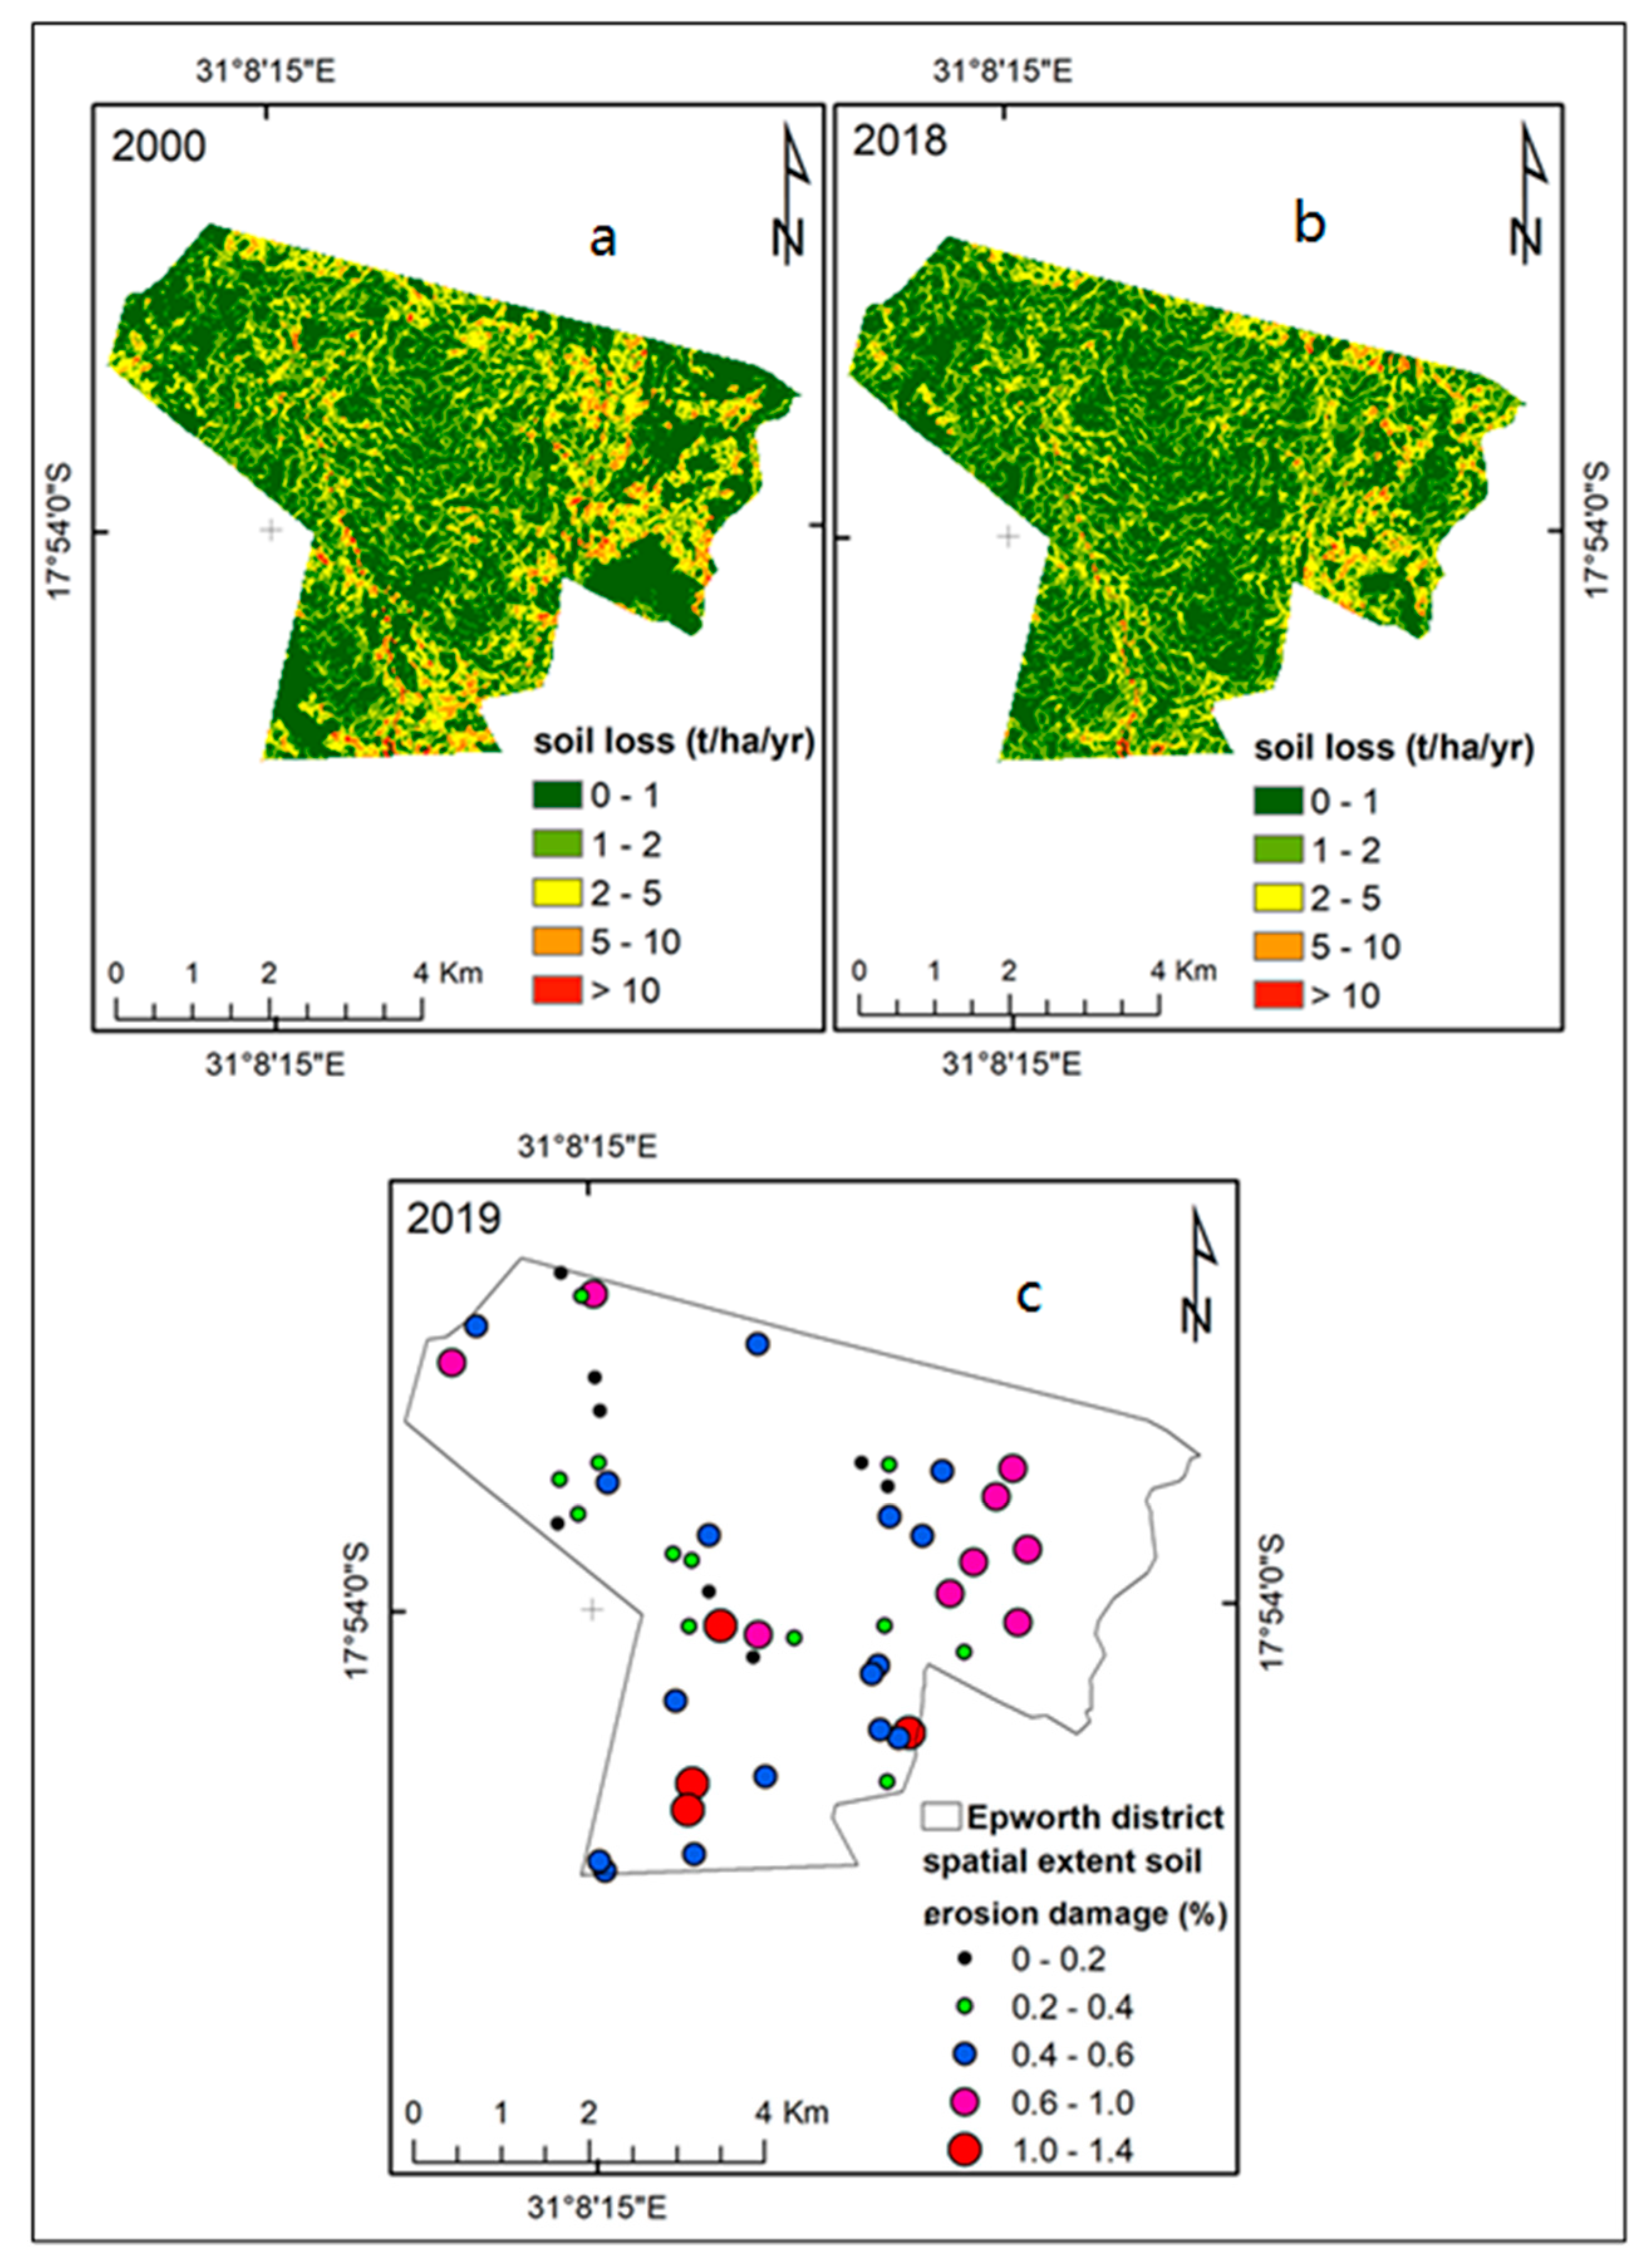
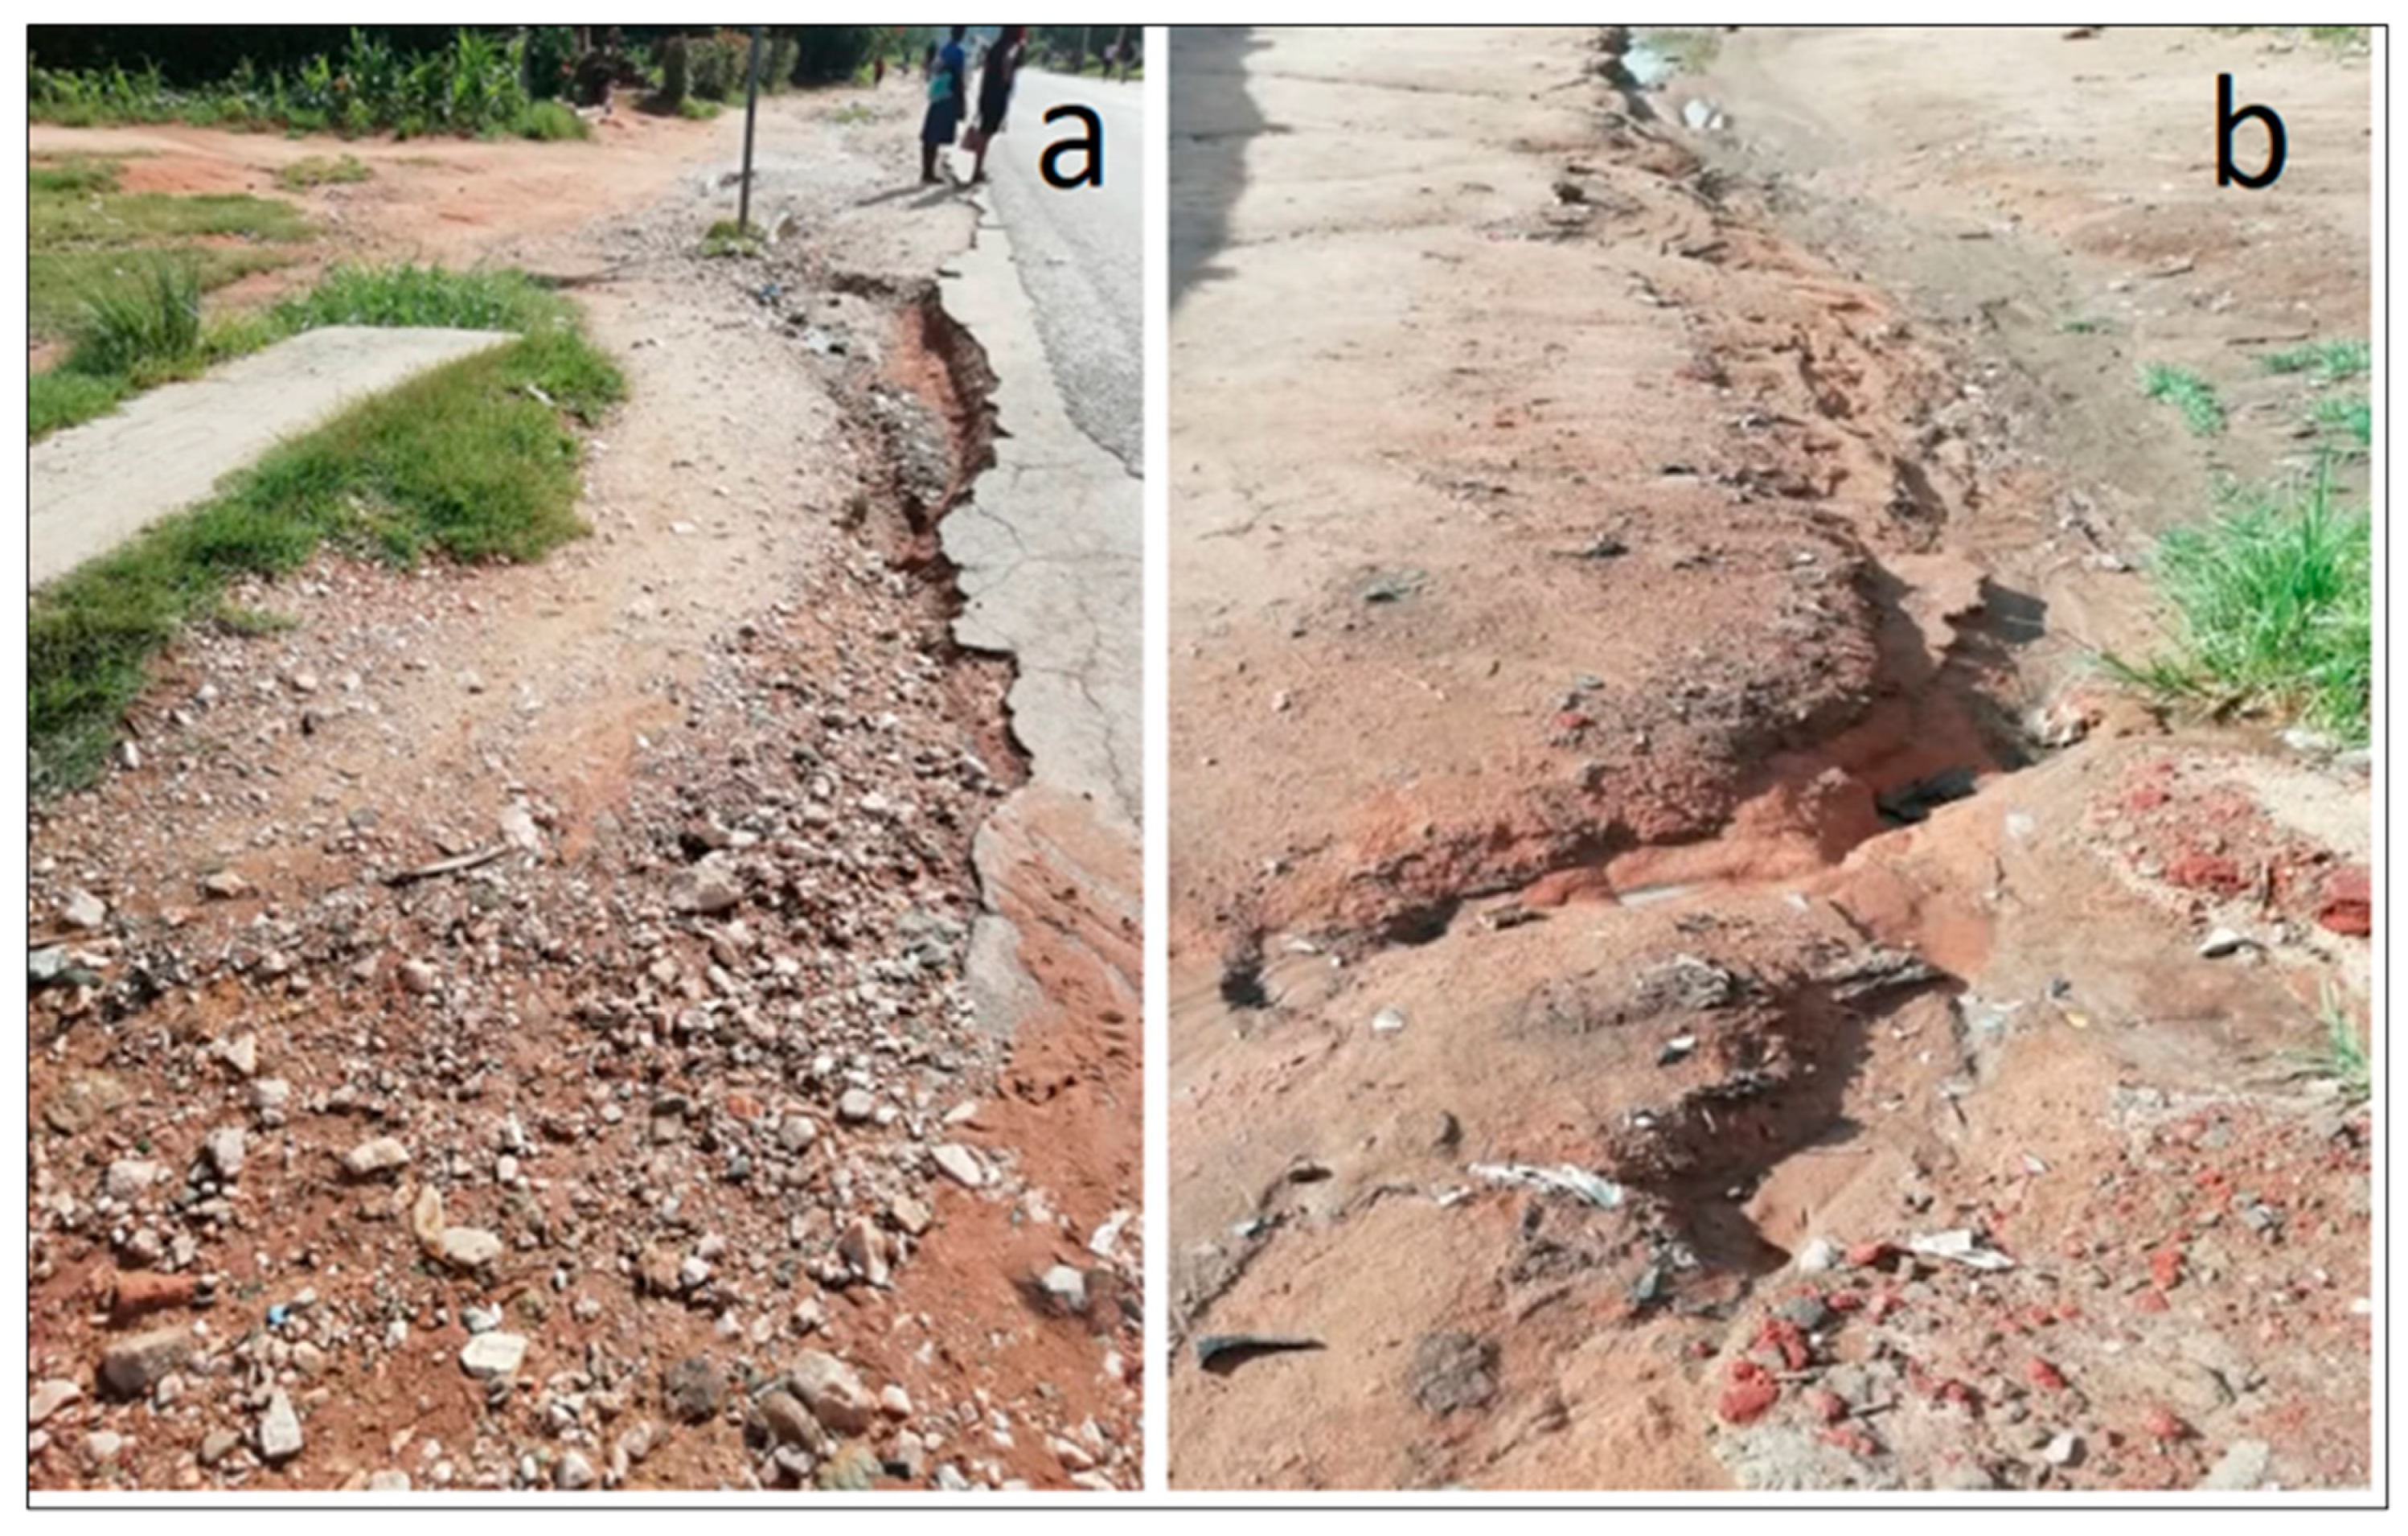
2.3. Mapping and Surveying Soil Erosion Dynamics

The complexity of the setup of urban built-up areas and the distribution of the different land use require soil erosion field survey mapping to receive reference data [23]. In this regard, a simple snap-shot sampling procedure was implemented during the field survey in December 2019 to estimate the spatial extent of eroded areas on plots 40 m × 80 m in size [23]. In total, 49 sites were randomly surveyed, covering varying land use. Mapping of spatial soil erosion assessment was geocoded using a hand-held GPS (Garmin 60Cx); parallel on-site soil erosion features were measured, considering the erosion features (inter-rills and rills) individually calculating their area and volumes [55,93]. Rills were defined as linear erosion channels not more than 0.5 m deep and with a cross-sectional area <929 cm2 to make them distinct from ephemeral gullies and deep incised gully features [94,95].
Overall total percentages of disturbed surface area data were registered for the sample plots in the Epworth district to estimate the spatial extent of perturbed regions of the district. The spatial extent of eroded areas was estimated as percentage per plot [23] and classified into five severity classes. Mapping results are displayed in a positional diagram map.

3. Results

3.1. Factors Controlling Soil Erosion

The rainfall erosivity factor map for Harare’s Epworth district depicts very small variations over the study periods between 1984 and 2018 (Figure 3). The annual area wide R factor averaged 329 MJ mm ha−1 h−1 yr−1 between 1984 and 2000 (std = 0.55, n=16), 315 MJ mm ha−1 h−1 yr−1 between 2000 and 2018 (std = 0.27, n=18) (Figure S1). As for both observation periods, the R factor did not vary significantly (α >0.05), the area wide averaged R factor for the time period 1984–2018 with 322 MJ mm ha−1 h−1 yr−1 (std = 0.38, n=34) was applied (Figure 3).
Soils in the Epworth district upland’s areas are dominated by sandy to clayey loams and sandy loam along the alluvial plains; also, at sloping positions sandy loam soils frequently appear. Correspondingly, K factor values vary in the Epworth district between 0.06 and 0.09 t h MJ−1 mm−1 and are highest along the slopes flanking the valleys while they are lowest in the plateau area. Relief in the Epworth district is due to its location at the northern extension of the Highveld slightly rolling. Slopes at the plateau vary between 0.74° and 2.0°, while along the valley flanks they increase in steepness up to 4.6°. Correspondingly, the values of the topographic factor (LS) are highest along the valley flanks, increasing from the headwater areas moving downstream of the Epworth district (Figure 3). Overall, the topographic factor values range from 0 in the plateau areas to 21.74 in steep areas.
The land cover management factor weighted values are based on field observations and satellite images on LULC analysis (Table 1 and Table 4, Figure 4). Data for the LULC changes from 1984–2000 and 2000–2018 were adapted from [9].

3.2. Potential Erosion Risk Analysis

The potential erosion risk map was derived from the application of the “natural” RUSLE factors for soil characters, rainfall erosivity and topography (K, R and LS) for the Epworth district. Resulting data are classified into five potential erosion risk classes showing how erosion varies in the Epworth district (Figure S2). The potential erosion risk map indicates the vulnerability of the landscape independent from vegetation cover and crop management. The findings reveal that very high to extreme erosion risk areas occur in areas of steep slopes (Figure S2); the only spatially slight variations of R and K factors cause a strong control of potential erosion risk by topographic factors’ LS. Due to the general orientation of the drainage network to the south and downstream with increasing inclination of the slopes along the valley flanks, the areas with high erosion risk expand from the north to south. Very high to extreme erosion risk areas are also observed in the eastern parts of the Epworth district resulting from locally occurring steep slopes towards the middle course of the Jacha river and tributaries. In contrast, low to moderate potential erosion risk areas occur in the plateau areas of the Highveld. Extreme potential erosion risk zones occur in the immediate vicinity of streams and at steep slopes. The area wide average potential erosion risk rate in the Epworth district was 13.2 t ha−1 yr−1 since 1984, referring to the precipitation data 1984–2018 (Figure S2, Table 5).

3.3. Soil Erosion Risk

The estimated soil erosion risk maps were generated for 2000 and 2018. The estimated soil erosion risk averaged 1.31 t ha−1 yr−1 in 2000 and 1.12 t ha−1 yr−1 in 2018; with highest total soil loss rate for the Epworth district amounting to 92.79 t ha−1 yr−1 in 2000. The spatial patterns of the estimated soil erosion risk indicate areas with high soil erosion loss predominantly along the river courses (Figure 5). Correspondingly, areas of high soil erosion risk can also be found in the southwestern and southeastern parts of the Epworth district with highest soil erosion risk close to the river courses.
The soil erosion damage map shows plot-wise surface area damages in the Epworth district calculated from the soil erosion feature dimensions, expressed in percentages of the total surface area for each plot (Figure 5). According to this soil erosion damage map, the southeastern and southwestern plots of the Epworth district experience higher soil erosion compared to the other areas investigated. The spatial extent of the soil eroded area ranges from 0% to 1.4% for the surveyed plots in the Epworth district. The magnitude of soil erosion observed during field mapping in 2019 indicated that slope, high proportion of sealed and impervious surfaces attributed to increased soil erosion damages in the Epworth district (Figure 6).
The estimated soil erosion risk for the year 2000 highlights that 56.3% of the Epworth district was exposed to low soil erosion risk and 25.9% to moderate soil erosion risk, while 15% of the Epworth district was exposed to high, and 2.8% to very high and extreme soil erosion (Figure 6, Table 6). For 2018 modelling of soil erosion risk displays a slight decline of risk of exposure with 59.5% of the area being exposed to low soil erosion risk and 29.3% to moderate soil erosion risk; the spatial extent of areas exposed to high soil erosion risk declined to 10% and areas exposed to very high to extreme soil erosion risk covered 1.2% of the Epworth district (Table 6).

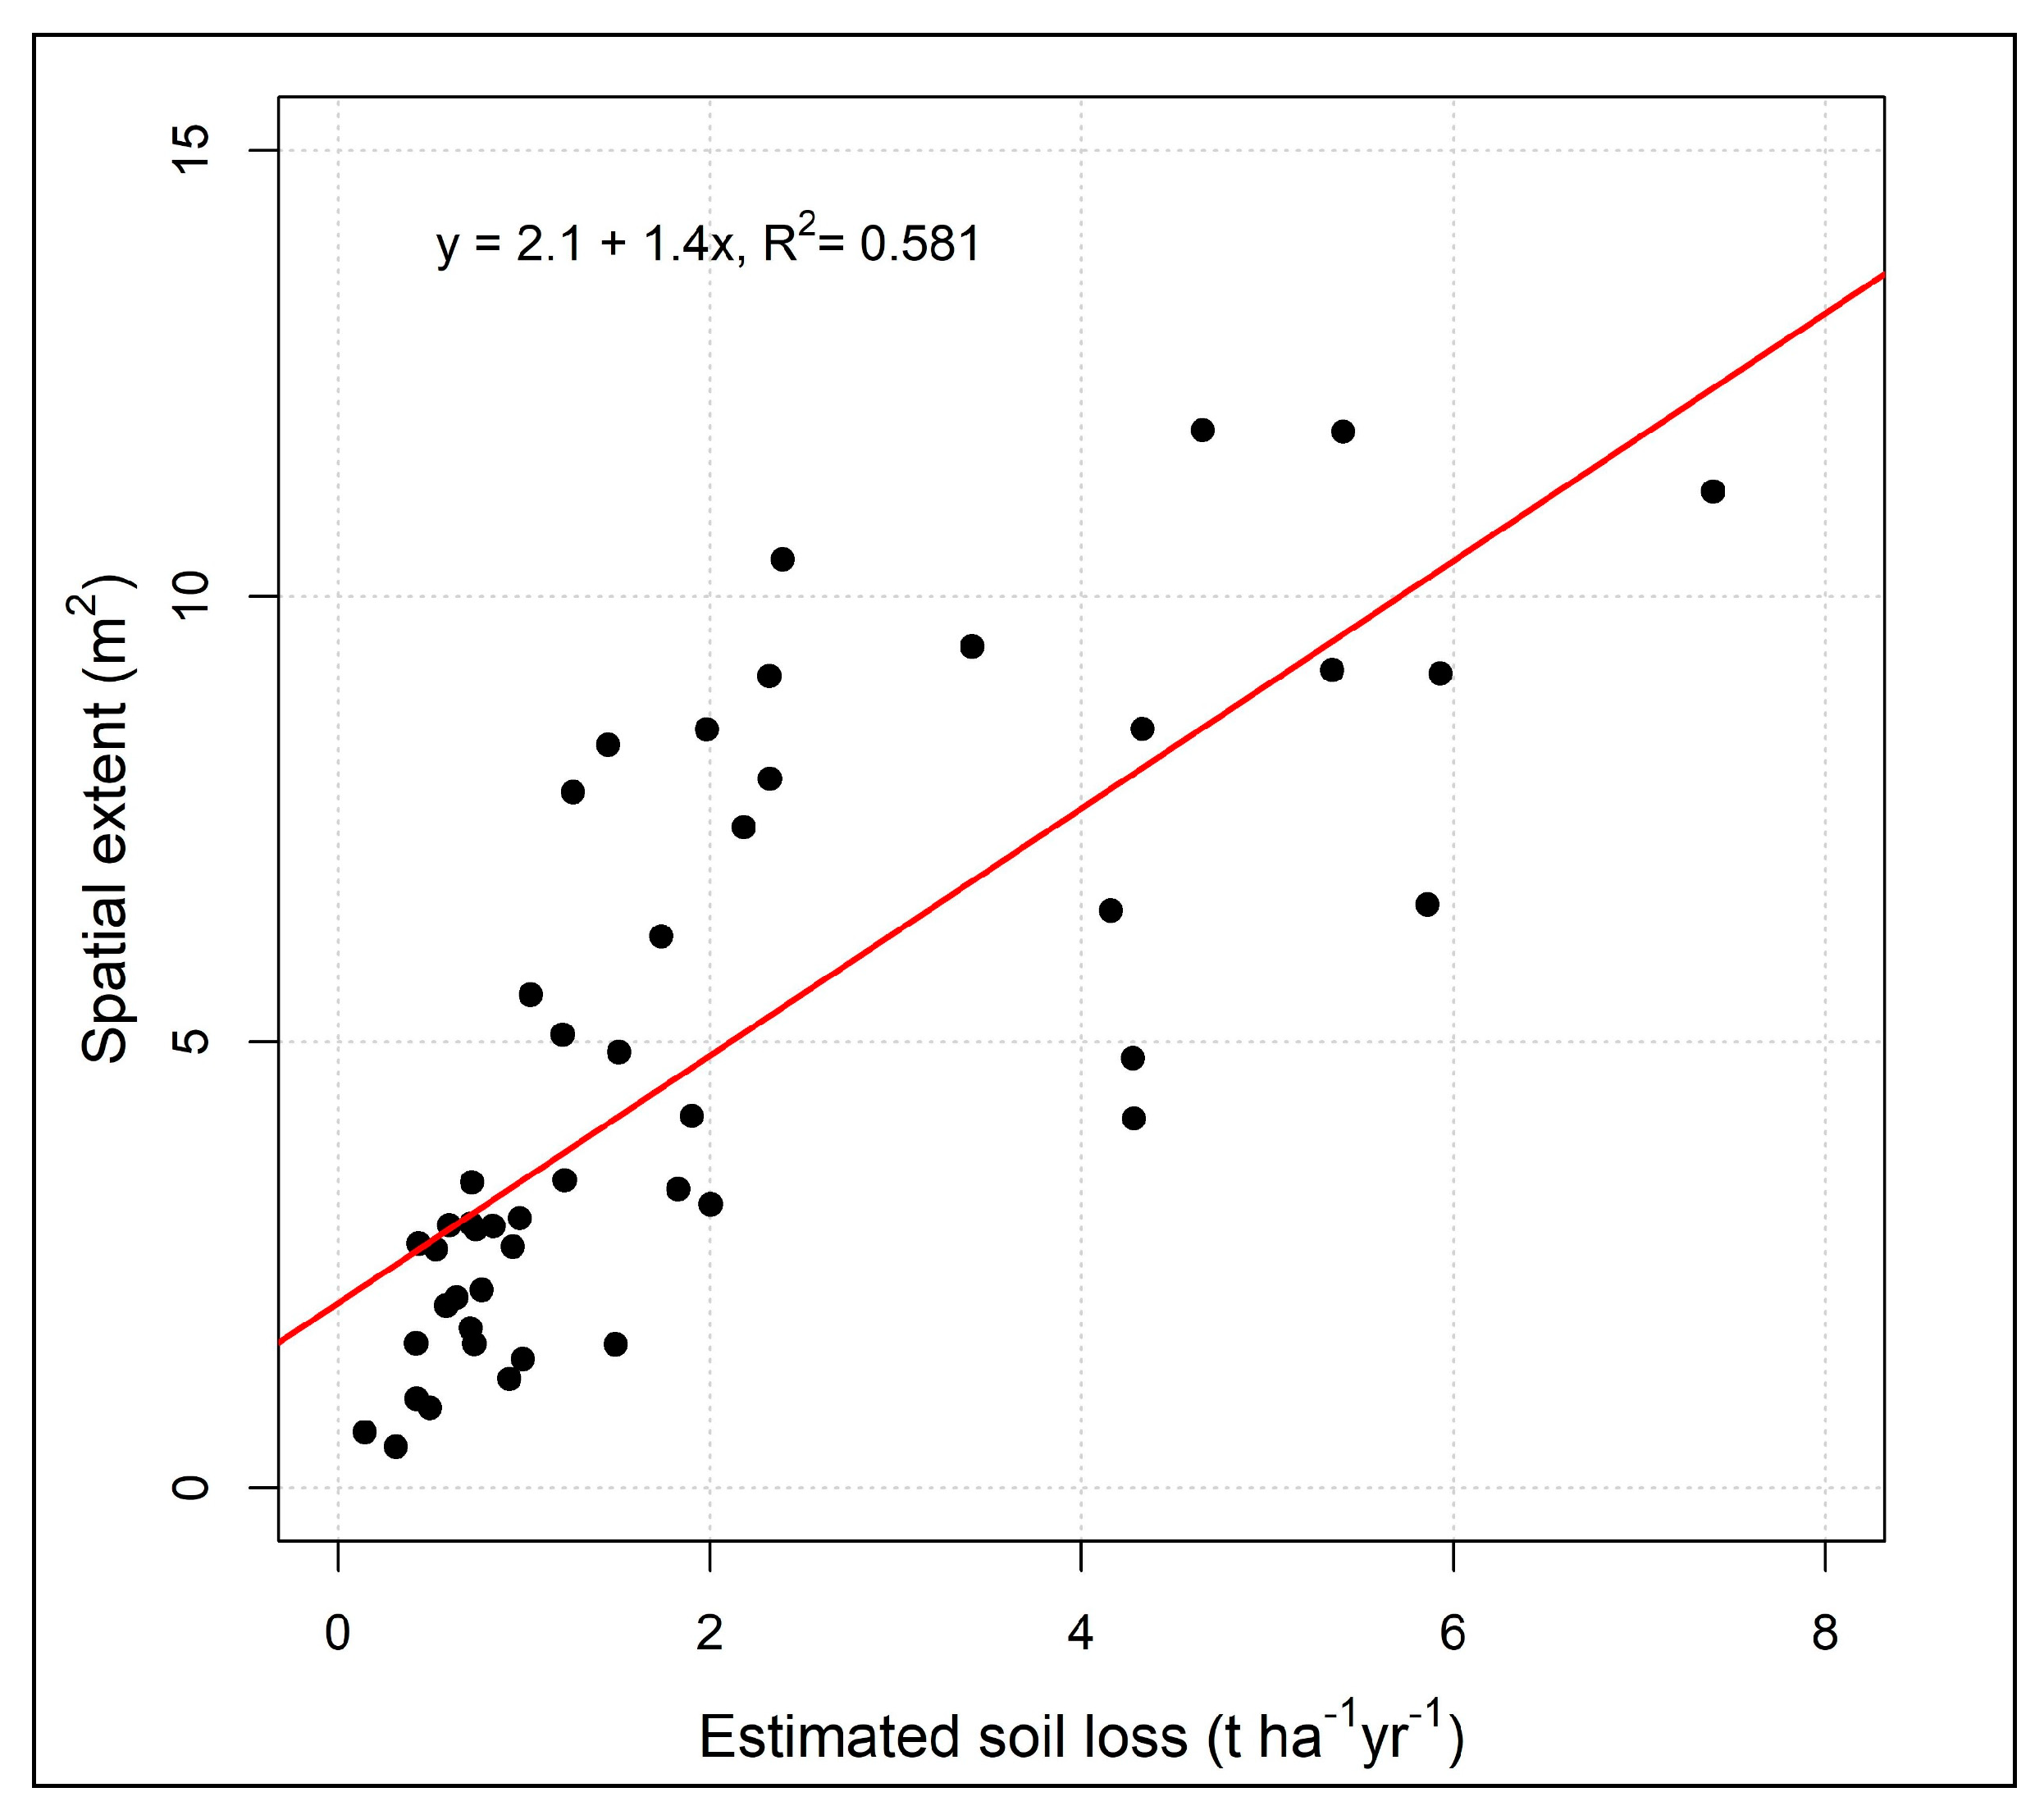
3.4. Magnitude of Soil Erosion in Epworth District

A spatial extent of about 765 m2 was eroded with an average area of 31 m2 affected by soil erosion as calculated from the 49 randomly selected sample plots in Epworth district during the field survey in 2019 (Table 7). The soil erosion damage measured approximately 0.5% of the total area mapped (15.7 ha). The occurrence of soil erosion features varied in the surveyed plots corresponding to vegetation cover, slope characteristics and human activities.
Model validation was done using the empirical RUSLE model data in comparison with on-site field measurements. The results showed good RUSLE model performance as there was satisfactory moderate positive correlation between field measurements and model results for sample areas (r = 0.76 and R2 = 0.581, p <0.05) (Figure 7). This provides confidence in the application of the model for sustainable land use planning and decision-making processes.

3.5. Land Use and Soil Loss Analysis

The results show that about 50,408 tons of soil were estimated to be lost under 2000 LULC conditions, while an estimated total soil loss of 42,934 tons was calculated for 2018 (Table 8). For the industrial areas of Epworth district, approximately 40 tons of soil loss were estimated for 2000, while an increase of up to 47 tons of soil loss was estimated for the same land use type for 2018. For 2000, for the land use type “less concentrated residential area” (15.5% of the Epworth district in 2000) 6218 tons of soil loss were estimated while, for the land use type “concentrated residential areas” (38% of the Epworth district in 2000) about 14,018 tons total soil loss were estimated. An increase in soil erosion risk for less concentrated and concentrated residential areas were estimated to amount 12,203 tons for the “less concentrated residential areas “(31.5% of the Epworth district in 2018) and 19,858 tons for the “concentrated residential areas” (52.6% of the Epworth district in 2018). A decline in the estimated soil loss was observed for land use types either of agricultural use or covered by green spaces (undifferentiated) between 2000 and 2018, decreasing proportional to the reduction of the areas of these land use types (Table 8).

4. Discussion

For the tropics, studies reported average soil loss rates of 5 t ha−1 yr−1 [96,97], while [98] highlights that a soil loss limit of 11 t ha−1 yr−1 may be accepted as reasonable mean annual loss due to soil erosion. However, [99] argues that for sensitive and fragile land areas average soil loss tolerance rate of 2 t ha−1 yr−1 could be recommended. In contrast, considering the slow rate of soil formation and spatio-temporal effects of soil loss on water quality and productivity, tolerance limits for soil erosion loss are set for the tropics at 1 t ha−1 yr−1 [3,65,100]. The occurrence of soil loss exceeding 1 t ha−1 yr−1 was considered as the critical rate for the Epworth district due to the low rate of soil formation as typical for the tropics [3]. This agrees with the recommendation of [98] that the rate of soil loss through soil erosion should be relatively balanced with the soil formation rate to minimize excessive environmental damage. As such, average soil loss rates exceeding the suggested 1 t ha−1 yr−1 are classified as unsustainable to continue supporting land use [101,102].
The empirical RUSLE model implemented in this study was applied to predict potential erosion risk and soil erosion risk for the Epworth district of the Harare Metropolitan Province (Figure S2 and Figure 5). The calculation of the potential erosion risk is based on the assumption that there is no land use and no land management as well as no support practice; potential erosion is understood as the erosion processes only controlled by physical factors. Consequently, potential erosion risk depicts areas vulnerable to erosion even without considering land use [65]. For the Epworth district the potential erosion risk was averaged at 13.2 t ha−1 yr−1 between 1984 and 2018, significantly exceeding the soil loss tolerance limit of 1 t ha−1 yr−1 for the tropics [3,100].
Estimated soil losses due to soil erosion risk averages amounted to 1.31 t ha−1 yr−1 and 1.12 t ha−1 yr−1 in the years 2000 and 2018, respectively. Correspondingly, the revealed soil loss due to soil erosion risk for Epworth district was slightly above the recommended tolerable limits of 1 t ha−1 yr−1 [3,65,100]. Considering the proposed range of tolerable maximum annual soil loss in tropical regions, it can be deduced that the mean estimated soil loss during all study periods slightly causes irreversible soil erosion. The occurrence of high potential erosion risk compared to low soil erosion risk is due to the assumption that for the calculation of potential erosion risk, the factors land cover and management (C) and support practice (P) are not considered, and consequently, these factors are mathematically handled as identity elements in order to assess the impact of RUSLE “natural factors” on the study area. In the application of the RUSLE this corresponds to dealing with C and P factors as bare ground [3]. Such conditions earmark the impact of soil erosion on cleared land area and also reveal the significance of vegetation cover in dissipating raindrop energy impact on the bare ground. Nevertheless, such scenarios merely occur in urban areas as a result of built-up densification and spread of impervious surfaces unless croplands and disturbed green spaces exist at larger scale.
The decrease of soil loss due soil erosion risk for the Epworth district calculated for the period 2000–2018 probably resulted from the expansion of built-up areas at the expense of green spaces and cropland areas and thus with sealing the underground impeding surface exposure to erosion [5,103]. However, soil disturbance has been triggered by human activities in the district due to high population pressure and demand for shelter [104,105]. This contributes to increased soil loss within the urban built-up areas compared to the previous years (Table 8). The replacement of green spaces with impervious surfaces causes a reduction in surface area for water infiltration [106,107], causing increased overland flow either by sheet flow or by concentrated surface runoff. This substantially threatens soil loss through erosion where the overland flow reaches areas where soils are exposed to the surface making them highly vulnerable landscapes with mostly bare grounds [5,7].
Construction activities create artificial slopes and reduce vegetation canopy cover exposing soil surfaces to raindrop impact thereby exacerbating rates of soil detachment and transportation during rainstorm events [30]. Beyond, construction activities repeated earth movements affect the stability of the soil structure and increase soil erodibility [74,108] and soil compaction resulting in the reduction of infiltration capacity and increase surface runoff generation [107,108]. Therefore, continued LULC changes dominated by the expansion of built-up areas largely perpetuate soil loss within the built-up areas [103]. To ensure that soil erosion risk thresholds remain sustainable, land suitability analysis should be considered to enhance land use allocation and proper land servicing require to be implemented by responsible authorities in order to meet competing demands for land. The findings of this study highlight that zones with high potential erosion risk and soil erosion risk correspond to zones of strong relief and high slope lengths (high LS factors).
The weighted C factor values derived based on the biophysical properties observed and measured in the field [42,66]. The approach integrated LULC maps derived from satellite images. However, there are limitations on the use of LULC data resulting from misclassifications, heterogeneity and spatial distribution of vegetation densities across the entire district. The resulting approach anticipates that the same LULC class poses the same land cover and management factor C value [47,89,109,110]. However, uncertainties and limitations influencing the results could have also emanated from omitting other biophysical characteristics during estimations of the C factor including surface roughness and below-ground biomass [42,111,112].
An analysis of the relationship between LULC and estimated soil erosion risk was performed by overlaying LULC and soil erosion risk maps for the time slices 2000 and 2018 (Table 8). This relationship has been observed as a useful tool monitoring patterns of LULC change against soil erosion risk [3,100]; the analysis reveal spatial patterns and changes for each LULC class majorly as influenced by human activities in relation to soil erosion risk. Soil erosion risk was extremely high in rain fed croplands in the year 2000, highlighting their vulnerability to water induced erosion. This might have been propelled by leaving little to no crop residues as soil cover on the fields, exposing bare soil to rainfall at the onset of rainy season [22,24,113]. In addition, pre-season land preparation exposes fine tilled land to raindrop impact, exacerbating soil loss due to reduced surface and ground cover in dissipating and scattering raindrop energy [114], while concurrently ploughing increases surface roughness and pore volume, both fostering infiltration [115,116].
The estimated soil loss in areas covered by green spaces initially was predicted to be high considering the vegetation’s ability to intercept raindrop impacts [66]. However, it has to be clearly differentiated what character the vegetation cover has and whether the area is disturbed or undisturbed by human impact. Especially areas with sparse disturbed green spaces are exposed to erosion processes by the first rains coming after a dry period due to the hydrophobic character of dried out soils while parallel the soil stabilization by roots is insufficient [22,23]; footpaths spreading across areas increase soil sealing along the paths and thus foster generation of concentrated runoff [24,117]. Other local human activities including harvesting of firewood for domestic use, burning of bricks during their processing and fencing of gardens have negative impacts on vegetation cover. The more intense land use gets, especially transferring fallow land covered by sparse green spaces into built-up areas, the higher the soil erosion risk in this area, which is highly affected by the increasing areas characterized by sealed and impervious surfaces [118]. Soil erosion risk investigations on the Epworth district show that, despite the decreasing of the overall estimated soil loss from 50,408 tons to 42,934 tons between 2000 and 2018, the expansion of urban built-up areas at the expense of croplands and green spaces has locally increased soil loss risk.
The expansion and spread of residential areas have been linked with increases in soil erosion risk within areas of intense human activities (Table 8). The relationship between LULC and soil erosion risk analysis reveals that in concentrated residential areas in 2000 about 14,018 tons of estimated soil loss occurred, while about 19,858 tons of estimated soil loss occurred in 2018. The estimated increase of soil loss in concentrated residential areas corresponds to the massive growth of built-up areas and the coinciding increase of impervious surfaces [119]. The observed changes in built-up areas are significantly attributed to population growth in the Epworth district. The population was estimated to have increased from approximately 114,067 in 1992 to about 167,462 in 2012 [57]. The resulting reduced infiltration rates contributing to high rates of surface runoff [120], result in soil damage down the slope and parallel to roads [117]. The increase in estimated soil loss in the residential areas of the Epworth district are comparable with those in Kinshasa/DRC, where it is observed that highest soil erosion risk rates spatially correlate with steep slopes along river flanks and increasing density of informal settlements [38]. Estimated soil loss in less concentrated residential areas increased from 6218 tons in 2000 to approximately 12,203 tons in 2018. This corresponds to a doubling in size of the land use class “less concentrated residential areas” in the Epworth district from 15.5% in 2000 to 31.5% in 2018 (Table 8). The increase in soil loss for less concentrated residential areas may have resulted from the registered decrease in green spaces (Table 8). This is possibly attributed to high population pressure and demand for shelter, hence propelling landowners to informally construct shacks on their backyards to curtail housing demand. These activities inevitably occur at the expense of green spaces and ground cover resulting from clearing of land for construction [6,121].
Steep areas have high potential erosion risk as well as estimated soil erosion risk, especially on the flanks of the streams [122,123]. This corresponds to the high loading of slope steepness in the RUSLE model [124,125]. The combination of slope inclination with slope length contributes to the cumulative effect of increasing surface flow with increasing the drainage basin resulting in increased soil erosion risk [30,38]. For the Epworth district, wall around homesteads and industrial areas most likely acted as physical barriers for surface runoff, reducing slope length and affecting flow velocity and flow direction of surface runoff.
The spatial pattern of current soil erosion damage as documented in a diagram map is based of field survey in December 2019 (Figure 5 and Figure 6). The field measurements data serve as a validation tool for the estimated soil erosion risk modelling for the Epworth district. The plot-based field measurements recorded reflect the extent of erosion prevalent within the mapped area. The RUSLE model is presumed to predict the amount of soil moved on the field [126,127]; henceforth, the spatial damage data from the field measurements represented the proportions of soil moved. These mapped sites of the spatial extent damage map spatially concur with soil loss estimated using the RUSLE model. This, however, improves the model evaluation despite the lack of sheet erosion assessment. Even though, [128,129] reiterated that empirical modelling requires long-term field measurements and the analysis of sedimentation rates for validation purposes. The utilization of point-like plot-based data from field surveys for validation improves the evaluation of the model outputs and its understanding [55,130,131]. Validation of soil erosion risk modelling by comparison with outcomes of current damage mapping was further coupled with an analysis of the relationship between LULC and estimated soil erosion risk [62,100].
A total area of 765 m2 was subjected to soil erosion in 2019 recorded for the 49 randomly selected sampling plots covering an area of 15.7 ha in the Epworth district. The randomized locations of the plot measurements indicate that eroded areas occurred in high frequency in the southwestern and southeastern parts of the Epworth district. Evidently, the spatial extent soil erosion damage in the diagram map indicates altogether low percentages of disturbance with a range of 0%–1.4% damaged area in the surveyed plots. However, during the field survey, the observed damage resulting from soil erosion (Figure 6) appears to be greater in extent and magnitude than the depicted damage illustrated on the soil erosion damage map (Figure 5). In comparison to the maps displaying the soil erosion risk based on the application of the RUSLE model, the spatial extent of soil erosion damage has been observed to spatially concur majorly in the southwestern and southeastern parts of the district where LS factor is presumably high. Areas of high surface damage could be identified in the southeast of the district and were predominantly observed in croplands and areas undergoing construction.
The field survey positively contributes to the study through the identification and registration of areas vulnerable to soil erosion (Figure 5), which therefore lessens the burden of the resource strained land managers and local boards in developing conservation strategies direct on hotspots rather than concentrating on the entire district [5,132]. Areas of high soil erosion risk which occur in zones with high topographic (LS) factors can be confirmed by strong surface damages (Figure 5). Nevertheless, the exclusion of sheet erosion recording and quantification during conducting damage mapping reduces the usability of the soil erosion damage map for the validation of the soil erosion risk mapping applying the RUSLE model [133]; this is because sheet erosion has a major contribution to erosion damage and is included in the RUSLE model [64,86,125]. However, the conclusions were drawn on the basis of field observations due to the heterogeneity of the urban set-up and the widespread nature of impervious surfaces.
The modelling findings reveal that topographic characteristics (LS factor) significantly influence potential erosion and soil erosion risk in the Epworth district, which concurs with the findings by [23] that model-based distribution patterns of soil erosion risk in the area of Windhoek, Namibia were mainly defined basing on the spatial structure of slope. The high soil erosion risk observed on sloppy areas in Epworth district corresponds to areas with convex to straight profile curvature and to the occurrence of ridges [134,135]. Furthermore, along the channel flanks modelled soil erosion risk was in general high, predominantly controlled by relief [122]. Due to the southward drainage of the stream network in Epworth district and thus, southward increasing incision of the streams, increased soil erosion risk along the river flanks can be predominantly observed and also on the southeast areas (Figure 5). In contrast, the analysis of the effects of LULC change on soil erosion pointed out that increasing distribution of built-up areas as a result of high population pressure and demand for shelter substantially propels soil erosion risk within residential areas.

5. Conclusions

Soil erosion is a global environmental concern impacting negatively on agricultural productivity, accessibility to properties and also posing flooding risk in urban areas. The empirical RUSLE model was implemented to assess vulnerable areas and the computation of soil erosion risk through the integration of GIS and remote sensing techniques. The quantitative assessment of average annual soil loss for the Epworth district using the RUSLE model considers climate, soil, land use and topographic datasets as input parameters. Areas with high soil erosion risk were found to spatially correlate with topographic characteristics, especially slope length and slope steepness. The unrestricted LULC changes resulting from rampart informal settlements growth have accentuated soil erosion risk in the Epworth district. The analysis of LULC and estimated soil erosion risk improves the understanding of the spatial distribution patterns of soil loss for the different land uses in the years 2000 and 2018. The predicted soil erosion loss in the Epworth district amounted to 50,408 tons in 2000 while, 42,934 tons were estimated for 2018. Thus, the findings reveal that estimated soil erosion risk in total decreased over the study period (2000–2018). This is attributed to the reduction of croplands and areas covered by green spaces at the expense of built-up areas. Soil loss massively increased in the residential areas from 20,236 tons in 2000 to 32,061 tons 2018, regardless of the concentration of built-up areas (concentrated and less concentrated residential areas); in total the area covered by residential areas almost doubled between 2000 and 2018. Increasing impervious surfaces, sealed areas and avoidance of paved areas during high traffic flow have been observed as contributing factors towards increased generation of surface runoff and hereby affected soil erosion risk in the growing residential areas of the Epworth district.
The soil erosion damage map generated from the field measurements served as a validation tool for the study as it revealed areas vulnerable to soil erosion within the Epworth district that concur with the results of the application of soil erosion risk models. The area affected by soil erosion in the surveyed plots showed damages of 0%–1.4% in the spatial extent of the mapped plot area. Therefore, field mapping data have been observed as necessary in ascertaining and improving an understanding of quantitative soil erosion modelling. Model validation demonstrated that the RUSLE model performance was good due to positive correlation between field measurements and model results basing on sample areas (r = 0.76, R2 = 0.58, p < 0.05). It can be concluded that the spread of urban built-up areas without implementation of sound conservation practices, such as proper land suitability analysis and the construction of runoff drainage canals, will increase soil erosion damage by water. Although, the research has predicted potential erosion risk and soil erosion risk, it is important to outline that there are uncertainties with the modelled data provided by the RUSLE model arising from the lack of site-specific parameterization. Limited studies on water-induced soil erosion for urban areas within the region reduce options for data comparison. However, the computed soil erosion risk maps may assist environmental managers and land and policymakers on planning mitigatory measures for the study area.

Supplementary Materials

The following are available online at https://www.mdpi.com/2071-1050/12/20/8531/s1, Figure S1: Rainfall erosivity factor maps derived for RUSLE modelling for Epworth district. Maps are showing the spatial distribution of the average R factor for (a) the time period 1984–2000 (mean= 329 MJ mm ha−1 h−1 yr−1, std = 0.55), (b) the time period 2000–2018 (315 MJ mm ha−1 h−1 yr−1, std = 0.27); Figure S2: Potential erosion risk map for Epworth district for 1984–2018.

Author Contributions

All authors: conception of the paper, A.K.M.: data acquisition, data analysis, writing of original draft; B.S.: supervision, writing—review and editing, funding acquisition. All authors have read and agreed to the published version of the manuscript.

Funding

This research was funded by the Deutscher Akademischer Austauschdienst—DAAD.

Acknowledgments

The publication of this article was funded by Freie Universität Berlin. We thank our colleagues from Freie Universität Berlin, who provided valuable insights and expertise that greatly assisted this study. We are grateful to the United States Geological Survey (USGS), for providing one Arc-Second Global data from the Shuttle Radar Topography Mission (SRTM) for providing terrain corrected data and the Department of Meteorology in Harare, Zimbabwe for the provision of precipitation data.

Conflicts of Interest

The authors declare no conflict of interest.

References

  1. Alaci, D.S.A. Regulating Urbanisation in Sub-Saharan Africa through Cluster Settlements. Theor. Empirical Res. Urban Manag. 2019, 5, 16. [Google Scholar]
  2. African Development Bank Gender. Poverty and Environmental Indicators on African Countries; African Development Bank: Abidjan, Cote d’Ivoire, 2005. [Google Scholar]
  3. Khosrokhani, M.; Pradhan, B. Spatio-temporal assessment of soil erosion at Kuala Lumpur metropolitan city using remote sensing data and GIS. Geomat. Nat. Hazards Risk 2014, 5, 252–270. [Google Scholar] [CrossRef] [Green Version]
  4. Lambin, E.F.; Turner, B.L.; Geist, H.J.; Agbola, S.B.; Angelsen, A.; Bruce, J.W.; Coomes, O.T.; Dirzo, R.; Fischer, G.; Folke, C.; et al. The causes of land-use and land-cover change: Moving beyond the myths. Glob. Environ. Chang. 2001, 11, 261–269. [Google Scholar] [CrossRef]
  5. Meshesha, D.T.; Tsunekawa, A.; Tsubo, M.; Ali, S.A.; Haregeweyn, N. Land-use change and its socio-environmental impact in Eastern Ethiopia’s highland. Reg. Environ. Chang. 2014, 14, 757–768. [Google Scholar] [CrossRef]
  6. McCool, D.K.; Brown, L.C.; Foster, G.R.; Mutchler, C.K.; Meyer, L.D. Revised Slope Steepness Factor for the Universal Soil Loss Equation. Trans. ASAE 1987, 30, 1387–1396. [Google Scholar] [CrossRef]
  7. Jinren, R.N.; Yingkui, K.L. Approach to soil erosion assessment in terms of land-use structure changes. J. Soil Water Conserv. 2003, 58, 158–169. [Google Scholar]
  8. Chirisa, I.E.W.; Muhomba, K. Constraints to managing urban and housing land in the context of poverty: A case of Epworth settlement in Zimbabwe. Local Environ. 2013, 18, 950–964. [Google Scholar] [CrossRef]
  9. Marondedze, A.K.; Schütt, B. Dynamics of Land Use and Land Cover Changes in Harare, Zimbabwe: A Case Study on the Linkage between Drivers and the Axis of Urban Expansion. Land 2019, 8, 155. [Google Scholar] [CrossRef] [Green Version]
  10. Chirisa, I. Building and urban planning in Zimbabwe with special reference to Harare: Putting needs, costs and sustainability in focus. Consilience 2014, 11, 1–26. [Google Scholar]
  11. Kamusoko, C.; Gamba, J.; Murakami, H. Monitoring Urban Spatial Growth in Harare Metropolitan Province, Zimbabwe. ARS 2013, 2, 322–331. [Google Scholar] [CrossRef] [Green Version]
  12. Karydas, C.G.; Sekuloska, T.; Silleos, G.N. Quantification and site-specification of the support practice factor when mapping soil erosion risk associated with olive plantations in the Mediterranean island of Crete. Environ. Monit. Assess. 2009, 149, 19–28. [Google Scholar] [CrossRef] [PubMed]
  13. McHugh, M.; Harrod, T.; Morgan, R. The extent of soil erosion in upland England and Wales. Earth Surf. Process. Landforms 2002, 27, 99–107. [Google Scholar] [CrossRef]
  14. Ozsahin, E.; Duru, U.; Eroglu, I. Land Use and Land Cover Changes (LULCC), a Key to Understand Soil Erosion Intensities in the Maritsa Basin. Water 2018, 10, 335. [Google Scholar] [CrossRef] [Green Version]
  15. Borrelli, P.; Robinson, D.A.; Panagos, P.; Lugato, E.; Yang, J.E.; Alewell, C.; Wuepper, D.; Montanarella, L.; Ballabio, C. Land use and climate change impacts on global soil erosion by water (2015–2070). Proc. Natl. Acad. Sci. USA 2020, 117, 21994–22001. [Google Scholar] [CrossRef]
  16. Lal, R. Soil degradation by erosion. Land Degrad. Dev. 2001, 12, 519–539. [Google Scholar] [CrossRef]
  17. Lahlaoi, H.; Rhinane, H.; Hilali, A.; Lahssini, S.; Khalile, L. Potential Erosion Risk Calculation Using Remote Sensing and GIS in Oued El Maleh Watershed, Morocco. J. Geogr. Inf. Syst. 2015, 07, 128–139. [Google Scholar] [CrossRef] [Green Version]
  18. Pimentel, D.; Harvey, C.; Resosudarmo, P.; Sinclair, K.; Kurz, D.; McNair, M.; Crist, S.; Shpritz, L.; Fitton, L.; Saffouri, R.; et al. Environmental and Economic Costs of Soil Erosion and Conservation Benefits. Science 1995, 267, 1117–1123. [Google Scholar] [CrossRef] [PubMed] [Green Version]
  19. Rahman, M.R.; Shi, Z.H.; Chongfa, C. Soil erosion hazard evaluation—An integrated use of remote sensing, GIS and statistical approaches with biophysical parameters towards management strategies. Ecol. Model. 2009, 220, 1724–1734. [Google Scholar] [CrossRef]
  20. Moore, I.D.; Burch, G.J. Physical Basis of the Length-slope Factor in the Universal Soil Loss Equation. Soil Sci. Soc. Am. J. 1986, 50, 1294–1298. [Google Scholar] [CrossRef]
  21. Moore, T.R. Rainfall Erosivity in East Africa. Geogr. Ann. Ser. A Phys. Geogr. 1979, 61, 147–156. [Google Scholar] [CrossRef]
  22. Ferreira, V.; Panagopoulos, T. Seasonality of Soil Erosion under Mediterranean Conditions at the Alqueva Dam Watershed. Environ. Manag. 2014, 54, 67–83. [Google Scholar] [CrossRef] [PubMed]
  23. Shikangalah, R.; Paton, E.; Jetlsch, F.; Blaum, N. Quantification of areal extent of soil erosion in dryland urban areas: An example from Windhoek, Namibia. Cities Environ. (CATE) 2017, 10, 8. [Google Scholar]
  24. Chalise, D.; Kumar, L.; Kristiansen, P. Land Degradation by Soil Erosion in Nepal: A Review. Soil Syst. 2019, 3, 12. [Google Scholar] [CrossRef] [Green Version]
  25. Chalise, D.; Kumar, L. Land use change affects water erosion in the Nepal Himalayas. PLoS ONE 2020, 15, e0231692. [Google Scholar] [CrossRef] [Green Version]
  26. Atreya, K.; Sharma, S.; Bajracharya, R.M.; Rajbhandari, N.P. Applications of reduced tillage in hills of central Nepal. Soil Tillage Res. 2006, 88, 16–29. [Google Scholar] [CrossRef]
  27. Le Roux, J.J.; Sumner, P.D. Factors controlling gully development: Comparing continuous and discontinuous gullies. Land Degrad. Dev. 2012, 23, 440–449. [Google Scholar] [CrossRef] [Green Version]
  28. Zhou, W.; Wu, B. Assessment of soil erosion and sediment delivery ratio using remote sensing and GIS: A case study of upstream Chaobaihe River catchment, north China. Int. J. Sediment Res. 2008, 23, 167–173. [Google Scholar] [CrossRef]
  29. Samanta, S.; Koloa, C.; Pal, D.K.; Palsamanta, B. Estimation of potential soil erosion rate using RUSLE and E30 model. Model. Earth Syst. Environ. 2016, 2, 149. [Google Scholar] [CrossRef]
  30. Opeyemi, O.A.; Abidemi, F.H.; Victor, O.K. Assessing the Impact of Soil Erosion on Residential Areas of Efon-Alaaye Ekiti, Ekiti-State, Nigeria. Int. J. Environ. Plan. Manag. 2019, 5, 23–31. [Google Scholar]
  31. USDA. NRCS Soil Quality—Urban Technical Note No. 1: Erosion and Sedimentation on Construction Sites; Soil Quality Institute: Washington, DC, USA, 2000. [Google Scholar]
  32. Bruijnzeel, L.A. Hydrology of Moist Tropical Forests and Effects of Conversion: A State of Knowledge Review; Free University: Amsterdam, The Netherlands, 1990. [Google Scholar]
  33. Ashiagbor, G.; Forkuo, E.K.; Laari, P.; Aabeyir, R. Modeling soil erosion using RUSLE and GIS tools. Int. J. Remote Sens. 2013, 2, 12. [Google Scholar]
  34. FAO and ITPS Status of the World’s Soil Resources (SWSR)—Main Report; FAO of the United Nations and Intergovernmental Technical Panel on Soils: Rome, Italy, 2015.
  35. Hurni, H. Degradation and Conservation of the Resources in the Ethiopian Highlands. Mt. Res. Dev. 1988, 8, 123. [Google Scholar] [CrossRef]
  36. Food and Agriculture Organization (FAO). Ethiopian Highlands Reclamation Study: Ethiopia; FAO: Rome, Italy, 1986; p. 354. [Google Scholar]
  37. Legesse, D.; Vallet-Coulomb, C.; Gasse, F. Analysis of the hydrological response of a tropical terminal lake, Lake Abiyata(Main Ethiopian Rift Valley) to changes in climate and human activities. Hydrol. Process. 2004, 18, 487–504. [Google Scholar] [CrossRef]
  38. Kabantu, M.T.; Tshimanga, R.M.; Kileshye, J.M.O.; Gumindoga, W.; Beya, J.T. A GIS-based estimation of soil erosion parameters for soil loss potential and erosion hazard in the city of Kinshasa, the Democratic Republic of Congo. Proc. IAHS 2018, 378, 51–57. [Google Scholar] [CrossRef] [Green Version]
  39. Nhapi, I. The water situation in Harare, Zimbabwe: A policy and management problem. Water Policy 2009, 11, 221–235. [Google Scholar] [CrossRef]
  40. Merritt, W.S.; Letcher, R.A.; Jakeman, A.J. A review of erosion and sediment transport models. Environ. Model. Softw. 2003, 18, 761–799. [Google Scholar] [CrossRef]
  41. Ranzi, R.; Le, T.H.; Rulli, M.C. A RUSLE approach to model suspended sediment load in the Lo river (Vietnam): Effects of reservoirs and land use changes. J. Hydrol. 2012, 422–423, 17–29. [Google Scholar] [CrossRef]
  42. Wischmeier, W.H.; Smith, D.D. Predicting Rainfall Erosion Losses: A Guide to Conservation Planning; Department of Agriculture, Science and Education Administration: Washington, DC, USA, 1978. [Google Scholar]
  43. Renard, K.G.; Foster, G.R.; Weesies, G.A.; McCool, D.K.; Yoder, D.C. Predicting Soil Erosion by Water: A Guide to Conservation Planning with the Revised Universal Soil Loss Equation (RUSLE); United States Government Printing Office: Washington, DC, USA, 1997. [Google Scholar]
  44. Arnold, J.G.; Srinivasan, R.; Muttiah, R.S.; Williams, J.R. Large Area Hydrologic Modeling and Assessment Part I: Model Development. J. Am. Water Resour. Assoc. 1998, 34, 73–89. [Google Scholar] [CrossRef]
  45. Laflen, J.M.; Lane, L.J.; Foster, G.R. WEPP: A new generation of erosion prediction technology. J. Soil Water Conserv. 1991, 46, 34–38. [Google Scholar]
  46. Wang, G.; Gertner, G.; Fang, S.; Anderson, A.B. Mapping Multiple Variables for Predicting Soil Loss by Geostatistical Methods with TM Images and a Slope Map. Photogramm. Eng. Remote Sens. 2003, 69, 889–898. [Google Scholar] [CrossRef]
  47. Lu, D.; Li, G.; Valladares, G.S.; Batistella, M. Mapping soil erosion risk in Rondônia, Brazilian Amazonia: Using RUSLE, remote sensing and GIS. Land Degrad. Dev. 2004, 15, 499–512. [Google Scholar] [CrossRef]
  48. Li, X.S.; Wu, B.F.; Wang, H.; Zhang, J. Regional soil erosion risk assessment in Hai Basin. J. Remote Sens. 2011, 15, 372–387. [Google Scholar]
  49. Chalise, D.; Kumar, L.; Shriwastav, C.P.; Lamichhane, S. Spatial assessment of soil erosion in a hilly watershed of Western Nepal. Environ. Earth Sci. 2018, 77, 685. [Google Scholar] [CrossRef]
  50. Shamshad, A.; Azhari, M.N.; Isa, M.H.; Hussin, W.M.A.W.; Parida, B.P. Development of an appropriate procedure for estimation of RUSLE EI30 index and preparation of erosivity maps for Pulau Penang in Peninsular Malaysia. Catena 2008, 72, 423–432. [Google Scholar] [CrossRef]
  51. Woldemariam, G.; Iguala, A.; Tekalign, S.; Reddy, R. Spatial Modeling of Soil Erosion Risk and Its Implication for Conservation Planning: The Case of the Gobele Watershed, East Hararghe Zone, Ethiopia. Land 2018, 7, 25. [Google Scholar] [CrossRef] [Green Version]
  52. Igbokwe, J.I.; Akinyede, J.O.; Dang, B.; Alaga, T.; Ono, M.N.; Nnodu, V.C.; Anike, L.O. Mapping and monitoring of the impact of gully erosion in Southeastern Nigeria with satellite remote sensing and Geographic Information System. Int. Arch. Photogramm. Remote Sens. Spat. Inf. Sci. 2008, 37, 8. [Google Scholar]
  53. Okereke, C.N.; Onu, N.N.; Akaolisa, C.Z.; Ikoro, D.O.; Ibeneme, S.I.; Ubechu, B.; Chinemelu, E.S.; Amadikwa, L.O. Mapping gully erosion using remote sensing technique: A case study of Okigwe area, southeastern Nigeria. Int. J. Eng. Res. Appl. (IJERA) 2012, 2, 1955–1967. [Google Scholar]
  54. Aiello, A.; Adamo, M.; Canora, F. Remote sensing and GIS to assess soil erosion with RUSLE3D and USPED at river basin scale in southern Italy. Catena 2015, 131, 174–185. [Google Scholar] [CrossRef]
  55. Cerri, C.E.P.; Demattě, J.A.M.; Ballester, M.V.R.; Martinelli, L.A.; Victoria, R.L.; Roose, E. GIS erosion risk assessment of the Piracicaba river basin, southeastern Brazil. Mapp. Sci. Remote Sens. 2001, 38, 157–171. [Google Scholar] [CrossRef]
  56. Butcher, C. Low Income Housing in Zimbabwe: A Case Study of the Epworth Squatter Upgrading Programme. 1986. Available online: https://opendocs.ids.ac.uk/opendocs/handle/20.500.12413/10008 (accessed on 15 October 2020).
  57. ZimStats (Zimbabwe National Statistics Agency) Census 2012: Preliminary Report. Available online: http://www.zimstat.co.zw/publications/Population/Harare.pdf. (accessed on 14 October 2020).
  58. Hove, M.; Tirimboi, A. Assessment of Harare Water Service Delivery. J. Sustain. Dev. Africa 2011, 13, 61–84. [Google Scholar]
  59. Nyamapfene, K. Soils of Zimbabwe; Nehanda Publishers: Harare, Zimbabwe, 1991. [Google Scholar]
  60. Thompson, J.G.; Purves, W.D. A Guide to the Soils of Rhodesia; Technical Handbook No. 3; Information Services, Department of Research and Specialist Services, Ministry of Agriculture: Harare, Zimbabwe, 1978. [Google Scholar]
  61. Zhou, P.; Luukkanen, O.; Tokola, T.; Nieminen, J. Effect of vegetation cover on soil erosion in a mountainous watershed. Catena 2008, 75, 319–325. [Google Scholar] [CrossRef]
  62. Prasannakumar, V.; Vijith, H.; Abinod, S.; Geetha, N. Estimation of soil erosion risk within a small mountainous sub-watershed in Kerala, India, using Revised Universal Soil Loss Equation (RUSLE) and geo-information technology. Geosci. Front. 2012, 3, 209–215. [Google Scholar] [CrossRef] [Green Version]
  63. Al-Abadi, A.M.A.; Ghalib, H.B.; Al-Qurnawi, W.S. Estimation of soil erosion in Northern Kirkuk governorate, Iraq using RUSLE, Remote Sensing and GIS. Carpathian J. Earth Environ. Sci. 2016, 11, 153–166. [Google Scholar]
  64. Tundu, C.; Tumbare, M.J.; Kileshye Onema, J.-M. Sedimentation and Its Impacts/Effects on River System and Reservoir Water Quality: Case Study of Mazowe Catchment, Zimbabwe. Proc. Int. Assoc. Hydrol. Sci. 2018, 377, 57–66. [Google Scholar] [CrossRef] [Green Version]
  65. Karamage, F.; Zhang, C.; Liu, T.; Maganda, A.; Isabwe, A. Soil Erosion Risk Assessment in Uganda. Forests 2017, 8, 52. [Google Scholar] [CrossRef]
  66. Panagos, P.; Borrelli, P.; Meusburger, K. A New European Slope Length and Steepness Factor (LS-Factor) for Modeling Soil Erosion by Water. Geosciences 2015, 5, 117–126. [Google Scholar] [CrossRef] [Green Version]
  67. Millward, A.A.; Mersey, J.E. Adapting the RUSLE to model soil erosion potential in a mountainous tropical watershed. Catena 1999, 38, 109–129. [Google Scholar] [CrossRef]
  68. Mati, B.M.; Morgan, R.P.; Gichuki, F.N.; Quinton, J.N.; Brewer, T.R.; Liniger, H.P. Assessment of erosion hazard with the USLE and GIS: A case study of the Upper Ewaso Ng’iro North basin of Kenya. Int. J. Appl. Earth Obs. Geoinf. 2000, 2, 78–86. [Google Scholar] [CrossRef]
  69. Farhan, Y.; Nawaiseh, S. Spatial assessment of soil erosion risk using RUSLE and GIS techniques. Environ. Earth Sci. 2015, 74, 4649–4669. [Google Scholar] [CrossRef]
  70. Ai, L.; Fang, N.F.; Zhang, B.; Shi, Z.H. Broad area mapping of monthly soil erosion risk using fuzzy decision tree approach: Integration of multi-source data within GIS. Int. J. Geogr. Inf. Sci. 2013, 27, 1251–1267. [Google Scholar] [CrossRef]
  71. USGS (United States Geologic Service). Shuttle Radar Topography Mission (SRTM) 1 Arc-Second Global Data. Available online: https://earthexplorer.usgs.gov/SRTM1Arc (accessed on 19 September 2018).
  72. International Soil Reference and Information Centre (ISRIC-World Soil Information). Available online: https://soilgrids.org (accessed on 17 July 2019).
  73. Stocking, M.A.; Elwell, H.A. Rainfall Erosivity over Rhodesia. Trans. Inst. Br. Geogr. 1976, 1, 231. [Google Scholar] [CrossRef]
  74. Lal, R. Soil Erosion in the Tropics: Principles and Management; McGraw Hill: New York, NY, USA, 1990. [Google Scholar]
  75. Alexakis, D.D.; Hadjimitsis, D.G.; Agapiou, A. Integrated use of remote sensing, GIS and precipitation data for the assessment of soil erosion rate in the catchment area of “Yialias” in Cyprus. Atmos. Res. 2013, 131, 108–124. [Google Scholar] [CrossRef]
  76. Yang, J.-L.; Zhang, G.-L. Water infiltration in urban soils and its effects on the quantity and quality of runoff. J. Soils Sediments 2011, 11, 751–761. [Google Scholar] [CrossRef]
  77. Farhan, Y.; Zregat, D.; Farhan, I. Spatial Estimation of Soil Erosion Risk Using RUSLE Approach, RS, and GIS Techniques: A Case Study of Kufranja Watershed, Northern Jordan. J. Water Resour. Prot. JWARP 2013, 5, 1247–1261. [Google Scholar] [CrossRef] [Green Version]
  78. Hengl, T.; De Jesus, J.M.; Heuvelink, G.B.M.; Gonzalez, M.R.; Kilibarda, M.; Blagotić, A.; Shangguan, W.; Wright, M.N.; Geng, X.; Bauer-Marschallinger, B.; et al. SoilGrids250m: Global gridded soil information based on machine learning. PLoS ONE 2017, 12, e0169748. [Google Scholar] [CrossRef] [Green Version]
  79. Sharpley, A.N.; Williams, J.R. EPIC-Erosion/Productivity Imappct Calculator: 1. Model. Documentation; U.S. Department of Agriculture Technical Bulletin: Washington, DC, USA, 1990. [Google Scholar]
  80. Desmet, P.J.J.; Govers, A. A GIS procedure for automatically calculating the USLE LS factor on topographically complex landscape units. J. Soil Water Conserv. 1996, 51, 427–433. [Google Scholar]
  81. Wang, L.; Liu, H. An efficient method for identifying and filling surface depressions in digital elevation models for hydrologic analysis and modelling. Int. J. Geogr. Inf. Sci. 2006, 20, 193–213. [Google Scholar] [CrossRef]
  82. Freeman, T.G. Calculating catchment area with divergent flow based on a regular grid. Comput. Geosci. 1991, 17, 413–422. [Google Scholar] [CrossRef]
  83. Tarboton, D.G. A new method for the determination of flow directions and upslope areas in grid digital elevation models. Water Resour. Res. 1997, 33, 309–319. [Google Scholar] [CrossRef] [Green Version]
  84. Lee, S. Soil erosion assessment and its verification using the universal soil loss equation and geographic information system: A case study at Boun, Korea. Environ. Geol. 2004, 45, 457–465. [Google Scholar] [CrossRef]
  85. Kheir, R.B.; Abdallah, C.; Khawlie, M. Assessing soil erosion in Mediterranean karst landscapes of Lebanon using remote sensing and GIS. Eng. Geol. 2008, 99, 239–254. [Google Scholar] [CrossRef]
  86. Asiedu, J.K. Assessing the Threat of Erosion to Nature-Based Interventions for Stormwater Management and Flood Control in the Greater Accra Metropolitan Area, Ghana. J. Ecol. Eng. 2018, 19, 1–13. [Google Scholar] [CrossRef]
  87. Leh, M.; Bajwa, S.; Chaubey, I. Impact of land use change on erosion risk: An integrated Remote Sensing, Geographic Information System and modelling methodology: Impact of land use change on erosion risk. Land Degrad. Dev. 2013, 24, 409–421. [Google Scholar] [CrossRef]
  88. Singh, R.; Phadke, V.S. Assessing soil loss by water erosion in Jamni River Basin, Bundelkhand region, India, adopting universal soil loss equation using GIS. Curr. Sci. Assoc. 2006, 90, 1431–1435. [Google Scholar]
  89. Panagos, P.; Karydas, C.; Borrelli, P.; Ballabio, C.; Meusburger, K. Advances in Soil Erosion Modelling Through Remote Sensing Data Availability at European Scale. In Proceedings of the Second International Conference on Remote sensing and Geoinformation of the Environment, Paphos, Cyprus, 12 August 2014; Hadjimitsis, D.G., Themistocleous, K., Michaelides, S., Papadavid, G., Eds.; International Society for Optics and Photonics: Paphos, Cyprus, 2014. [Google Scholar]
  90. Alena, J.; Miloslav, J.; Martin, T. Field Determination of the Specific Input Characteristics to Calculate the Value of C Factor of Time-variable Crops for the Revised Universal Soil Loss Equation (RUSLE). Soil Water Res. 2013, 1, 10–15. [Google Scholar] [CrossRef] [Green Version]
  91. Ochoa-Cueva, P.; Fries, A.; Montesinos, P.; Rodríguez-Díaz, J.A.; Boll, J. Spatial Estimation of Soil Erosion Risk by Land-Cover Change in the Andes of Southern Ecuador: Soil Erosion Risk by Land-Cover Change in Southern Ecuador. Land Degrad. Dev. 2015, 26, 565–573. [Google Scholar] [CrossRef]
  92. Adornado, H.A.; Yoshida, M.; Apolinares, H.A. Erosion Vulnerability Assessment in REINA, Quezon Province, Philippines with Raster-based Tool Built within GIS Environment. Agric. Inf. Res. 2009, 18. [Google Scholar] [CrossRef] [Green Version]
  93. Bewket, W.; Sterk, G. Assessment of soil erosion in cultivated fields using a survey methodology for rills in the Chemoga watershed, Ethiopia. Agric. Ecosyst. Environ. 2003, 97, 81–93. [Google Scholar] [CrossRef]
  94. Poesen, J.; Nachtergaele, J.; Verstraeten, G.; Valentin, C. Gully erosion and environmental change: Importance and research needs. Catena 2003, 50, 91–133. [Google Scholar] [CrossRef]
  95. Imeson, A.C.; Kwaad, F.J.P.M. Gully types and gully prediction. KNAG Geogr. Tijdschr. XIV 5 1980, 14, 430–441. [Google Scholar]
  96. Lufafa, A.; Tenywa, M.M.; Isabirye, M.; Majaliwa, M.J.G.; Woomer, P.L. Prediction of soil erosion in a Lake Victoria basin catchment using a GIS-based Universal Soil Loss model. Agric. Syst. 2003, 76, 883–894. [Google Scholar] [CrossRef]
  97. Bamutaze, Y. Revisiting socio-ecological resilience and sustainability in the coupled mountain landscapes in Eastern Africa. Curr. Opin. Environ. Sustain. 2015, 14, 257–265. [Google Scholar] [CrossRef]
  98. Morgan, R.P.C. Soil Erosion and Conservation, 3rd ed.; Blackwell Publishing Ltd.: Oxford, UK, 2005. [Google Scholar]
  99. Hudson, N.W. Soil Conservation, 2nd ed.; Batsford: London, UK, 1981. [Google Scholar]
  100. Abdulkareem, J.H.; Pradhan, B.; Sulaiman, W.N.A.; Jamil, N.R. Prediction of spatial soil loss impacted by long-term land-use/land-cover change in a tropical watershed. Geosci. Front. 2019, 10, 389–403. [Google Scholar] [CrossRef]
  101. Jones, R.J.; Le Bissonnais, Y.; Bazzoffi, P.; Diaz, J.S.; Düwel, O.; Loj, G.; Øygarden, L.; Prasuhn, V.; Rydell, B.; Strauss, P. Nature and extent of soil erosion in Europe. In Reports of the Technical Working Groups Established under the Thematic Strategy for Soil Protection; EUR 21319 EN/1, Office for the Official Publications of the European Commission: Luxembourg, 2013; pp. 145–185. [Google Scholar]
  102. Verheijen, F.G.A.; Jones, R.J.A.; Rickson, R.J.; Smith, C.J. Tolerable versus actual soil erosion rates in Europe. Earth Sci. Rev. 2009, 94, 23–38. [Google Scholar] [CrossRef] [Green Version]
  103. De Meyer, A.; Poesen, J.; Isabirye, M.; Deckers, J.; Raes, D. Soil erosion rates in tropical villages: A case study from Lake Victoria Basin, Uganda. Catena 2011, 84, 89–98. [Google Scholar] [CrossRef]
  104. Shuster, W.D.; Bonta, J.; Thurston, H.; Warnemuende, E.; Smith, D.R. Impacts of impervious surface on watershed hydrology: A review. Urban Water J. 2005, 2, 263–275. [Google Scholar] [CrossRef]
  105. Cantón, Y.; Solé-Benet, A.; de Vente, J.; Boix-Fayos, C.; Calvo-Cases, A.; Asensio, C.; Puigdefábregas, J. A review of runoff generation and soil erosion across scales in semiarid south-eastern Spain. J. Arid. Environ. 2011, 75, 1254–1261. [Google Scholar] [CrossRef]
  106. Phil-Eze, P.O. Variability of soil properties related to vegetation cover in a tropical rainforest landscape. J. Geogr. Plan. 2010, 3, 174–188. [Google Scholar]
  107. Dams, J.; Dujardin, J.; Reggers, R.; Bashir, I.; Canters, F.; Batelaan, O. Mapping impervious surface change from remote sensing for hydrological modeling. J. Hydrol. 2013, 485, 84–95. [Google Scholar] [CrossRef]
  108. Jim, C.Y. Soil Compaction as a Constraint to Tree Growth in Tropical & Subtropical Urban Habitats. Environ. Conserv. 1993, 20, 35–49. [Google Scholar] [CrossRef]
  109. Ma, J.W.; Xue, Y.; Ma, C.F.; Wang, Z.G. A data fusion approach for soil erosion monitoring in the Upper Yangtze River Basin of China based on Universal Soil Loss Equation (USLE) model. Int. J. Remote Sens. 2003, 24, 4777–4789. [Google Scholar] [CrossRef]
  110. Vrieling, A. Satellite remote sensing for water erosion assessment: A review. Catena 2006, 65, 2–18. [Google Scholar] [CrossRef]
  111. Panagos, P.; Borrelli, P.; Poesen, J.; Ballabio, C.; Lugato, E.; Meusburger, K.; Montanarella, L.; Alewell, C. The new assessment of soil loss by water erosion in Europe. Environ. Sci. Policy 2015, 54, 438–447. [Google Scholar] [CrossRef]
  112. Teng, H.; Liang, Z.; Chen, S.; Liu, Y.; Rossel, R.A.V.; Chappell, A.; Yu, W.; Shi, Z. Current and future assessments of soil erosion by water on the Tibetan Plateau based on RUSLE and CMIP5 climate models. Sci. Total Environ. 2018, 635, 673–686. [Google Scholar] [CrossRef] [PubMed]
  113. Giang, P.; Giang, L.; Toshiki, K. Spatial and Temporal Responses of Soil Erosion to Climate Change Impacts in a Transnational Watershed in Southeast Asia. Climate 2017, 5, 22. [Google Scholar] [CrossRef]
  114. Smith, M.S.; Frye, W.W.; Varco, J.J. Legume Winter Cover Crops. In Advances in Soil Science; Stewart, B.A., Ed.; Advances in Soil Science; Springer: New York, NY, USA, 1987; Volume 7, pp. 95–139. ISBN 978-1-4612-9157-2. [Google Scholar]
  115. Jakab, G.; Madarász, B.; Szabó, J.; Tóth, A.; Zacháry, D.; Szalai, Z.; Kertész, Á.; Dyson, J. Infiltration and Soil Loss Changes during the Growing Season under Ploughing and Conservation Tillage. Sustainability 2017, 9, 1726. [Google Scholar] [CrossRef] [Green Version]
  116. Nyamangara, J.; Marondedze, A.; Masvaya, E.N.; Mawodza, T.; Nyawasha, R.; Nyengerai, K.; Tirivavi, R.; Nyamugafata, P.; Wuta, M. Influence of basin-based conservation agriculture on selected soil quality parameters under smallholder farming in Zimbabwe. Soil Use Manag. 2014, 30, 550–559. [Google Scholar] [CrossRef]
  117. Soil Erosion Processes and Landscape Sensitivity in the Ethiopian Highlands. Available online: https://www.researchgate.net/publication/252969343_Assessment_of_Erosion_and_Soil_Erosion_Processes_-_a_Case_Study_from_the_Northern_Ethiopian_Highland (accessed on 14 October 2020).
  118. McCool, D.K.; Foster, G.R.; Mutchler, C.K.; Meyer, L.D. Revised Slope Length Factor for the Universal Soil Loss Equation. Trans. ASAE 1989, 32, 1571–1576. [Google Scholar] [CrossRef]
  119. Gumindoga, W.; Rientjes, T.; Shekede, M.; Rwasoka, D.; Nhapi, I.; Haile, A. Hydrological Impacts of Urbanization of Two Catchments in Harare, Zimbabwe. Remote Sens. 2014, 6, 12544–12574. [Google Scholar] [CrossRef] [Green Version]
  120. Braud, I.; Breil, P.; Thollet, F.; Lagouy, M.; Branger, F.; Jacqueminet, C.; Kermadi, S.; Michel, K. Evidence of the impact of urbanization on the hydrological regime of a medium-sized periurban catchment in France. J. Hydrol. 2013, 485, 5–23. [Google Scholar] [CrossRef] [Green Version]
  121. Lee, S.; Pradhan, B. Probabilistic landslide hazards and risk mapping on Penang Island, Malaysia. J. Earth Syst. Sci. 2006, 115, 661–672. [Google Scholar] [CrossRef]
  122. Evans, R. An alternative way to assess water erosion of cultivated land—Field-based measurements: And analysis of some results. Appl. Geogr. 2002, 22, 187–207. [Google Scholar] [CrossRef]
  123. Kamuju, N. Spatial Identification and Classification of Soil Erosion Prone Zones Using Remote Sensing & Gis Integrated ‘Rusle’ Model and ‘Sateec Gis System’. Int. J. Eng. Sci. Res. Technol. 2016, 676–686. [Google Scholar] [CrossRef]
  124. Assouline, S.; Ben-Hur, M. Effects of rainfall intensity and slope gradient on the dynamics of interrill erosion during soil surface sealing. Catena 2006, 66, 211–220. [Google Scholar] [CrossRef]
  125. Koirala, P.; Thakuri, S.; Joshi, S.; Chauhan, R. Estimation of Soil Erosion in Nepal Using a RUSLE Modeling and Geospatial Tool. Geosciences 2019, 9, 147. [Google Scholar] [CrossRef] [Green Version]
  126. Alewell, C.; Borrelli, P.; Meusburger, K.; Panagos, P. Using the USLE: Chances, challenges and limitations of soil erosion modelling. Int. Soil Water Conserv. Res. 2019, 7, 203–225. [Google Scholar] [CrossRef]
  127. Trirnble, S.W.; Crosson, P.U.S. Soil Erosion Rates-Myth and Reality. Science 2000, 289, 248–250. [Google Scholar] [CrossRef] [PubMed] [Green Version]
  128. Auerswald, K.; Kainz, M.; Fiener, P. Soil erosion potential of organic versus conventional farming evaluated by USLE modelling of cropping statistics for agricultural districts in Bavaria. Soil Use Manag. 2006, 19, 305–311. [Google Scholar] [CrossRef]
  129. Lazzari, M.; Gioia, D.; Piccarreta, M.; Danese, M.; Lanorte, A. Sediment yield and erosion rate estimation in the mountain catchments of the Camastra artificial reservoir (Southern Italy): A comparison between different empirical methods. Catena 2015, 127, 323–339. [Google Scholar] [CrossRef]
  130. Montgomery, D.R. Soil erosion and agricultural sustainability. Proc. Natl. Acad. Sci. USA 2007, 104, 13268–13272. [Google Scholar] [CrossRef] [Green Version]
  131. Seutloali, K.E.; Dube, T.; Mutanga, O. Assessing and mapping the severity of soil erosion using the 30-m Landsat multispectral satellite data in the former South African homelands of Transkei. Phys. Chem. Earth Parts A/B/C 2017, 100, 296–304. [Google Scholar] [CrossRef]
  132. McDowell, R.W.; Srinivasan, M.S. Identifying critical source areas for water quality: 2. Validating the approach for phosphorus and sediment losses in grazed headwater catchments. J. Hydrol. 2009, 379, 68–80. [Google Scholar] [CrossRef]
  133. van Dijk, P.M.; Auzet, A.-V.; Lemmel, M. Rapid assessment of field erosion and sediment transport pathways in cultivated catchments after heavy rainfall events. Earth Surf. Process. Landf. 2005, 30, 169–182. [Google Scholar] [CrossRef]
  134. Hill, J.; Schütt, B. Mapping Complex Patterns of Erosion and Stability in Dry Mediterranean Ecosystems. Remote Sens. Environ. 2000, 74, 557–569. [Google Scholar] [CrossRef]
  135. Pickup, G.; Chewings, V.H. Forecasting patterns of soil erosion in arid lands from Landsat MSS data. Int. J. Remote Sens. 1988, 9, 69–84. [Google Scholar] [CrossRef]
Figure 1. Location of the Harare Metropolitan Province composed of the Harare urban, Harare rural, Epworth and Chitungwiza districts. (a) Zimbabwe district boundaries depicting the Harare Metropolitan Province; (b) districts of Harare Metropolitan Province; (c) Epworth district showing areas of recorded current soil erosion damages.
Sustainability 12 08531 g001
Figure 2. Flowchart for modelling potential erosion and soil erosion risk in Epworth district. LULC: Land Use and Land Cover, ISRIC: International Soil Reference Information Centre.
Sustainability 12 08531 g002
Figure 3. Input factor maps for modelling potential soil erosion for the Epworth district. (a) shows the overall rainfall erosivity factor between 1984 and 2018; (b) topographic factor (LS) and (c) soil erodibility factor (K).
Sustainability 12 08531 g003
Figure 4. Land Use and Land Cover maps for the Epworth district over the years (a) 2000; (b) 2018 and crop management factor maps for the years (c) 2000; (d) 2018.
Sustainability 12 08531 g004
Figure 5. Estimated soil erosion risk maps for the Epworth district for the years 2000 (a) and 2018 (b); map (c) shows the spatial extent soil erosion damage in percentages based on field mapping in December 2019 for selected plots (plot size measured 40 m × 80 m; in total 49 sites were randomly surveyed, covering varying land use).
Sustainability 12 08531 g005
Figure 6. The extent of soil erosion observed in Epworth district. (a) paved roadside erosion feature; (b) erosion occurring in an unpaved road.
Sustainability 12 08531 g006
Figure 7. Evaluation of soil erosion modelling and field measurements.
Sustainability 12 08531 g007
Table 1. Principal data used for soil erosion modelling showing the resolution and the source.
Data TypeResolutionSource
K Factor 250 mGlobal Soil map and attributes in raster (TIF format) from ISRIC (International Soil Reference Information
Centre)-World Soil Information “SoilGrids” [71]
R Factor -Average monthly rainfall data from the Zimbabwe Department of Meteorological Services (Harare) database.
LS Factor30 mDigital Elevation Model (DEM) from the United States Geological Survey (USGS) website [72]
C Factor30 mObtained by assigning weighted C factor values to the LULC maps adopted from Marondedze and Schütt, 2019
P Factor30 mThe value of 1 was assigned to all-over the study area.
Table 2. Location of gauging stations and mean annual precipitation for the study periods.
Rain StationsCoordinatesMean Annual Precipitation (mm)
1984–20002000–20181984–2018
Belvedere17°50′ S, 31°01′ E880.2851.1865.7
Airport17°55′ S, 31°06′ E834.3774.2804.3
Kutsaga17°55′ S, 31°08′ E804.6792.8798.7
Table 3. C factor values and relative proportion of LULC classes for 1984, 2000 and 2018 [9].
Land Area (%)
Land Use ClassWeighted C Factor Value198420002018
CBD/Industrial areas0.0170.10.40.5
LMD (Less concentrated) 0.0662.815.531.5
HD (Concentrated) 0.08316.63852.6
Irrigated cropland0.166170.4
Rainfed cropland0.23917.9179.1
Green spaces0.0361.5225.9
Water00.10.10.04
Note: *CBD: Central Business District; *LMD: Low-Medium Density; *HD: High Density.
Table 4. Description of study area Land Use and Land Cover (LULC) classes (data source: [9]).
IDLand Use and Land Cover ClassDescription
1CBD/IndustriesIndustries and central business district defined with high fraction of impervious surfaces mainly buildings and little proportion of vegetation
2LMD residential (less concentrated)Leafy and well established low and medium density suburbs surrounded with high vegetation
3HD residential (concentrated)High density residential areas with low vegetation cover or clustered settlements with areas undergoing developments and bare exposed land
4Irrigated croplandCultivated land under irrigation schemes
5Rainfed croplandCultivated land or land with crop residues after harvesting
6Green spacesAll wooded areas, shrubs and bushes, riverine vegetation and grass covered areas
7WaterAreas occupied by water, rivers, wetlands, reservoirs and dams
*CBD: Central Business District; *LMD: Low-Medium Density; *HD: High Density.
Table 5. Potential erosion risk classes with erosion rate and area covered proportion.
Soil Erosion RiskSoil Loss
(t ha−1 yr−1)
1984–2018
Area (km2)Area (%)
Low0–10.51.4
Moderate1–22.36.6
High2–50.41.1
Very high5–1011.332.3
Extreme>1020.558.6
Table 6. Estimated soil erosion risk in Epworth district for 2000 and 2018.
Soil Loss
(t ha−1 yr−1)
Soil Erosion Risk20002018
Area (km2)Area (%)Area (km2)Area (%)
0–1Low19.656.320.759.5
1–2Moderate9.025.910.229.3
2–5High5.215.03.510.0
5–10Very high0.92.50.41.1
>10Extreme0.10.30.040.1
Table 7. The extent of soil erosion in Epworth district summarized for 2019 field survey.
Spatial Eroded Area (m2)
Number of mapped sites49
Total extent of erosion765
Mean31
Standard Deviation10.5
Standard Mean Error1.5
Table 8. Estimated soil loss for the different Land Use and Land Cover (LULC) classes in Epworth district based on the assessment of soil erosion risk and LULC analysis for the years 2000 and 2018.
LULC Class.20002018
Soil Loss (tons)Area (km2)Percentage (%)Soil Loss (tons)Area (km2)Percentage (%)
CBD/Industrial area400.120.4470.190.5
LMD (less concentrated)62185.4115.512,20310.9631.5
HD (concentrated)14,01813.173819,85818.3252.6
Irrigated cropland69702.4577330.130.38
Rainfed cropland19,2285.851792393.169.1
Green spaces39347.78228542.065.9
Water00.050.100.010.04
Total50,40834.8310042,93434.83100
*CBD: Central Business District; *LMD: Low-Medium Density; *HD: High Density.
Publisher’s Note: MDPI stays neutral with regard to jurisdictional claims in published maps and institutional affiliations.

