3.1. Effect of TA Concentration
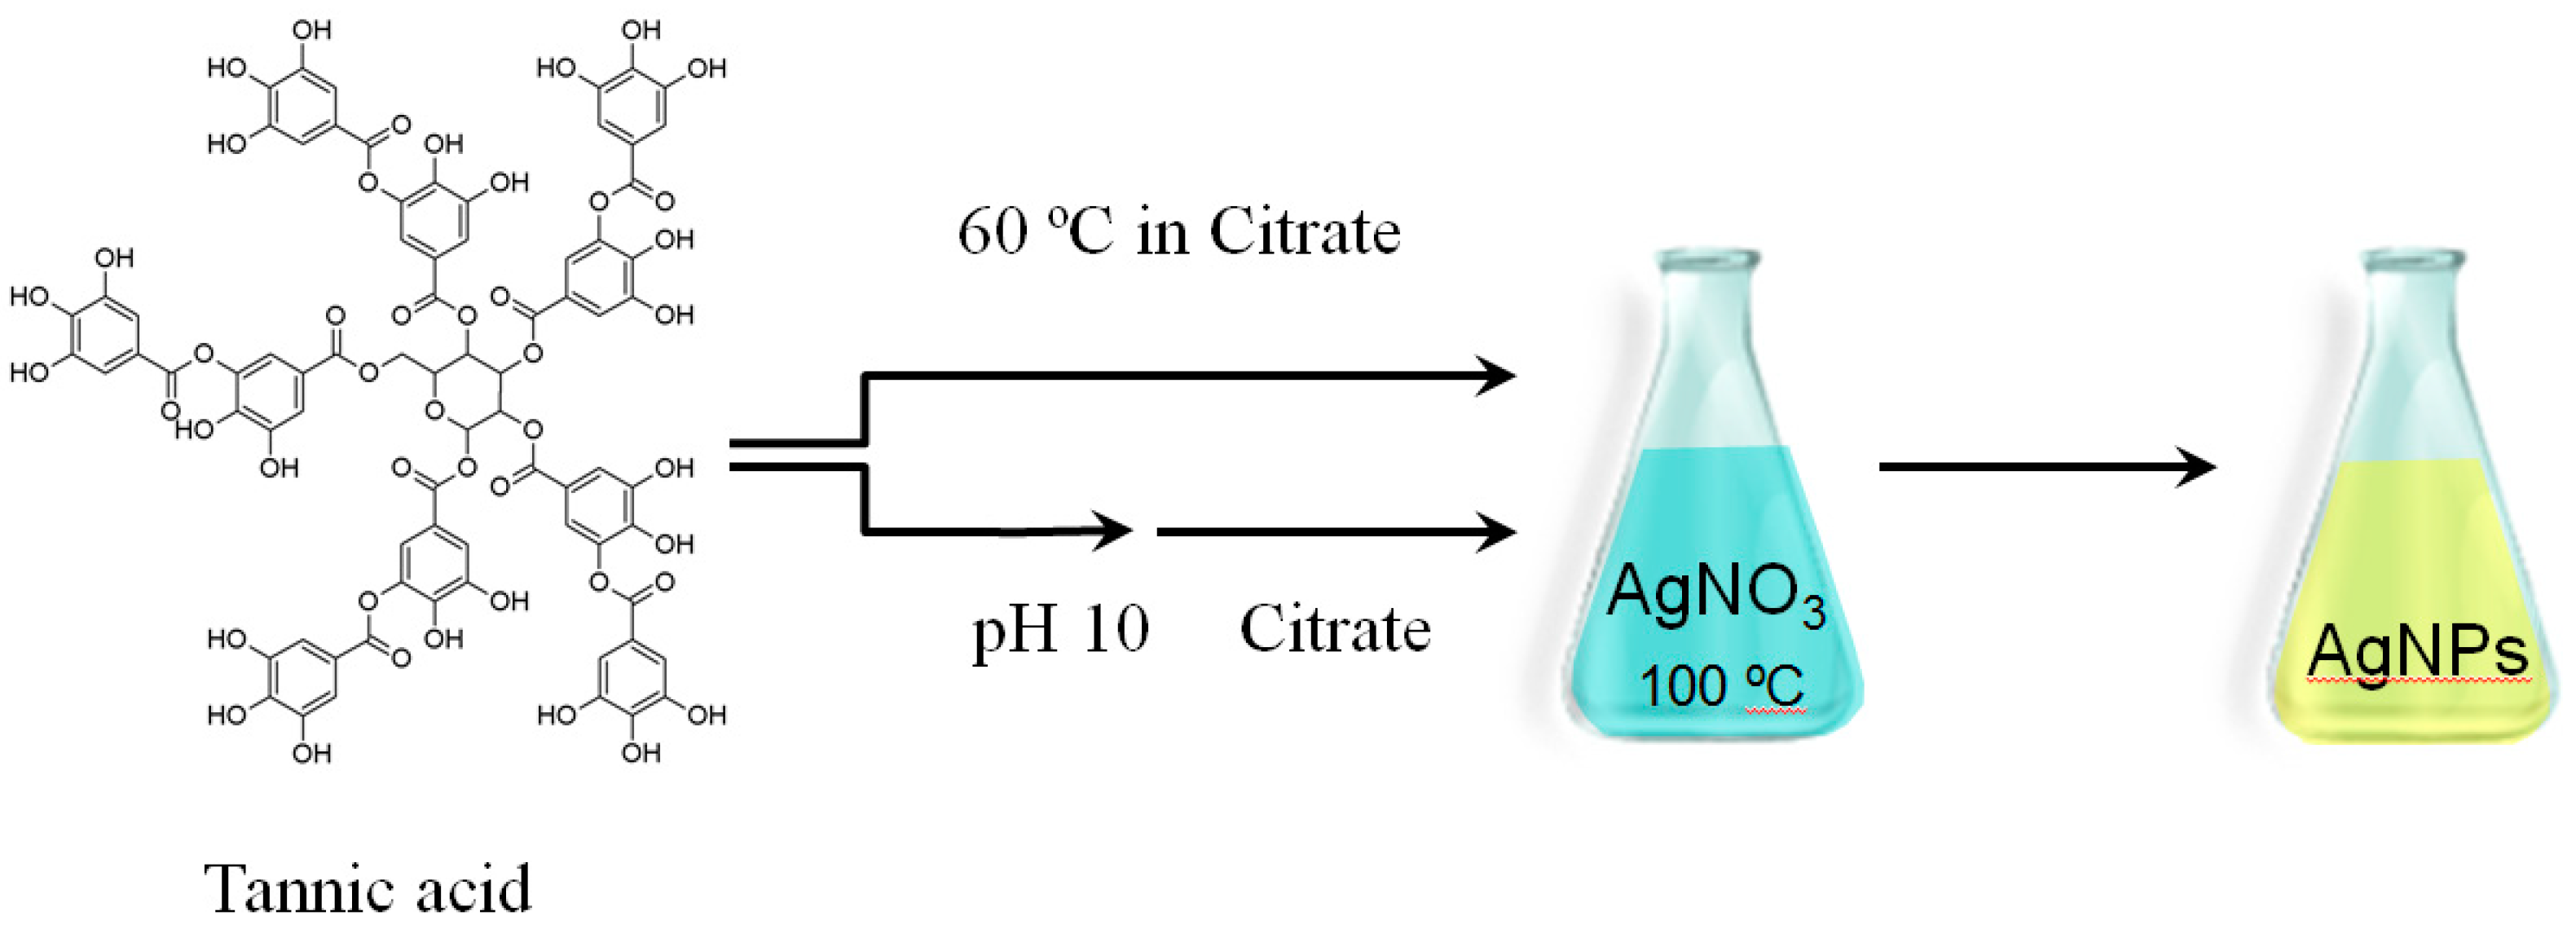
The synthesis of all AgNPs was performed by setting the concentration of AgNO3 at 0.55 mM and the concentration of citrate at 1.4 mM; after synthesis, the pH of the colloidal solution was around 6.5. As the first stage, AgNPs were synthesized by varying the concentration of TA in citrate solution (0, 3.3 × 10⁻⁷, 3.3 × 10⁻⁶ and 3.3 × 10⁻⁵ M). In each case, the TA solution was mixed with the citrate solution and then thermally preconditioned at 60 °C for 45 min prior to addition to a boiling solution of AgNO3.
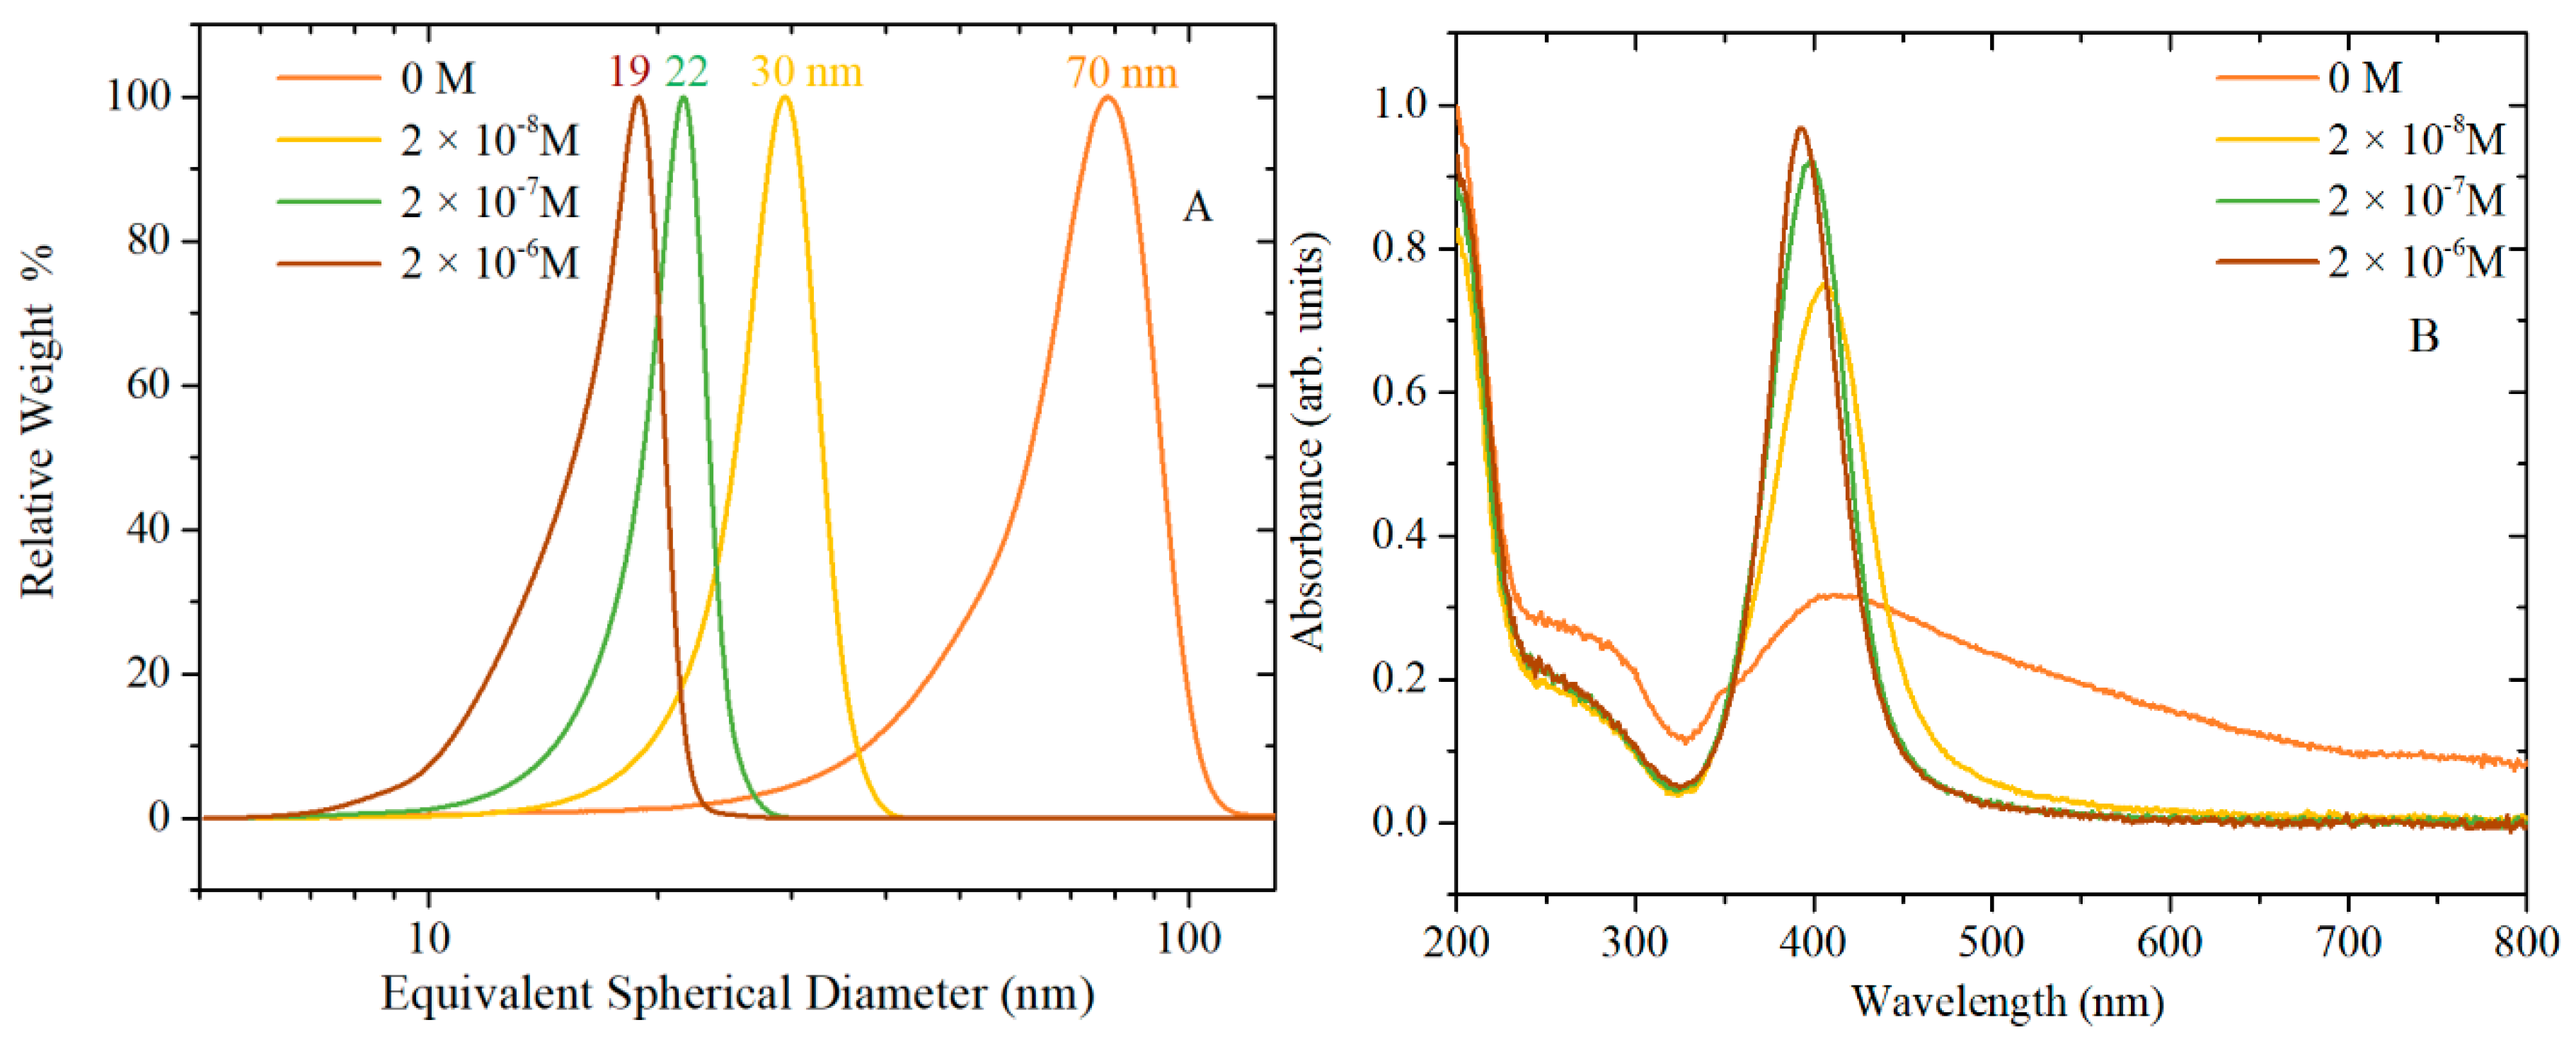
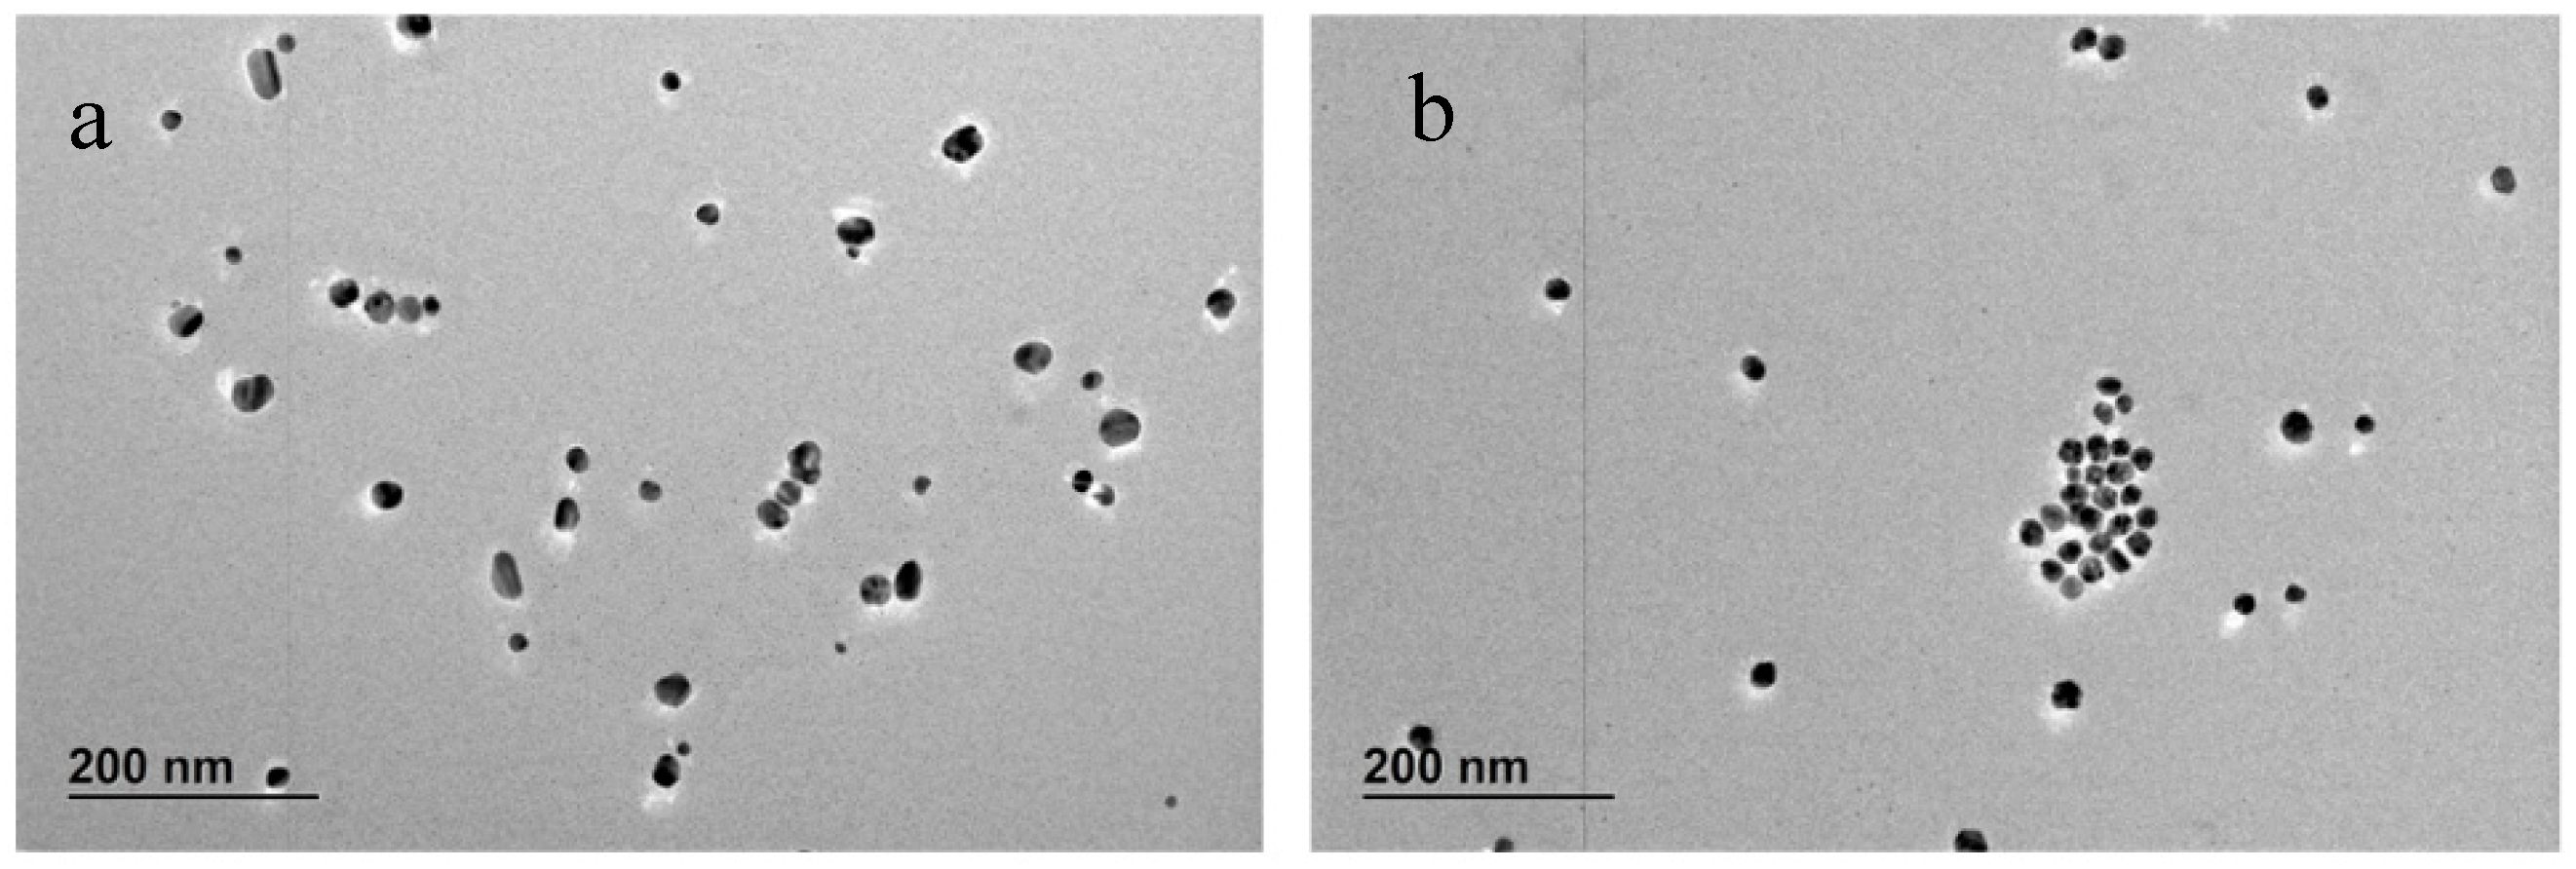
Figure 1 shows CLS particle size distributions, UV-vis absorption and morphology of AgNPs caused by varying the concentration of TA, while
Figure 2 shows the corresponding TEM images.
Table S1 shows the summary of NPs size and size distribution through different techniques (CLS, DLS and TEM), zeta potential characterization, pH of the TA/citrate solution prior to addition to boiling solution of AgNO
3, and finally, the pH of the AgNPs colloidal solution.
The UV-vis spectra in
Figure 1B show the surface plasmon resonance (SPR) band, which is influenced by the particles’ shape and size, and by the polydispersivity of the nanoparticles. When no TA is added to the synthesis solution, the SPR band is broad and absorption is observed also at wavelengths greater than the peak at 413 nm. This broad SPR band is the result of large spherical as well as nonspherical particles, which is normally associated with broadening and red-shift of the SPR band. The CLS data of these nanoparticles show a wide peak which is characteristic of a polydispersed size distribution of nanoparticles; DLS data (
Table S1 and Figure S1) and the TEM images confirm that the synthesis of AgNPs by citrate reduction without any TA added to the synthetic solution results in a polydispersed product containing also a variety of nonspherical nanoparticles. With the increasing amount of TA from 2 × 10
−8 to 2 × 10
−6 M, the SPR band at about 400 nm becomes narrower and sharper (the tail at higher wavelengths decreases), which is characteristic of monodispersed spherical nanoparticles. In addition, the CLS data show that the increasing amount of TA produces AgNPs with slightly narrow size distribution (sharper peak) and a shift toward lower size (lower wavelength of the surface plasmon absorption peak centre in UV-vis data). This trend is confirmed by the TEM images, which show a reduction in the quantity of rods as the concentration of TA is increased in the reaction solution. Hence, the TA has an important role in the final size, size distribution and shape of AgNPs even when such small amounts of TA are added to the chemical reaction.
X-ray diffraction analysis has been performed over a selection of synthetized materials (see data in
Figures S2–S4), varying the TA concentration and thermal pretreatment time at 0 and 45 min. Analysis confirms that AgNPs are silver face-centred cubic, and their overall crystallinity is around 72 ± 6%. Samples synthetized in the presence of tannic acid exhibit an (111) facet crystallite size of 16.8 nm, while the average crystallite size of other reflections is 4.8 ± 1.4 nm. No clear dependence on preconditioning temperature and tannic acid concentration was observed on AgNP crystallite growth. Samples synthetized without tannic acid shows larger (about factor 2) crystallite size.
Dadosh [
19] studied the synthesis of AgNPs using TA in the concentration range from 3.6 × 10
−7 M to 4.7 × 10
−6 M finding that the size of AgNPs increased with the TA concentration. A comparison of the
DTEM size obtained with [TA] = 2 × 10
−7 M in this work (20 nm) with that obtained by Dadosh at 3.6 × 10
−7 M (18 nm) shows a good correspondence. However, the same correlation of size is not observed at [TA] = 2.0 × 10
−6 M; in this work,
DTEM was 16 nm, whereas in the Dadosh study, 2.36 × 10
−6 M TA generated 27 nm AgNPs. The difference in these outcomes inspired the investigation of the role of TA in the synthesis of AgNPs as a function of TA concentration and preconditioning time at 60 °C. In
Table 1, the experimental conditions (TA and citrate concentrations, temperature and reaction time) and the size of the obtained AgNPs synthesised in this work are compared with the conditions followed by Dadosh [
19]
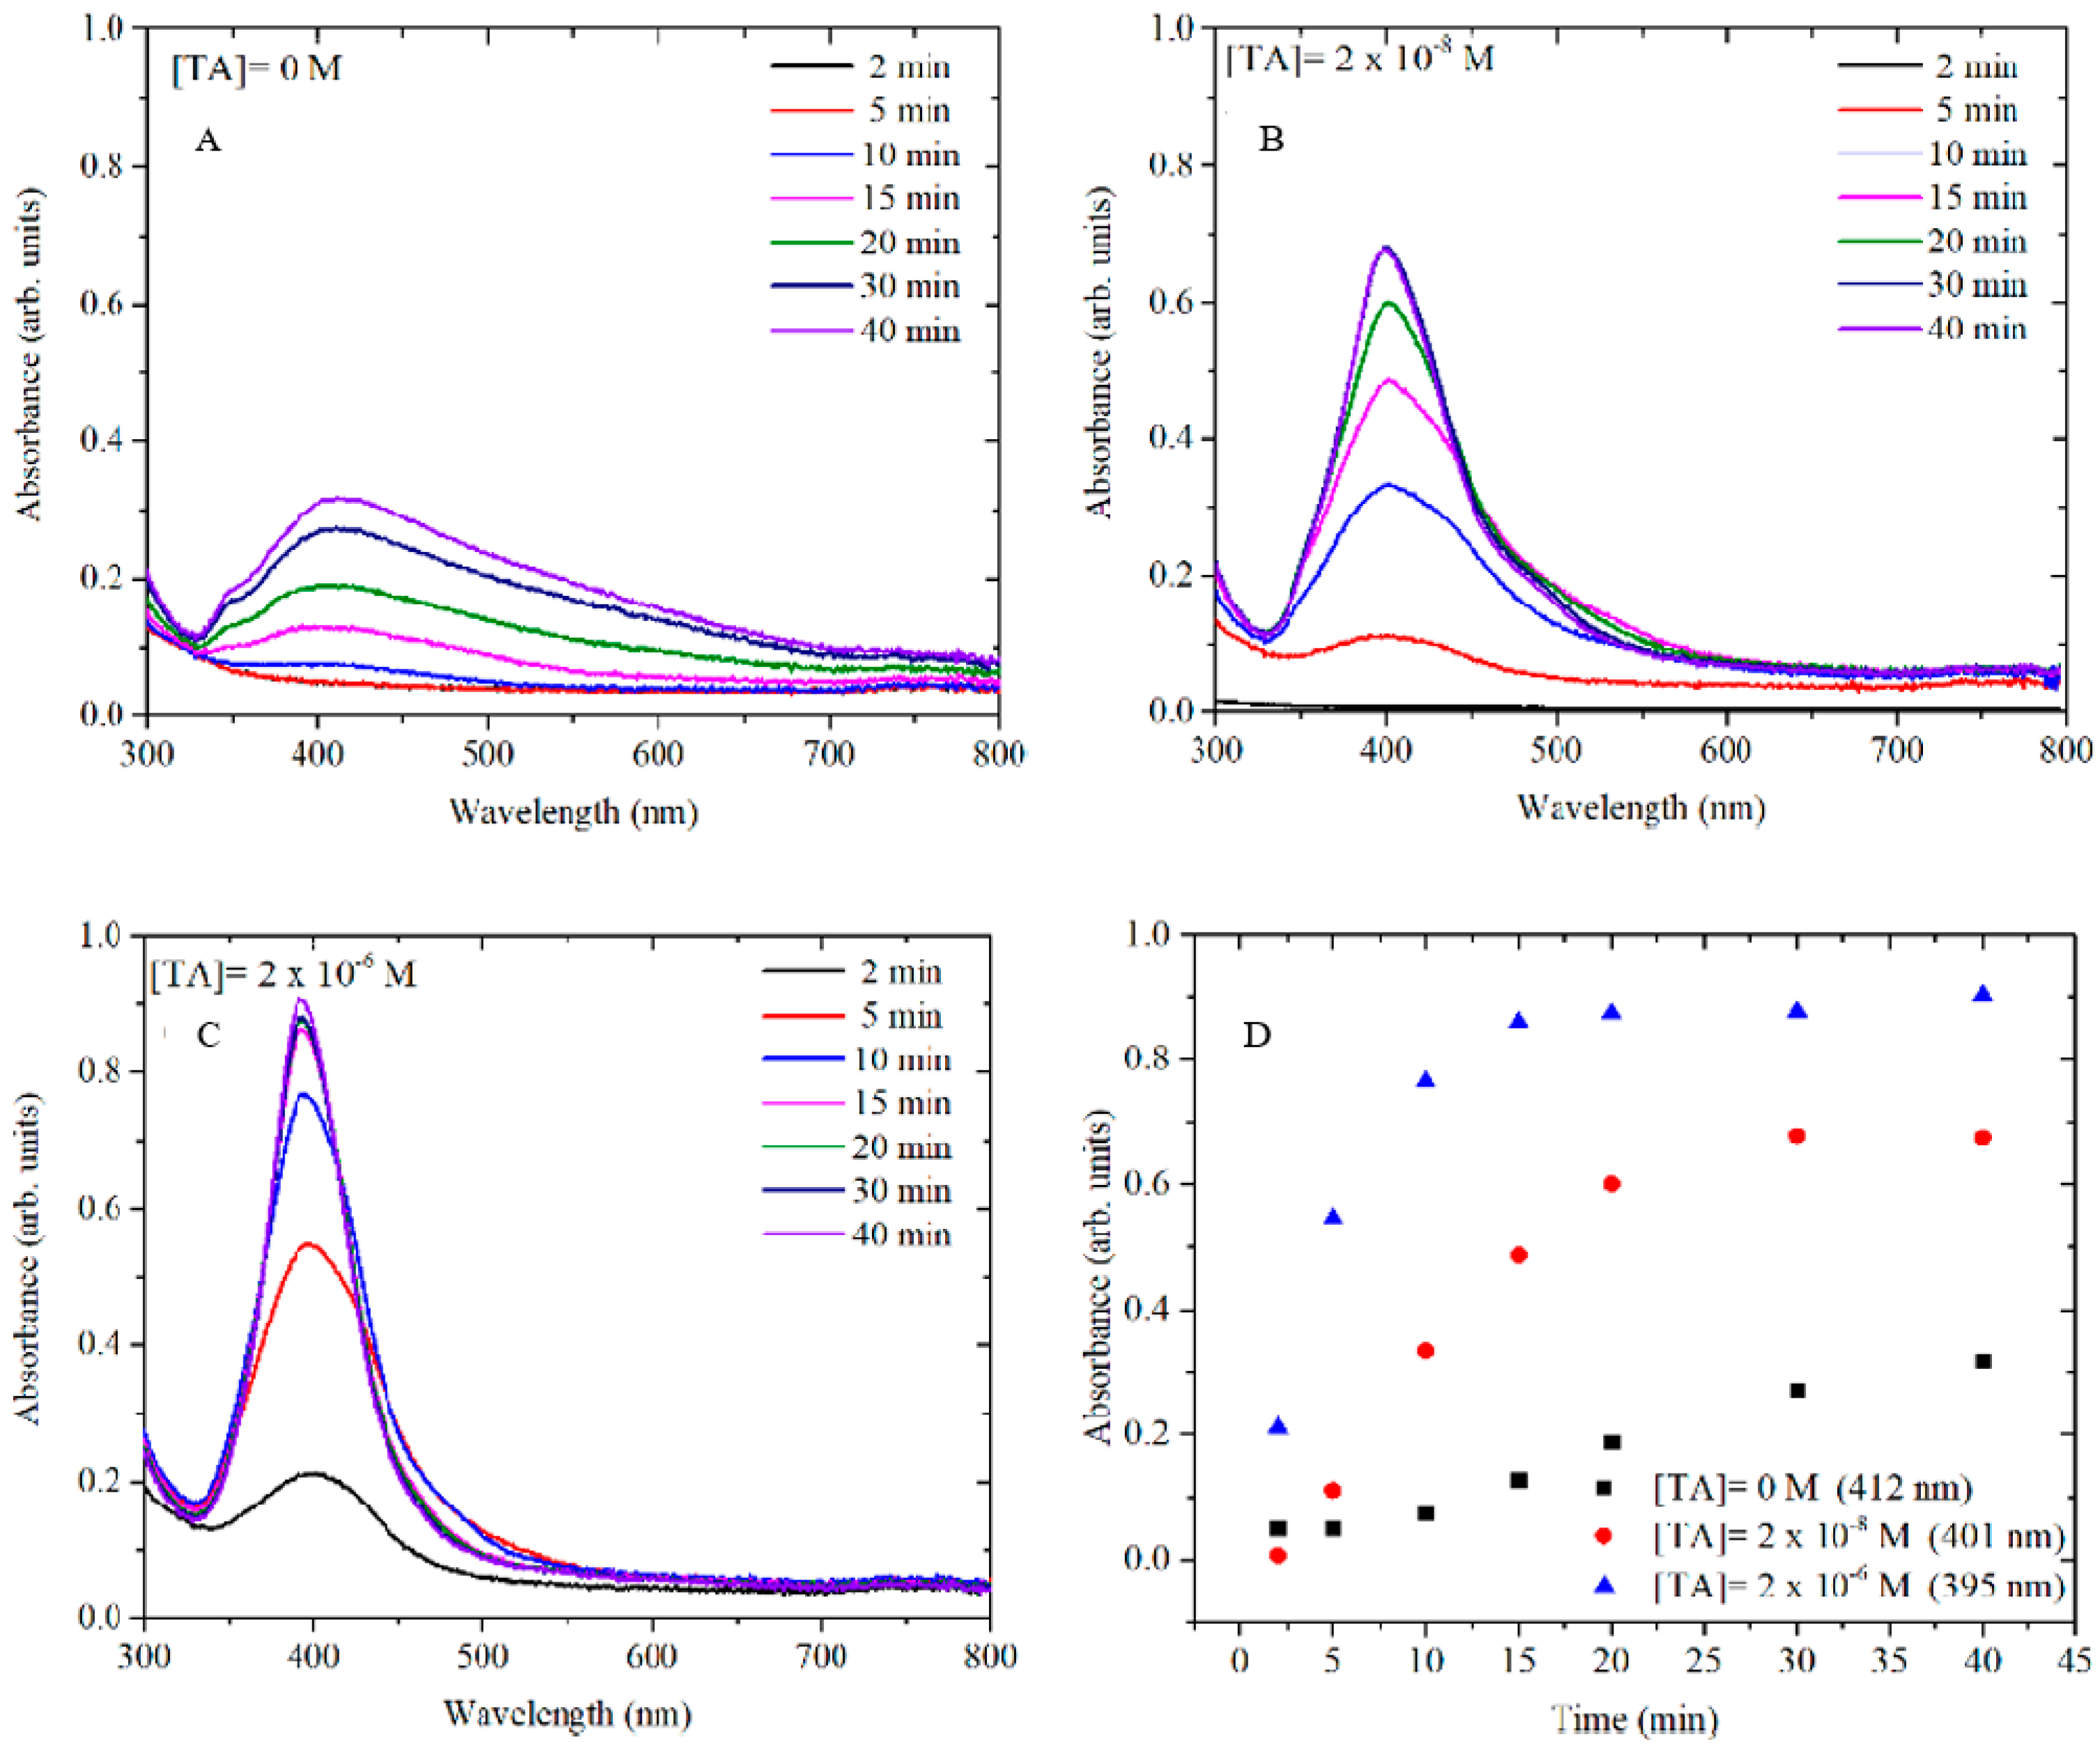
In order to better understand the mechanism of TA in AgNP formation, the growth of AgNPs at different concentrations of TA (0 M, 2 × 10
−8 M and 2 × 10
−6 M) was monitored in time by UV-vis. The SPR band of the metallic silver was monitored at different growth times (
Figure 3) while varying the concentration of TA. All samples were monitored for up to 60 min, but in all cases, the spectra remained unchanged after 40 min.
It is well known that the size and the shape of NPs depend on the induction time, the nucleation-dominant formation and the growth period [
20]. Generally, a slow nucleation rate (large induction time) favours the formation of large size nanoparticles. In
Figure 3, the growth kinetics of AgNPs at several concentrations of TA show induction times that become shorter as the concentration of TA increases. When no TA is added to the reaction (
Figure 3A), the nucleation rate is slow and the induction time is over 10 min, which suggests that the formation of AgNPs may be dominated by the Ostwald ripening and coalescent attachment [
21]. Hence, in this case, polymorphic and polydispersed AgNPs were obtained. In contrast, when even low concentrations of TA (sub-stoichiometric with respect to [Ag
+]) were used in the AgNP synthesis, the induction time was reduced to 5 min when [TA] = 2 × 10
−8 M and then to less than 2 min when [TA] = 2 × 10
−6 M. This effect is probably due to the stronger reducing power of TA compared to citrate [
22], resulting in a more rapid and uniform formation of metal clusters which coalesce into seed particles. Successively, after the TA is consumed, these seeds serve as templates for the deposition of the remaining free silver ions through a slower reduction by citrate at the particles surface. This hypothesis is supported by the observation that, as the concentration of TA increases, the size of AgNPs decreases. Therefore, a larger number of AgNPs have been formed for a large TA concentration keeping constant the amount of Ag
+.
The observation that the presence of TA reduces the formation of nonspherical particles may be attributed to competition between TA and citric acid for absorption at different crystal growth planes. It has been reported that citric acid preferentially absorbs on the (111) face [
23] of a silver crystal effectively passivating this surface and resulting in a preferential growth of the (100) surfaces, leading to the occurrence of cubic and elongated cubic structures. In our system, we observe that, upon the addition of TA at all tested concentrations, an enhancement of (111) facet growth at the expense of (200) planes (see
Figure S2), which indicates the presence of isotropic AgNPs with truncated octahedron shape (dominant (111) facets) and, at the same time, the overall crystallite size decreases for all observed crystal planes (see
Figure S3). These observations are compatible with the interpretation that the presence of TA, with its many hydroxyl groups, results in additional competing passivation of the (100) face, or alternatively, stronger nonspecific binding by TA may cover all faces of the silver, thereby impeding absorption of the citrate and thus inhibiting oriented growth.
3.2. Synthesis of AgNPs by Thermal Preconditioning of TA
In order to understand what is occurring during TA preconditioning, the synthesis of AgNPs was performed following two different synthetic routes (
Figure 4). In the first route, the TA/citrate solution was preconditioned at 60 °C from 0, 15, 45 and 90 to 180 min and then added to a boiling solution of AgNO
3. In the second route, TA was preconditioned for 24 h at pH 10, without heating, and mixed with a citrate solution before finally being added to a boiling solution of AgNO
3. The influence of both routes on the AgNPs final product was explored at final TA concentrations of 2 × 10
−6 and 2 × 10
−5 M in the AgNPs solution. The concentrations of AgNO
3 and citrate were kept constant throughout the synthesis.
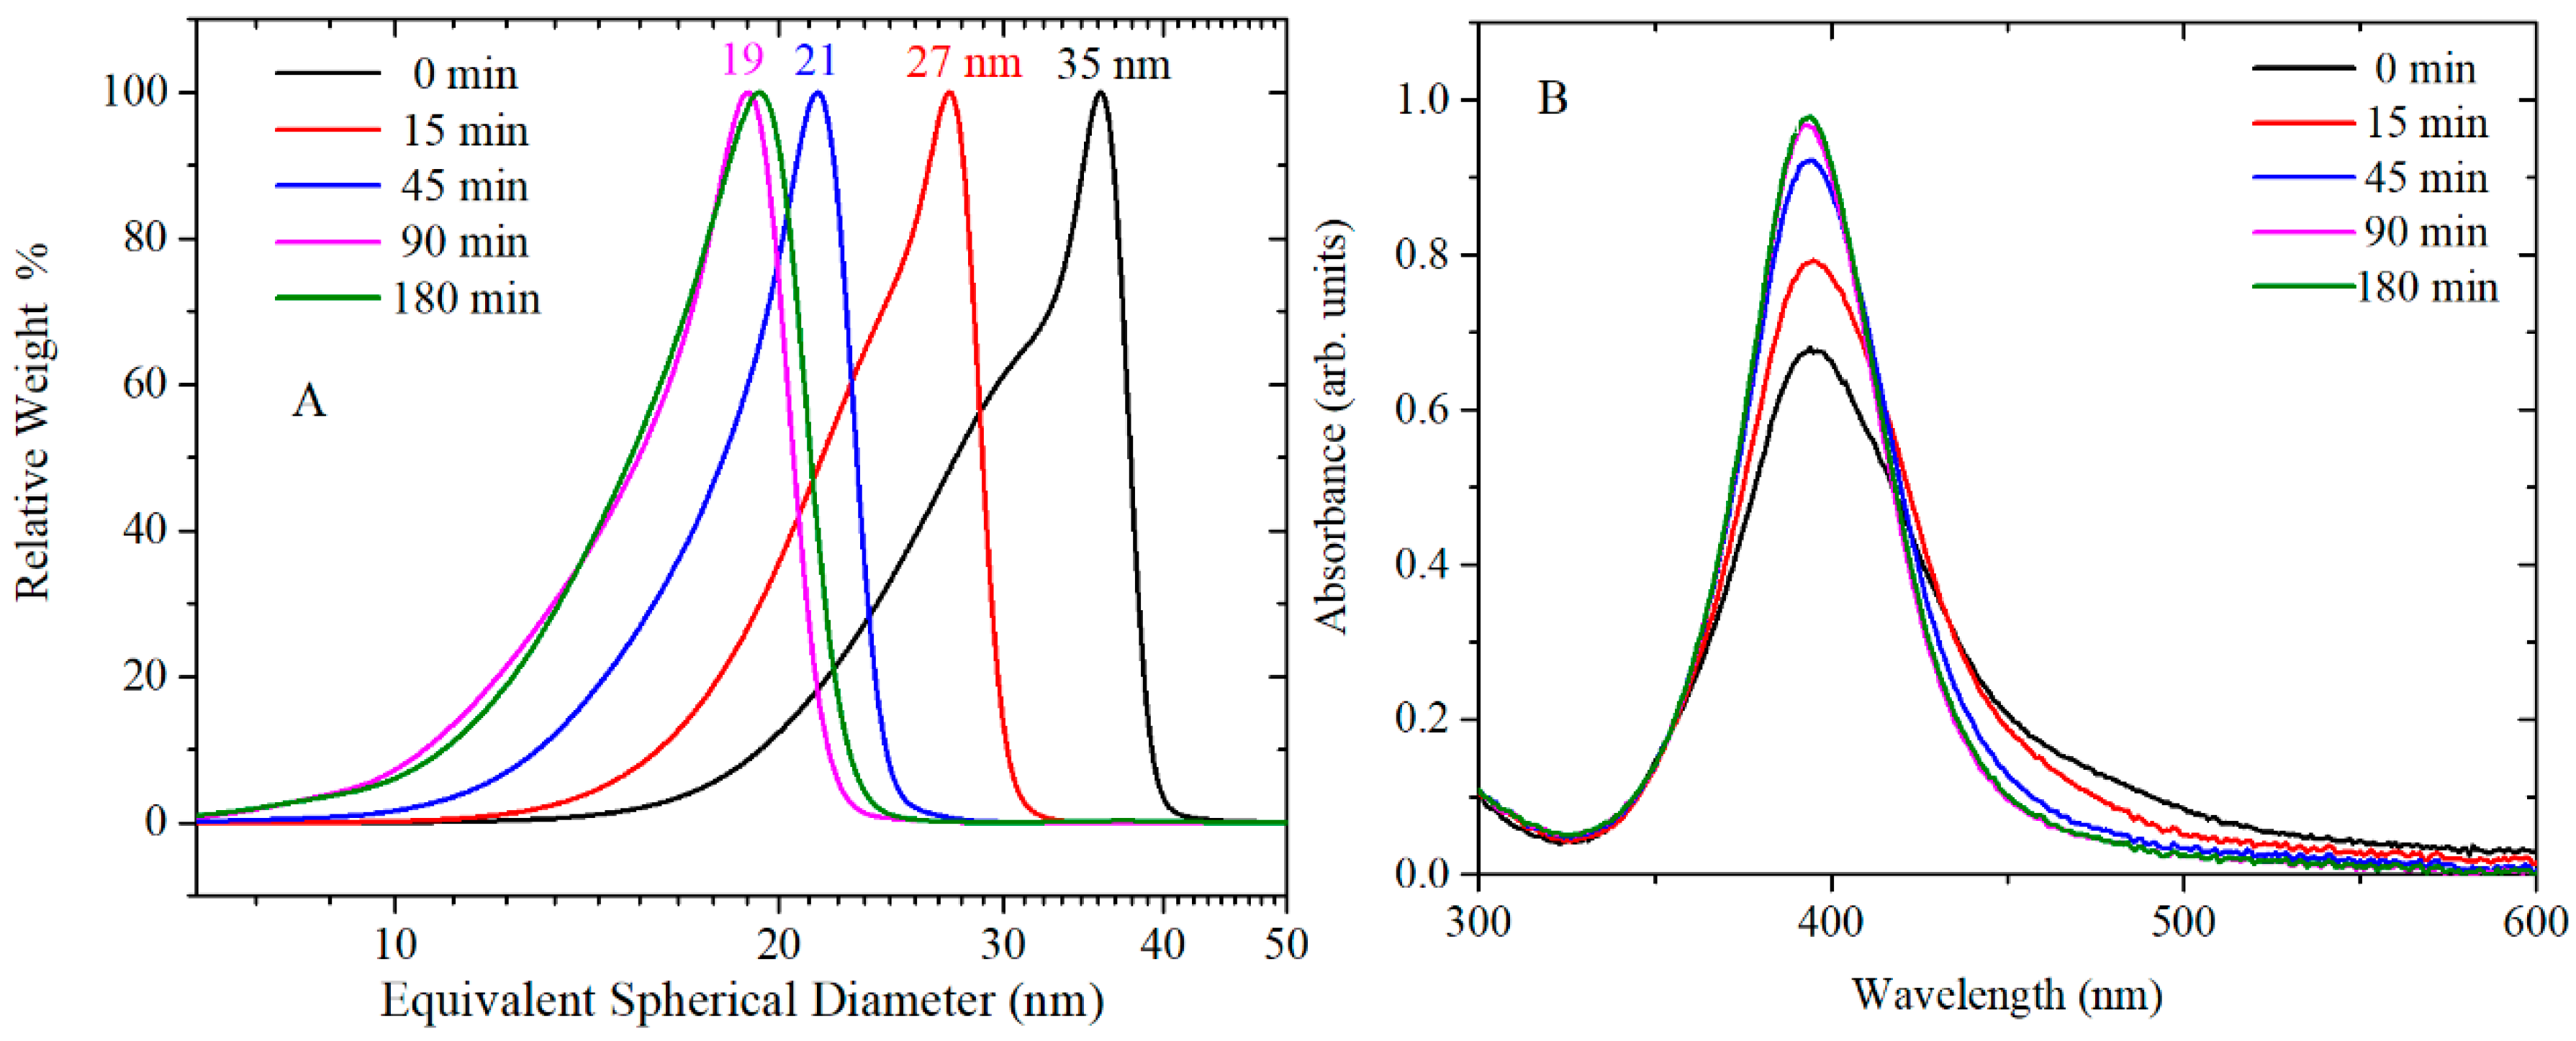
Figure 5 and
Figure 6 show the CLS, UV-vis and TEM images of AgNPs synthesised by reduction of AgNO
3 with citrate and TA solution. TA was thermally preconditioned in citrate solution at 60 °C for 0, 15 min, 45 min, 90 min and 180 min. The concentration of TA in AgNPs solution was 2 × 10
−6 M, and after synthesis, the pH of AgNPs colloidal solution was pH 6.5. At larger thermal preconditioning time, the UV-vis spectra showed a sharper SPR band at 400 nm and the tail at 500 nm became less pronounced; this trend is associated to mono-dispersed spherical nanoparticles. In addition, the number of rod-shaped nanoparticles decreases as confirmed by TEM image. No clear effect on crystallization properties was observed in X ray diffractograms (see
Figure S4) of AgNPs synthesised with and without 45 min thermal preconditioning. The CLS data show a shift toward smaller nanoparticle size as the thermal preconditioning time at 60 °C increases; hence, the thermal preconditioning time of TA in citrate solution at 60 °C influences the shape, the size and the size distribution of AgNPs. As additional confirmation, the size of AgNPs was determined by DLS (
Table S2 and Figure S5). However, the results were not easy to interpret for these samples because this technique is not well adapted to polydispersed and nonspherical shaped samples. Evaluation of the particle shape from TEM images using ImageJ software showed that the roundness of the AgNPs slightly improved from 0.81 ± 0.14 to 0.85 ± 0.09 by using TA thermal preconditioning from 0 to 180 min. For these samples, the measured magnitude of the Z-potential was found to increase slightly from −47 to −37 mV, as more TA was added but, overall, remained sufficiently high to maintain colloidal stability through electrostatic repulsion.
A series of similar experiments were performed using the same concentration of AgNO
3 and citrate as used previously but with the TA concentration being increased by a factor of 10 to a value of 2 × 10
−5 M. As in the previous case, TA was thermally preconditioned in citrate for 0, 15, 45, 90 and 180 min and, after synthesis, the pH of the AgNPs colloidal solution was around 7. The CLS and UV-vis results are shown in
Figure S6 and the corresponding TEM pictures in
Figure S7.
In this case, the TEM images show that NPs with high roundness were obtained at each preconditioning time. Not only the shape but also the size of the AgNPs appeared to be independent of the thermal preconditioning step up to 90 min as confirmed by CLS and DLS data (
Table S3). Surprisingly, a further increase in the thermal pretreatment to 180 min produced a slight decrease in the size of AgNPs, from 24 to 20 nm, accompanied by a drastic narrowing in the size distribution of AgNPs. DLS data (
Table S3 and Figure S8) show that the PDI goes from 0.311 (zero preconditioning time of TA) to 0.05 (after 180 min of TA preconditioning time), indicating mono-dispersed and round-shaped NPs. A change in the Z-potential of the samples change from −47 to −43 mV again confirms the electrostatically stabilised nature of the AgNPs suspension. Summarising, the synthesis of AgNPs by thermal preconditioning of TA at a concentration of 2 × 10
−5 M in the synthesis mixture produced close to spherical AgNPs with a size dependence only being observed with extended (180 min) thermal preconditioning.
3.3. Effect of the Thermal Conditioning on TA
For the synthesis of AgNPs, TA is equilibrated in citrate at 60 °C and then added to a boiling solution of AgNO
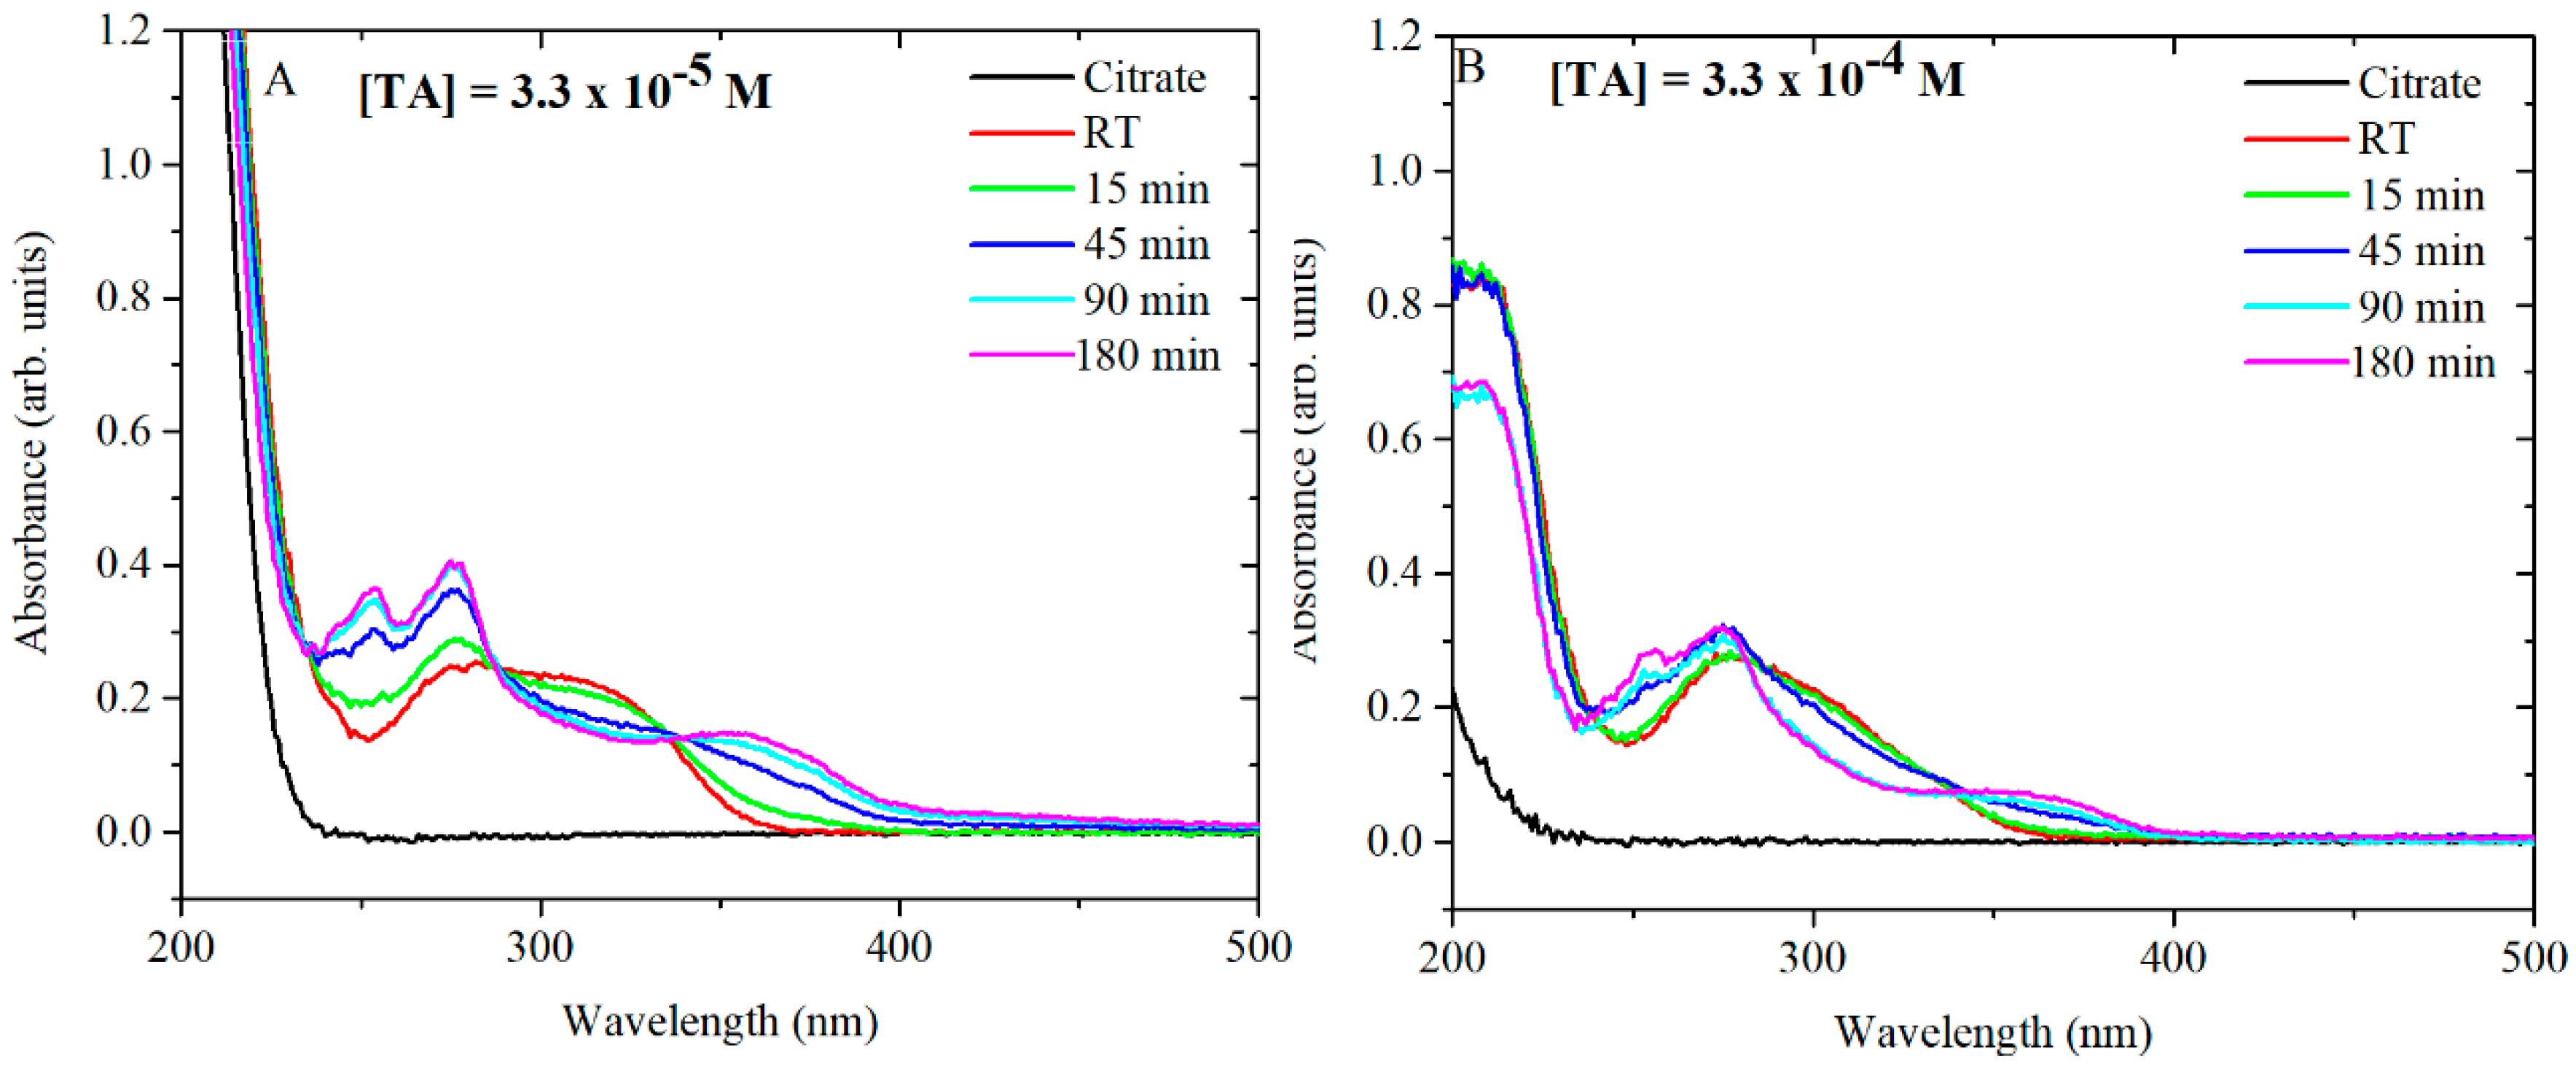
3. As mentioned previously, TA plays an important role in the formation of AgNPs with specific shape, size and size distribution. Consequently, further studies were performed to focus on the behaviour of TA during the thermal preconditioning step. Firstly, TA-citrate solutions at pH 7 were analysed by UV-vis in order to understand the behaviour of TA after being heated up at 60 °C. TA-citrate aliquots were collected at different time points. The tested TA concentrations were 3.3 × 10
−5 M and 3.3 × 10
−4 M. Note that these two concentrations when diluted (6 mL in 94 mL of AgNO
3) give the desired final concentrations (2 × 10
−6 and 2 × 10
−5, respectively) of TA in the synthesis mixture (
Figure 7A,B). At TA concentrations of 3.3 × 10
−5 M, the UV spectra showed a radical shift of the absorbance peaks already after 15 min of thermal preconditioning. The same trend was detected for 3.3 × 10
−4 M of TA, although in this case, the complete shift of the peaks occurred only after 180 min at 60 °C. It has been already shown that citrate makes TA oxidation most readily, probably as a result of hydrogen bonding interactions between the hydroxyl groups of tannic acid and the oxygen atoms of carbonyl groups of citrates [
14]. Additional experiments were performed in water at pH 5.8 and in phosphate-buffered saline (PBS) at pH 7 in order to determine whether the temporal changes in the UV-vis spectra of the TA were due to the interaction of TA with citrate and/or to the pH of the solution.
The UV-vis spectra of TA in PBS (
Figure S9A,B) and in water (
Figure S9C,D) heated up to 60 °C at different time points are shown. The solutions of TA at the concentration of 3.3 × 10
−5 M in PBS and preincubated at 60 °C were monitored by
1H NMR at different time points to study the modification of the chemical shift (
Figure S10). It is observed that the peak at 7.0 ppm can be assigned to the tannic acid in the hydroquinone form. During preconditioning, the peak at 7.0 ppm disappears and a peak at 7.5 ppm appears, which can be assigned to the quinone derivatised form of tannic acid [
24]
The spectra showed that, at pH 5.6 in water, the TA (
Figure S9C,D) appears to be stable, while under more basic conditions in PBS and Na-citrate, there is a clear modification in the composition of the solution. The similarity of the behaviour with and without citrate suggests that the changes are not directly linked to the presence of citrate itself but to its effect on the pH. In addition, the influence of pH was further confirmed in similar experiments (
Figure 8) in which TA was equilibrated for 24 h at 20 °C in an aqueous solution in which the pH had been modified by the addition of small amounts of HCl or NaOH.
The obtained spectra confirm that strong basic conditions can induce chemical changes without additional heating while, under neutral or moderately basic conditions (pH 7–8), these chemical changes require input of additional heat to produce an effect in a reasonable time.
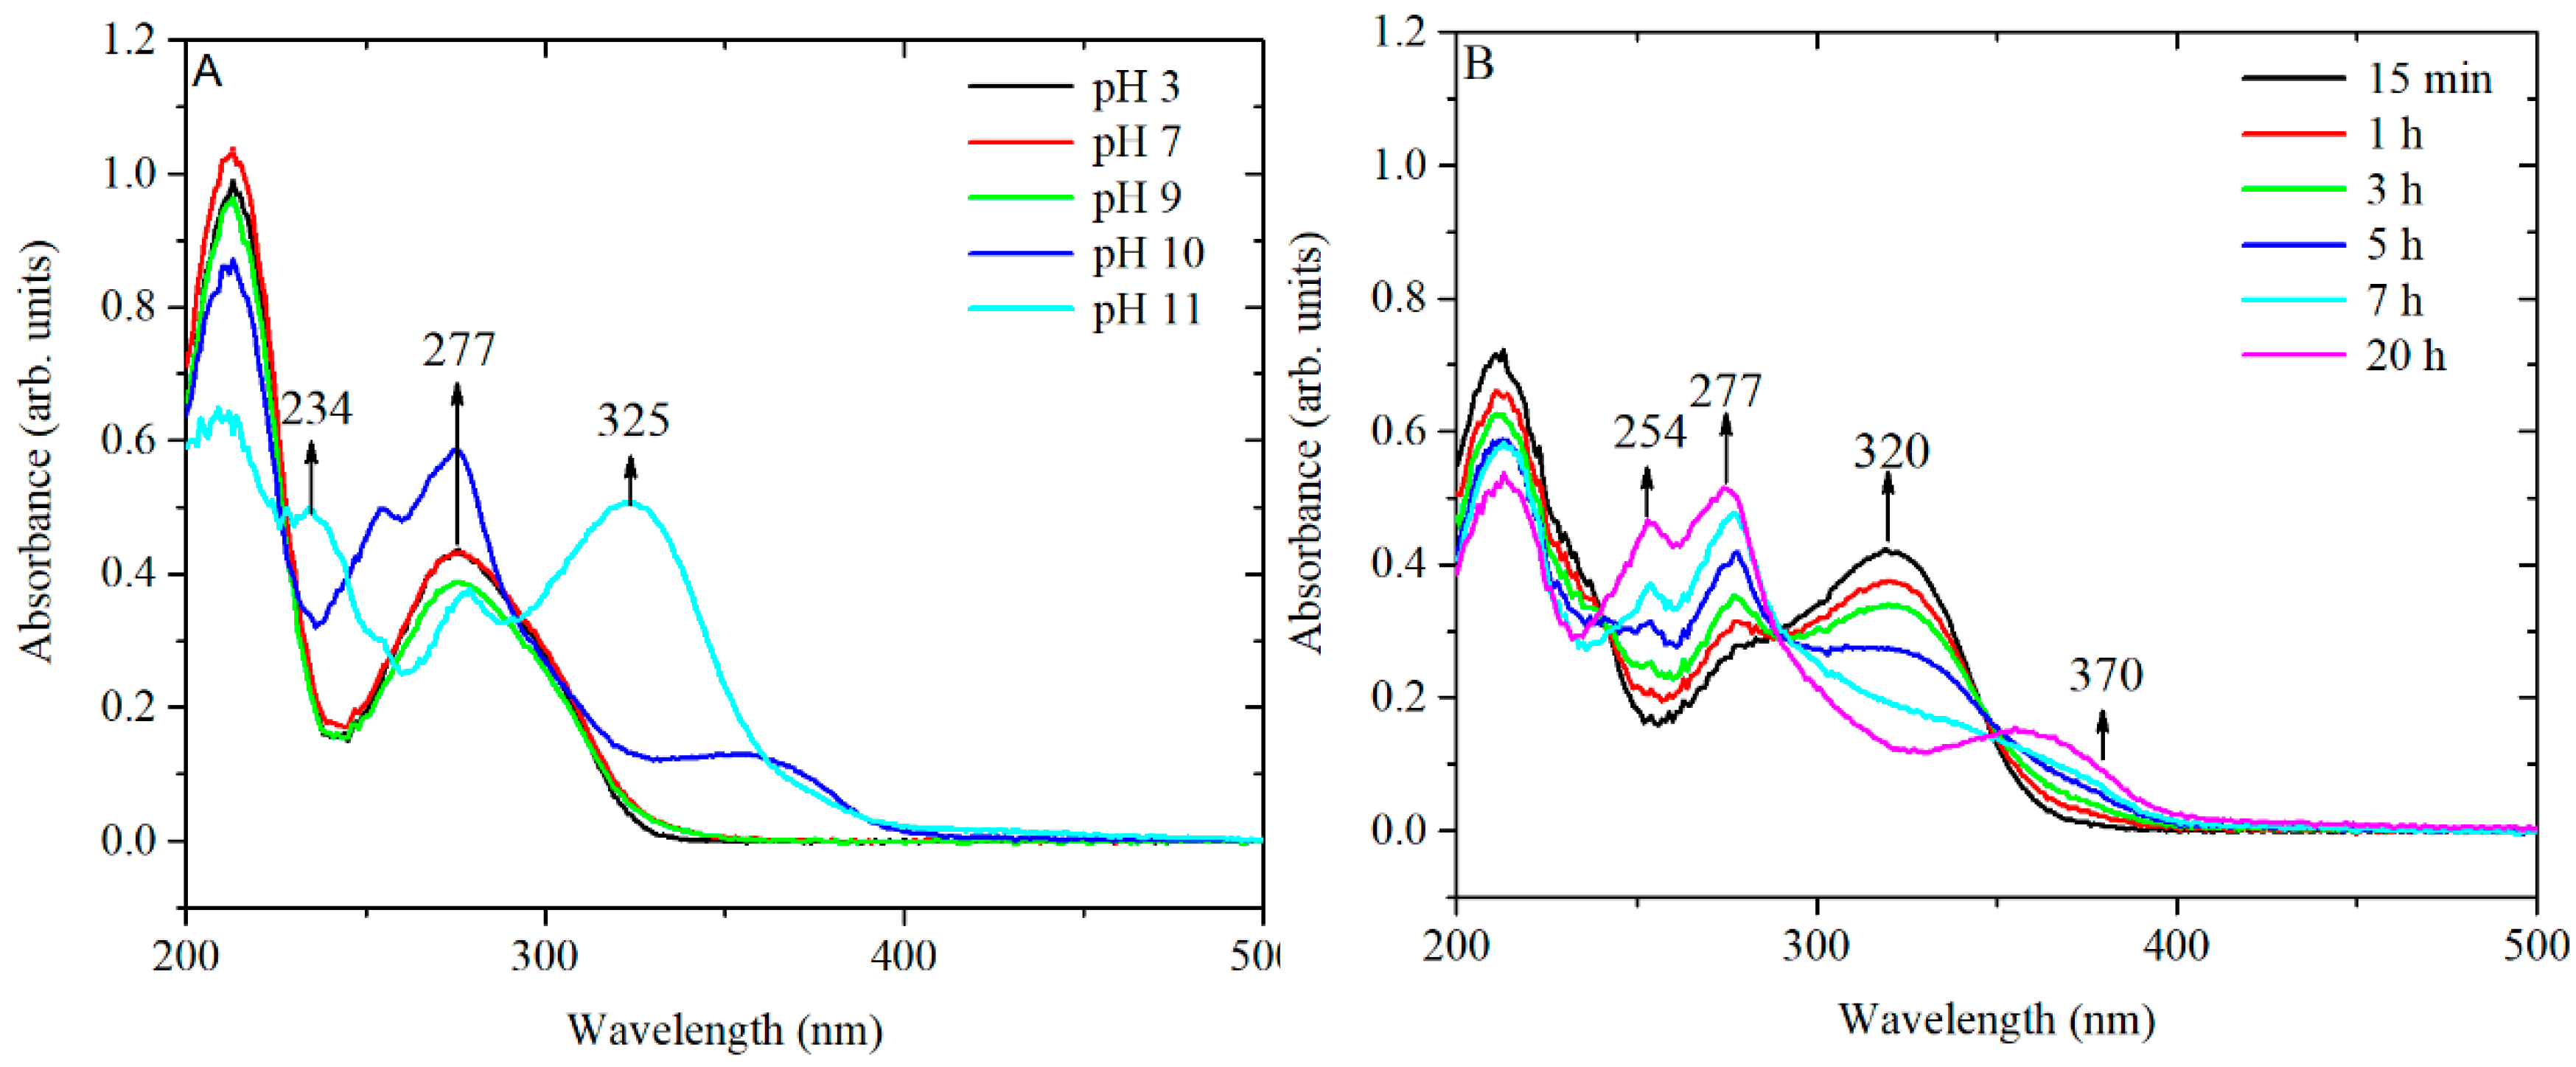
The relevance of these results can be seen considering the results on the behaviour of TA under several pH conditions [
16,
25]. The peaks at around 220 and 277 nm are associated with the neutral form of TA (from pH 2 to pH 8), whereas in strong basic conditions (pH 11), two additional peaks appear at approximately 234 and 325 nm, which are assigned to the ionized phenolic groups of TA. The ratio of the peaks A
276/A
325 has been used to monitor the concentration of ionized phenolate groups. The peaks at 254 and 370 nm (at pH 10) are most likely related to the rearrangements of an ionized structure of TA to various conjugated quinone derivatives [
26,
27].
1H-NMR spectra of TA in PBS at 60 °C confirmed the decreased intensity of the peaks related to the hydroquinone form of TA and an increase in the intensity of the peak related to the quinone form. Similar chemical shifts are observed in TA equilibrated at pH 10 (
Figure S10).
To confirm the hypothesis of chemical rearrangements inside the TA structure, a solution of TA of 3.3 × 10
−4 M was equilibrated at pH 10 and the kinetics of peak shifting was monitored over 24 h (
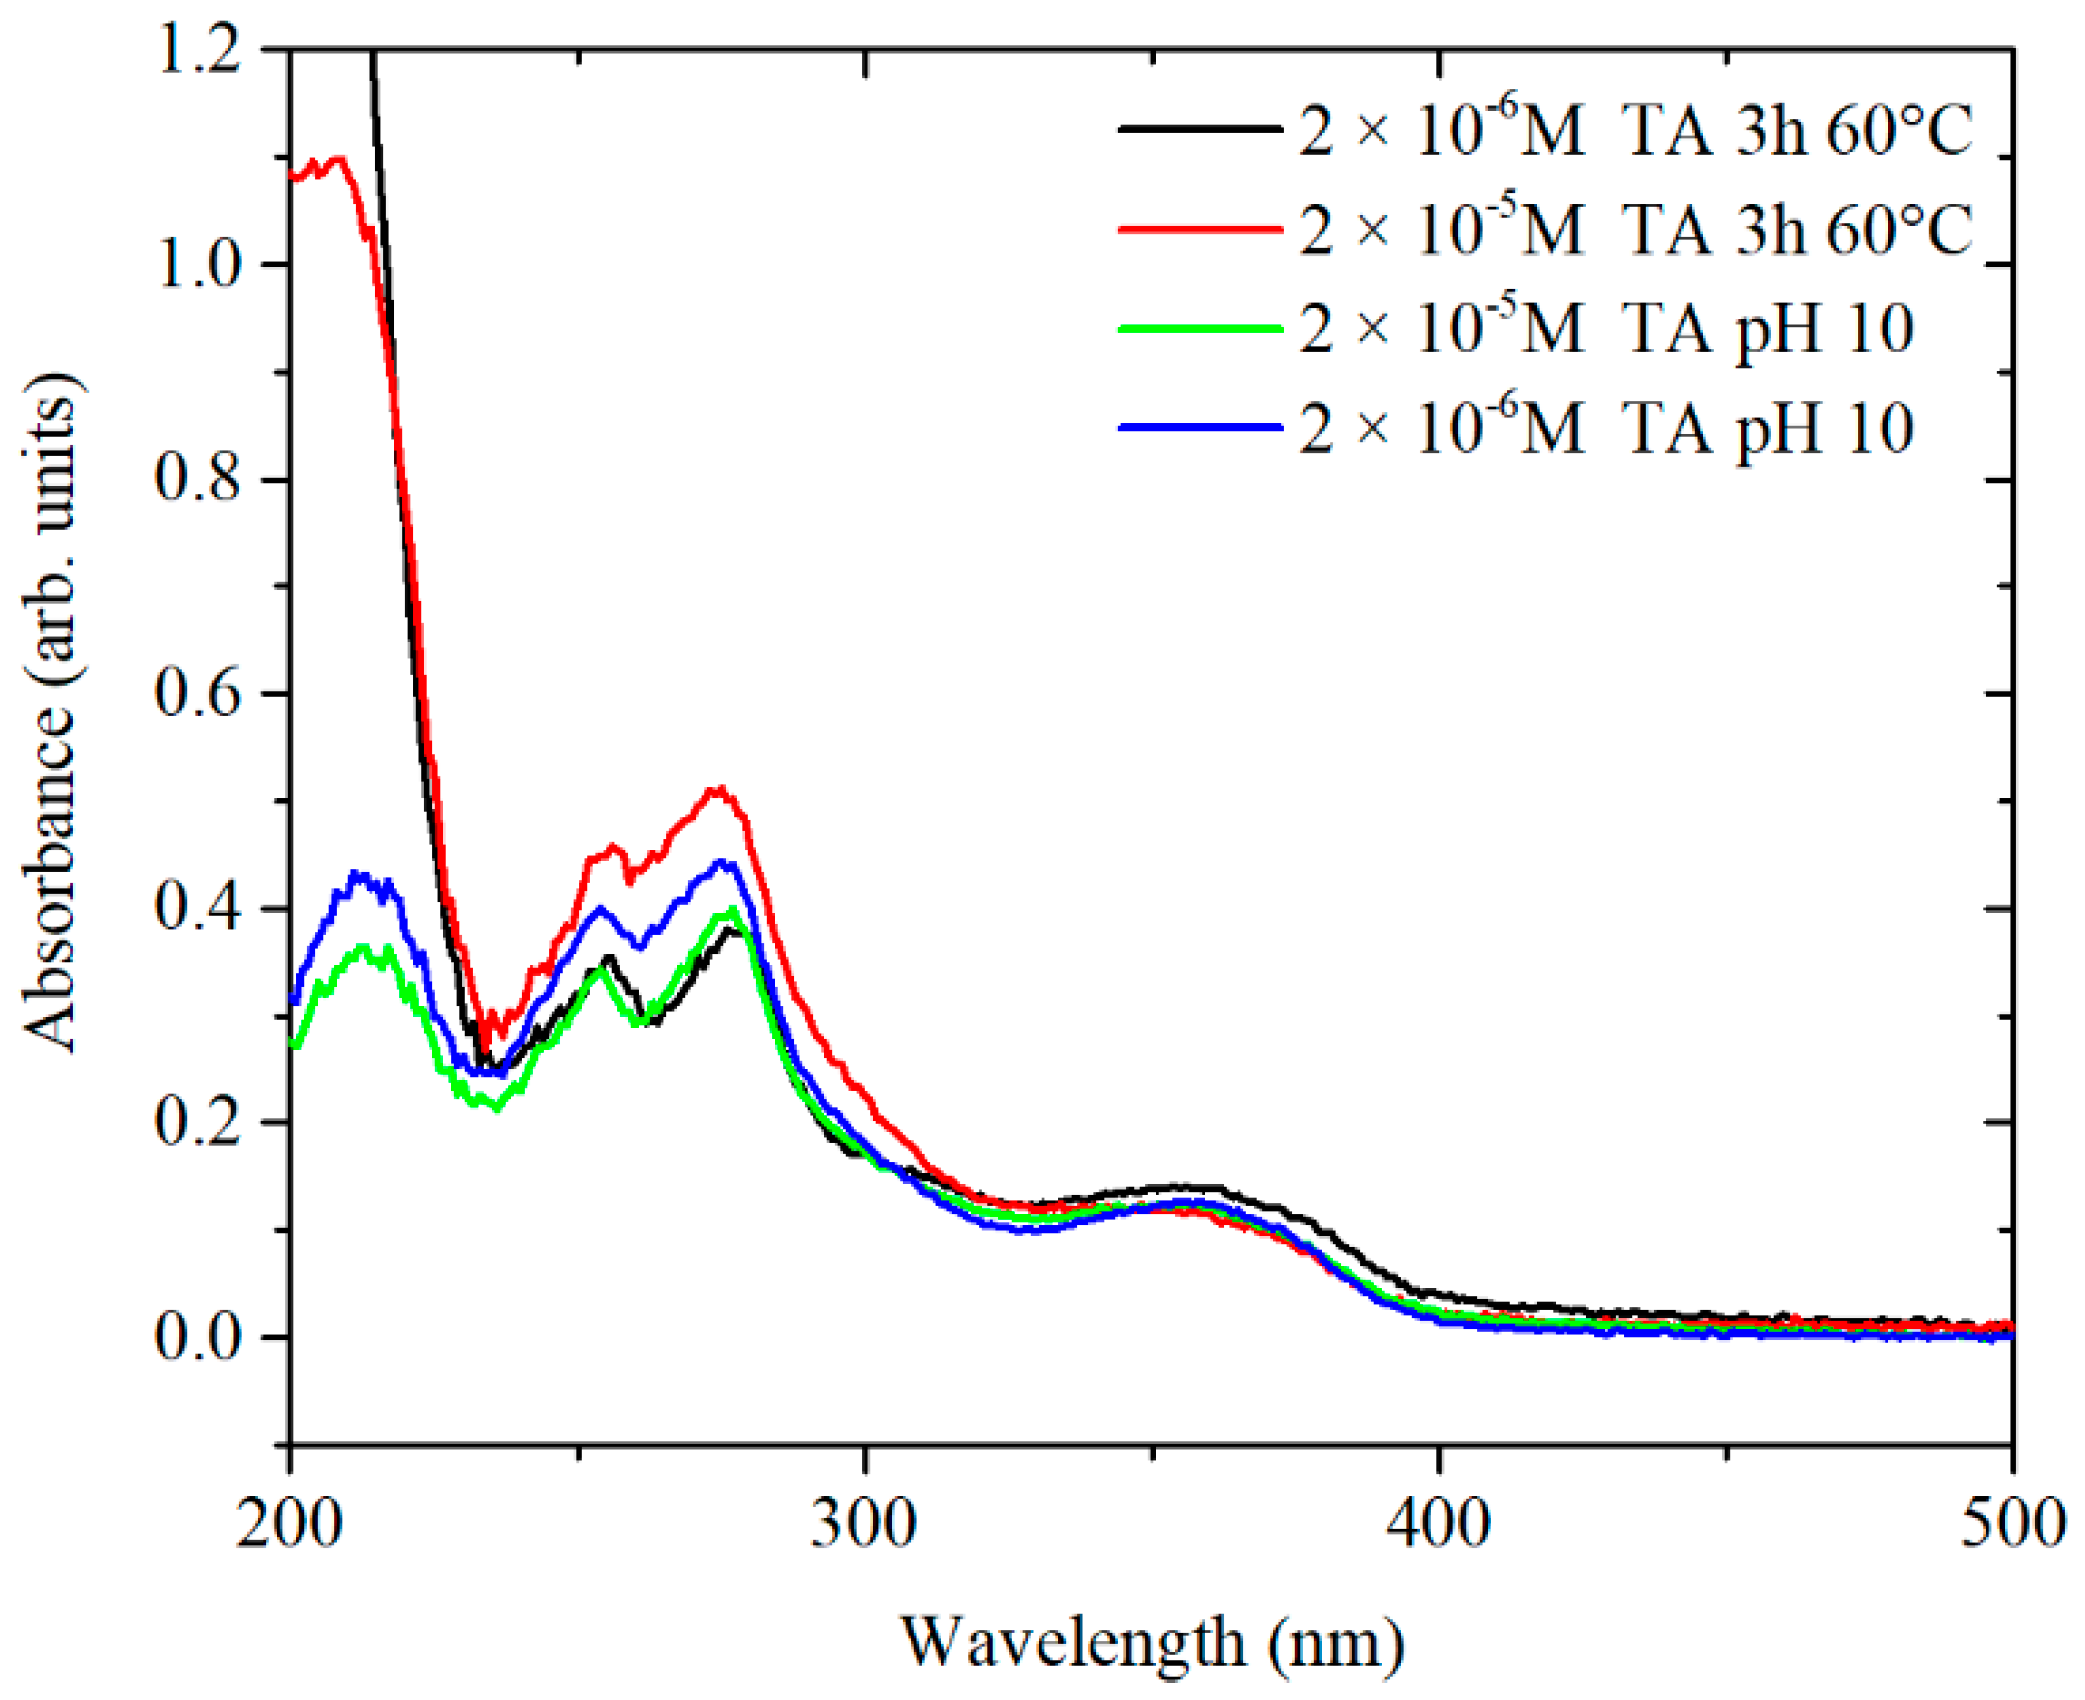
Figure 8B). The presence of three isosbestic points at 238, 289 and 350 nm suggests that at least three different forms of TA, convertible from one to the other, might be present in solution. Overall, the UV-vis spectrum of TA equilibrated at pH 10 for 24 h and the spectrum of TA preconditioned at 60 °C, at pH 7.4 for 3 h are similar. Therefore, it is likely that the same chemical species are formed by treating the TA in both ways, as shown in
Figure 9.
Earlier, the behaviour of TA under thermal treatment in a closed reactor was reported [
15] describing the thermal hydrolysis of TA to Gallic acid (GA) and pyrogallol. Significant amounts of GA were recorded at 150 °C, whereas at 200 °C, the production of pyrogallol reached a maximum. At 60 °C, pyrogallol was not detected and no significant amount of GA was observed either [
15]. In order to test whether in our experimental system any GA was produced by thermal preconditioning of TA, GA was heated up at 60 °C for 0 15, 45, 90 and 180 min in citrate and in PBS (
Figure S11). The UV-vis spectra of GA in citrate and PBS show a peak at 261 nm and a shoulder at 336 nm in which the absorbance increased after 15 min at 60 °C. However, the position of the absorbance peaks for TA and GA are different and confirmed no GA formation as a hydrolysis product of TA. Therefore, the changes of UV-vis spectra in time might be associated with a chemical and/or structural rearrangement inside TA molecules as a combination of pH and heat.
Furthermore, the comparison of the UV-vis spectra for TA at concentrations of 3.3 × 10
−5 M and 3.3 × 10
−4 M show a difference in the kinetics of the chemical and/or structural rearrangement. In detail, the UV-vis spectrum of 3.3 × 10
−5 M TA after 45 min at 60 °C is much more similar to the UV-vis spectrum of TA equilibrated at pH 10. 5 than TA at 3.3 × 10
−4 M. In the latter case, the changes of UV spectra were less pronounced in time and this suggests that more than one mechanism might be involved. The only difference between the two solutions was the concentration of TA, which suggests that rearrangements in TA molecules are time- and concentration-dependent. A possible explanation for this behaviour may come from the polyphenolic structure of TA, which, through hydrogen bonding, may produce stable structures hindering the structural rearrangement of TA [
25]. The behaviour of the TA was explored to understand the effect of pH and the thermal conditioning on the synthesis of AgNPs. The results show that, in diluted condition, 2 × 10
−6 M TA leads to the formation of stabilised quinone derivatives that have a dominant role in the subsequent particles growth. The nature of this change in growth is not fully understood, but a number of possible hypotheses may be taken into consideration to explain the effect of smaller particles and uniformity in size resulting from the thermal preconditioning of TA. A possible hypothesis is that TA molecules form a complex with a portion of Ag
+, leaving silver in two forms: free and bound to TA. In this condition, rapid reaction of free Ag
+ ions form nuclei whereas the subsequent growth of the particles is slower from bound silver, which might lead to a thermodynamic control of the reaction.
Another hypothesis is that the absorption of TA on the silver particle surface leads to blocking of growth and moving toward thermodynamic control.
This statement is in agreement with the data presented in
Figure 5A, where the size of the particles decreases as the time of preconditioning goes from 15 min to 90 min. In addition,
Figure 7A shows increased formation of stabilised quinone derivatives after 45 min, which correspond to a drastic decrease in the size and polydispersivity of AgNPs (
Figure 5A). A different mechanism might lead the formation of AgNPs at the concentration of 2 × 10
−5 M TA. At this concentration, TA is strongly affected by the heat and preconditioning time after 180 min (
Figure 7B), and only in that situation, AgNPs presented strong size dependence (
Figure S6). In this case, TA is in neutral form until 45 min of preconditioning time (
Figure 7B) and no major difference can be observed in the size of AgNPs. These data suggest that the main role of TA in the synthesis of AgNPs is the reduction of Ag
+ by TA. In this case, the combination of citrate and TA increase the nucleation of AgNPs leading to an average TEM size of 24–25 nm. After 180 min of preconditioning, the mechanism of nucleation change and the presence of stabilised quinone derivated might influence the formation of seeds and the growth of the AgNPs, giving an average TEM size of 19 nm.
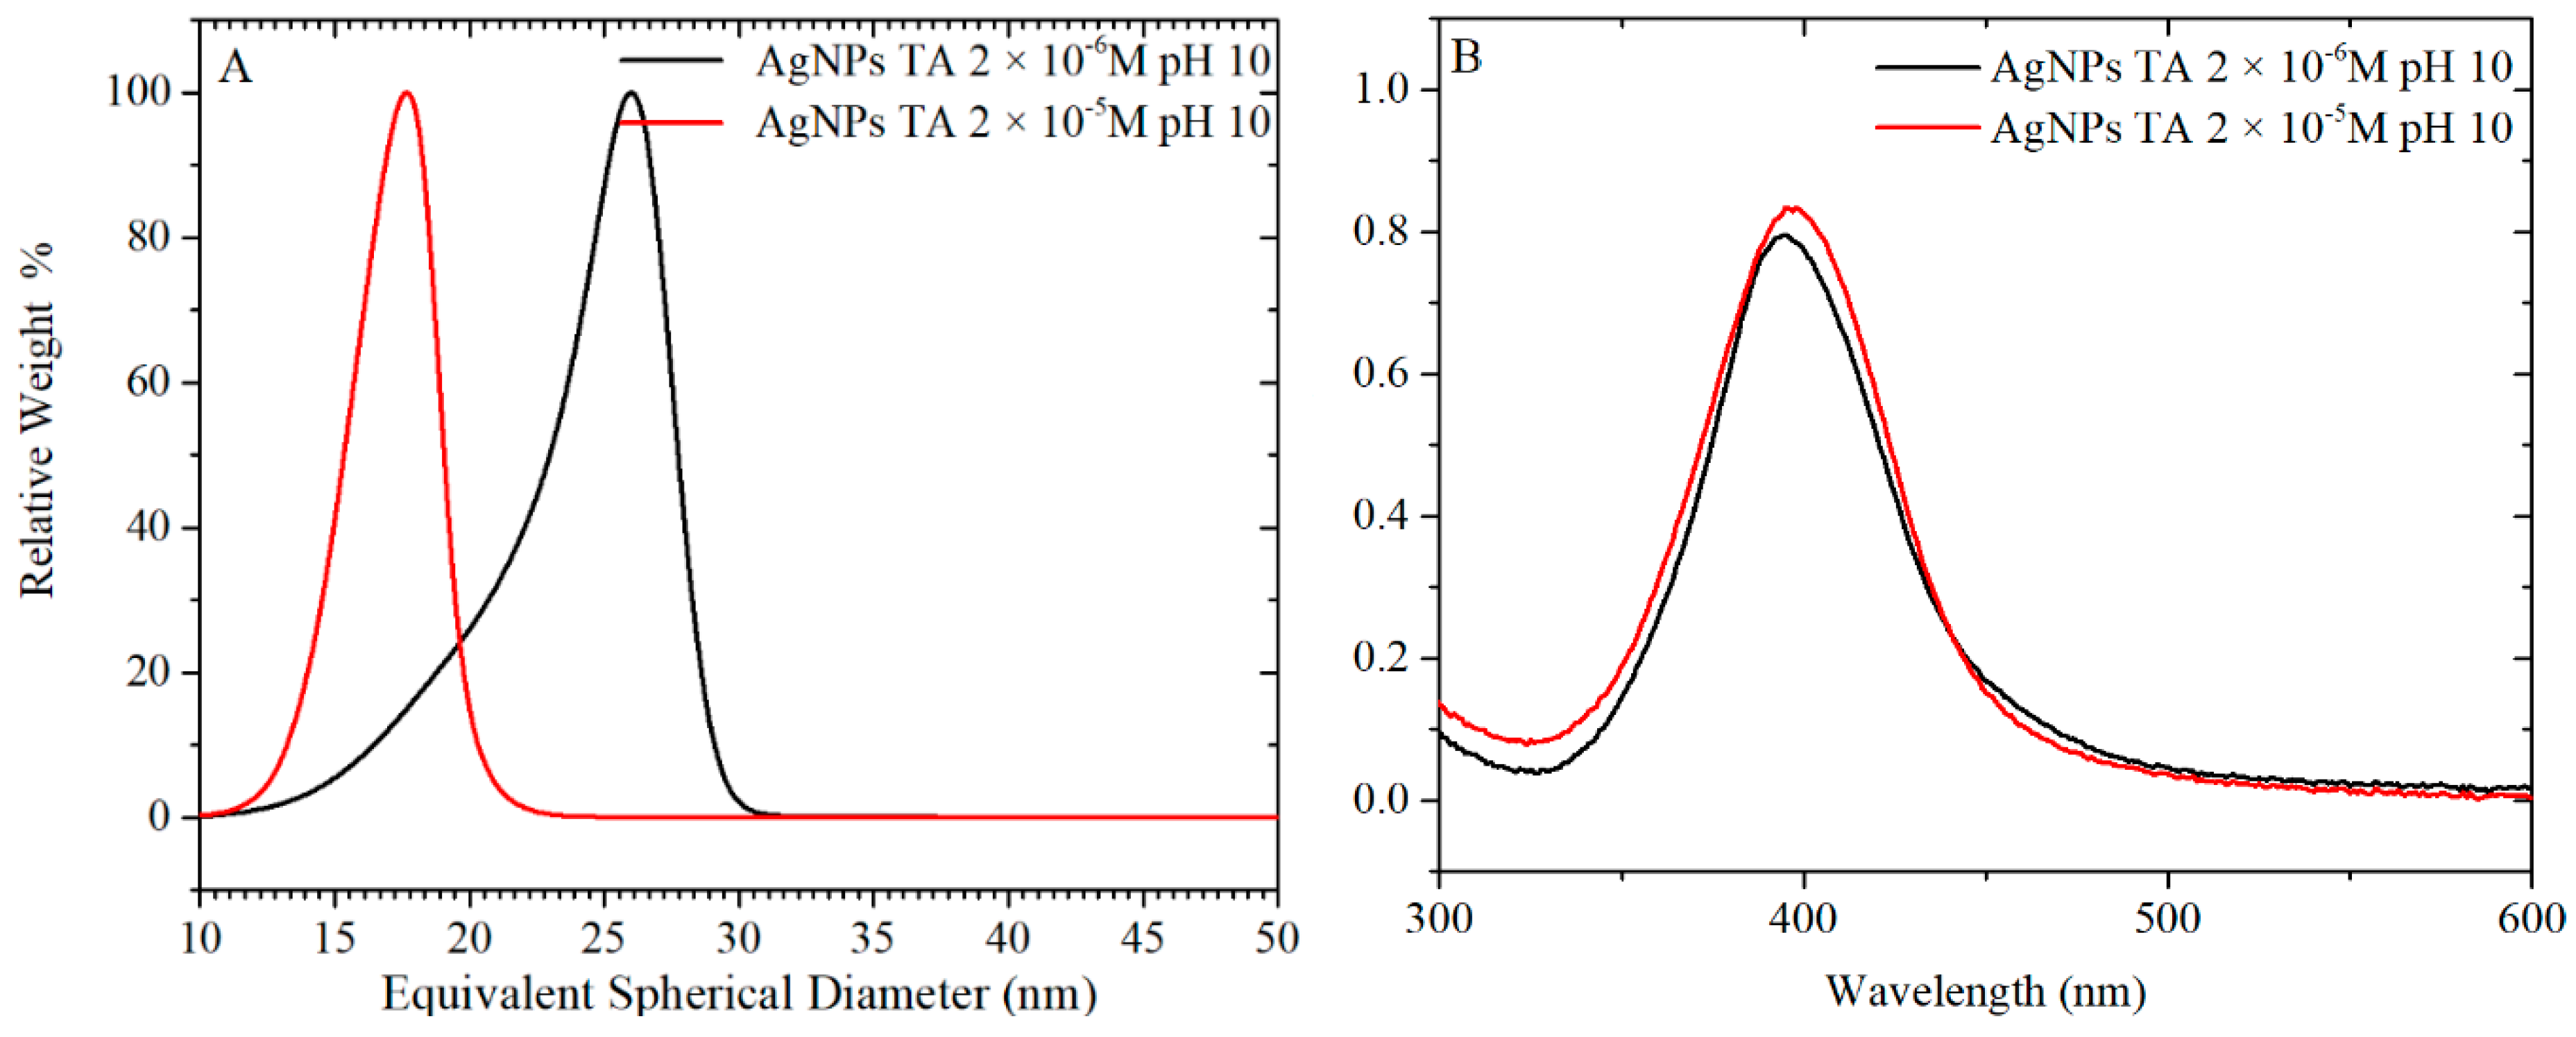
3.4. Synthesis of AgNPs by pH Preconditioning of TA
For the synthesis of AgNPs, 40 and 400 µM of TA were equilibrated at pH 10 overnight. The TA solution was mixed with a concentrated solution of citrate and then, immediately added to the boiling solution of AgNO
3. The final concentrations of TA in the AgNPs suspension were, as in the previous case, 2 × 10
−6 and 2 × 10
−5 M. The UV-vis spectra and TEM images of particles formed using these TA solutions are plotted in
Figure 10 and
Figure 11, respectively, while a more complete summary of the AgNPs characterisation is reported in
Table S4 and Figure S12. The results show that AgNPs of similar size and size distribution are obtained either by thermal preconditioning or by pH preconditioning of TA at pH 10. In particular, 2 × 10
−6 TA produces particles of 17 ± 5 nm D
TEM by thermal preconditioning and 21 ± 6 nm D
TEM by pH preconditioning, whereas 2 × 10
−5 TA produces particles of 19 ± 3 nm D
TEM thermal preconditioning and 19 ± 3 nm D
TEM by pH preconditioning. These results support the theory that the same chemical rearrangement of the TA can be obtained by two different experimental routes: treating the TA at 60 °C or equilibrating it at pH 10.
Overall, the use of a thermal rather than a pH-based preconditioning step has been shown to be an effective means to better control the size and polydispersivity of the final product. These results show that the presence of TA in the quinone derivated form is obtained in basic pH and preconditioning time at 60 °C. In addition, the TA in the quinone derivated might influence the formation of seeds and the growth of AgNPs.

 ,
, 


