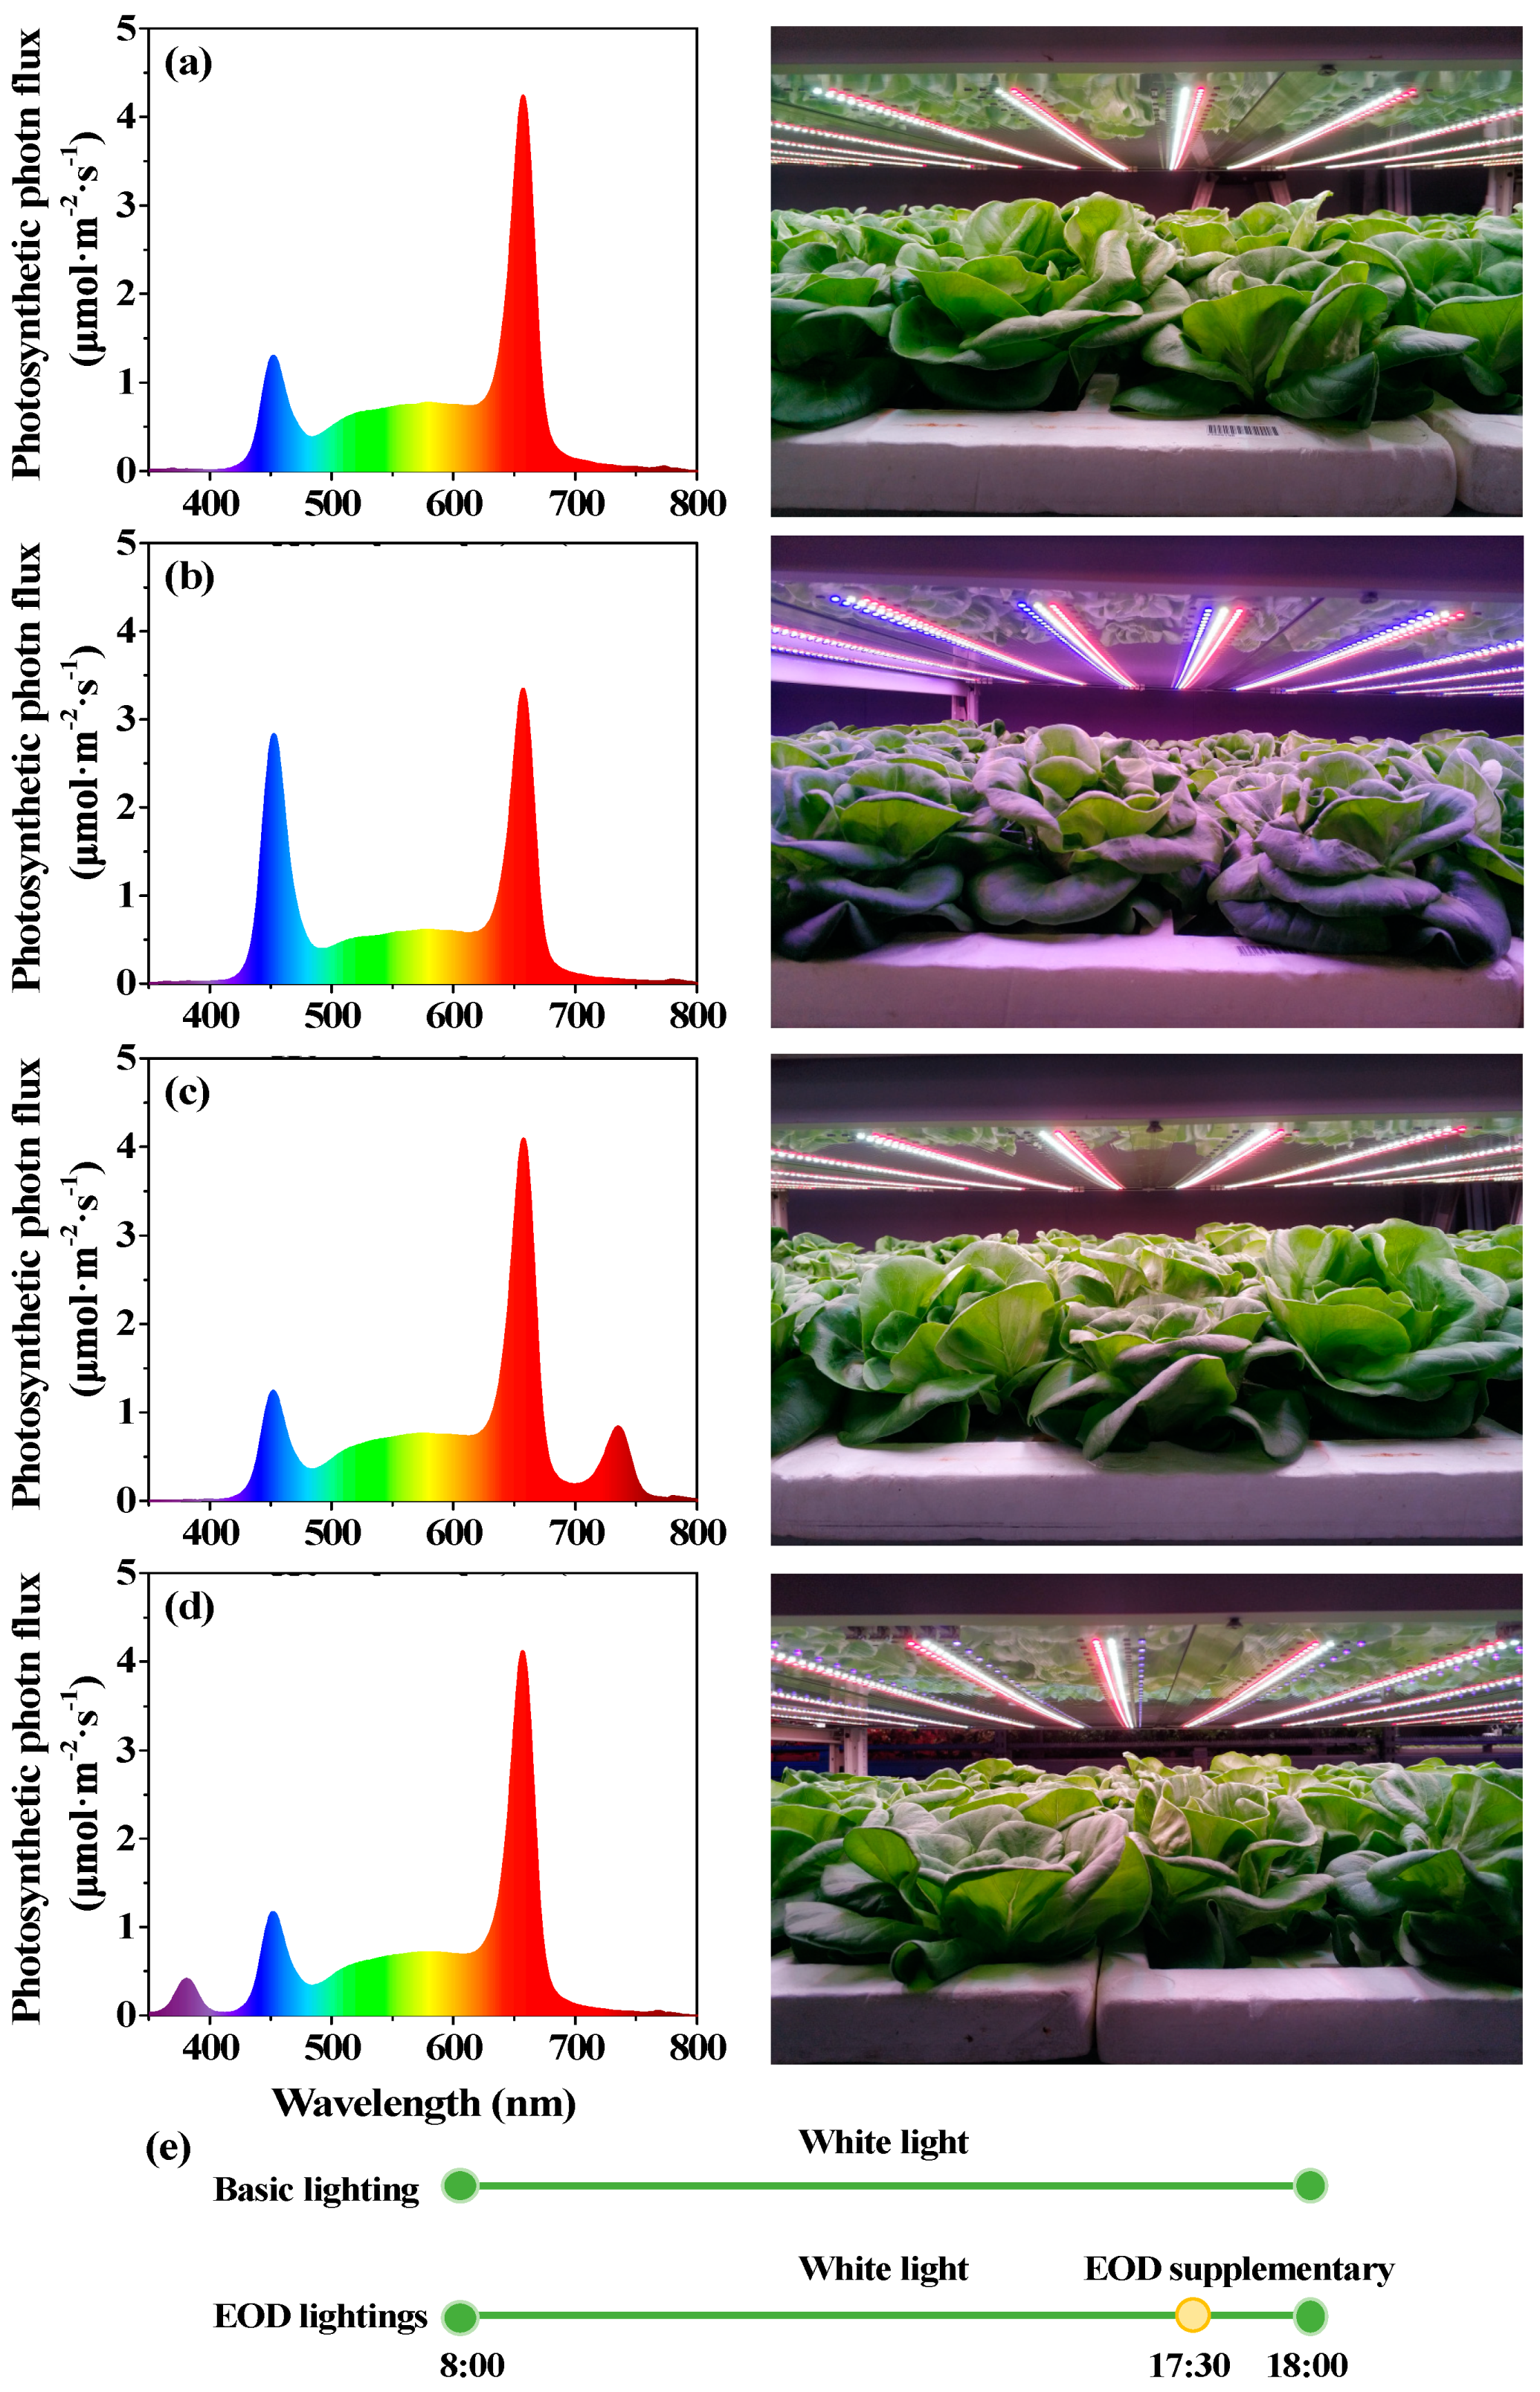
Figure 1.
The spectrograms delivered by LEDs. Spectral distributions of (a) day-white light (W), (b) end-of-day enhanced blue light (EOD-B), (c) end-of-day far-red light (EOD-FR), and (d) end-of-day ultraviolet-A light (EOD-UV); (e) Patterns of end-of-day lighting treatments.
Figure 1.
The spectrograms delivered by LEDs. Spectral distributions of (a) day-white light (W), (b) end-of-day enhanced blue light (EOD-B), (c) end-of-day far-red light (EOD-FR), and (d) end-of-day ultraviolet-A light (EOD-UV); (e) Patterns of end-of-day lighting treatments.
Figure 2.
Lettuce morphology 24 days after treatments. (a) ‘Red butter’ and (b) ‘Green butter’ grown under different lighting treatments. W= day-white light, EOD-B = end-of-day enhanced blue light, EOD-FR = end-of-day far-red light, EOD-UV = end-of-day ultraviolet-A light.
Figure 2.
Lettuce morphology 24 days after treatments. (a) ‘Red butter’ and (b) ‘Green butter’ grown under different lighting treatments. W= day-white light, EOD-B = end-of-day enhanced blue light, EOD-FR = end-of-day far-red light, EOD-UV = end-of-day ultraviolet-A light.
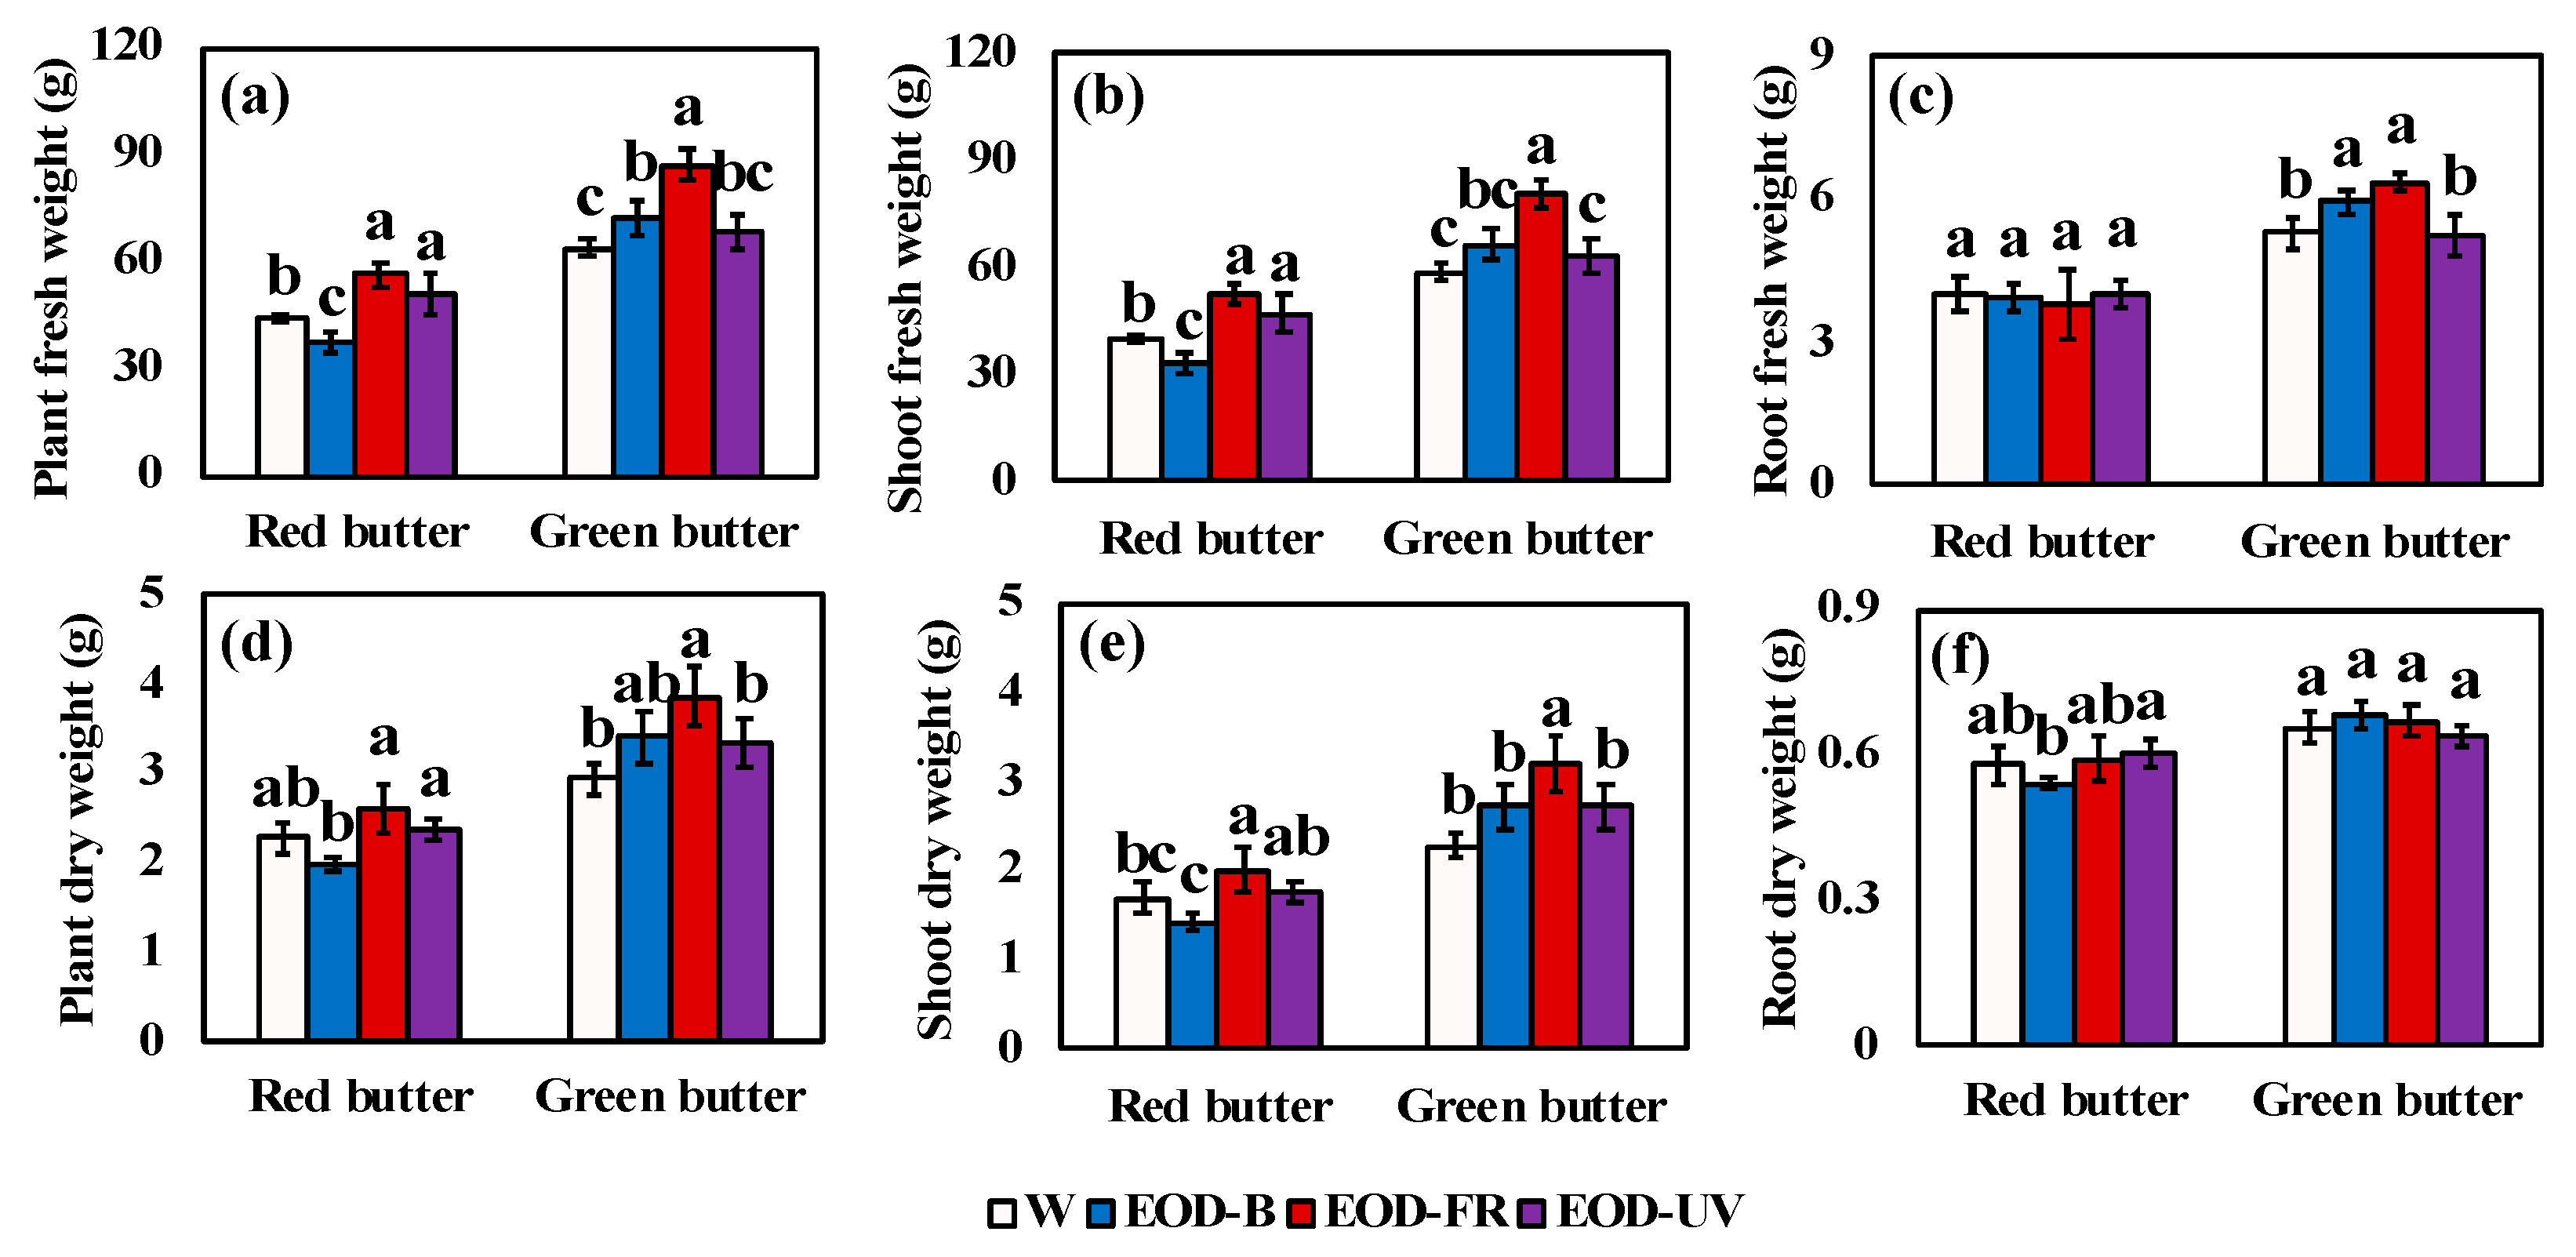
Figure 3.
Biomass of lettuce under different end-of-day lightings. Fresh weight of plant (a), shoot (b), and root (c). Dry weight of plant (d), shoot (e), and root (f). Different letters on the top of the columns indicate significant differences at p < 0.05 according to one-way ANOVA, Tukey’s honestly significant difference tests. W= day-white light, EOD-B = end-of-day enhanced blue light, EOD-FR = end-of-day far-red light, EOD-UV = end-of-day ultraviolet-A light.
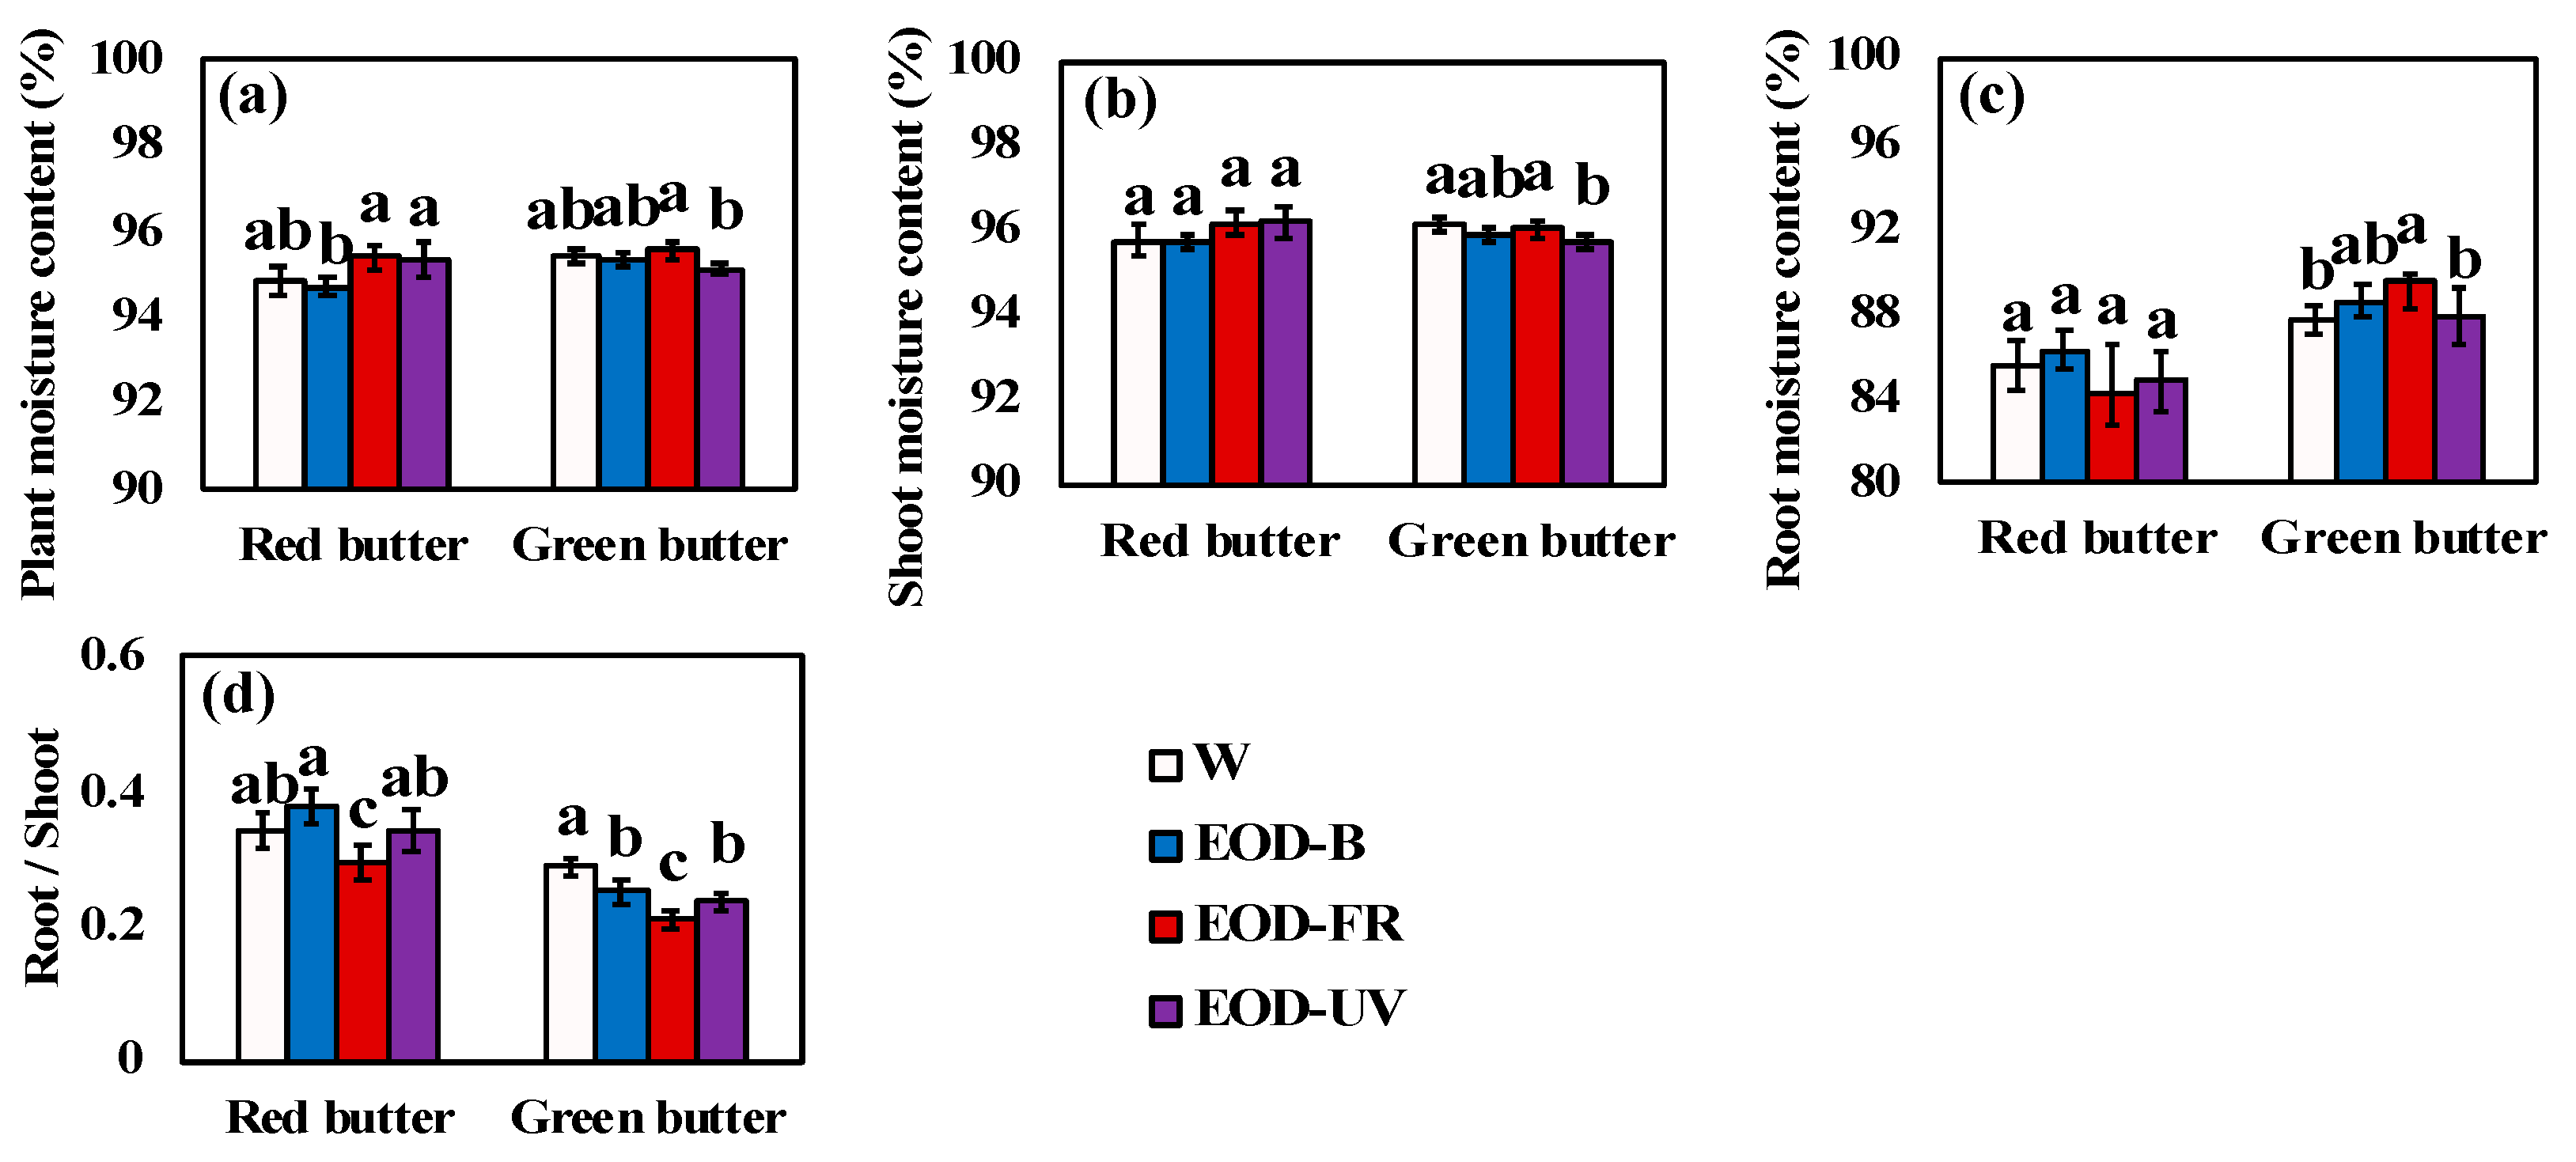
Figure 4.
Moisture content and root–shoot ratio of lettuce under different end-of-day lightings. Moisture content of plant (a), shoot (b) and root (c). (d) was the root–shoot ratio. Different letters on the top of the columns indicate significant differences at p < 0.05 according to one-way ANOVA, Tukey’s honest significant difference tests. W= day-white light, EOD-B = end-of-day enhanced blue light, EOD-FR = end-of-day far-red light, EOD-UV = end-of-day ultraviolet-A light.
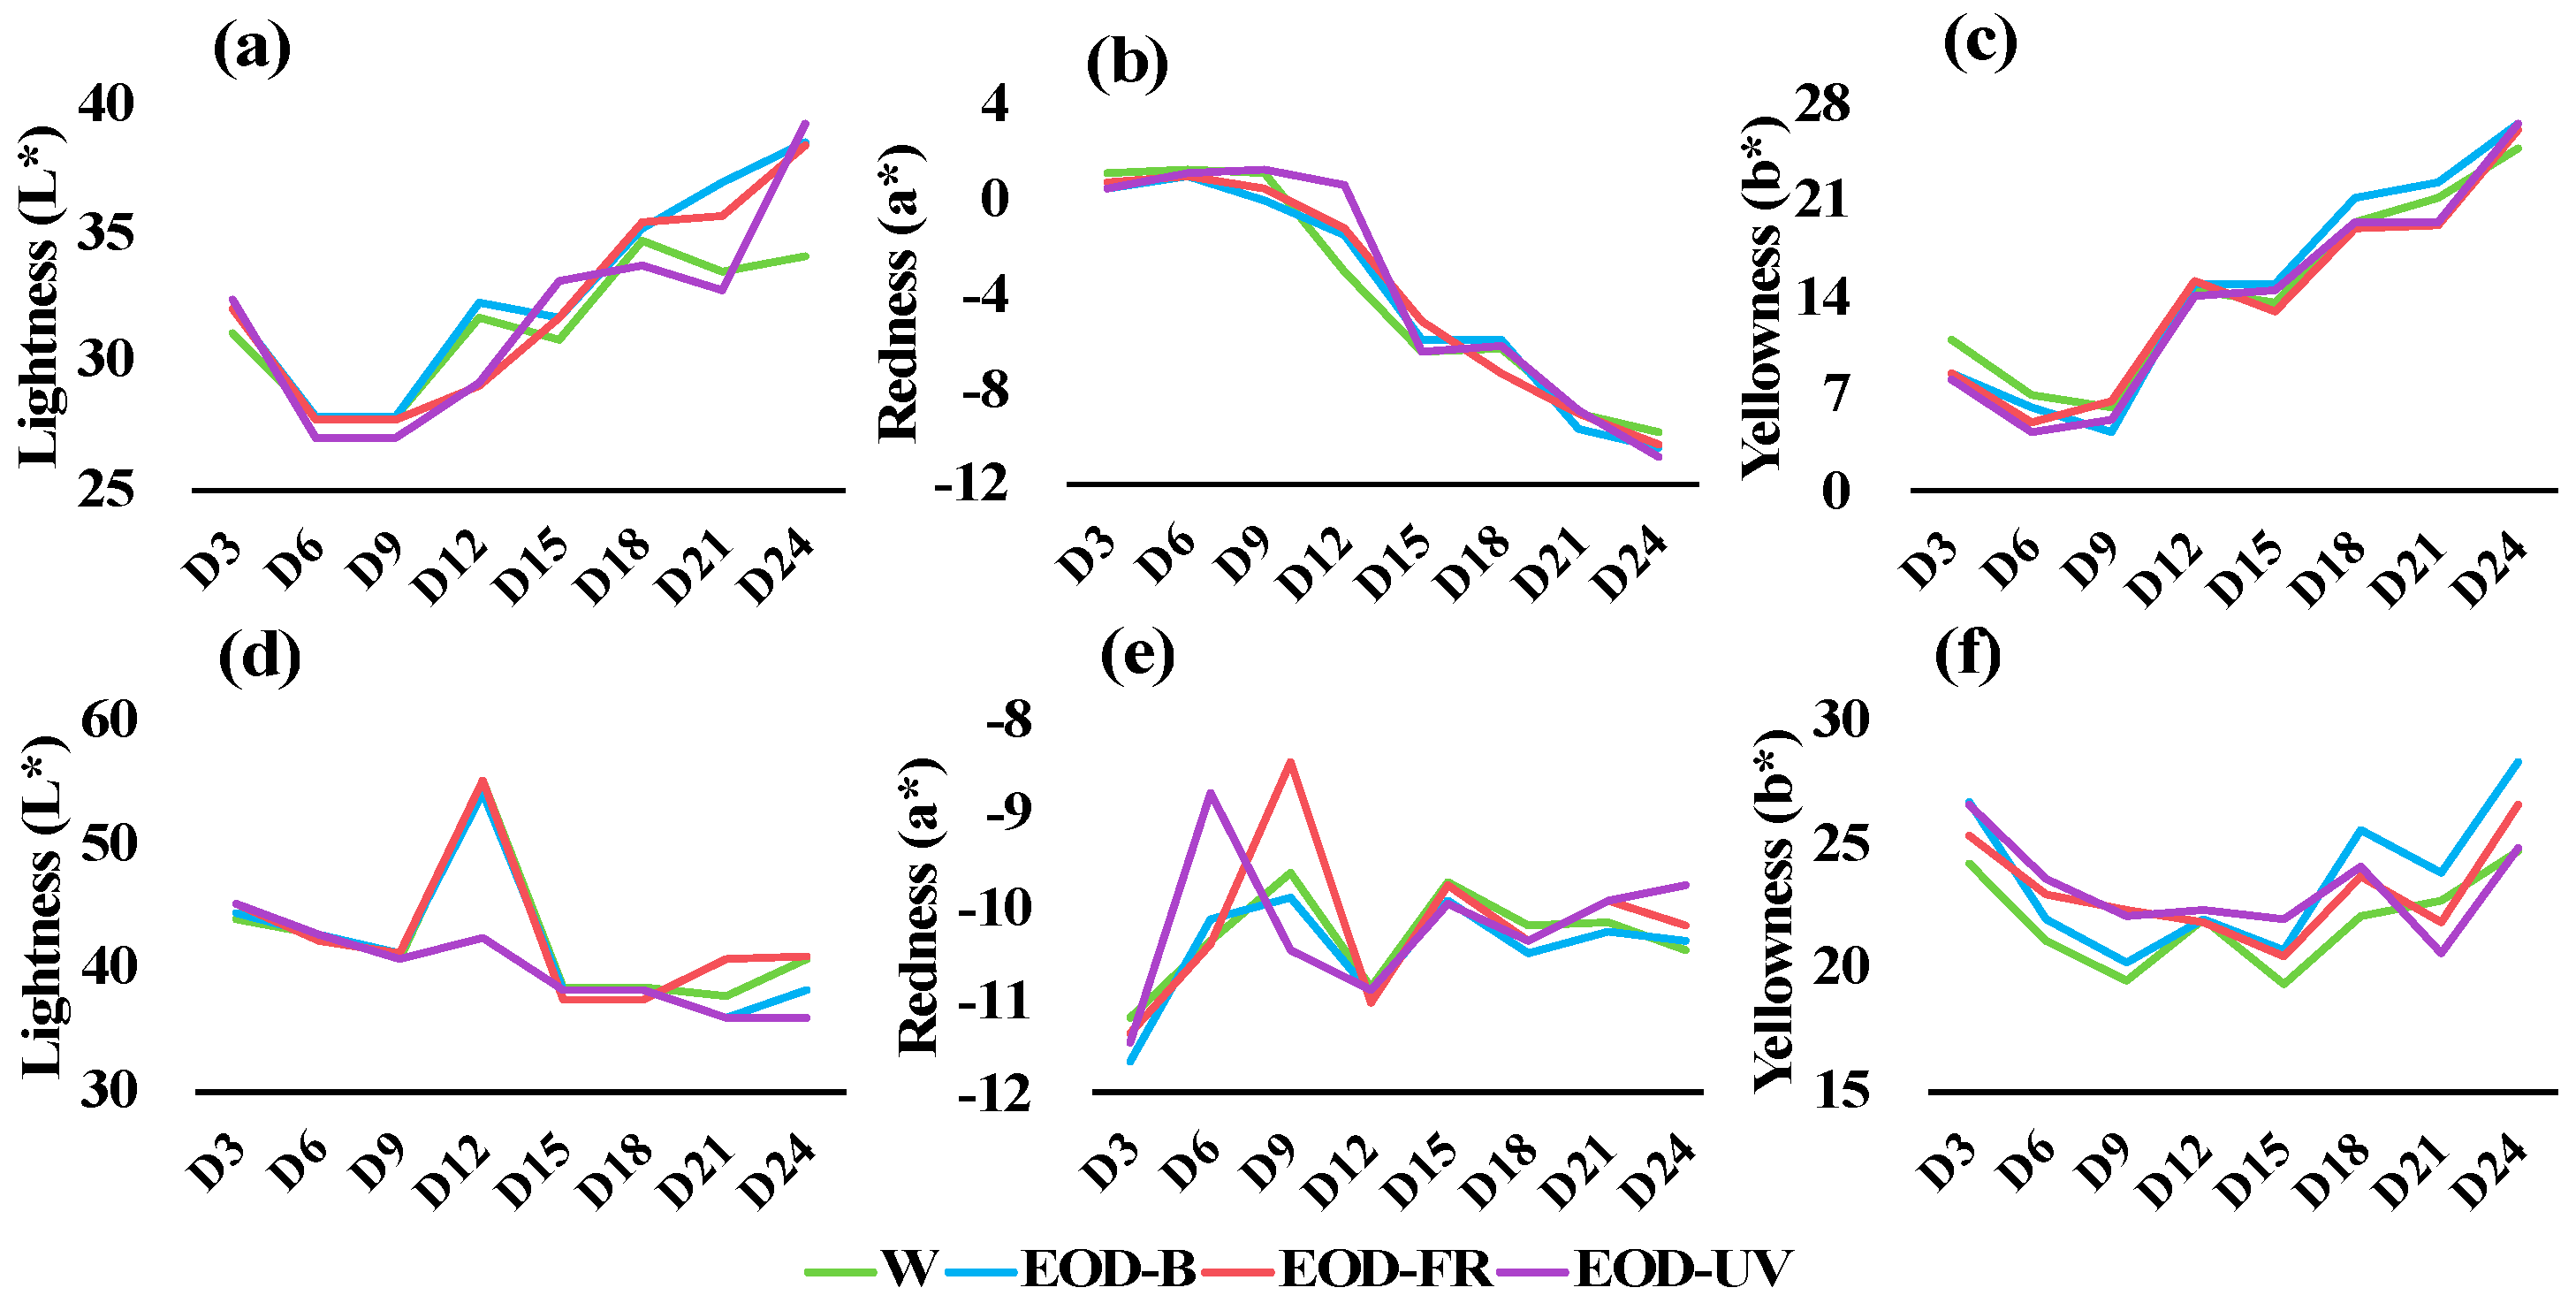
Figure 5.
Leaf color transformation of lettuce 3 to 24 days after treatments. (a–c) were color parameters of ‘Red butter’ lettuce. (d–f) were color parameters of ‘Green butter’ lettuce. W= day-white light, EOD-B = end-of-day enhanced blue light, EOD-FR = end-of-day far-red light, EOD-UV = end-of-day ultraviolet-A light.
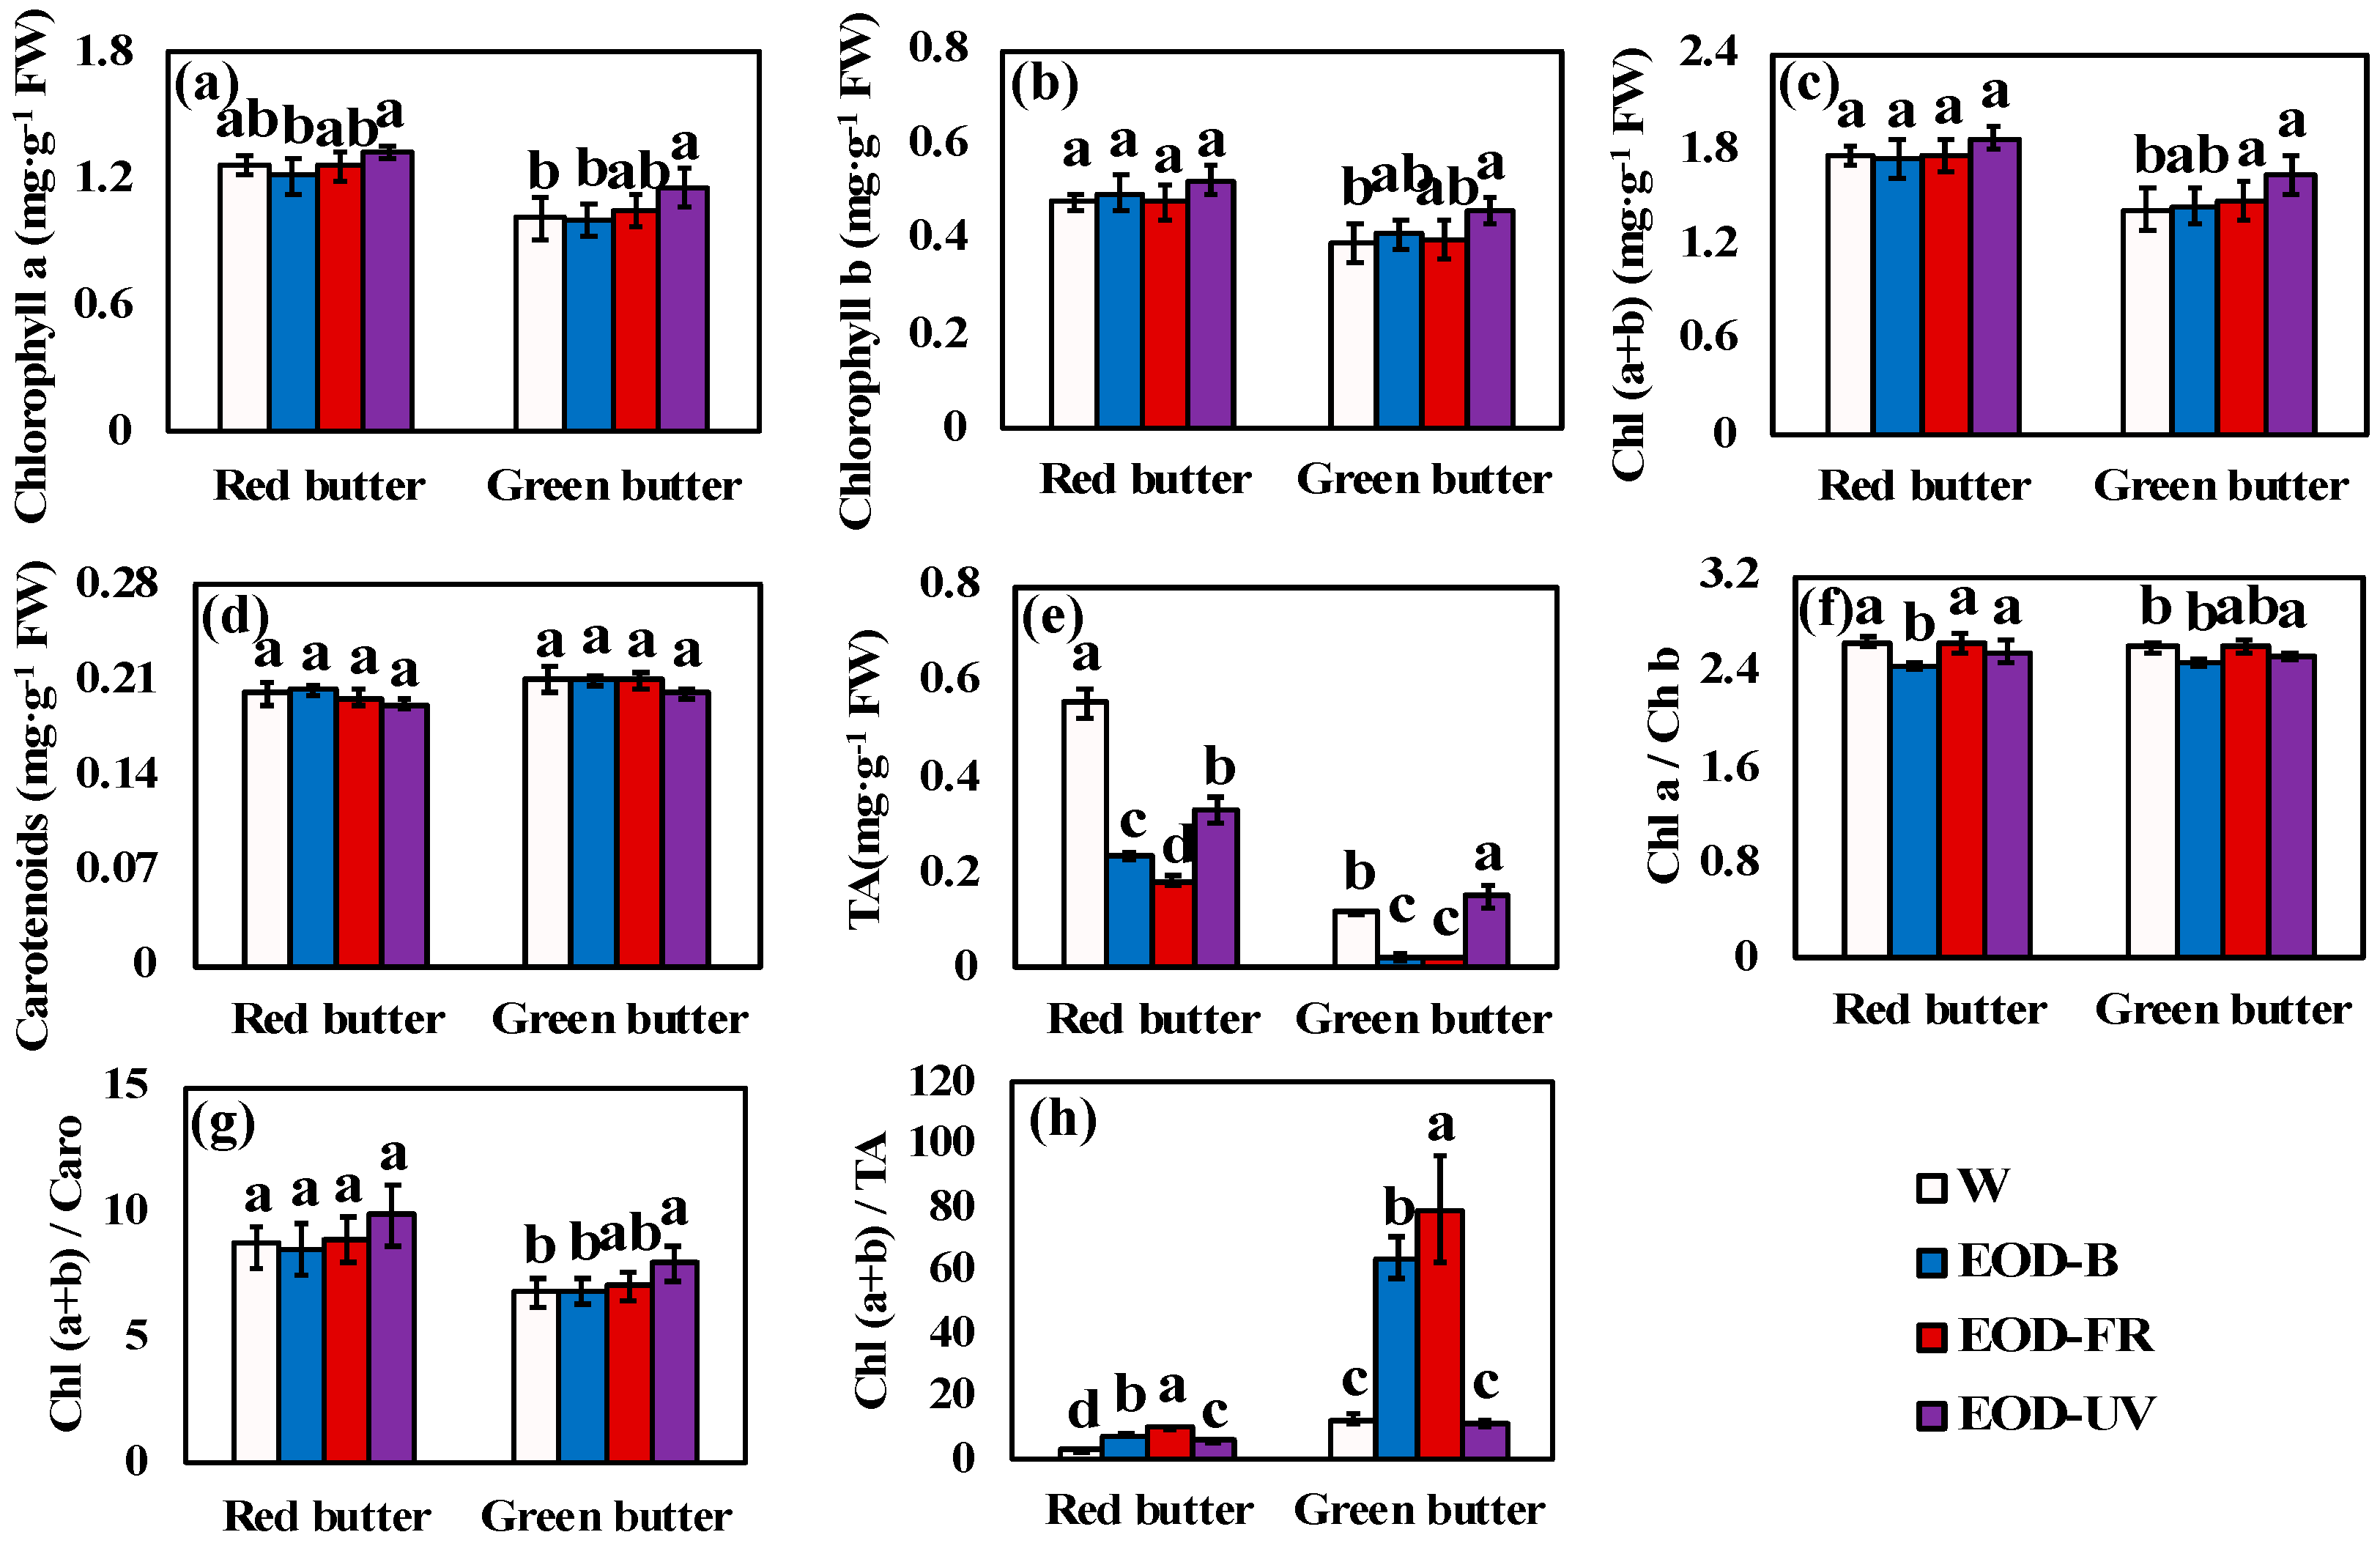
Figure 6.
Pigment contents of lettuce under different end-of-day lightings. (a–e) were the pigment contents of lettuce. (f–h) were the pigment ratio. Different letters on the top of the columns indicate significant differences at p < 0.05 according to one-way ANOVA, Tukey’s honest significant difference tests. W= day-white light, EOD-B = end-of-day enhanced blue light, EOD-FR = end-of-day far-red light, EOD-UV = end-of-day ultraviolet-A light. FW = fresh weight, Chl = chlorophyll, TA = total anthocyanins, Caro = carotenoids.
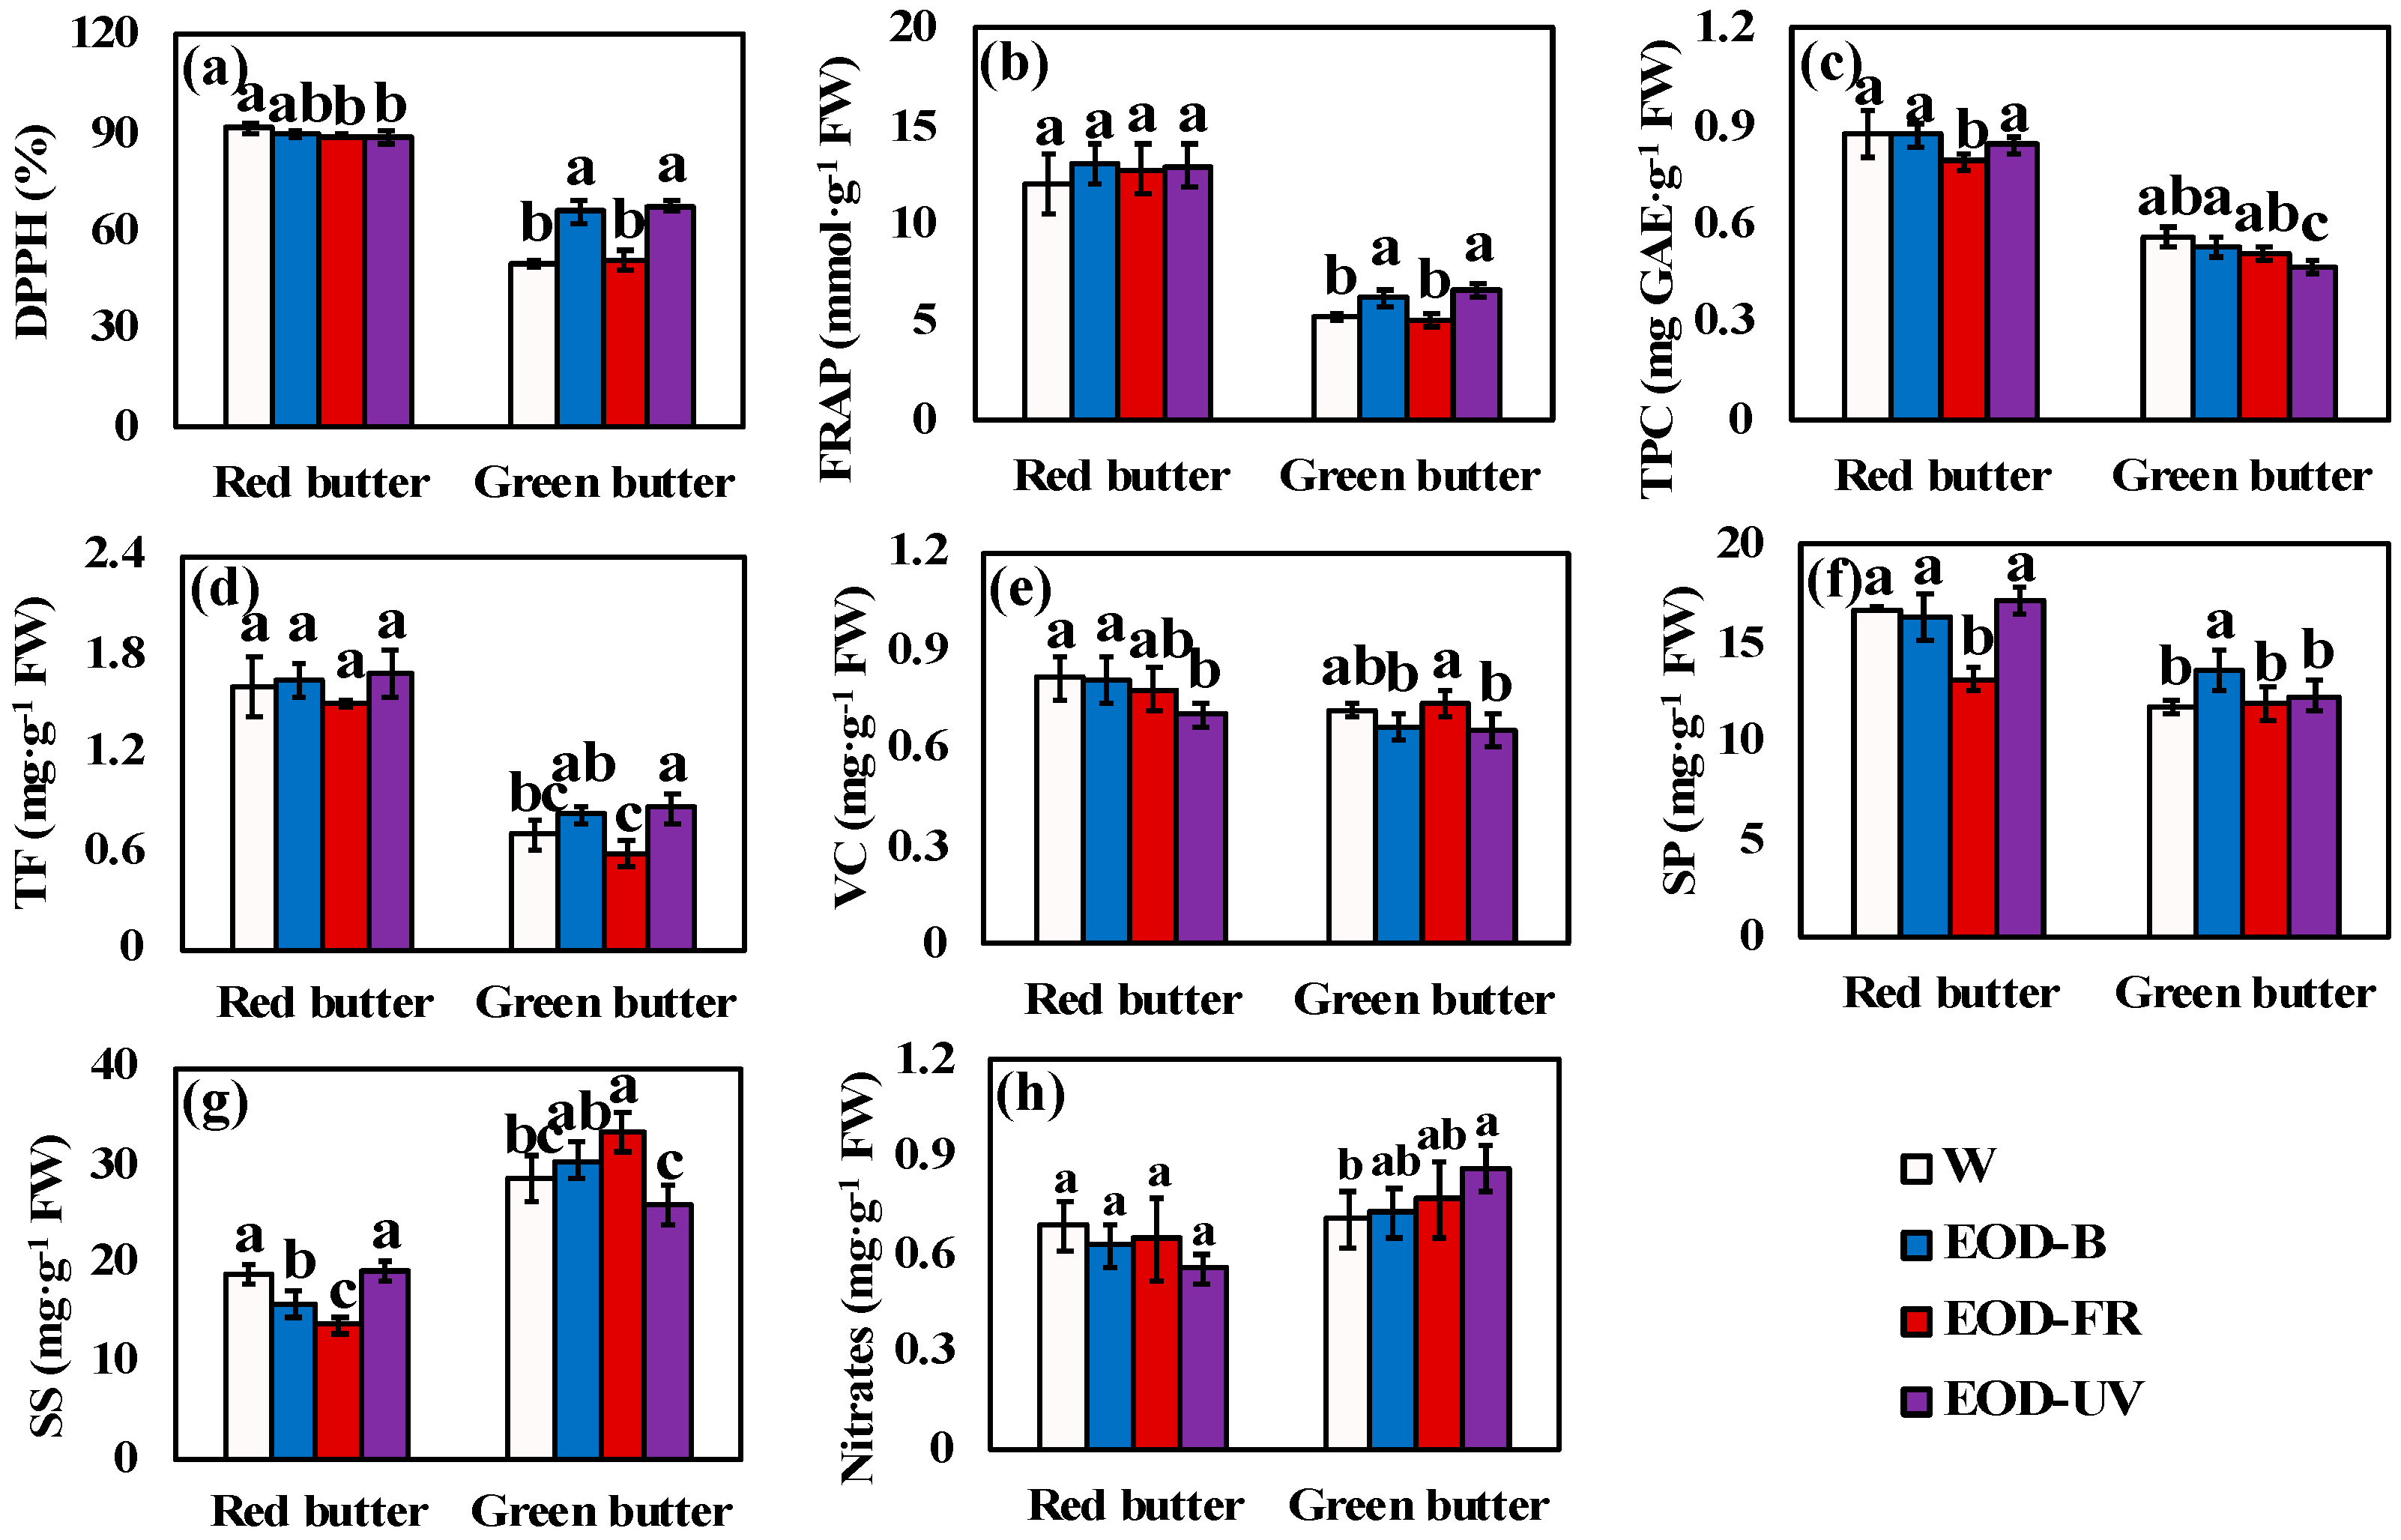
Figure 7.
Phytochemical contents of lettuce under different end-of-day lightings. (a–e) were the contents of antioxidant compounds. (f–h) were the contents of nutrient compounds. Different letters on the top of the columns indicate significant differences at p < 0.05 according to one-way ANOVA, Tukey’s honest significant difference tests. W= day-white light, EOD-B = end-of-day enhanced blue light, EOD-FR = end-of-day far-red light, EOD-UV = end-of-day ultraviolet-A light. FW = fresh weight, DPPH = DPPH radical inhibition percentage, FRAP = ferric ion reducing antioxidant power, TPC = total phenolic compounds, TF = total flavonoids, VC = vitamin C, SP = soluble proteins, SS = soluble sugars.
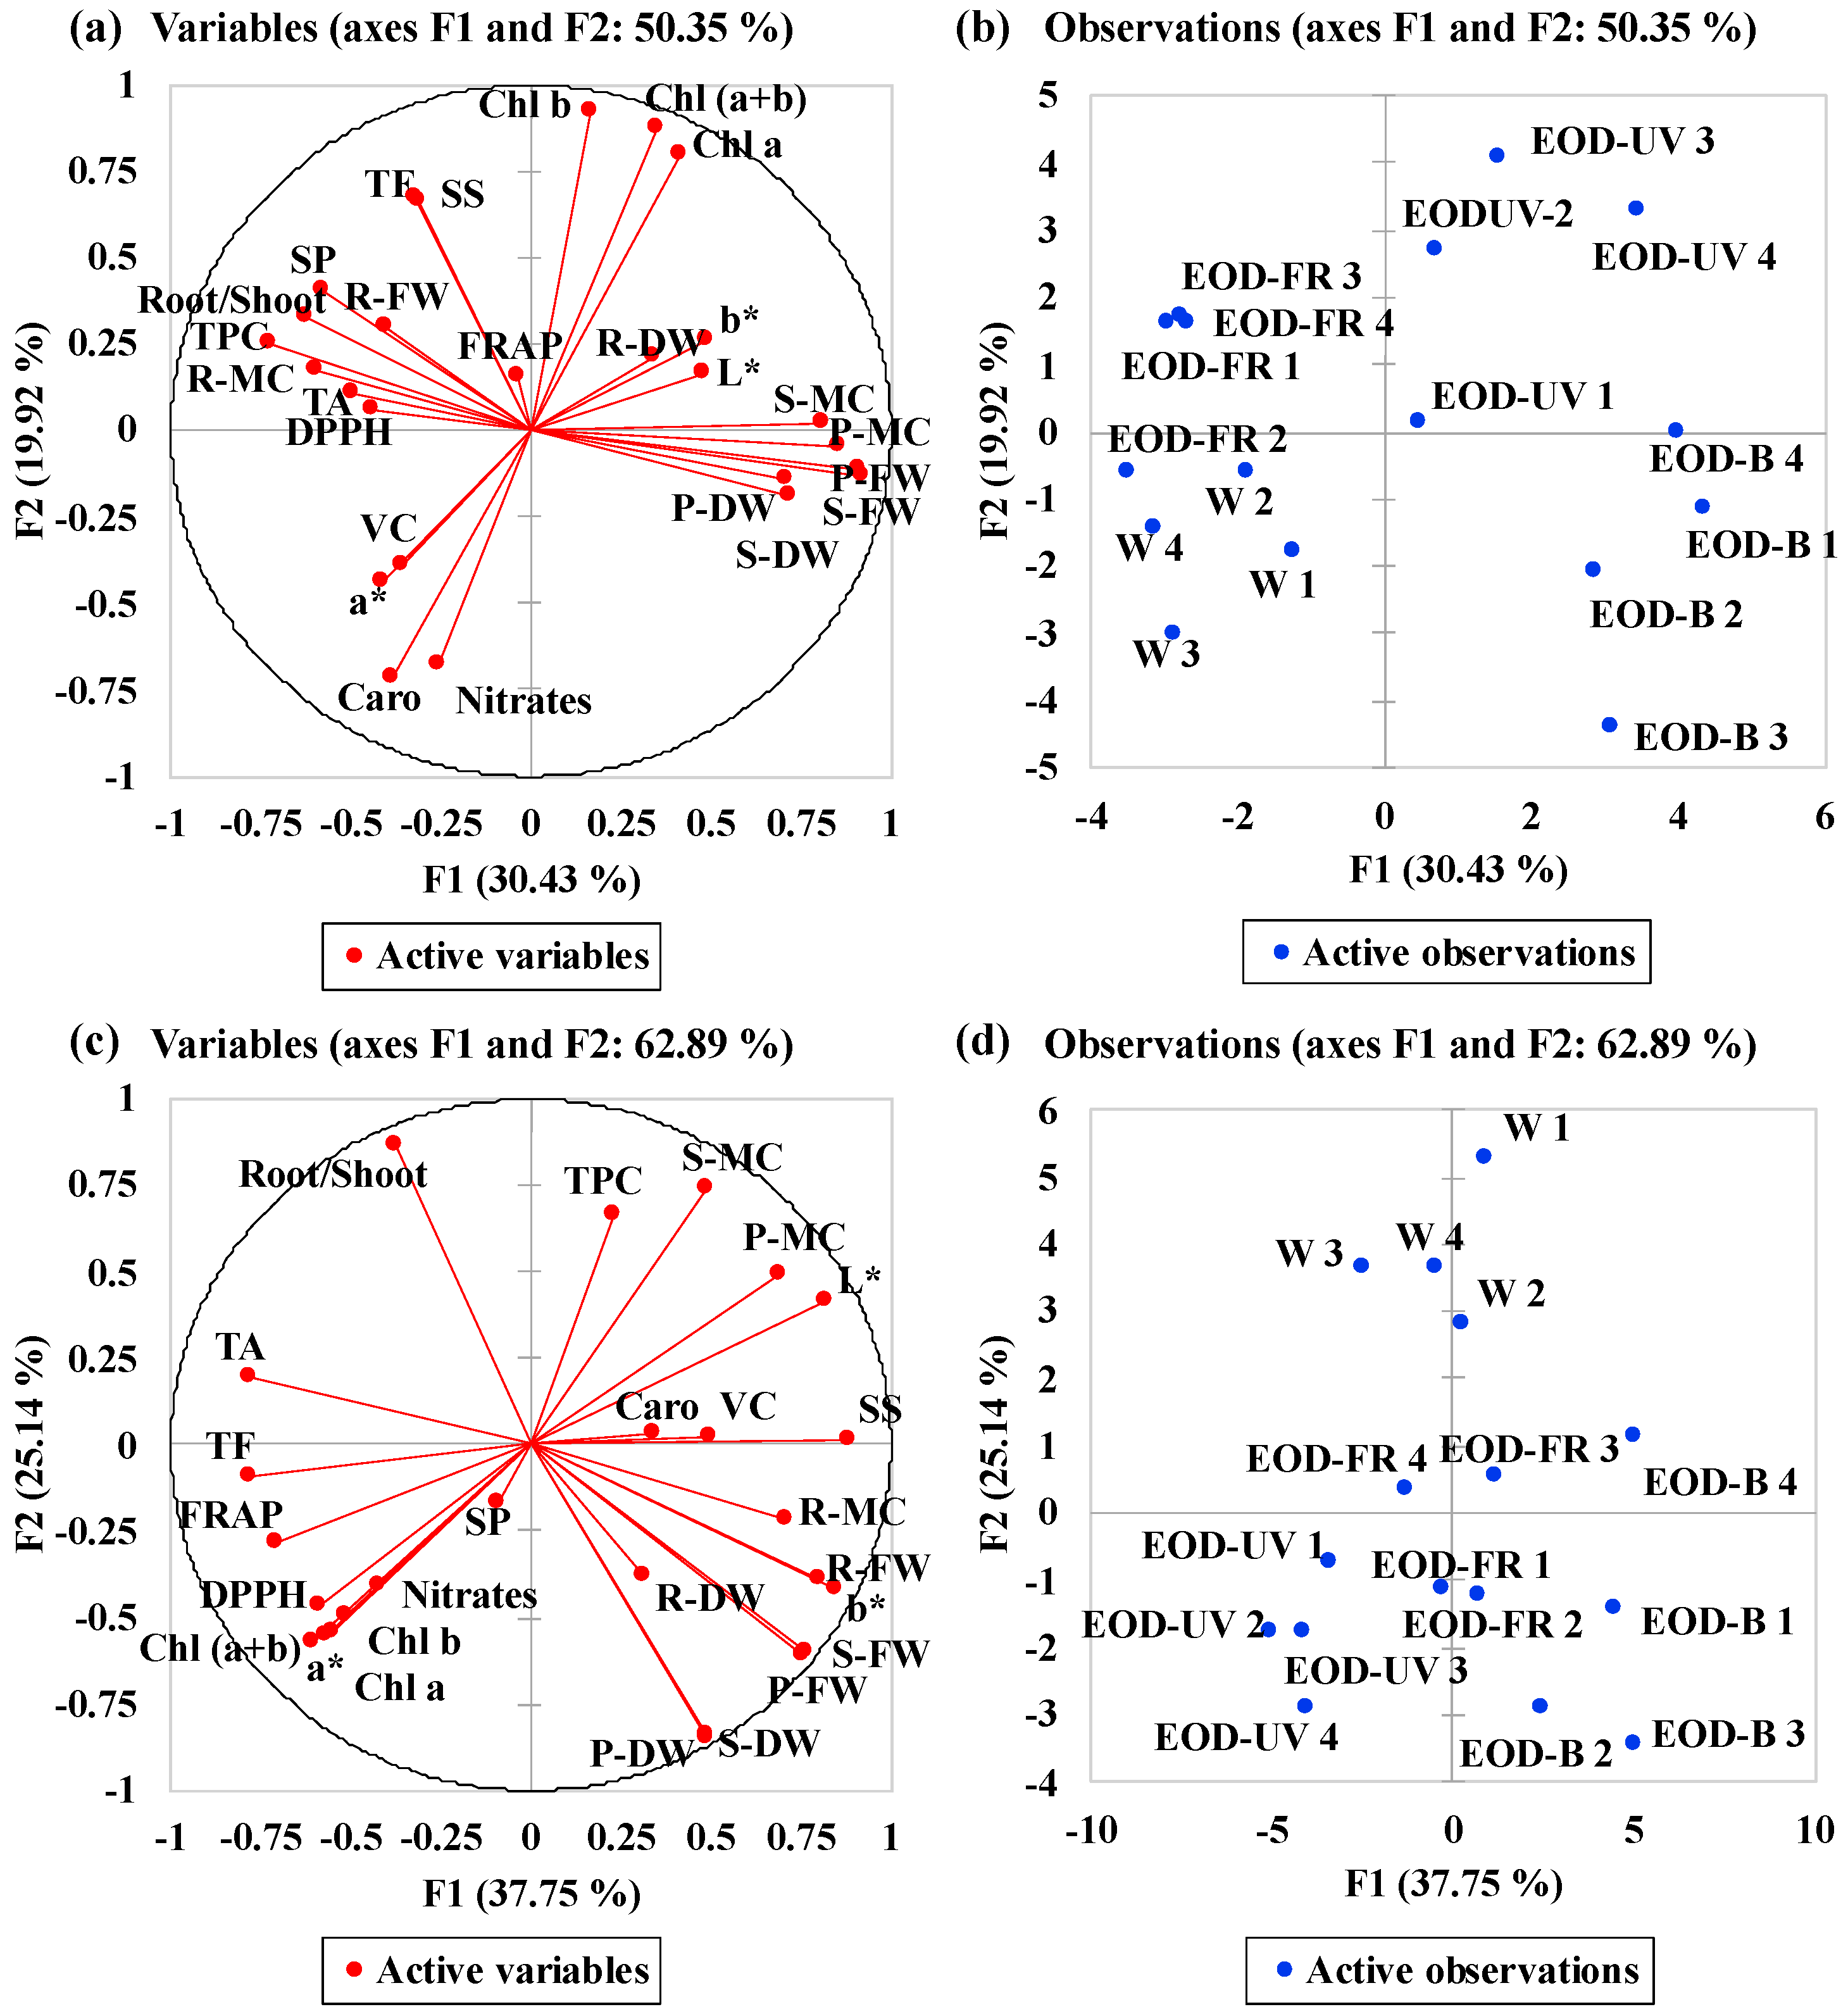
Figure 8.
Multivariate principal component analysis showing the effects of end-of-day lightings on lettuce. (a) Correlation circle of ‘Red butter’ and (c) correlation circle of ‘Green butter’, summarizing indices relations between investigated parameters under different lighting treatments. (b) PCA scatter plot of ‘Red butter’ and (d) PCA scatter plot of ‘Green butter’, indicating distinct responses in lettuce under different lighting treatments. W= day-white light, EOD-B = end-of-day enhanced blue light, EOD-FR = end-of-day far-red light, EOD-UV = end-of-day ultraviolet-A light. FW = fresh weight, DW = dry weight, MC = moisture content, P- = plant-, S- = shoot-, R- = root-. Chl = chlorophyll, TA = total anthocyanins, Caro = carotenoids. DPPH = DPPH radical inhibition percentage, FRAP = ferric ion reducing antioxidant power, TPC = total phenolic compounds, TF = total flavonoids, VC = vitamin C, SP = soluble proteins, SS = soluble sugars.
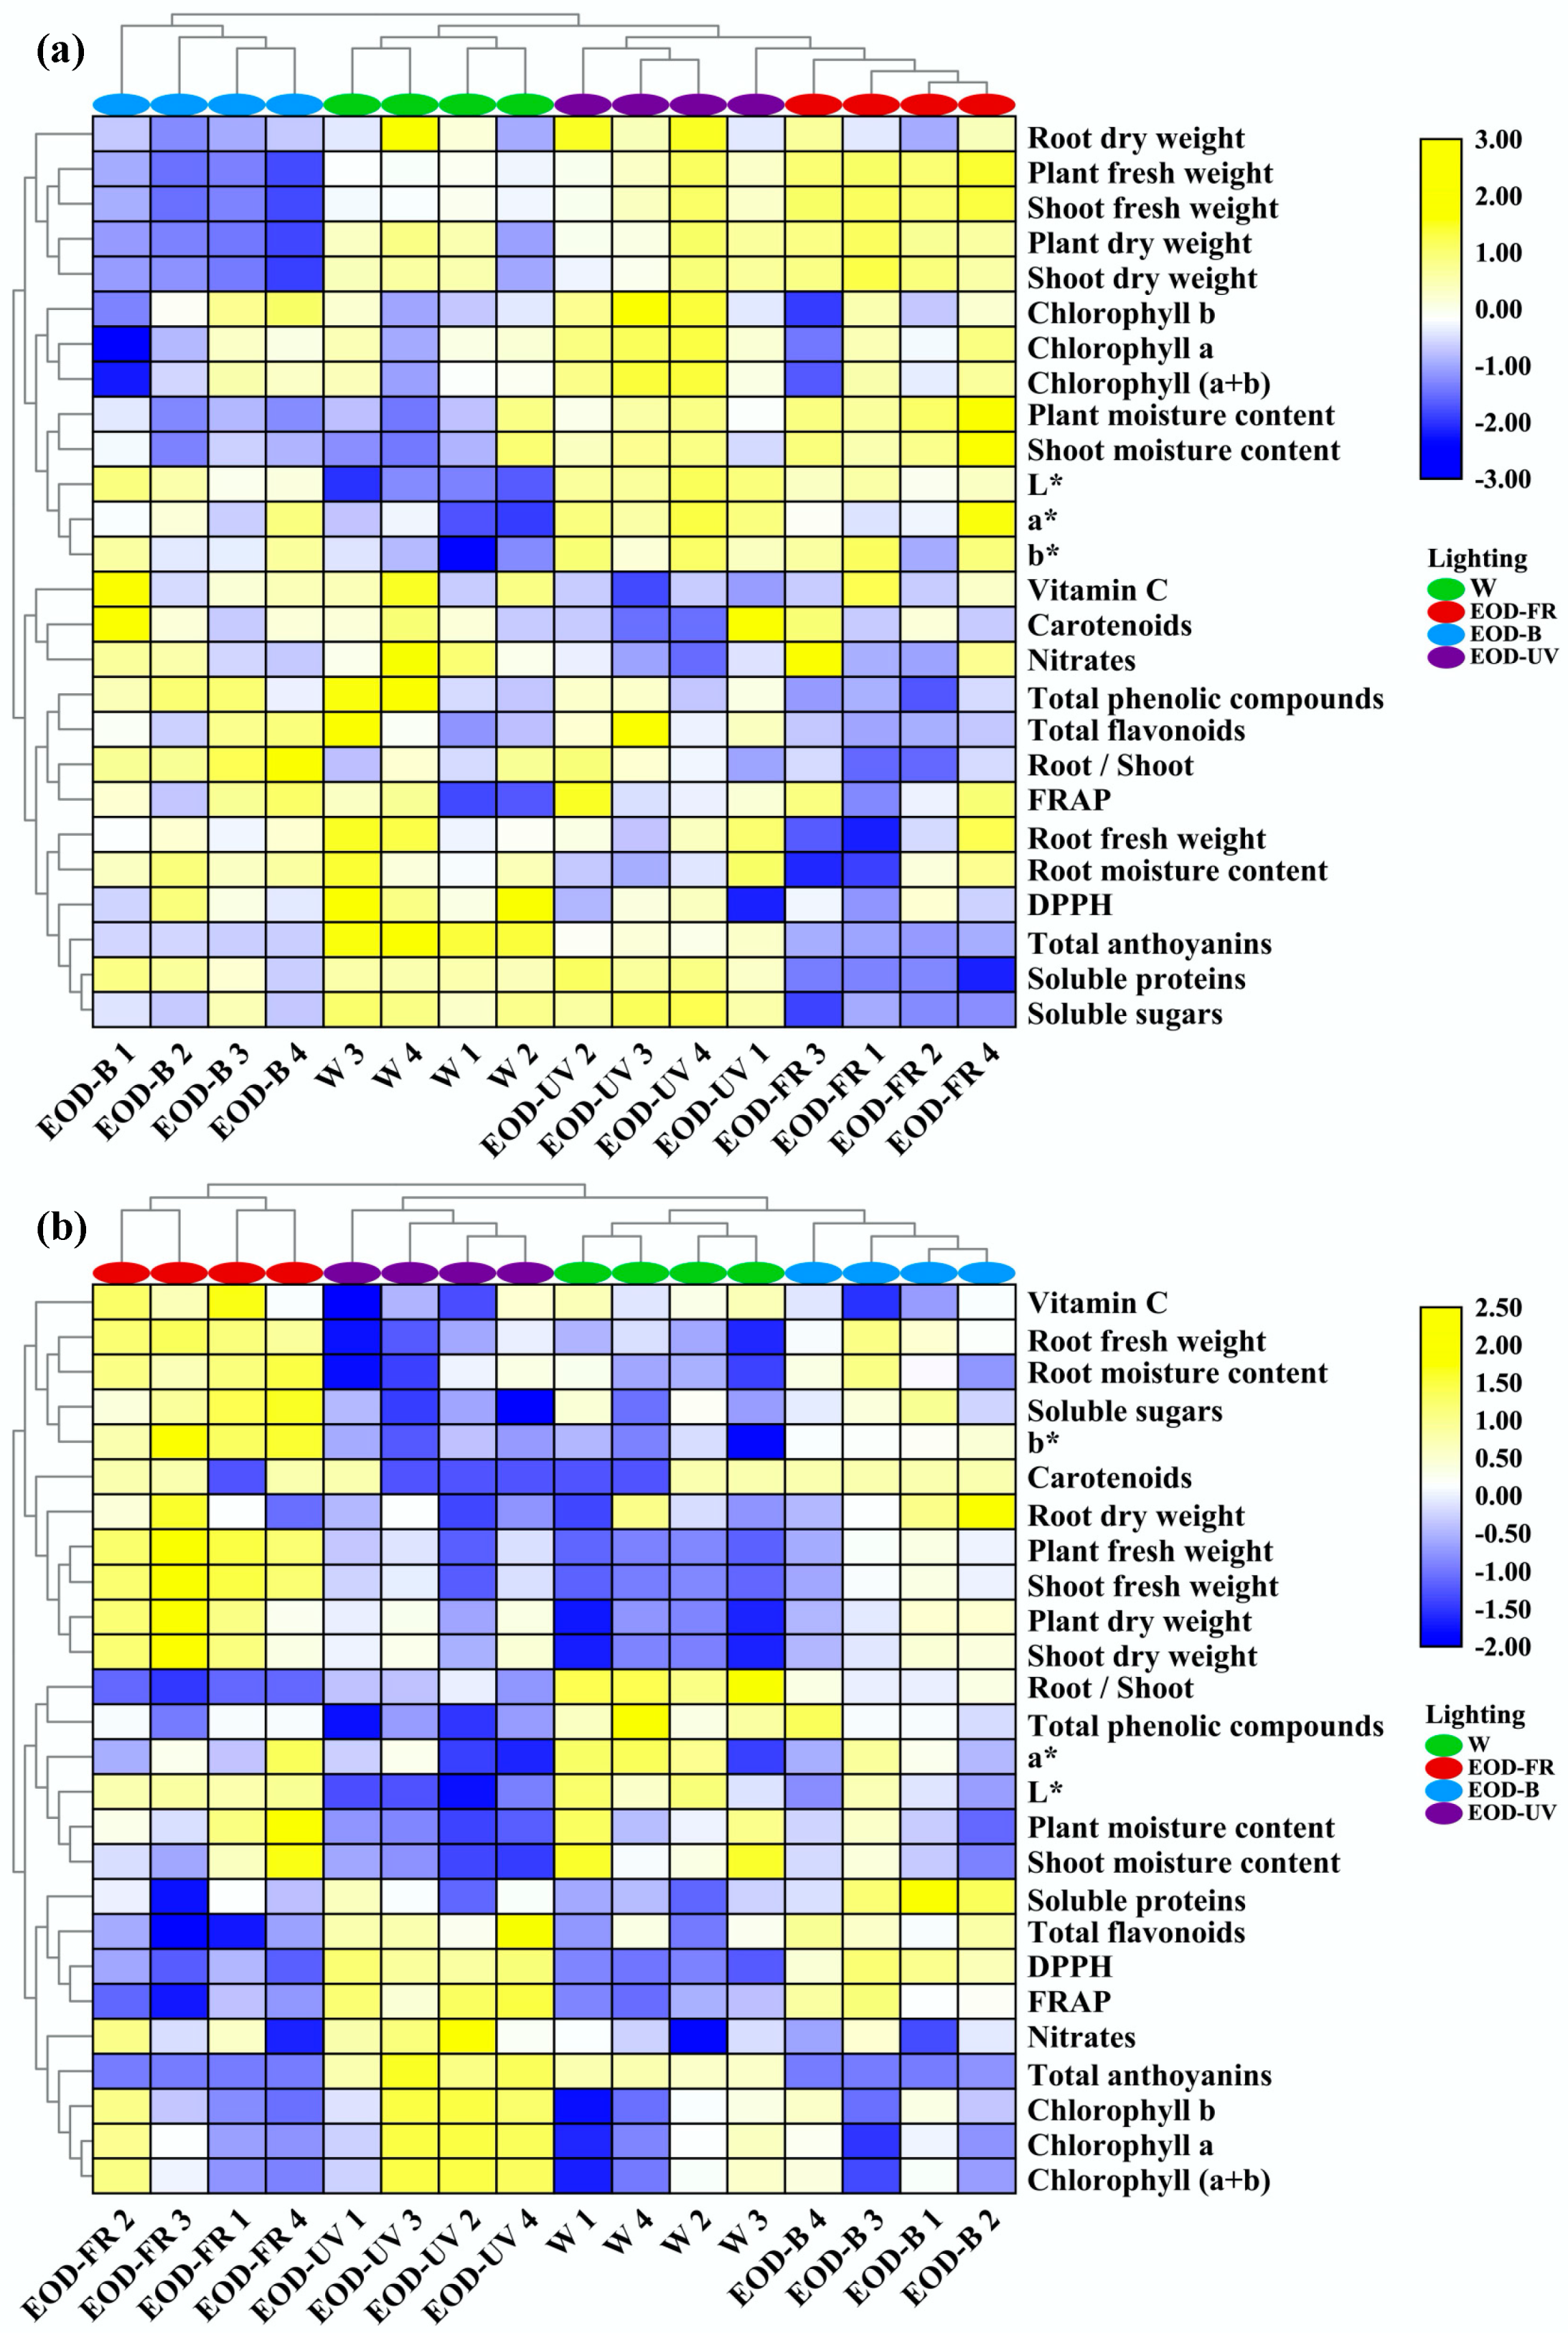
Figure 9.
Cluster heatmap analysis summarizing lettuce responses to end-of-day lightings. (a) Heatmap of ‘Red butter’ and (b) ‘Green butter’ responses. Results are visualized using a false color scale with yellow indicating an increased parameter, and blue indicating a decreased parameter. W= day-white light, EOD-B = end-of-day enhanced blue light, EOD-FR = end-of-day far-red light, EOD-UV = end-of-day ultraviolet-A light.
Table 1.
Lighting parameters.
Table 1.
Lighting parameters.
| Parameters | Lighting Treatments |
|---|
| W | EOD-B | EOD-FR | EOD-UV |
|---|
| Single-band photon flux density (μmol·m−2·s−1) |
| Ultraviolet light (350–400 nm) | 0.24 | 0.36 | 0.20 | 4.95 |
| Blue light (400–500 nm) | 46.12 | 83.70 | 43.72 | 41.65 |
| Green light (500–600 nm) | 69.46 | 55.09 | 68.58 | 64.34 |
| Red light (600–700 nm) | 137.38 | 107.84 | 137.03 | 135.19 |
| Far-red light (700–800 nm) | 4.79 | 3.93 | 25.99 | 5.91 |
| Integrated photon flux density (μmol·m−2·s−1) |
| PPFD | 252.97 | 246.54 | 249.34 | 241.18 |
| YPFD | 222.54 | 209.94 | 219.59 | 212.94 |
| TPFD | 223.63 | 210.93 | 223.78 | 216.63 |
| Radiation ratio |
| Red/Blue | 2.98 | 1.29 | 3.13 | 3.25 |
| Red/Green | 1.98 | 1.96 | 2.00 | 2.10 |
| Red/Far-red | 28.70 | 27.42 | 5.27 | 22.87 |
| Daily light integral (mol·m−2·d) |
| 10 h | 9.11 | 8.88 | 8.98 | 8.68 |
Table 2.
The interaction effects of cultivars and lightings on lettuce biomass.
Table 2.
The interaction effects of cultivars and lightings on lettuce biomass.
| Interaction | Fresh Weight | Dry Weight |
|---|
| Plant | Shoot | Root | Plant | Shoot | Root |
|---|
| C | *** | *** | *** | *** | *** | *** |
| L | *** | *** | NS | *** | *** | NS |
| C × L | *** | *** | * | ** | ** | ** |
Table 3.
The interaction effects of cultivars and lightings on lettuce moisture content and root–shoot ratio.
Table 3.
The interaction effects of cultivars and lightings on lettuce moisture content and root–shoot ratio.
| Interaction | Moisture Content | Root/Shoot |
|---|
| Plant | Shoot | Root |
|---|
| C | ** | NS | *** | *** |
| L | ** | NS | NS | *** |
| C × L | ** | ** | * | ** |
Table 4.
The interaction effects of cultivars and lightings on lettuce pigments.
Table 4.
The interaction effects of cultivars and lightings on lettuce pigments.
| Interaction | Pigments | Pigment Ratio |
|---|
| Chl a | Chl b | Chl (a + b) | Caro | TA | Chl a/Chl b | Chl (a + b)/Caro | Chl (a + b)/TA |
|---|
| C | *** | *** | *** | * | *** | NS | *** | *** |
| L | ** | ** | ** | NS | *** | *** | * | *** |
| C × L | NS | NS | NS | NS | *** | NS | NS | *** |
Table 5.
The interaction effects of cultivars and lightings on lettuce phytochemical contents.
Table 5.
The interaction effects of cultivars and lightings on lettuce phytochemical contents.
| Interaction | Antioxidant Capacity | Antioxidant Compounds | Nutrient Compounds |
|---|
| DPPH | FRAP | TPC | TF | VC | SP | SS | Nitrates |
|---|
| C | *** | *** | *** | *** | *** | *** | *** | *** |
| L | *** | * | ** | *** | ** | *** | NS | NS |
| C × L | *** | NS | NS | NS | NS | *** | *** | ** |
Table 6.
Eigen value, factor scores, and contribution of the first six principal component axes to variation in lettuce under different end-of-day lightings.
Table 6.
Eigen value, factor scores, and contribution of the first six principal component axes to variation in lettuce under different end-of-day lightings.
| Principal Components | F1 | F2 | F3 | F4 | F5 | F6 |
|---|
| Red butter |
| Eigen Value | 7.911 | 5.18 | 3.902 | 2.709 | 1.553 | 1.402 |
| Variability (%) | 30.428 | 19.922 | 15.007 | 10.42 | 5.972 | 5.393 |
| Cumulative % | 30.428 | 50.35 | 65.358 | 75.777 | 81.749 | 87.142 |
| Green butter |
| Eigen Value | 9.814 | 6.538 | 2.848 | 1.857 | 1.249 | 1.19 |
| Variability (%) | 37.745 | 25.145 | 10.952 | 7.143 | 4.804 | 4.576 |
| Cumulative % | 37.745 | 62.89 | 73.842 | 80.985 | 85.789 | 90.365 |

 ,
, 


