Article

Assessment of a Spatially and Temporally Consistent MODIS Derived NDVI Product for Application in Index-Based Drought Insurance

1
Department of Atmospheric Science, The University of Alabama in Huntsville, 320 Sparkman Dr., Huntsville, AL 35805, USA
2
NASA SERVIR Science Coordination Office, Marshall Space Flight Center, 320 Sparkman Dr., Huntsville, AL 35805, USA
3
Earth System Science Center, The University of Alabama in Huntsville, 320 Sparkman Dr., Huntsville, AL 35805, USA
4
The Regional Centre for Mapping of Resources for Development, Kasarani, Nairobi 00618, Kenya
5
Kenya Ministry of Agriculture, Livestock, Fisheries, and Irrigation, P.O. Box 30028-00100, Cathedral Road, Nairobi 00100, Kenya
6
Earth Science Branch, Marshall Space Flight Center, 320 Sparkman Dr., Huntsville, AL 35805, USA
*
Author to whom correspondence should be addressed.
Remote Sens. 2020, 12(18), 3031; https://doi.org/10.3390/rs12183031
Submission received: 3 August 2020 / Revised: 11 September 2020 / Accepted: 14 September 2020 / Published: 17 September 2020
(This article belongs to the Special Issue Earth Observation for Index Insurance)

Abstract

:
In arid and semi-arid regions of Eastern and Southern Africa, drought can be devastating to pastoralists who depend on healthy vegetation for their herds. The Kenya Livestock Insurance Program (KLIP) addresses this challenge through its insurance program that relies on a vegetation index product derived from eMODIS NDVI (enhanced Normalized Difference Vegetation Index). Insurance payouts are triggered when index values fall below a certain threshold for a Unit Area of Insurance (UAI). The objective of this study is to produce an updated, cloud-based NDVI product, potentially allowing for earlier payouts that may help herders to prevent, minimize, or offset drought-induced losses. The new product, named reNDVI (rapid enhanced NDVI), provides an updated cloud filtering algorithm and brings the entire processing chain to the cloud. Access to the scripts used for the processing described and resulting data is openly available. To test the performance of the new product, we provide a robust evaluation of reNDVI and eMODIS NDVI and their derived payout indices against historical drought, payouts provided, and mortality data. The implications of potential payout differences are also discussed. The products show good comparability; the monthly average NDVI per UAI has correlation values over 0.95 and MAPD under 5% for most UAIs. However, there are moderate differences when assessing year-to-year payout amounts triggered. Because the payouts are currently calculated based on the 20th and first percentile of index values from 2003–2016, payouts are very sensitive to even small changes in NDVI. Where livestock mortality was available, payouts for reNDVI and eMODIS had similar correlations (r = 0.453 and r = 0.478, respectively) with mortality rates. Therefore, with the potential reduced latency and updated cloud filtering, the reNDVI product could be a suitable replacement for eMODIS in the Kenya Livestock Insurance Program. The updated reNDVI product shows promise as a vegetation index that could address a pressing drought insurance challenge.

Graphical Abstract

1. Introduction

Kenya has a broad range of climates and ecological regions ranging from humid tropical to arid [1,2]. However, over 80% of the country is classified as Arid and Semi-Arid Land (ASAL) and contains approximately 20% of the country’s population and 60% of the livestock [3]. Pastoralists, particularly from ASALs, are dependent on weather conditions to produce enough forage and water for their herds. It has been noted that in the last 50 years, precipitation has been decreasing inland (where ASALs exist) and increasing along the coast [4]. The country experiences two rainy seasons: March to June, known as the long rains, and October to December, known as the short rains. Rainfall characteristics are highly variable, with the long rains showing less variation than short rains [5,6]. The pastoralists in ASALs can be economically vulnerable due to changes in rainfall patterns and climate variability. Livestock losses accounted for about 70% of the 12.1 billion USD in damage caused by drought in Kenya from 2008 to 2011 [7]. Research has shown that climate variability and extreme events are expected to adversely affect agricultural production in Kenya [8], and adaptation strategies such as investments in drought- and heat-tolerant seed varieties, irrigation systems, disaster relief, insurance, and social protection programs are needed to reduce the effects of climate change [9,10,11].
In Kenya, the National Drought Management Authority (NDMA) has been established to proactively monitor and manage droughts through its early warning system and monthly bulletins. In addition to its mandate to disseminate drought information, NDMA has championed contingency and resilience planning and implementation through the Drought Contingency Fund and the Hunger Safety Net Programme, which include cash and food transfers to the most vulnerable populations [12,13]. The success of programs like these, based on quantitative drought information, points to the need for wider adaption and expansion to other sectors.
Livestock insurance programs can be an effective strategy in building resilience in pastoral communities and play an important role in alleviating the spiraling cycle of poverty as a result of drought losses. Notwithstanding that, traditional (claim-based) insurance programs are unlikely to address these challenges in sparsely populated and poorly accessible regions such as Eastern Africa. Generally, traditional insurance methods based on ground surveys are too expensive, time consuming, and risky for both providers and potential clients. Site visits to verify claims and assess losses are very costly to insurance companies, particularly in sparsely populated and remote regions, and any payouts would likely be smaller than the accrued overheads. An alternative to traditional ground survey-based insurance program is index-based insurance. The index is a numerical representation of a physical phenomenon (especially related to precipitation, agro-meteorology, etc.), is correlated with those conditions or associated losses, and often uses satellite-based observations. Remotely sensed weather- or vegetation-based indices offer a way to monitor environmental conditions in remote areas and in near real time, providing an alternative that reduces associated costs by measuring a proxy of damage instead of actual losses [14,15]. Such programs have been demonstrated ranging from the continental African scale [16] to the microfinance and smallholder scale in Eastern and Southern Africa [17,18,19]. de Leeuw et al. [20] provided a thorough review on the uptake of remote sensing in index-based insurance.
The Kenya Livestock Insurance Program (KLIP) is part of the Index Based Livestock Insurance program (IBLI), run by the Ministry of Agriculture, Livestock, Fisheries, and Irrigation and supported by the International Livestock Research Institute (ILRI), the World Bank, and Swiss Re. ILRI is currently the calculating agent that does the index and payout calculations. It was launched in 2015 to help pastoralists cope with the impacts of drought on their livestock [21]. The program utilizes Normalized Difference Vegetation Index (NDVI) assessments from satellite remote sensing. The insurance triggers, or decision points where a payout is determined, are identified by the response of observed NDVI. The index is derived from the standard score of the spatially averaged vegetation conditions over a Unit Area of Insurance (UAI). Payouts based on the index are potentially provided twice a year corresponding to the long and short rainy seasons: once in mid-August and once in mid-February.
The insurance payouts allow pastoralists to purchase food and water to sustain livestock, or replace lost livestock. However, the delay in providing payouts presents a significant limitation [22]. Typically, the payouts can take up to six weeks after the end of each rainy season. The prospect of disbursing preemptive payouts vs. loss-based payouts could mean the difference between pastoralists purchasing fodder for their animals to get through the season vs. a total loss. One reason for this latency in payouts is that raw data are downloaded and processed on local computers and the time required to post-process the data to create the NDVI product (or index) itself (see section below).
To derive its index, KLIP uses the enhanced Moderate Resolution Imaging Spectrometer (eMODIS) NDVI product [23], made available by the Famine Early Warning Systems Network (FEWS NET). The FEWS NET eMODIS NDVI product is available since 2003 at a horizontal spatial resolution of 250 m. eMODIS data are available in 10 day (dekad) composites and are not available until about one month after the acquisition. A temporal filtering is done to reduce the impacts of clouds and atmospheric effects that could erroneously influence the NDVI. The product is used for its higher accuracy, but this comes with a trade off of high latency. eMODIS processing takes the maximum NDVI value from a 10 day period for each pixel and temporally smooths the product using the Swets filter [24]. This approach uses a weighted least squares linear regression to smooth out poor quality data [23]. The smoothing process requires at least two dekads on either side of the value in question, making the final product unavailable until 30 days after the original satellite overpass. The latency of the eMODIS product poses a challenge for KLIP to preempt drought impacts on livestock, and research has been done to explore how to reduce the latency of high quality NDVI products. One example is the MODIS derived Vegetation Condition Index (VCI) used by NDMA, produced by BOKU (University of Natural Resources and Life Sciences, Vienna, Austria) using their NDVI [2]. The product is derived using Aqua and Terra MODIS at the end of each dekad, and in [25,26], it was shown that using machine learning techniques, it is even possible to forecast the VCI one month ahead without significant loss of accuracy. It provides weekly updates of NDVI by applying a Whittaker smoother using available observations within the past 175 days and provides an uncertainty measure at the pixel level [2]. Barrett et al. [27] also created NDVI and VCI forecasted products, which use data from both MODIS and Landsat. Furthermore, FEWS NET provides a preliminary estimation of NDVI at near real time and then updates the product after the final smoothing [23]. It is also important to note the effort to forecast NDVI that could aide near real smoothing processes [25,26,27,28], among many others. However, programs like KLIP are dependent on the high accuracy and consistency of the final smoothed eMODIS product. As the research community searches for an accurate way to produce a consistent, smoothed NDVI product in near real time, we propose tackling the latency of the post-processing analysis. In using eMODIS, the filtered and smoothed data are available roughly three dekads after the observation date. KLIP reports that the post-processing payout calculation takes approximately two additional weeks. Utilizing reNDVI (rapid enhanced NDVI) and Google Earth Engine (GEE), the entire process is moved to the cloud, where the payout calculations are available hours after the reNDVI is available, effectively reducing the time from the first satellite overpass to index derivation to the same as the NDVI (three dekads), and reduces the production of the final KLIP payout by approximately one week.
The objective of this study is to implement a similar smoothed NDVI product, which we call rapid enhanced NDVI (reNDVI), on the GEE platform, a cloud-based analysis platform that is publicly available using open source languages (Python or JavaScript). We provide a robust evaluation of reNDVI compared to eMODIS and the finalized payout indices against the historical drought, payouts provided, and mortality data. This allows us to explore how the index and payouts would be calculated in the same platform. The concurrent processing ultimately reduces the download and processing times and effectively reduces the latency of the payout calculation to that of the reNDVI itself (three dekads). We estimate that this reduces the time to final KLIP payout by one week. The reNDVI improves upon the FEWSNET eMODIS product by adjusting the smoothing algorithm and updating the masking of poor quality data. This reNDVI is MODIS derived and aims to help alleviate the challenges of using eMODIS in the drought insurance processes and potentially allows for earlier insurance payouts. The first step in this process was to reproduce the eMODIS processing on GEE using updated methodologies for filtering out poor quality NDVI observations (e.g., clouds) and time series smoothing [29]. The use of GEE allowed for a large-scale processing and scalable application of the algorithm to create the dataset. We compare reNDVI to the existing FEWS NET eMODIS dataset and investigate the differences to test its potential as a replacement for eMODIS NDVI. We then analyze how the differences affect the calculation of the payout using past eMODIS data and methodologies from KLIP. Independent livestock mortality data were used to evaluate both datasets.

2. Materials and Methods
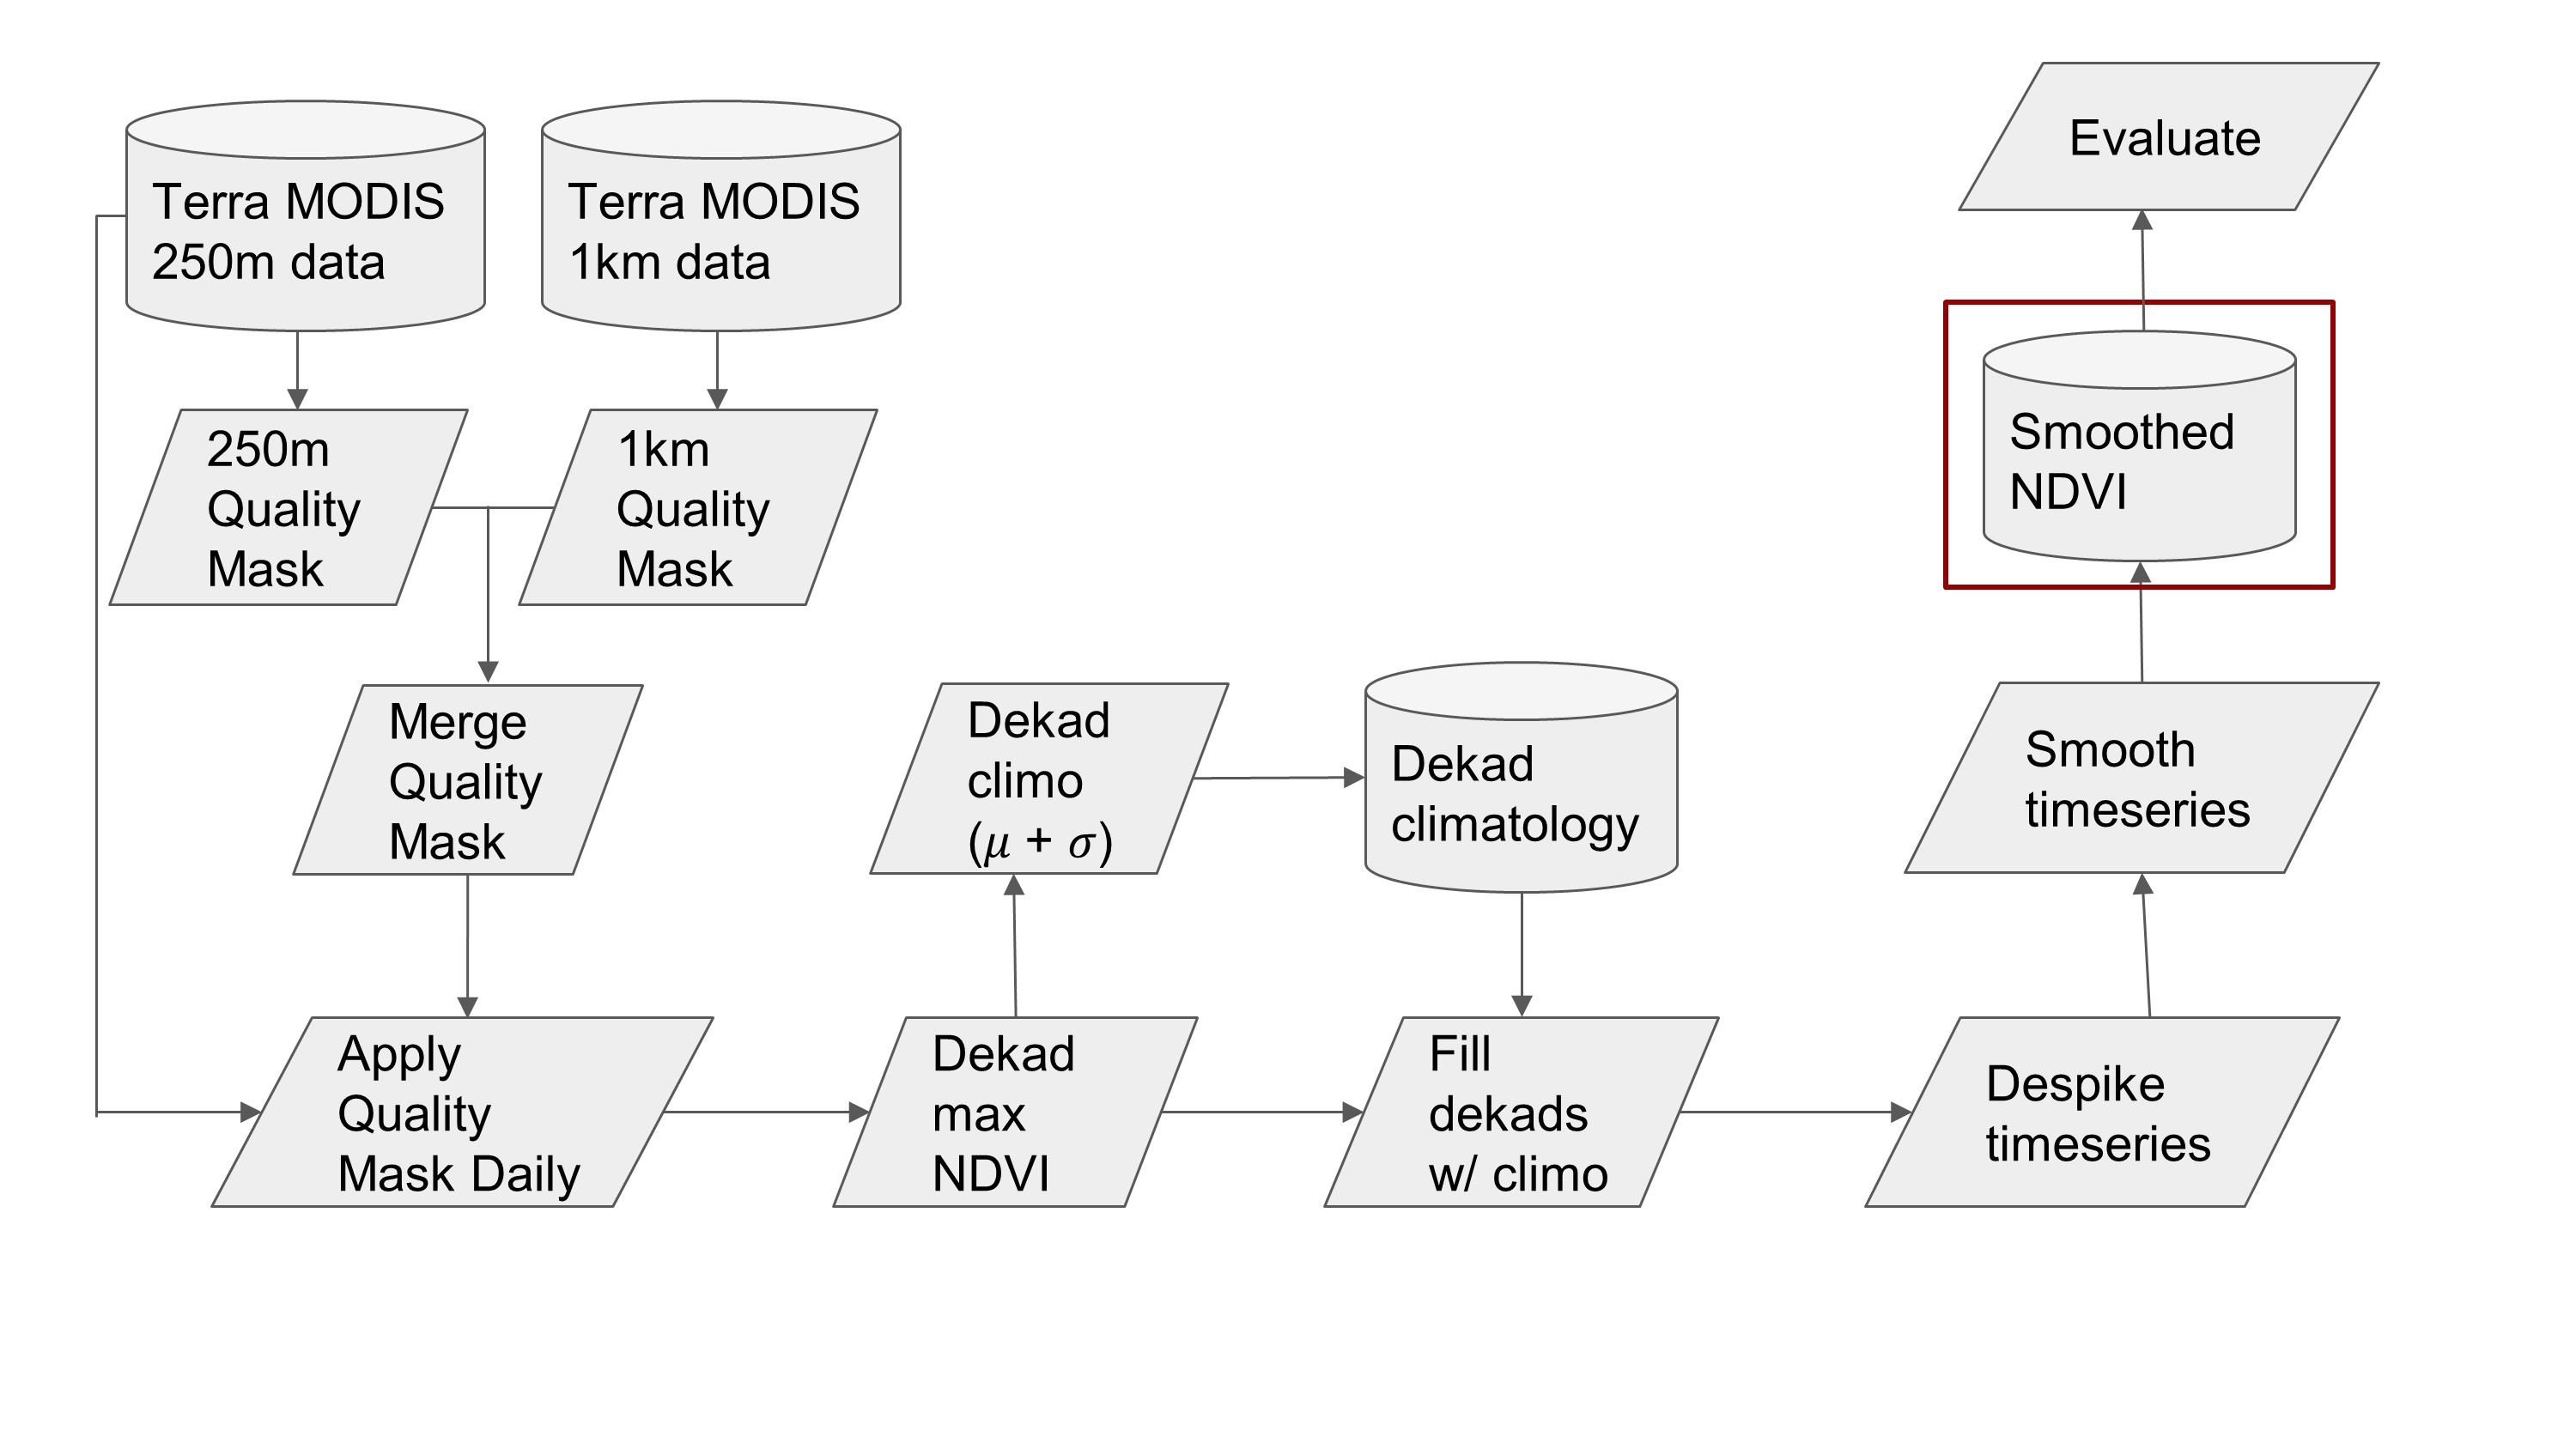
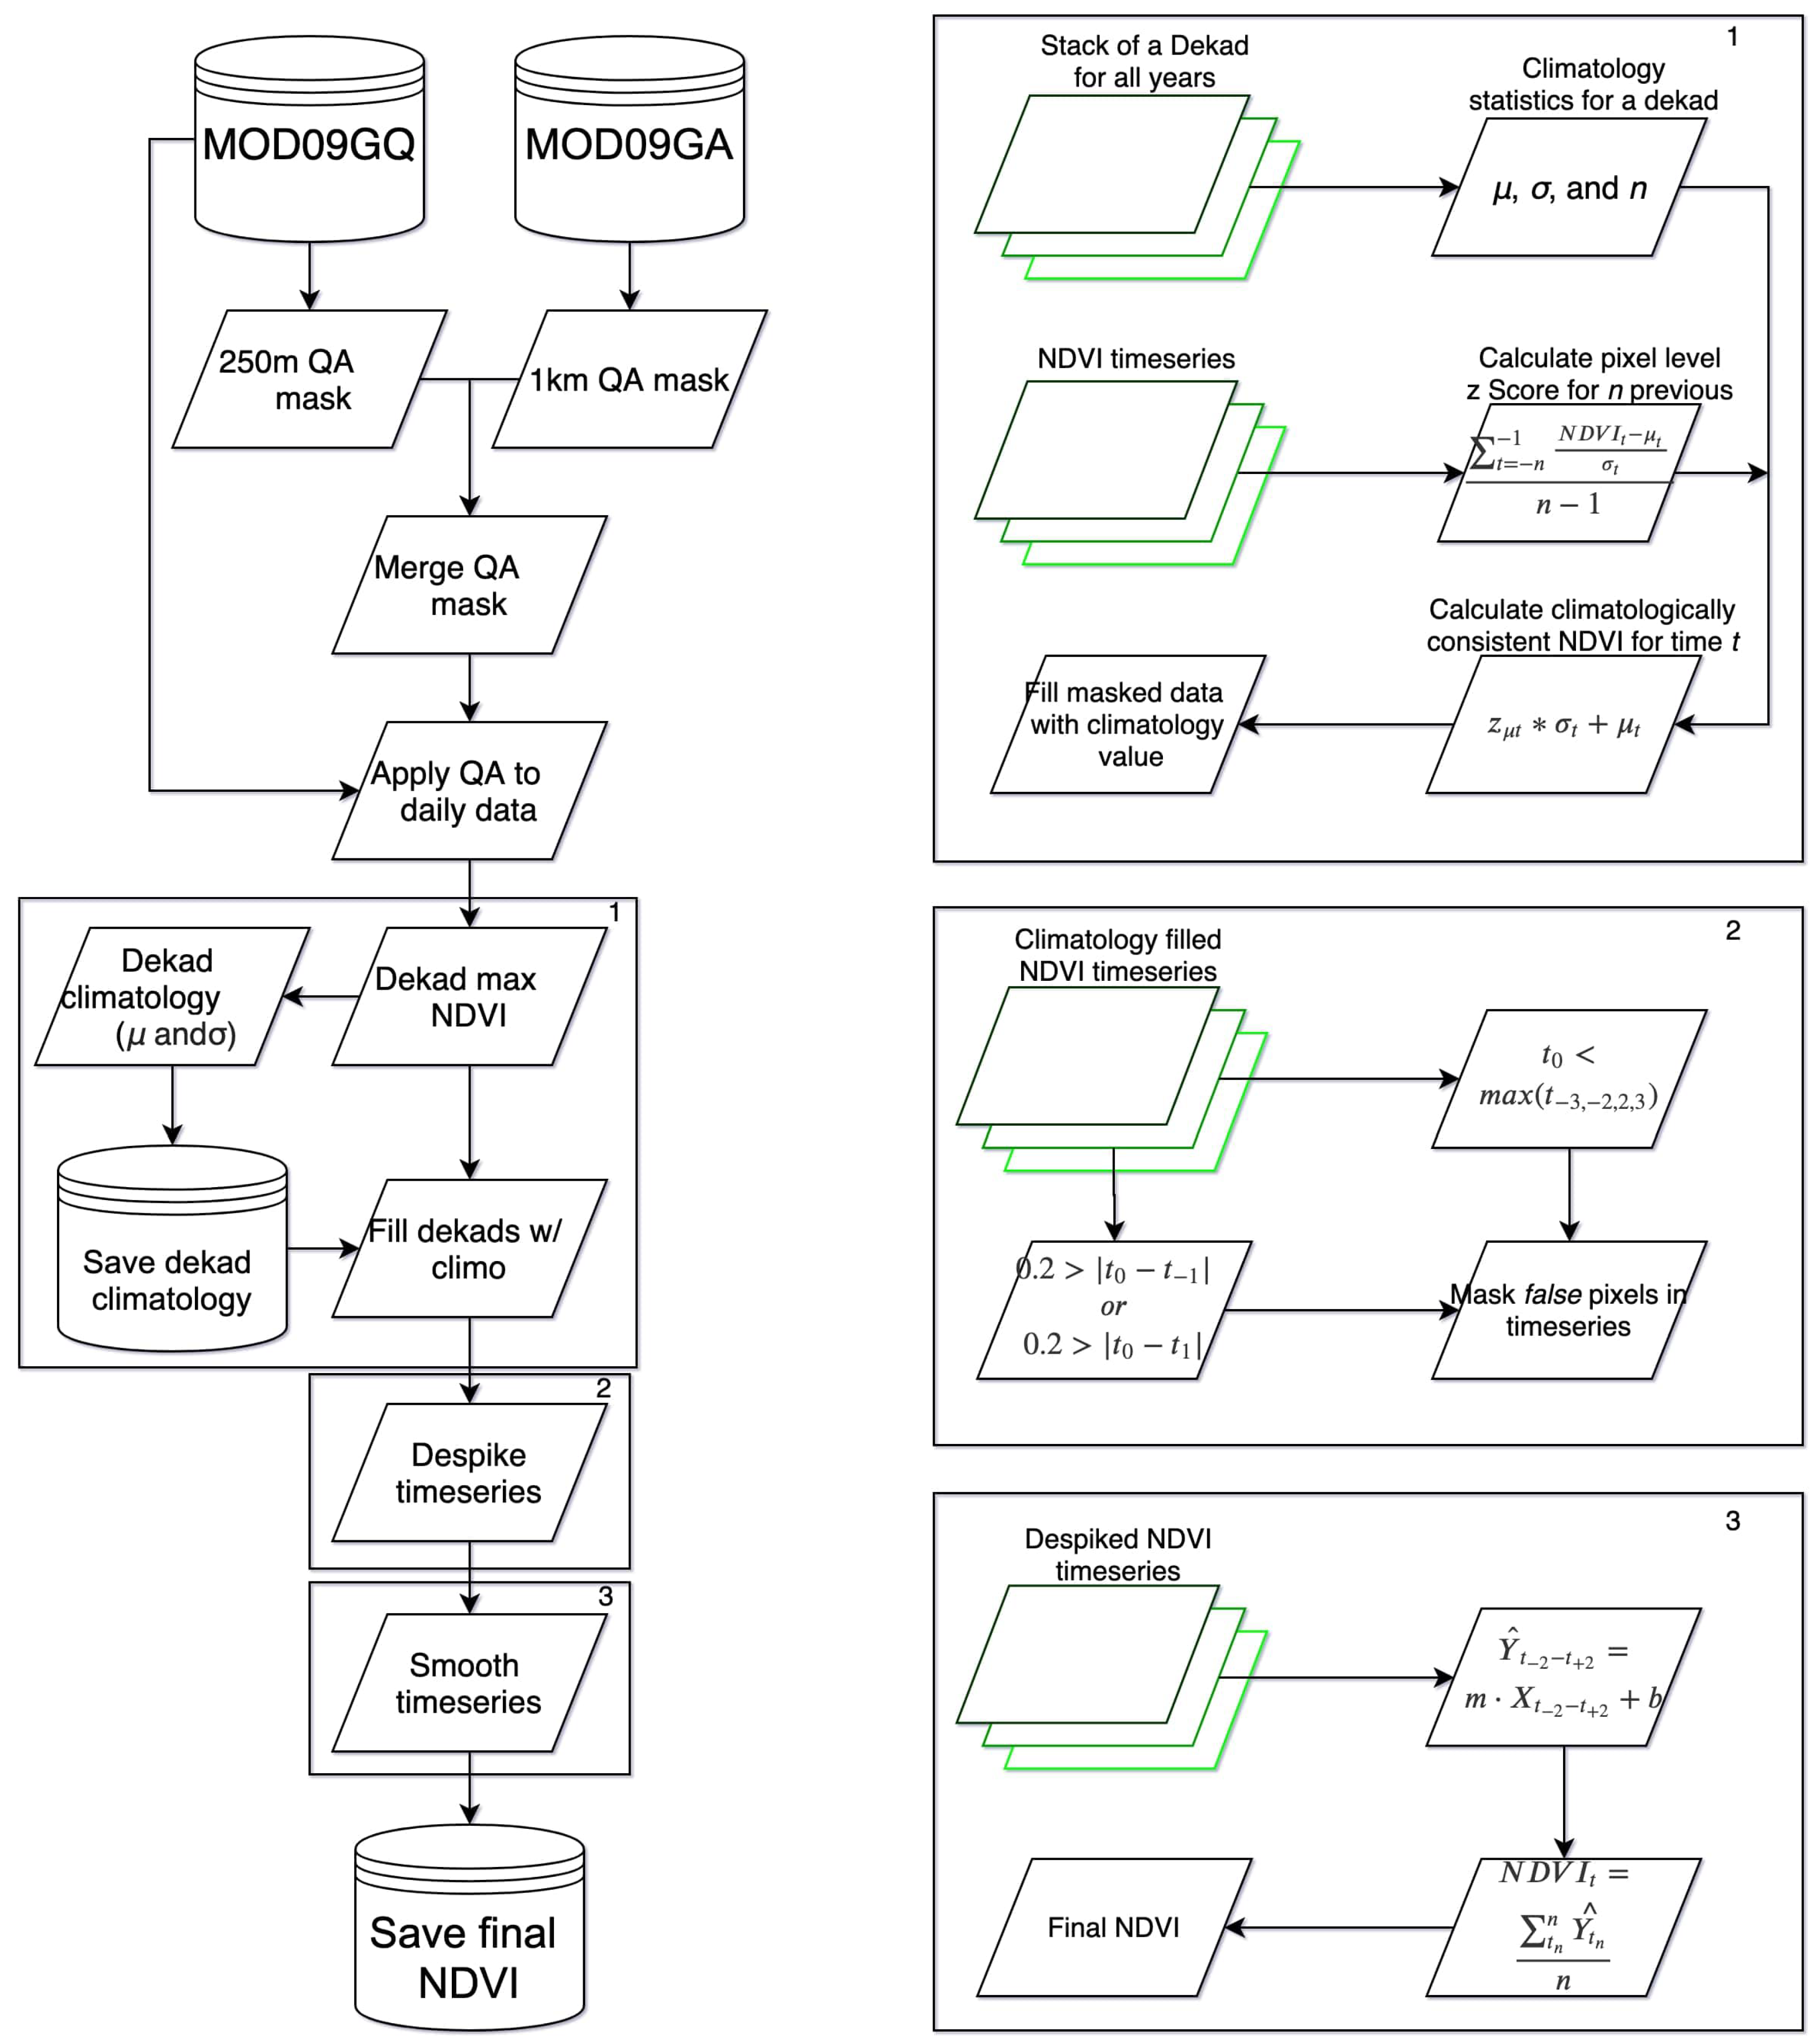
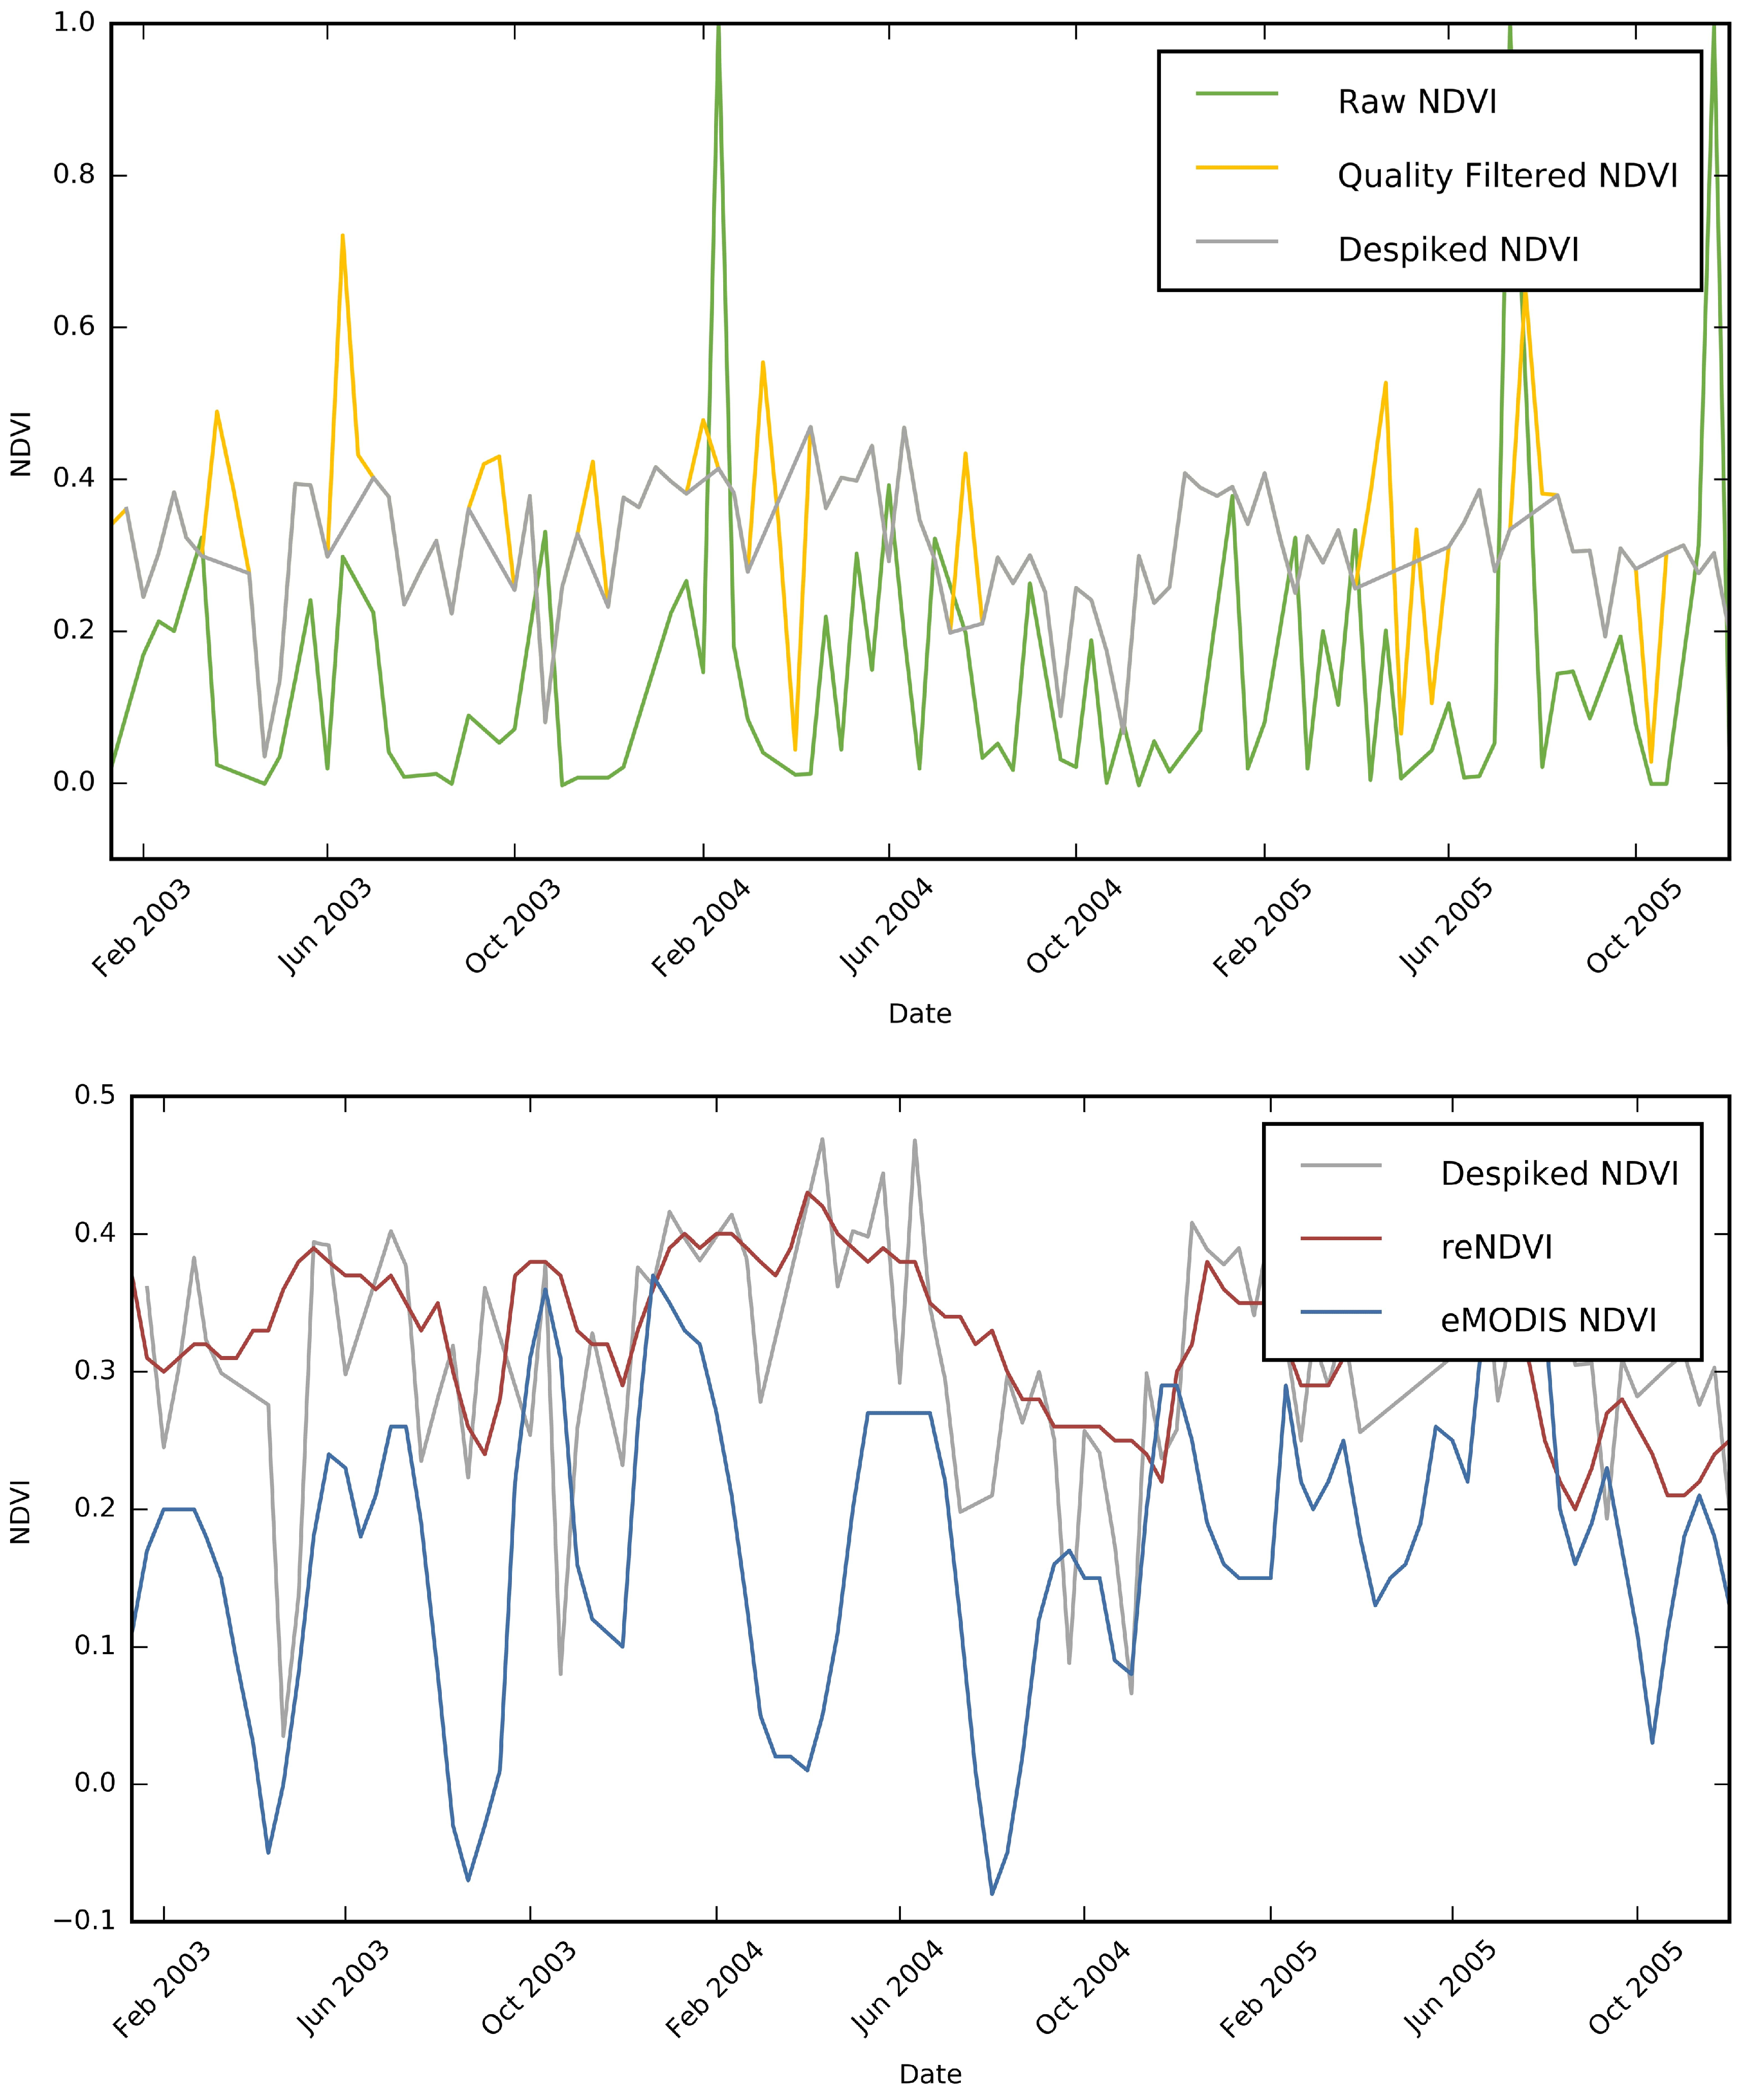
KLIP currently covers the ASALs of Kenya and parts of southern Ethiopia. The spatial extent covered by UAIs are shown in Figure 1. The average area of a UAI is 2600 km2, and they cover mainly grasslands and shrublands. Comparisons of the reNDVI product and FEWS NET eMODIS NDVI use NDVI data at dekadal and monthly scales from 2003–2019. The reNDVI product was first compared against the FEWS NET eMODIS product at the pixel level to evaluate and analyze the differences and/or similarities between the two products. Later, the two products were spatio-temporally aggregated further to evaluate the products at each UAI level on a monthly time scale. Since the insurance payouts are made at UAI levels using cumulative monthly NDVI values, the monthly UAI level analysis was performed to evaluate the applicability of both products for insurance payouts. We then analyzed how hypothetical insurance payouts would be affected using payout calculation methodology from KLIP. Lastly, livestock mortality data were then used to evaluate both index derivations with independent data.

2.1. reNDVI Product

The reNDVI product is calculated from the Collection 6 Terra MODIS 250 m daily surface reflectance product MOD09GQ.006 [31]. We chose Terra for the longer period of record and to keep consistent with eMODIS for comparisons. Processing steps for the reNDVI dataset include quality filtering of pixels, calculation of NDVI, compositing over a 10 day period, filling quality flagged pixels with climatology data, despiking, and temporal smoothing. A detailed overview of the algorithm is provided in Figure 2. All processing was conducted on GEE, which is an online service that hosts state-of-the-art cloud computing and analysis-ready geospatial products. The data store contains a large catalog of Earth observation data allowing the scientific community to perform calculations on large numbers of images in parallel for planetary-scale computations in real time [32]. A full description of GEE as a platform was detailed in Gorelick et al. [29]. Specific preprocessing of the collection entails masking pixels based on the internal MOD09GQ.006 quality band to remove poor quality data. Furthermore, the 1 km state flag band (“state_1km”) from the MOD09GA dataset [33] is used to remove additional poor quality pixels flagged as clouds, cloud shadow, snow, and high (>55°) satellite viewing angle. The state_1km band has information from two cloud detection algorithms to describe the cloud information, the MOD/MYD35 cloud mask product [34] and an internal cloud detection [35]. Other analyses focusing on vegetation have employed the use of the state_1km quality flags for masking poor quality pixels [36] and found that cloud contamination was the most important factor driving spatial and temporal variability in derived NDVI [37], suggesting the importance of quality masking for clouds for analyses using NDVI. The daily NDVI data are combined into a 10 day composite by using the maximum NDVI value for each pixel from the 10 day period. If there are no good quality data available within the 10 day period, the pixels are filled using long term climatology data at a later stage.
Studies have used the mean or median climatology value to fill a product in the absence of quality data [38]; however, this may introduce anomalies within the time series. Alternatively, NDVI trends are typically constrained by environmental conditions, and the trend can be assumed stable for short-range forecasting applications [39], allowing for the use of previous trends for gap filling. For this study, we used the trend of NDVI for a period prior to a gap (as compared to the prior period’s climatology) for sampling the gap’s climatology to fill the gap’s value in a way that is consistent with the current trend. To create the climatology, all clear pixels for a given dekad throughout 2001–2018 were used to calculate a mean and standard deviation. If there were less than 7 clear observations (out of a maximum possible of 18) for a given pixel and dekad, the climatology was not calculated; this was done to ensure the presence of at least 1/3 of the total possible observations to calculate the climatological statistics. To ensure the filled values are climatologically consistent with a given year, the z-score for n previous dekads just prior to the pixel being filled were calculated (in this case, n = 5 such as used in the FEWS NET processing [23]). The z-score from previous dekads was used to backout what the fill value should be based on climatology. This approach assumes that the NDVI values from the previous years for individual dekads follow a normal distribution. Filling of pixels based on climatology occurred on average 14.52% of the time, with most filling in high elevation areas and water bodies; masking water bodies reduced the average to 13.61%.
Despite backfilling the quality flagged pixels, some gaps could remain particularly due to persistent cloud cover. Data gaps remained on average 2.83% of the time. The NDVI values were then despiked, which filters out pixel-level NDVI values that are anomalously high or low compared to the NDVI values for the preceding and following 10 day periods for that pixel. We consider values anomalously high or low when the absolute change is greater than 20% between both the before and after periods [40]. On average, despiking occurs about 7.37% of the time. The despiked 10 day NDVI composites were then temporally smoothed using a moving window linear regression to produce the final reNDVI product and used to predict the NDVI values for the entire window. This creates a “stack” of NDVI values for a given dekad, where the final dekad NDVI value is the mean of the predicted “stack”. All of the processed data were stored as an Image Collection Asset within GEE for later use. Access to the scripts used for the processing described and resulting data is openly available (see the Supplementary Materials).
There are some notable differences between the processing steps used to create eMODIS and reNDVI. For example, the reNDVI QA process is more rigorous where all poor quality (clouds, shadows, saturation) pixels are masked, whereas the FEWS NET eMODIS dataset uses the best pixel available even if it is not good quality, ensuring that all pixels have values for use in the smoothing process [41]. The stringent QA masking of reNDVI leads to data gaps in the imagery, which affect the smoothing process. Therefore, as discussed earlier, a gap filling step was introduced to alleviate some of the data gaps in areas with persistent cloud cover. Further differences between reNDVI and eMODIS include the smoothing algorithm where eMODIS uses a weighted linear regression within a window to predict NDVI and the reNDVI uses an unweighted linear regression. Overall, these differences are most seen in cloud prone areas and are most notable in the peaks and troughs throughout the time series. Section 3 illustrates and discusses the difference between the datasets in detail. Both smoothing algorithms require two time periods before and after the date of interest, which limits the applicability for delivering timely data. However, we provide a forward processing based on harmonic modeling [42] to deliver an initial best estimate when observations are missing and then reprocessed when observed data are available. This processing workflow of estimating future NDVI to support the smoothing process allows the reNDVI product to be produced within hours of the acquisition of imagery for the full dekad to be processed.

2.2. Comparative Analysis

The reNDVI dataset was compared to the FEWS NET eMODIS dataset to evaluate the differences both at the pixel level (by dekads) and zonally (by month) by the UAI. For pixel-level evaluation, common evaluation metrics including bias, correlation, and Mean Absolute Percent Difference (MAPD) were calculated. Spatial patterns of correlation were compared to average cloudiness data calculated from MODIS data cloud flags [43]. Monthly zonal statistics including the mean, median, and standard deviation of NDVI values within each UAI were calculated from 2003–2019. Using the resulting mean monthly NDVI, the evaluation metrics previously stated were calculated at the UAI level.

2.3. Payouts and Mortality Comparison

2.3.1. Payouts’ Calculation

Insurance payouts determined by an index-based methodology are triggered when the specific index falls below a certain threshold. Once the composite UAI NDVI reaches the trigger threshold, the insurance payout will be a percentage of the insured amount, increasing until the exit threshold is reached where the full insured amount is paid. Payouts were calculated based on the workflow provided by KLIP. First, pixels that have a very limited long-term and inter-annual temporal variability (where the difference between the 5th and 95th percentile NDVI values between 2001 and 2016 is less than 0.05 NDVI units) were masked [22]. Average monthly NDVI values per UAI were then calculated. The cumulative NDVI for each UAI for each rain period was found by summing the values of the monthly mean NDVI for the rain period, then the mean and standard deviation of the cumulative NDVI from 2003–2016 were calculated. The index values were then computed for each year according to the standard score of cumulative NDVI per UAI, shown in Equation (1):
Z N D V I i , p , y = N D V I i , p , y μ ( N D V I i , p ) σ ( N D V I i , p )
where Z∑NDVI is the index; ∑NDVI is the cumulative NDVI for the specific UAI (i), year (y), and rain period (p); μ (∑NDVI) is the mean cumulative NDVI from 2003–2016; and σ (∑NDVI) is the standard deviation of the cumulative NDVI from 2003–2016. The trigger and exit thresholds were determined by taking the 20th and 1st percentiles of the index values from 2003–2016. Partial payouts are provided when the index falls below the trigger threshold and increase linearly until the exit threshold is reached, whereby a full payout is made. Separate thresholds were calculated for eMODIS and reNDVI to calibrate the payouts unique to each product.
The percentage of total payouts were then calculated for 2003–2019. Actual payouts were not calculated as the total sum insured for each UAI was not available. Minimum payout is 5% of the total sum insured, so if there was a payout triggered and the payout calculated was less than that, it was changed to 5%.

2.3.2. Comparison of reNDVI and eMODIS Derived Payouts and Livestock Mortality Data

Payouts were compared by calculating the percent of payouts when one product triggered a payout, but the other did not, and of those times, how large of a payout was triggered. All payouts calculated in this section are hypothetical, as the KLIP program did not begin until 2015. First, the number of times that payouts were triggered at different times for eMODIS and reNDVI for each UAI was found. Of those times, the difference in payouts was calculated to determine the magnitude of the differences. The average of payouts was found where reNDVI triggered a payout and eMODIS did not, and vice versa. This allowed for an assessment of how large the differences were when payouts occurred.
We also compared index values and calculated payouts to livestock mortality data from the Index Based Livestock Insurance (IBLI) program [44]. Mortality data may have some quality issues (for example, missing data or incorrect recollection of livestock loss by pastoralists), but this analysis was included to have an independent analysis of reNDVI and eMODIS NDVI with ground-based data. Livestock mortality data were available from 2010–2015 for several sub-locations in Marsabit, Kenya. Sub-locations were matched to their respective UAIs, and the average livestock mortality was calculated for each season (long rains/long dry and short rains/short dry) by taking total livestock deaths per UAI divided by total herd size at the beginning of each season per UAI [45]. The dataset included information on household herd size at the beginning of the short rain season each year. To calculate herd size at the beginning of the long rains, livestock births and intake were added to the herd size, whereas deaths, offtake, and slaughter were subtracted as those data had monthly values. Data were available for a total of 9 UAIs. The index and payouts for each product were statistically fitted to average livestock mortality, and the correlation and p-values were found.

3. Results

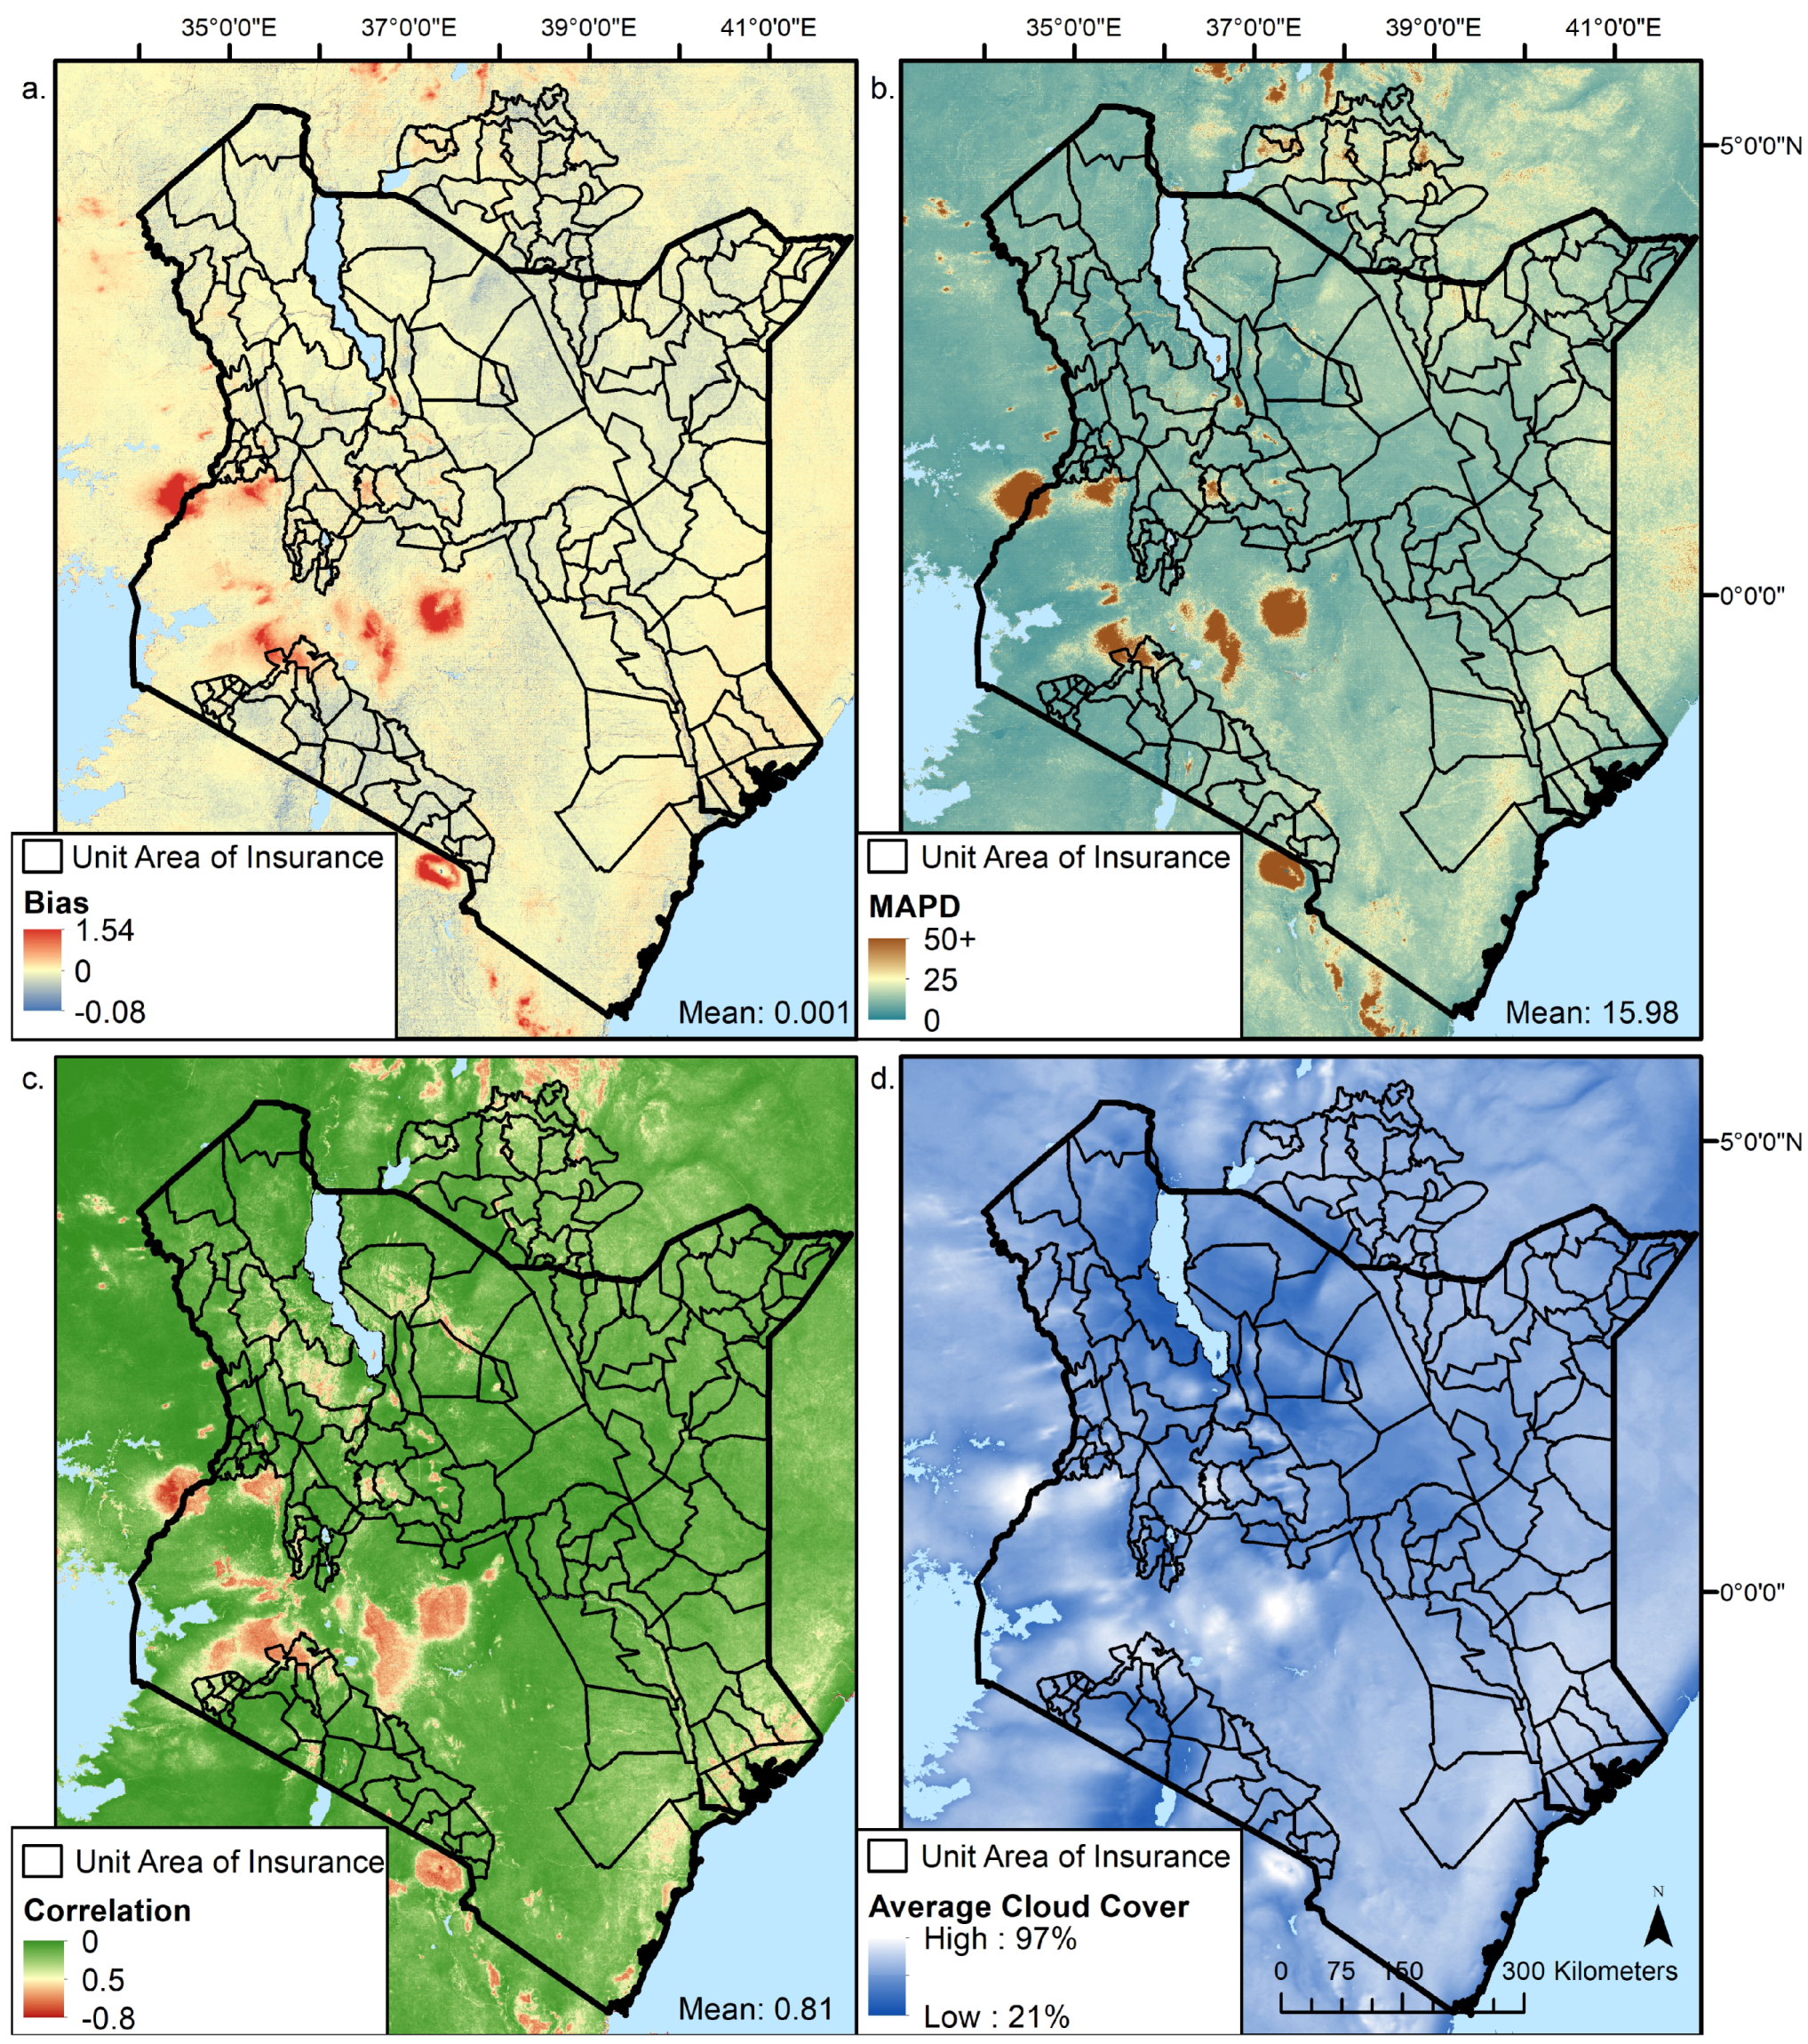
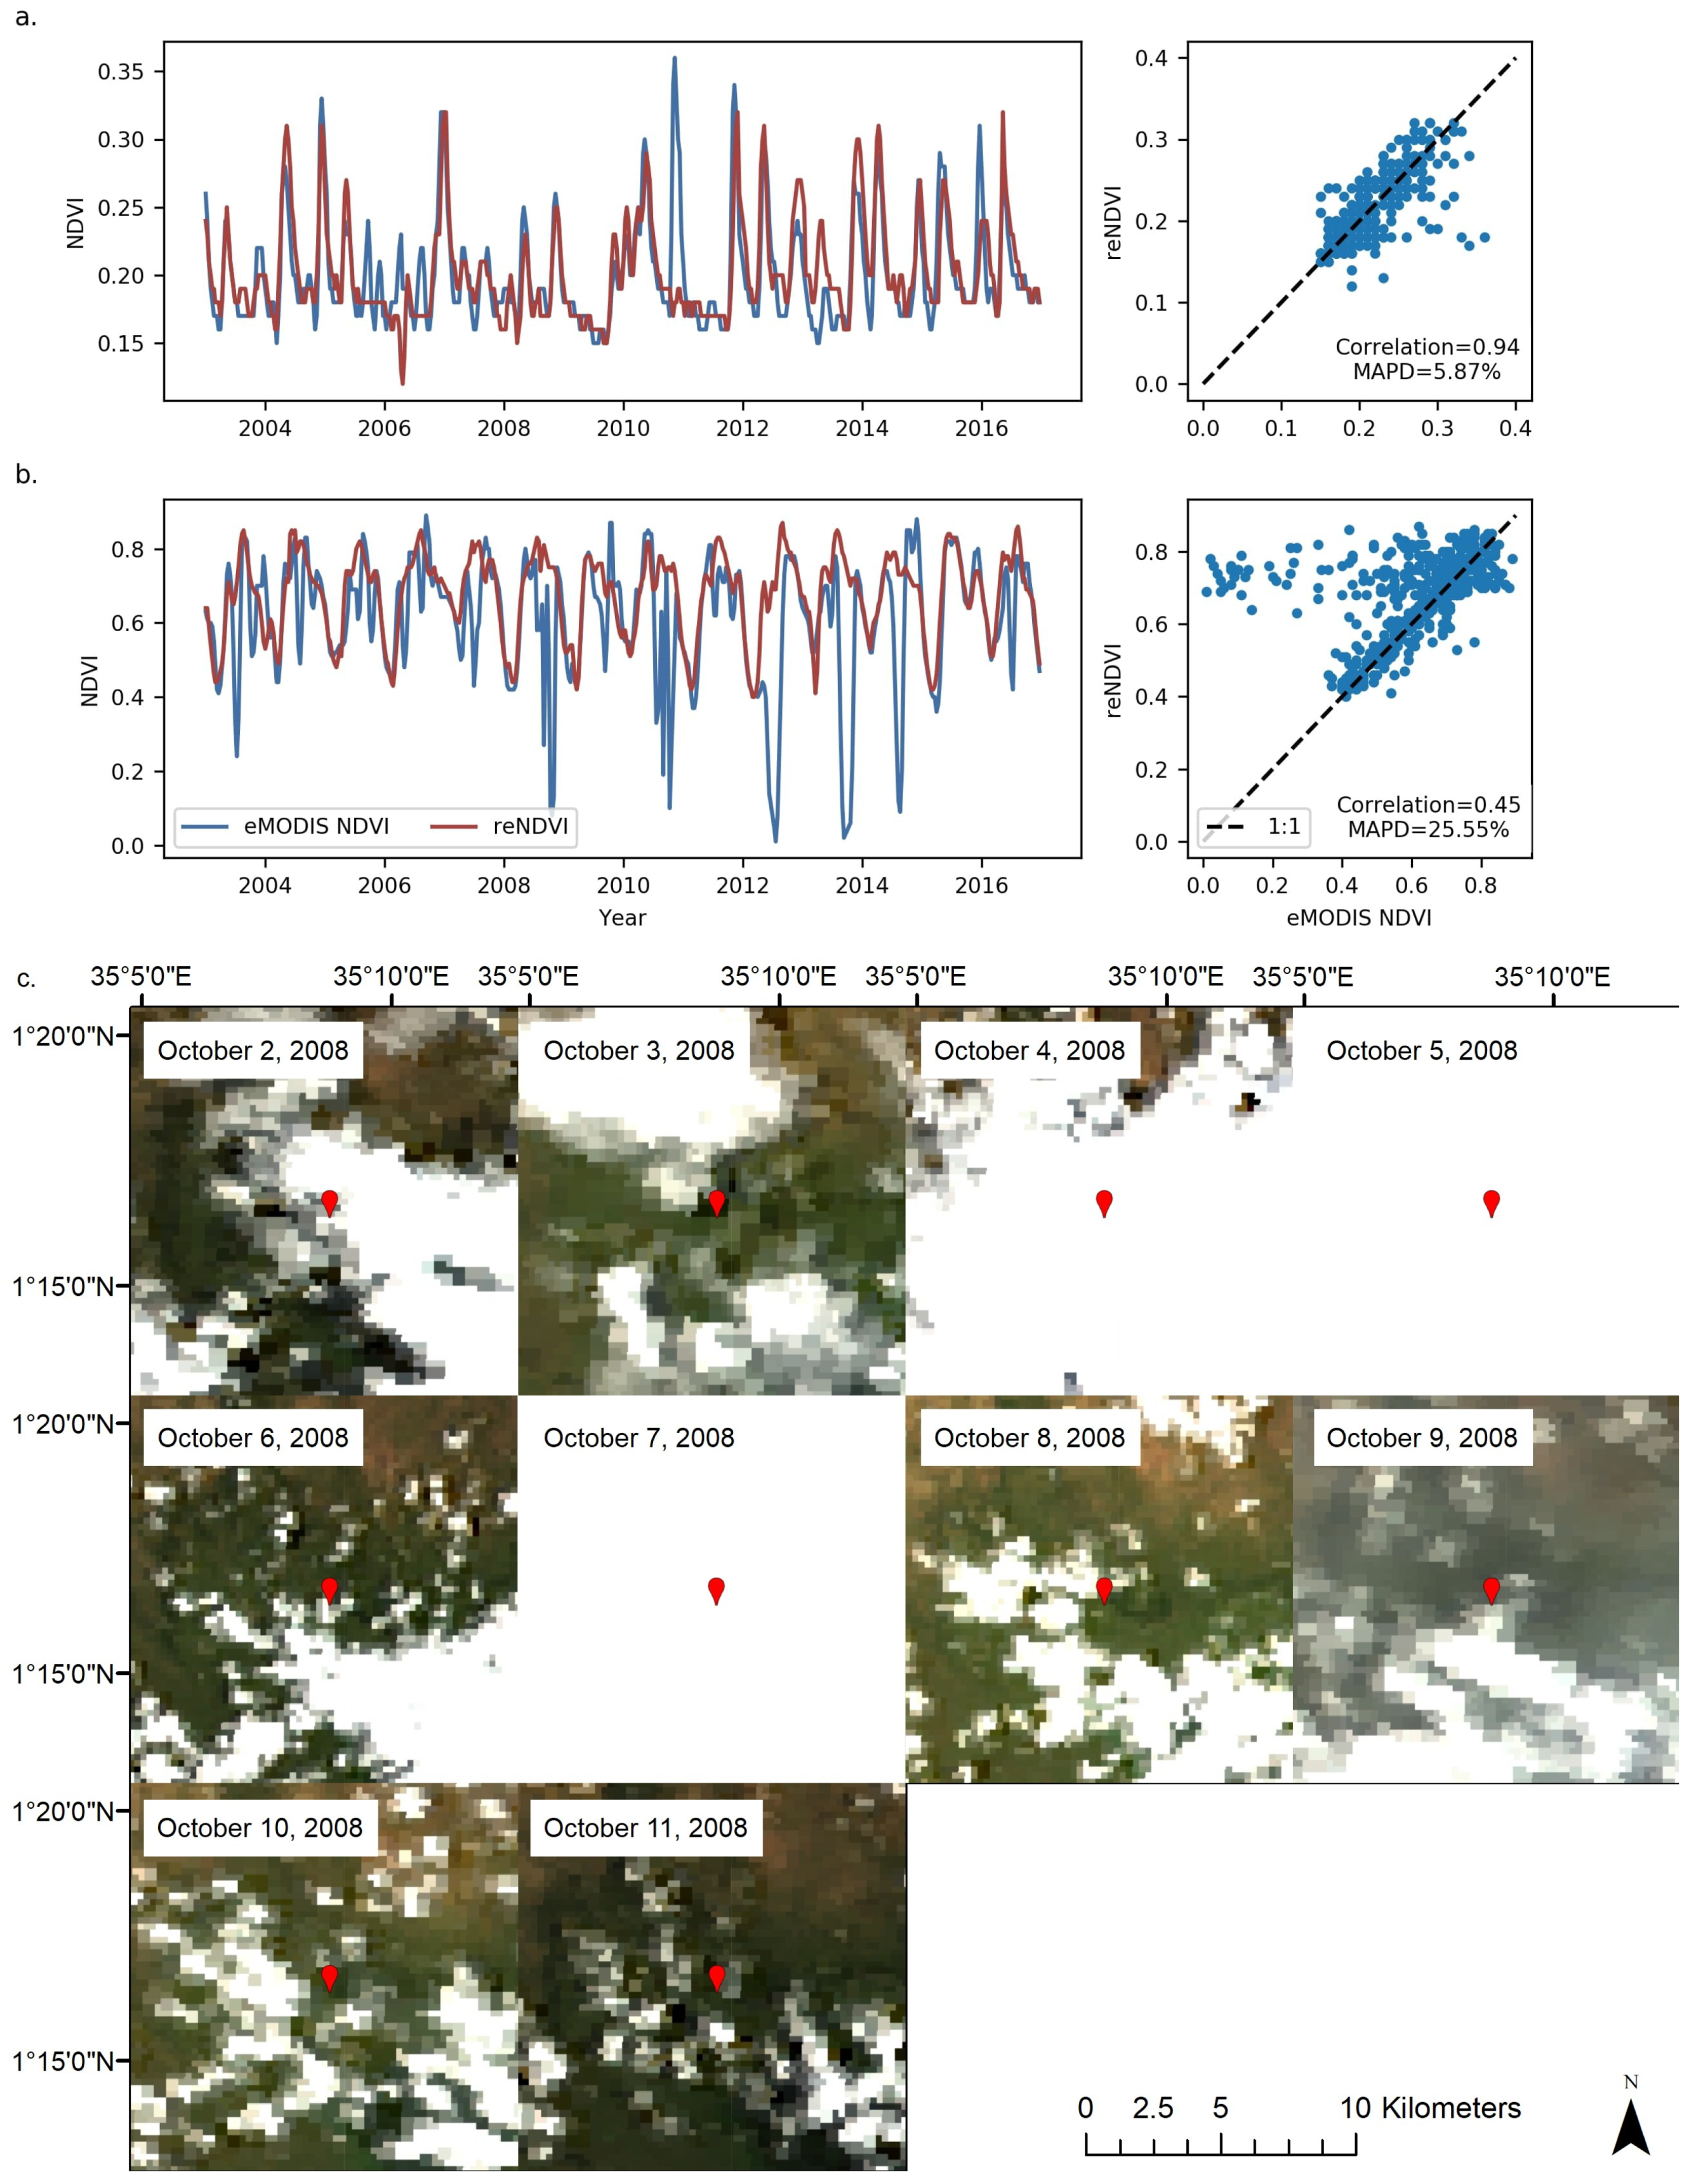
3.1. Pixel Level Analysis

One of the goals of this study is to evaluate the reNDVI product against the FEWS NET eMODIS NDVI to assess the relative similarity (or lack thereof) between the two NDVI products. Therefore, a detailed evaluation of the product was performed against the currently used FEWS NET NDVI product at the pixel level. Bias averaged 0.001 over the study area and was very close to zero everywhere except mountainous regions, where it exceeded 1.5. Similarly, MAPD averaged 16%, but exceeded 50% around mountains and areas of high elevation (shown in Figure 1). The correlation averaged 0.81 and was fairly high (>0.75) for most UAIs (Figure 3). Relatively lower (near zero) correlation occurred mainly around highlands.
Looking deeper into the process and results (final, as well as intermediate steps), a pixel from a mountainous region was selected to further examine and evaluate the product. Temporal analysis was performed to assess the quality of the final product. The raw NDVI was calculated using Terra MODIS daily surface reflectance data. It did not undergo any filtering, smoothing, or correction for clouds. Quality filtered NDVI used the MODIS quality band to filter out low quality data (like cloud cover) before calculating the NDVI. Despiked NDVI uses the quality filtered NDVI and removes any values that are extremely high or low compared to previous and following NDVI values in the time series.
The differences in NDVI values described earlier can be further investigated by looking at their behavior over time. Figure 4 showcases an area typical in the high mountainous region, comparing both the reNDVI and FEWS NET eMODIS data with the raw and quality filtered MODIS NDVI. It can be seen that the reNDVI agrees more with the quality filtered MODIS NDVI than FEWS NET eMODIS. There are dips in the raw NDVI that are absent in the quality filtered NDVI, particularly in pixels selected from mountains and the southwest region. This suggests that FEWS NET eMODIS could be more influenced by low quality pixels in these regions. It is noted that there is a problem with eMODIS NDVI V6, which uses the Aqua MODIS sensor, where high spikes due to a minimum blue band correction occur, leading to an observation with low red reflectance, which causes magnification of NDVI [46]. This error does not occur with reNDVI since it uses MODIS on the Terra satellite.
Figure 5a shows a sample point where there was high agreement between eMODIS and reNDVI (correlation = 0.94, MAPD = 5.87%). Though the differences in the products can be significant in certain areas, Figure 5b shows one of the sample points with lower agreement that was not in a highland (correlation = 0.45, MAPD = 25.55%). At this point, even though there were some larger than average differences in NDVI, the trends in NDVI were still similar except a few places where eMODIS had large dips in NDVI that were removed in the reNDVI process. One such dip is examined in Figure 5c. By visual examination of the true color MODIS images, it can be seen that every annotated pixel in the 10 day period was influenced by cloud, cloud shadow, or haze, which erroneously influenced the eMODIS NDVI.

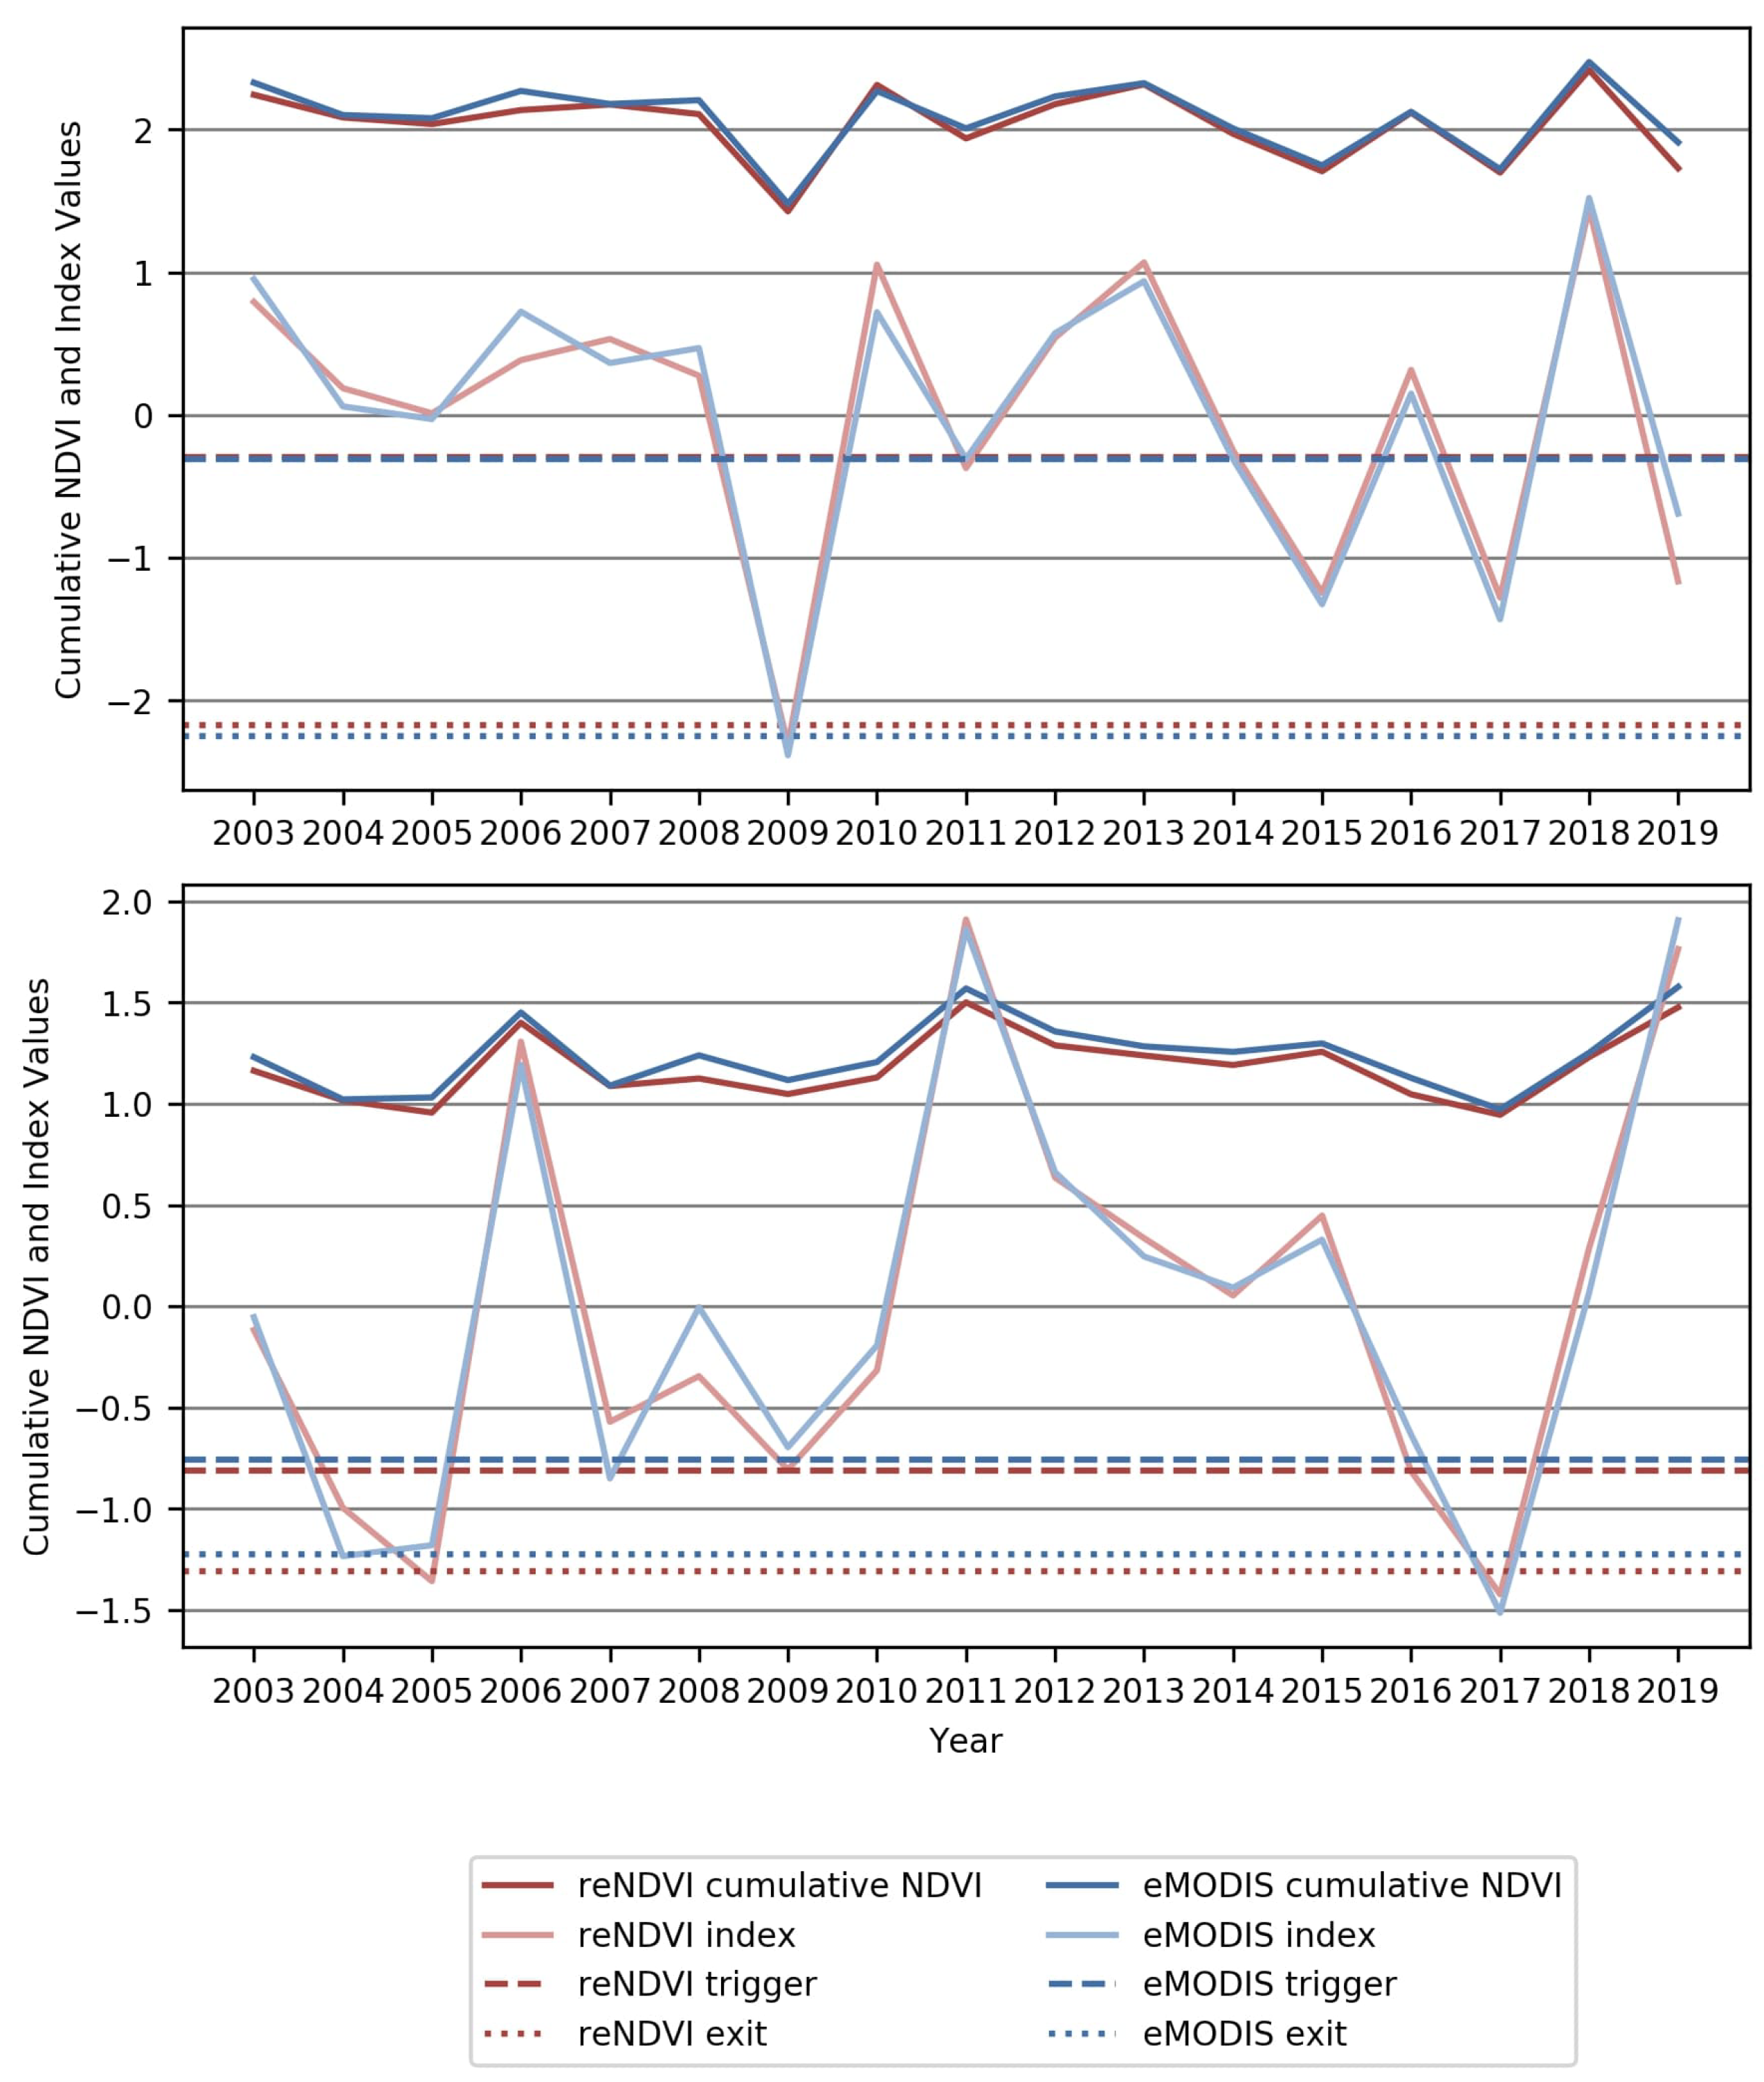
3.2. Monthly UAI Level Analysis

When comparing both reNDVI and FEWS NET eMODIS at the monthly mean and zonal aggregates, bias was very low (<0.08) for all UAIs. The MAPD of most UAIs ranged between 0 and 5%, with an overall average of 3.56%. Only 38 of the 172 UAIs exceeded 5% MAPD, and those that did were mostly in the north or southwest. The southwest UAIs generally have high cloud cover during rainy seasons, as shown in Figure 3d. North areas are generally dry and have low overall NDVI, which causes the same magnitude differences in NDVI to have relatively high MAPD values. The highest value was 11.8% in a UAI located in the southwest. Overall, the correlation (r) between the two products averaged 0.983 (all p values < 0.05), demonstrating the similarities of the two products. Correlation was below 0.95 for only seven out of the total 172 UAIs, with those below having high cloud cover and elevation, and were also among the smallest UAIs (average of 700 square km), which can affect the statistics since they contain relatively fewer samples. Similar to MAPD, the UAIs with the lowest correlation (0.64 and 0.68) were also located in the southwest (p = 0.03 and 0.01, respectively). Bias, MAPD, and correlation maps are shown in Figure 6.

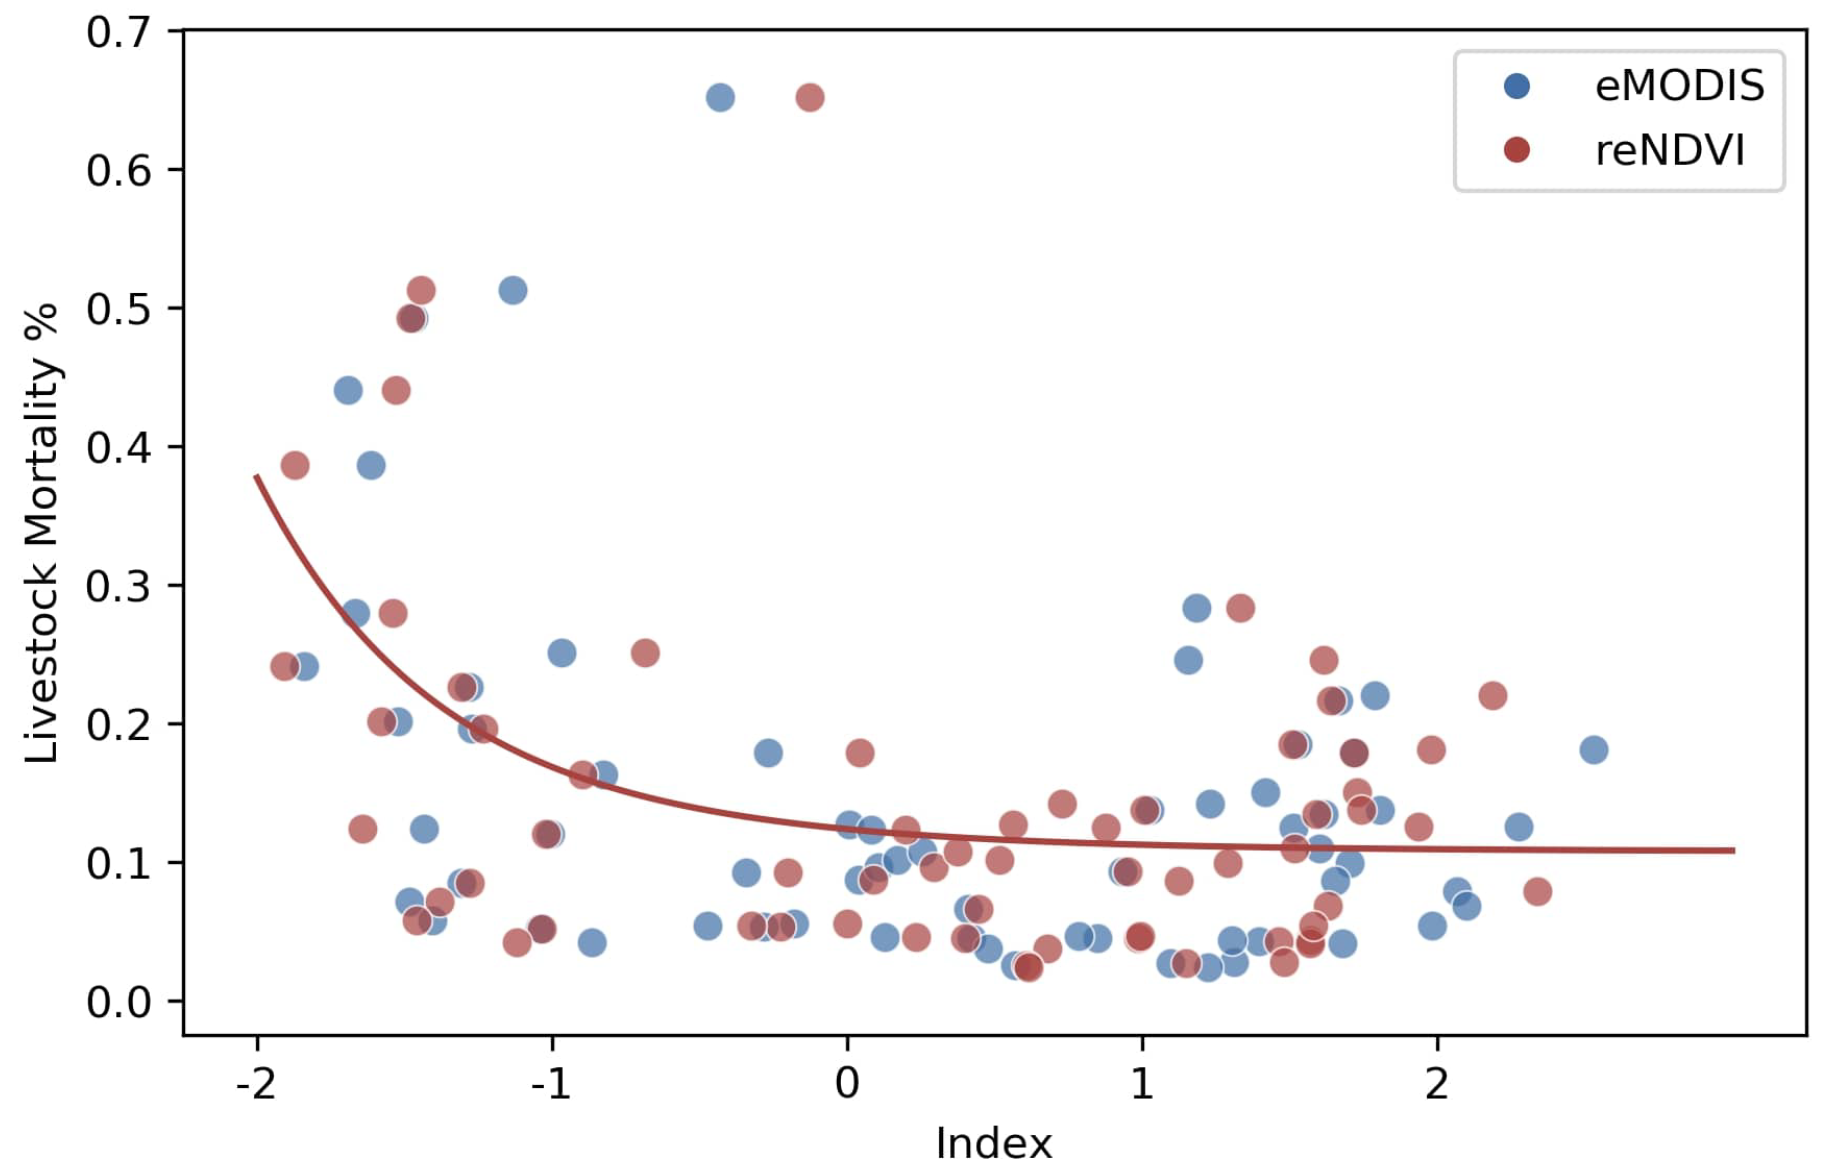
3.3. Payouts Comparison

Though both the FEWS NET eMODIS and reNDVI products were similar, even small differences can have an effect when an index is calculated in the extreme percentiles. When considering individual payouts that each product would trigger, there were UAIs where reNDVI indicated a payout trigger, but eMODIS did not, and vice versa. When both showed payouts, there were often differences in the percent of the total sum insured to be paid out, since even very small differences in index values can result in large differences in payouts. A UAI was randomly selected to demonstrate this. The selected UAI is located in the Kapchok ward of West Pokot county. The difference in eMODIS long rains’ trigger and exit values for the selected UAI was only 0.208. Because of this small difference, an absolute difference in eMODIS index values of only 0.02 would result in a payout difference of 10% for this UAI. A time series showing cumulative NDVI, index values, and thresholds for the selected UAI is shown in Figure 7, with corresponding calculated payouts in Table 1. Though there were few differences in the cumulative NDVI, the index amplified those differences.
As shown in Table 2, the short rains had better agreement in payouts. This may be because there is less time for differences in NDVI between products to accumulate in the three-month short rain period than the four-month long rains. Overall, the FEWS NET eMODIS product had an average of 25.55% of payout per UAI per year during the time period in question while reNDVI resulted in 25.39%. While there were differences in year-to-year payouts in UAIs, the overall percentages paid out were very similar between products.
When one product triggered a payment and the other did not, the payout that was triggered was less than 25% of the total sum insured 81.0% of the time. Depending on the UAI, this may mean that the payout was only triggered by a few hundredths of a point of the index value. The UAIs with larger payouts were mainly located in the northern region for long rains and in the southern region for short rains. The number of different payouts is shown in Figure 8.
For additional validation, the number of UAIs with calculated payouts for a given season were compared to known major drought years according to reports by the Kenya Food Security Steering Group (KFSSG). The worst long rain drought periods occurred in 2009 and 2011 [47,48], which corresponds well with the number of both eMODIS and reNDVI calculated payouts and which would have resulted in a full payout in 2009 for the UAI shown in Figure 7. The short rain payouts also correspond well with the worst short rain droughts in 2005, 2010, and 2016 [49,50,51]. The UAI in Figure 7 would have had a full payout for eMODIS or 90% of the full payout for reNDVI in 2016. KFSSG provides maps of the food security classification across Kenya. During the drought periods above, the payouts for both reNDVI and eMODIS correspond well spatially with areas of low food security.
For the pairwise comparisons, eMODIS and reNDVI showed nearly equal relationships with livestock mortality data. The correlation with eMODIS was slightly higher with a correlation of r = −0.446, while the reNDVI correlation coefficient was r = −0.440. These results are comparable to the results presented by Jensen et al. [52]. The correlations are expected to be negative in this case because a lower index represents drier conditions (Figure 9). For payout comparisons, the relationship was less straight forward and more difficult to compare, as, for the districts available, the majority of data points were either 0 or 100% payouts (no payout: 73%; and full payout: 14%), and few data were available in between. The overall trends were positive (as expected, higher payouts for higher mortality) with correlations of r = 0.478, r = 0.453 for eMODIS and reNDVI, respectively. The average mortality for a 0% payout was 11% and 30% for a 100% payout, for both datasets. Overall, reNDVI and eMODIS were very similar, suggesting that, on average, any differences would have a minimal effect on the total payouts received.

4. Discussion

The analyses show good comparability between reNDVI and FEWS NET eMODIS NDVI. An average correlation of 0.81, bias of 0.001, and MAPD of 16% at the dekadal pixel level demonstrate agreement between the two products. Regions of high elevation with more cloud cover during the year have less agreement between the products due to different data quality filtering techniques.
Most of the mountains are not currently within a UAI, as they are not typically areas where herds graze, but they should be taken into account if more UAIs are added in the future. High differences around mountains can be attributed to persistent cloud cover in these areas, since eMODIS and reNDVI filter clouds with different processes. Wilson and Jetz [43] performed a global remote sensing cloud frequency analysis for species distribution modeling and found that the mean annual cloud frequency varies from approximately 20% in the northern rangelands to 90% in the mountainous regions of Kenya with similar spatial trends (http://www.earthenv.org/cloud) as compared to Figure 3d. Figure 3 shows a strong relationship between low correlation values, large bias, and high MAPD with high average cloudiness. It has been shown in previous studies that errors of datasets increase when the number of satellite observations (without clouds) decreases; therefore, differences between datasets can be expected to increase as well [53]. In some of the UAIs in the southwest where cloud cover is high, it is more difficult to obtain reliable observations, so we would expect more errors in both datasets. The highest average yearly cloud cover of a UAI is 77%, and the highest cloud cover for a UAI during a rainy season is 81%. Without an independent data source to validate each NDVI product, it is difficult to identify the exact source of any disparities between the two.
For monthly mean NDVI at the UAI level, the comparisons improve. Other potential applications of reNDVI would likely also spatially or temporally aggregating the NDVI, which would minimize differences between the two datasets. Correlation over 0.95, MAPD under 5%, and bias between −0.01 and 0.01 for most UAIs at a monthly time frame indicate potential for use of reNDVI in index insurance. However, index-based insurance can be very sensitive to minor changes, as demonstrated by the differences in calculated payouts, and the validation of these products is difficult. Ideally, there would be data sources such as livestock mortality for the entire study area (e.g., in addition to [44]) for a separate analysis of both NDVI products. The livestock mortality data were available for nine UAIs over 2007–2015 in northern Kenya. This is not one of the areas with the highest cloud cover with the greatest differences between eMODIS and reNDVI. Without such data available for cloudy regions, we demonstrated that our changes made to the NDVI calculation process better remove the influence from clouds and should therefore provide a more realistic representation of vegetation conditions. This product potentially provides researchers and users with a global vegetation index dataset that uses transparent and reproducible methodologies. Here, we present the results with implications for index-based insurance in mind, but there are many other relevant applications to explore.

Assumptions and Limitations

In this analysis, FEWS NET eMODIS NDVI data were used in order to assess the comparability of reNDVI, as the FEWS NET product is currently widely used. Ideally, there would be more ground truth data in order to validate the remotely-sensed products with actual conditions on the ground, but such data are limited for the study area.
This research is motivated by index-based insurance, which in this case estimates a proxy of drought-induced damage and not actual damages. The difference between payouts and actual damages is known as basis risk [54]. If an index underestimates the real damages, the clients would have to shoulder the cost of those damages. Conversely, if a payout is triggered where drought-induced damages did not actually occur, the insurance program would have paid out in vain. These challenges are not specific to the analysis presented in this study and apply to all index insurance broadly, but they should be noted as an overall limitation. If loss estimates or damage assessments become available, further analysis could be done to estimate or calculate actual basis risk and ultimately inform any refinement to trigger and exit thresholds of these potential index insurance inputs.
Here, we primarily focused on the issue of payouts delayed by data latency, assuming that NDVI alone characterizes livestock mortality well enough to provide quality insurance. Additional parameters such as rainfall, soil moisture, or land surface temperature could be combined and assessed for their skill to better characterize livestock mortality [55]. The benefits of better satellite-based indices could be compounded with program design improvements. For example, a reliable satellite-based index could trigger field visits or audits to verify losses, thereby lowering basis risk [14].
Further, we should also highlight that the Earth Observation derived products compared in the paper and the majority of vegetation derived indices for index-based insurance use the MODIS sensors Terra, Aqua, or both. Though consistent and long-term datasets, the MODIS sensors are long past their operational life expectancy. These sensors are beginning to show degradation (especially Terra, launched in 1999), and it is imperative to begin the transition to new sensors like that of the Visible Infrared Imaging Radiometer Suite (VIIRS) or the European Space Agencies Sentinel-3.

5. Conclusions

Livestock insurance programs can be an effective strategy in building resilience in pastoral communities, and index-based insurance is an effective approach to close the gap in coverage by protecting against shared risk (lower cost), thus reducing the overall risk to disasters like drought. This is especially critical as research has shown that climate variability and extreme events are expected to increase. However, if droughts become more persistent, insurance may not be able to address the issue as premiums will become more expensive as damages occur at a high frequency.
This study developed a GEE-based NDVI product (reNDVI) and tested its use in an index-based insurance project. The development of reNDVI on a cloud-based platform provides easy access to the product and allows for direct calculation of payouts, potentially reducing the processing latency of the index calculation. Updated cloud filtering techniques cause some differences in the NDVI products and insurance payouts calculated from the NDVI, but overall, the products show good comparability in most regions with overall correlation of 0.81, MAPE of 16%, and bias of 0.001. Though payouts were triggered at different times or with different amounts for many UAIs, average payout amounts remain similar. Where livestock mortality data were available, reNDVI and eMODIS had similar (r = 0.453 and r = 0.478, respectively) correlations between mortality rate and payouts. Where there were differences, it is mostly in cloudy regions where the reNDVI cloud filter used allows for gaps so as to not fill in data until they are available. To calculate the actual latency reduced, the reNDVI and GEE workflow would need to be implemented by KLIP and compared to their current process. Though this has not been implemented by KLIP, we estimate that the reNDVI process can reduce the time a payout is calculated by one week. Earlier payouts can reduce livestock loss by allowing for the purchase of supplies to sustain the herd rather than compensating for losses. Additionally, in streamlining the smoothing and payout calculation in a cloud platform, this also brings the algorithms to the users themselves, building institutional capacity and allowing for improvements to the system to come from the end users. Considering the potential reduced latency and updated cloud filtering, the reNDVI product could be a suitable replacement for eMODIS in the Kenya Livestock Insurance Program.
As we continue to improve and expand reNDVI, in the future, we hope to expand the current analysis to include comparisons to the BOKU product used by NDMA and examine the use of machine learning to produce smoothed NDVI results at reduced latency using combination of convolution (space) and recurrent (time) neural network application and the addition of other remotely sensed inputs to improve the insurance product. Insurance programs relying on MODIS data from the Terra satellite face a near term challenge in finding a suitable replacement when the instrument ceases to collect data. If Aqua is considered, overpass time could bring new biases that would introduce differences in NDVI and calculated payouts. Future work will explore the use of different sensors such as the Visible Infrared Imaging Radiometer Suite (VIIRS) on board Suomi NPP for the creation of index-based products.

Supplementary Materials

Source code for the processing of the reNDVI dataset with examples is available at: https://github.com/servir/rendvi/. The reNDVI data product is publicly available on GEE as an Image Collection with the following asset ID: “projects/servir-e-sa/rangelands/reNDVI”. An example of accessing the reNDVI dataset and plotting a time series on GEE is available at: https://code.earthengine.google.com/?scriptPath=users%2Fkelmarkert%2Fdefault%3AAgriculture%2Frendvi_example.

Author Contributions

Conceptualization, E.C.A., L.N., R.K., A.L., E.R.A., and D.I.; methodology, K.N.M., R.K., and S.E.M.; software, K.N.M.; validation, S.E.M.; formal analysis, S.E.M. and K.N.M.; investigation, S.E.M. and K.N.M.; resources, R.G.; data curation, K.N.M.; writing, original draft preparation, S.E.M., E.C.A., K.N.M., W.L.E., and E.R.A.; writing, review and editing, S.E.M., E.C.A., K.N.M., W.L.E., E.R.A., A.L., and R.G.; visualization, S.E.M. and K.N.M.; supervision, E.C.A., R.G., and D.I.; project administration, E.C.A. and D.I.; funding acquisition, D.I. All authors read and agreed to the published version of the manuscript.

Funding

This research was funded by the joint U.S. Agency for International Development (USAID) and National Aeronautics and Space Administration (NASA) initiative SERVIR and particularly through the NASA Applied Sciences Capacity Building Program, NASA Cooperative Agreement NNM11AA01A. The Regional hub, RCMRD, provided technical support and in country coordination in the development, implementation. and validation of the methodologies. The Kenyan Government, through the Kenya Livestock insurance program, provided staff time and logistical support to the fulfillment of this work.

Acknowledgments

We would like to acknowledge the support of the stakeholders who attended the workshop and continue to be engaged with the service design and implementation that has supported this work. We would also like to recognize the University of Alabama in Huntsville (UAH) Earth System Science Center (ESSC) and the RCMRD and SERVIR teams for their support. Individuals affiliated with the ESSC of UAH are funded through the NASA Applied Sciences Capacity Building Program, NASA Cooperative Agreement NNM11AA01A. SERVIR is a joint venture between NASA and USAID that works to bolster the capacity of developing regions to leverage Earth observation data in solving pressing environmental challenges. Lastly, thanks to the reviewers and editors who provided valuable comments and suggestions that improved the paper.

Conflicts of Interest

The authors declare no conflict of interest. The funders had no role in the design of the study; in the collection, analyses, or interpretation of data; in the writing of the manuscript; nor in the decision to publish the results.

References

  1. Kabubo-Mariara, J. Climate change adaptation and livestock activity choices in Kenya: An economic analysis. In Natural Resources Forum; Wiley Online Library: Hoboken, NJ, USA, 2008; Volume 32, pp. 131–141. [Google Scholar] [CrossRef]
  2. Klisch, A.; Atzberger, C. Operational drought monitoring in Kenya using MODIS NDVI time series. Remote Sens. 2016, 8, 267. [Google Scholar] [CrossRef] [Green Version]
  3. Shisanya, C.; Recha, C.; Anyamba, A. Rainfall variability and its impact on normalized difference vegetation index in arid and semi-arid lands of Kenya. Int. J. Geosci. 2011, 2, 36. [Google Scholar] [CrossRef]
  4. Orindi, V.; Nyong, A.; Herrero, M.T. Pastoral Livelihood Adaptation to Drought and Institutional Interventions in Kenya; Technical Report; Human Development Report Office (HDRO), United Nations Development Programme: New York, NY, USA, 2007. [Google Scholar]
  5. Mugalavai, E.M.; Kipkorir, E.C.; Raes, D.; Rao, M.S. Analysis of rainfall onset, cessation and length of growing season for western Kenya. Agric. For. Meteorol. 2008, 148, 1123–1135. [Google Scholar] [CrossRef]
  6. Nicholson, S.E. A review of climate dynamics and climate variability in Eastern Africa. In The Limnology, Climatology and Paleoclimatology of the East African Lakes; Gordon and Breach Amsterdam: London, UK, 1996; pp. 25–56. [Google Scholar]
  7. Ministry of Agriculture, Livestock, Fisheries and Irrigation. Executive Seminar on Index Based Livestock Insurance; Technical Report; Ministry of Agriculture, Livestock, Fisheries and Irrigation: Nairobi, Kenya, 2018. [Google Scholar]
  8. Bryan, E.; Ringler, C.; Okoba, B.; Koo, J.; Herrero, M.; Silvestri, S. Can agriculture support climate change adaptation, greenhouse gas mitigation and rural livelihoods? Insights from Kenya. Clim. Chang. 2013, 118, 151–165. [Google Scholar] [CrossRef] [Green Version]
  9. Howden, S.M.; Soussana, J.F.; Tubiello, F.N.; Chhetri, N.; Dunlop, M.; Meinke, H. Adapting agriculture to climate change. Proc. Natl. Acad. Sci. USA 2007, 104, 19691–19696. [Google Scholar] [CrossRef] [Green Version]
  10. Schlenker, W.; Lobell, D.B. Robust negative impacts of climate change on African agriculture. Environ. Res. Lett. 2010, 5, 014010. [Google Scholar] [CrossRef]
  11. Bryan, E.; Ringler, C.; Okoba, B.; Roncoli, C.; Silvestri, S.; Herrero, M. Adapting agriculture to climate change in Kenya: Household strategies and determinants. J. Environ. Manag. 2013, 114, 26–35. [Google Scholar] [CrossRef]
  12. Bastagli, F.; Harman, L. The Role of Index-Based Triggers in Social Protection Shock Response; Overseas Development Institute: London, UK, 2015. [Google Scholar]
  13. NDMA. What We Do. 2020. Available online: https://www.ndma.go.ke/index.php/features/typography (accessed on 20 July 2020).
  14. Carter, M.; de Janvry, A.; Sadoulet, E.; Sarris, A. Index insurance for developing country agriculture: A reassessment. Annu. Rev. Resour. Econ. 2017, 9, 421–438. [Google Scholar] [CrossRef]
  15. UNISDR. Risk Transfer and Insurance for Resilience; UNISDR: Geneva, Switzerland, 2017. [Google Scholar]
  16. Clarke, D.J.; Hill, R.V. Cost-Benefit Analysis of the African Risk Capacity Facility; Intl Food Policy Res Inst: Washington, DC, USA, 2013; Volume 1292. [Google Scholar]
  17. Tadesse, M.A.; Shiferaw, B.A.; Erenstein, O. Weather index insurance for managing drought risk in smallholder agriculture: Lessons and policy implications for sub-Saharan Africa. Agric. Food Econ. 2015, 3, 26. [Google Scholar] [CrossRef] [Green Version]
  18. Alderman, H.; Haque, T. Insurance against Covariate Shocks: The Role of Index-Based Insurance in Social Protection in Low-Income Countries of Africa; The World Bank: Washington, DC, USA, 2007. [Google Scholar] [CrossRef] [Green Version]
  19. Suarez, P.; Linnerooth-Bayer, J. Micro-insurance for local adaptation. Wiley Interdiscip. Rev. Clim. Chang. 2010, 1, 271–278. [Google Scholar] [CrossRef]
  20. De Leeuw, J.; Vrieling, A.; Shee, A.; Atzberger, C.; Hadgu, K.M.; Biradar, C.M.; Keah, H.; Turvey, C. The potential and uptake of remote sensing in insurance: A review. Remote Sens. 2014, 6, 10888–10912. [Google Scholar] [CrossRef] [Green Version]
  21. Group, S.R. Impact Study Confirms the Solidity of the Kenya Livestock Insurance Programme. 2018. Available online: https://www.swissre.com/our-business/public-sector-solutions/thought-leadership/solidity-of-kenya-livestock-insurance-programme.html (accessed on 8 May 2019).
  22. Vrieling, A.; Meroni, M.; Shee, A.; Mude, A.G.; Woodard, J.; de Bie, C.K.; Rembold, F. Historical extension of operational NDVI products for livestock insurance in Kenya. Int. J. Appl. Earth Obs. Geoinf. 2014, 28, 238–251. [Google Scholar] [CrossRef]
  23. USGS. eMODIS NDVI C6. 2017. Available online: https://earlywarning.usgs.gov/fews/product/448 (accessed on 20 January 2019).
  24. Swets, D.; Reed, B.C.; Rowland, J.; Marko, S. A weighted least-squares approach to temporal NDVI smoothing. In Proceedings of the From Image to Information: 1999 ASPRS Annual Conference, Portland, OR, USA, 17–21 May 1999. [Google Scholar]
  25. Adede, C.; Oboko, R.; Wagacha, P.W.; Atzberger, C. A mixed model approach to vegetation condition prediction using artificial neural networks (ANN): Case of Kenya’s Operational Drought Monitoring. Remote Sens. 2019, 11, 1099. [Google Scholar] [CrossRef] [Green Version]
  26. Adede, C.; Oboko, R.; Wagacha, P.W.; Atzberger, C. Model Ensembles of Artificial Neural Networks and Support Vector Regression for Improved Accuracy in the Prediction of Vegetation Conditions and Droughts in Four Northern Kenya Counties. ISPRS Int. J. Geo-Inf. 2019, 8, 562. [Google Scholar] [CrossRef] [Green Version]
  27. Barrett, A.B.; Duivenvoorden, S.; Salakpi, E.E.; Muthoka, J.M.; Mwangi, J.; Oliver, S.; Rowhani, P. Forecasting vegetation condition for drought early warning systems in pastoral communities in Kenya. Remote Sens. Environ. 2020, 248, 111886. [Google Scholar] [CrossRef]
  28. Park, S.; Seo, E.; Kang, D.; Im, J.; Lee, M.I. Prediction of drought on pentad scale using remote sensing data and MJO index through random forest over East Asia. Remote Sens. 2018, 10, 1811. [Google Scholar] [CrossRef] [Green Version]
  29. Gorelick, N.; Hancher, M.; Dixon, M.; Ilyushchenko, S.; Thau, D.; Moore, R. Google Earth Engine: Planetary-scale geospatial analysis for everyone. Remote Sens. Environ. 2017, 202, 18–27. [Google Scholar] [CrossRef]
  30. Farr, T.G.; Rosen, P.A.; Caro, E.; Crippen, R.; Duren, R.; Hensley, S.; Kobrick, M.; Paller, M.; Rodriguez, E.; Roth, L.; et al. The shuttle radar topography mission. Rev. Geophys. 2007, 45. [Google Scholar] [CrossRef] [Green Version]
  31. Vermote, E.; Wolfe, R. MOD09GQ MODIS/Terra Surface Reflectance Daily L2G Global 250m SIN Grid V006 [Data set]. 2015. Available online: https://lpdaac.usgs.gov/products/mod09gqv006/ (accessed on 20 January 2019).
  32. Poortinga, A.; Clinton, N.; Saah, D.; Cutter, P.; Chishtie, F.; Markert, K.N.; Anderson, E.R.; Troy, A.; Fenn, M.; Tran, L.H.; et al. An Operational Before-After-Control-Impact (BACI) Designed Platform for Vegetation Monitoring at Planetary Scale. Remote Sens. 2018, 10, 760. [Google Scholar] [CrossRef] [Green Version]
  33. Vermote, E.; Wolfe, R. MOD09GA MODIS/Terra Surface Reflectance Daily L2G Global 1km and 500m SIN Grid V006 [Data Set]. 2015. Available online: https://lpdaac.usgs.gov/products/mod09gav006/ (accessed on 20 January 2019).
  34. Frey, R.A.; Ackerman, S.A.; Liu, Y.; Strabala, K.I.; Zhang, H.; Key, J.R.; Wang, X. Cloud Detection with MODIS. Part I: Improvements in the MODIS Cloud Mask for Collection 5. J. Atmos. Ocean. Technol. 2008, 25, 1057–1072. [Google Scholar] [CrossRef]
  35. Vermote, E.F.; Kotchenova, S. Atmospheric correction for the monitoring of land surfaces. J. Geophys. Res. Atmos. 2008, 113. [Google Scholar] [CrossRef]
  36. Hilker, T.; Lyapustin, A.I.; Hall, F.G.; Myneni, R.; Knyazikhin, Y.; Wang, Y.; Tucker, C.J.; Sellers, P.J. On the measurability of change in Amazon vegetation from MODIS. Remote Sens. Environ. 2015, 166, 233–242. [Google Scholar] [CrossRef]
  37. Hilker, T.; Lyapustin, A.I.; Tucker, C.J.; Sellers, P.J.; Hall, F.G.; Wang, Y. Remote sensing of tropical ecosystems: Atmospheric correction and cloud masking matter. Remote Sens. Environ. 2012, 127, 370–384. [Google Scholar] [CrossRef] [Green Version]
  38. Robinson, N.P.; Allred, B.W.; Jones, M.O.; Moreno, A.; Kimball, J.S.; Naugle, D.E.; Erickson, T.A.; Richardson, A.D. A Dynamic Landsat Derived Normalized Difference Vegetation Index (NDVI) Product for the Conterminous United States. Remote Sens. 2017, 9, 863. [Google Scholar] [CrossRef] [Green Version]
  39. Funk, C.C.; Brown, M.E. Intra-seasonal NDVI change projections in semi-arid Africa. Remote Sens. Environ. 2006, 101, 249–256. [Google Scholar] [CrossRef] [Green Version]
  40. Senay, G.; Velpuri, N.; Bohms, S.; Budde, M.; Young, C.; Rowland, J.; Verdin, J. Chapter 9-Drought Monitoring and Assessment: Remote Sensing and Modeling Approaches for the Famine Early Warning Systems Network. In Hydro-Meteorological Hazards, Risks and Disasters; Shroder, J.F., Paron, P., Baldassarre, G.D., Eds.; Elsevier: Boston, MA, USA, 2015; pp. 233–262. [Google Scholar] [CrossRef]
  41. Jenkerson, C.B.; Maiersperger, T.; Schmidt, G. eMODIS: A User-Friendly DATA Source; Technical Report; US Geological Survey: Reston, VA, USA, 2010. [Google Scholar]
  42. Wilson, B.T.; Knight, J.F.; McRoberts, R.E. Harmonic regression of Landsat time series for modeling attributes from national forest inventory data. ISPRS J. Photogramm. Remote Sens. 2018, 137, 29–46. [Google Scholar] [CrossRef]
  43. Wilson, A.M.; Jetz, W. Remotely Sensed High-Resolution Global Cloud Dynamics for Predicting Ecosystem and Biodiversity Distributions. PLoS Biol. 2016, 14, 1–20. [Google Scholar] [CrossRef]
  44. Ikegami, M.; Sheahan, M. Index Based Livestock Insurance (IBLI) Marsabit Household Survey Codebook; International Livestock Research Institute: Nairobi, Kenya, 2017. [Google Scholar]
  45. Chantarat, S.; Mude, A.G.; Barrett, C.B.; Carter, M.R. Designing index-based livestock insurance for managing asset risk in northern Kenya. J. Risk Insur. 2013, 80, 205–237. [Google Scholar] [CrossRef] [Green Version]
  46. USGS. USGS EROS Archive-Vegetation Monitoring—EROS Moderate Resolution Imaging Spectroradiometer (eMODIS). Available online: https://www.usgs.gov/centers/eros/science/usgs-eros-archive-vegetation-monitoring-eros-moderate-resolution-imaging?qt-science_center_objects=0#qt-science_center_objects (accessed on 25 April 2019).
  47. KFSSG. The 2009 Long Rains Season Assessment Report; Technical Report; Kenya Food Security Steering Group: Nairobi, Kenya, 2009; Available online: http://www.ipcinfo.org/fileadmin/user_upload/ipcinfo/docs/IPC_KEN_Long_Rain_Assess_07_09_Report.pdf (accessed on 9 May 2019).
  48. KFSSG. The 2011 Long Rains Season Assessment Report; Technical Report; Kenya Food Security Steering Group: Nairobi, Kenya, 2011; Available online: https://reliefweb.int/sites/reliefweb.int/files/resources/Full_Report_1607.pdf (accessed on 9 May 2019).
  49. KFSSG. Kenya Short Rains Assessment Report 2005; Technical Report; Kenya Food Security Steering Group: Nairobi, Kenya, 2006; Available online: https://documents.wfp.org/stellent/groups/public/documents/ena/wfp087348.pdf?iframe (accessed on 9 May 2019).
  50. KFSSG. The 2010 Short Rains Season Assessment Report; Technical Report; Kenya Food Security Steering Group: Nairobi, Kenya, 2011; Available online: https://documents.wfp.org/stellent/groups/public/documents/ena/wfp241326.pdf?iframe (accessed on 9 May 2019).
  51. KFSSG. The 2016 Short Rains Season Assessment Report; Technical Report; Kenya Food Security Steering Group: Nairobi, Kenya, 2017; Available online: https://docs.wfp.org/api/documents/WFP-0000069365/download/?_ga=2.47988391.1297773027.1600313069-361735401.1587435578 (accessed on 9 May 2019).
  52. Jensen, N.; Stoeffler, Q.; Fava, F.; Vrieling, A.; Atzberger, C.; Meroni, M.; Mude, A.; Carter, M. Does the design matter? Comparing satellite-based indices for insuring pastoralists against drought. Ecol. Econ. 2019, 162, 59–73. [Google Scholar] [CrossRef]
  53. Meroni, M.; Fasbender, D.; Rembold, F.; Atzberger, C.; Klisch, A. Near real-time vegetation anomaly detection with MODIS NDVI: Timeliness vs. accuracy and effect of anomaly computation options. Remote Sens. Environ. 2019, 221, 508–521. [Google Scholar] [CrossRef]
  54. Jensen, N.D.; Mude, A.G.; Barrett, C.B. How basis risk and spatiotemporal adverse selection influence demand for index insurance: Evidence from northern Kenya. Food Policy 2018, 74, 172–198. [Google Scholar] [CrossRef] [Green Version]
  55. Enenkel, M.; Steiner, C.; Mistelbauer, T.; Dorigo, W.; Wagner, W.; See, L.; Atzberger, C.; Schneider, S.; Rogenhofer, E. A combined satellite-derived drought indicator to support humanitarian aid organizations. Remote Sens. 2016, 8, 340. [Google Scholar] [CrossRef] [Green Version]
Figure 1. Study area showing the elevation from the Shuttle Radar Topography Mission [30] and Unit Areas of Insurance.
Remotesensing 12 03031 g001
Figure 2. Flowchart schematic for creating the rapid enhanced NDVI (reNDVI) dataset. An overarching flowchart is provided on the left, and specific information on component processing is provided on the right.
Remotesensing 12 03031 g002
Figure 3. Bias (a), mean absolute percent difference (b), and correlation between reNDVI and Famine Early Warning Systems Network (FEWS NET) eMODIS NDVI (c) for 2003–2019 compared to average cloud cover (d).
Remotesensing 12 03031 g003
Figure 4. Raw NDVI compared to quality filtered and despiked NDVI (top) and despiked compared to eMODIS NDVI and reNDVI (bottom) for a mountain pixel with coordinates [37.3030,−0.1613].
Remotesensing 12 03031 g004
Figure 5. Time series and scatterplot at two locations with (a) high agreement [37.567, 1.946] and (b) low agreement [35.1467, 1.2657]. (c) shows that the dip in eMODIS NDVI was due to the influence of persistent cloud cover at one point on the time series shown in (b).
Remotesensing 12 03031 g005
Figure 6. Bias (a), MAPD (b), and correlation (c) of mean monthly NDVI at the Unit Area of Insurance (UAI) level.
Remotesensing 12 03031 g006
Figure 7. Cumulative NDVI (∑NDVI) and index values (Z∑NDVI) compared to payout thresholds for the one selected example UAI for long rains (top) and short rains (bottom).
Remotesensing 12 03031 g007
Figure 8. Number of times one product triggered a payout and the other did not for long rains (right) and short rains (left) from 2003–2019.
Remotesensing 12 03031 g008
Figure 9. eMODIS and reNDVI index values compared to average livestock mortality percentage for 2010–2015.
Remotesensing 12 03031 g009
Table 1. Calculated hypothetical percent payouts for the selected UAI (Kapchok ward in West Pokot county) in Figure 7. For this UAI, eMODIS and reNDVI triggered all payouts at the same time, but there were differences in payout percentages.
YearLong Rains’ eMODISLong Rains’ reNDVIShort Rains’ eMODISShort Rains’ reNDVI
20030073.57100
20040000
20050000
20060000
20070000
20080000
200910010033.3267.86
20100000
201155.865.4000
20120000
20130000
201410.4626.5200
20150000
20160010090.22
201710067.7600
20180041.122.39
20191009.1800
Table 2. Number of payouts triggered at different times for all UAIs.
Number of Payouts Triggered DifferentlyLong Rains, All UAIsShort Rains, All UAIsLong Rains, Top 20% Cloud CoverShort Rains, Top 20% Cloud Cover
048.3%59.3%35.2%52.9%
15.2%12.2%2.9%26.5%
236.0%24.4%38.2%14.7%
38.1%2.3%11.8%0%
41.2%0.6%5.9%2.9%
51.2%0.6%2.9%0%
60%0%0%0%
70%0%0%0%
80%0.6%0%2.9%

